1. Introduction
Decanter centrifuges have been widely applied in industries such as chemical engineering, pharmaceuticals, food, and water treatment. They have the advantages of high security, high reliability, continuous operation, low labor cost, and a small footprint. A mixture of density differences in phases such as liquid–solid or liquid–liquid, can be handled by centrifugal sedimentation [
1]. Due to their unreasonable structural design, decanter centrifuges often have problems such as low separation efficiency and high power consumption during service [
2]. Therefore, it is of great significance to carry out the separation performance prediction and structural optimization design of the decanter centrifuge for its efficient and economical operation.
It is difficult to measure the internal flow field of decanter centrifuges accurately, owing to their high-speed conditions [
3]. However, the flow field characteristics can be obtained with the rapid development of the computational fluid dynamics (CFD) simulation. Based on the Euler multiphase flow model, renormalization group (RNG) turbulence model, and multiple reference system (MRF) approach, the pressure and velocity distributions were obtained [
4,
5]. The results show that the static pressure gradually increases along the radial direction, reaching the maximum at the inner wall of the bowl, and it has a decreasing trend along the axial direction. Dong et al. [
6] analyzed the application of seven typical turbulence models for the simulation of decanter centrifuges, and their results show that the RNG
k-
ε model is in good agreement with the literature value. Zhu et al. [
7] explored the flow field in a novel three-phase decanter centrifuge with a vertical board and annular separation plate. The crystal particle size distribution in a salt precipitation flow field was investigated by using a coupled CFD-PBM approach [
8,
9]. Romaní et al. [
10] analyzed the multiphase flow of water, air, and particles in a cylindrical solid bowl centrifuge by using a coupled CFD-DEM approach. They found that the sediment built at a higher angular velocity and normal pressure acting on the bowl wall is flatter and extends along the wall rather than in the radial direction. Menesklou et al. [
11] presented a physically based computational model to predict the dynamic behavior of decanter centrifuges. Their method considers settling behavior, cake consolidation, and sediment transport by means of material functions. Gleiss et al. [
12] established a mathematical model of the separation process in countercurrent decanter centrifuges, which takes into account the influence of the sediment build-up and the flow pattern. Hammerich et al. [
13] proposed a method to simulate the equilibrium and transient consolidation of particulate networks in one dimension. It is based on the Eulerian approach for approximation of the volume fraction of the dispersed phase, without solving any additional partial differential equations.
The results from some numerical simulation studies show that suspension properties, structural parameters, and operating conditions have impacts on the flow field of decanter centrifuges. Zhu et al. [
14] proved that the separation efficiency improved as the feed content increased. Yuan et al. [
15] demonstrated that a longer conical section can improve the cake solid content, while a longer cylindrical section and larger pool depth can improve centrate clarification. Furthermore, the effects of the
L/
D (length to diameter) ratio, viscosity, and particle diameter were analyzed by applying the RSM model and DPM model [
2,
16]. These studies of decanter centrifuges focus on the pressure and velocity field, as well as the effects of the
L/
D ratio, bowl speed, solid particle size, etc. However, there are other structural parameters (window structure, bowl–conveyor gap, etc.) that also have impacts on the separation performance but are rarely mentioned in the current research.
Although the above studies have studied the structure and separation performance of the decanter centrifuge, the studies all take the separation performance as a single objective to optimize the decanter centrifuge structure, ignoring the impact of structural changes on the power consumption of the decanter centrifuge. This kind of single-parameter study makes it difficult to truly realize scheme optimization for decanter centrifuges. In fact, better separation results may lead to higher power consumption, which means that separation performance and centrifuge power consumption (cost) need to be considered at the same time. Thus, multi-objective optimization for decanter centrifuges is indispensable.
In this paper, the flow field of decanter centrifuges as well as the impacts of window structure and bowl–conveyor gap on the separation performance are investigated by applying the CFD method, coupled with the RNG turbulence model and MRF model. Based on the simulation results, a genetic algorithm-based method for optimizing the comprehensive performance of decanter centrifuges is proposed, and regression models of cake solid content and specific power are obtained by orthogonal numerical test results, which are treated as the objective function for optimization. After systematic structural and parameter optimization, a decanter centrifuge structure with higher separation performance and optimized specific power is finally obtained. The results and the optimization method proposed in this paper can provide a technical basis for the design of an efficient and economical decanter centrifuge.
2. Numerical Methods
2.1. Model Description
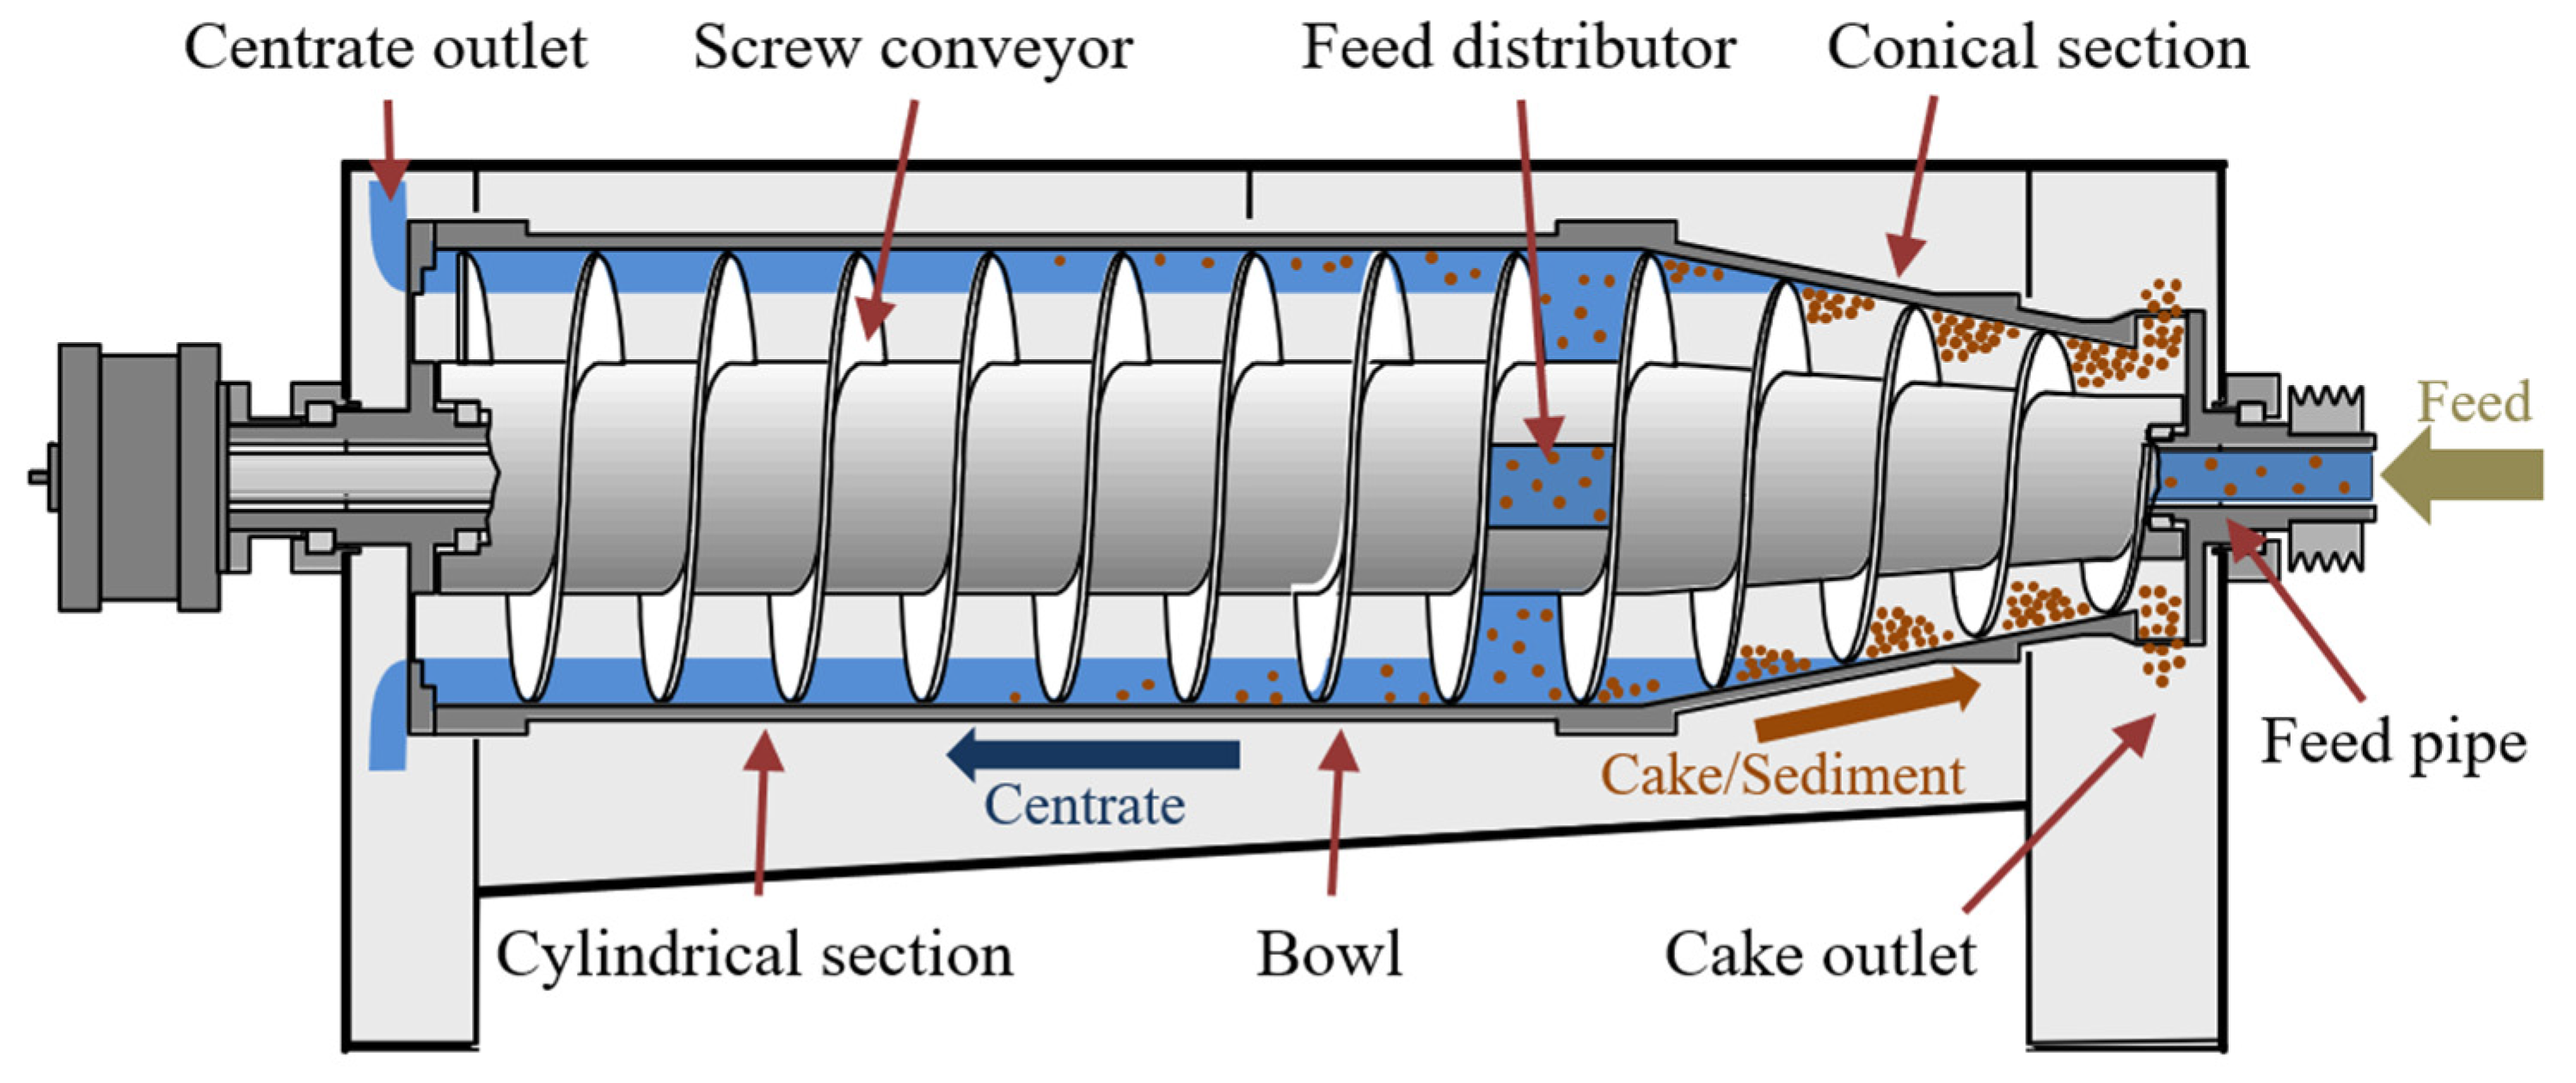
A decanter centrifuge is mainly composed of a bowl, screw conveyor, feed tube, feed accelerator, weir plate, etc. As shown in
Figure 1, the suspension flows through the feed tube and enters the rotary bowl after being accelerated by the feed accelerator. The screw conveyor pushes the cake (sediment) to the outlet at the end of the conical section; the centrate flows to the opposite end of the bowl. Thus, the suspension can be separated. In this paper, the fluid domain model for simulation is built based on a company’s LW520 decanter centrifuge. The structural parameters are shown in
Table 1, and a few notes in terms of model building are as follows.
Assume that the space inside the bowl is filled with suspension. The air inside the bowl may have an impact on the flow field. However, the relative deviations of the cake solid content and solid recovery are acceptable, which has been proven by the results of simulations and experiments [
14]. A rotating domain consists of the bowl, conveyor shaft, and feed accelerator, while the feed tube can be considered a stationary domain, taking into account the pre-acceleration impact.
A geometric model is set up by the 3D modeling software Creo. First, the structural parts, such as bowl, screw conveyor, and feed tube, are modeled. Then, the fluid domain is obtained by Boolean operation.
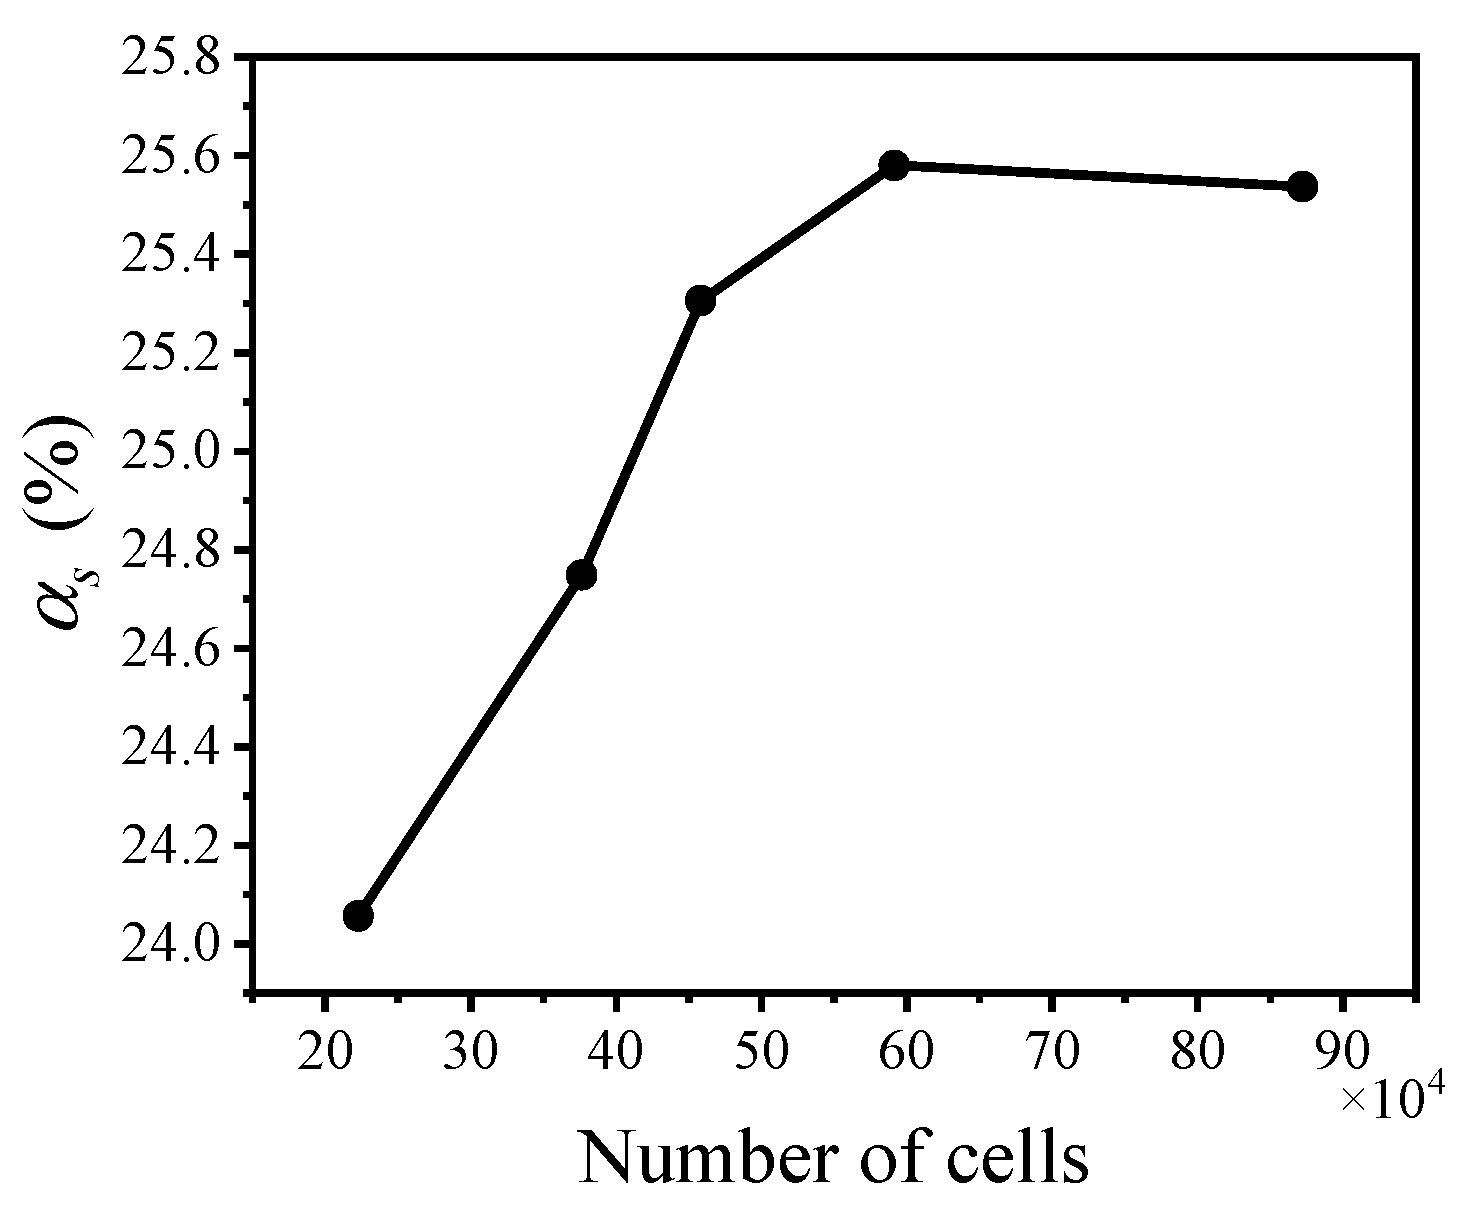
Ansys/ICEM and the multi-area meshing method are used to disperse the fluid domain. The region near the walls of the bowl, screw conveyor, and shaft are refined according to the requirement from the turbulence model. The grid independence test result is shown in
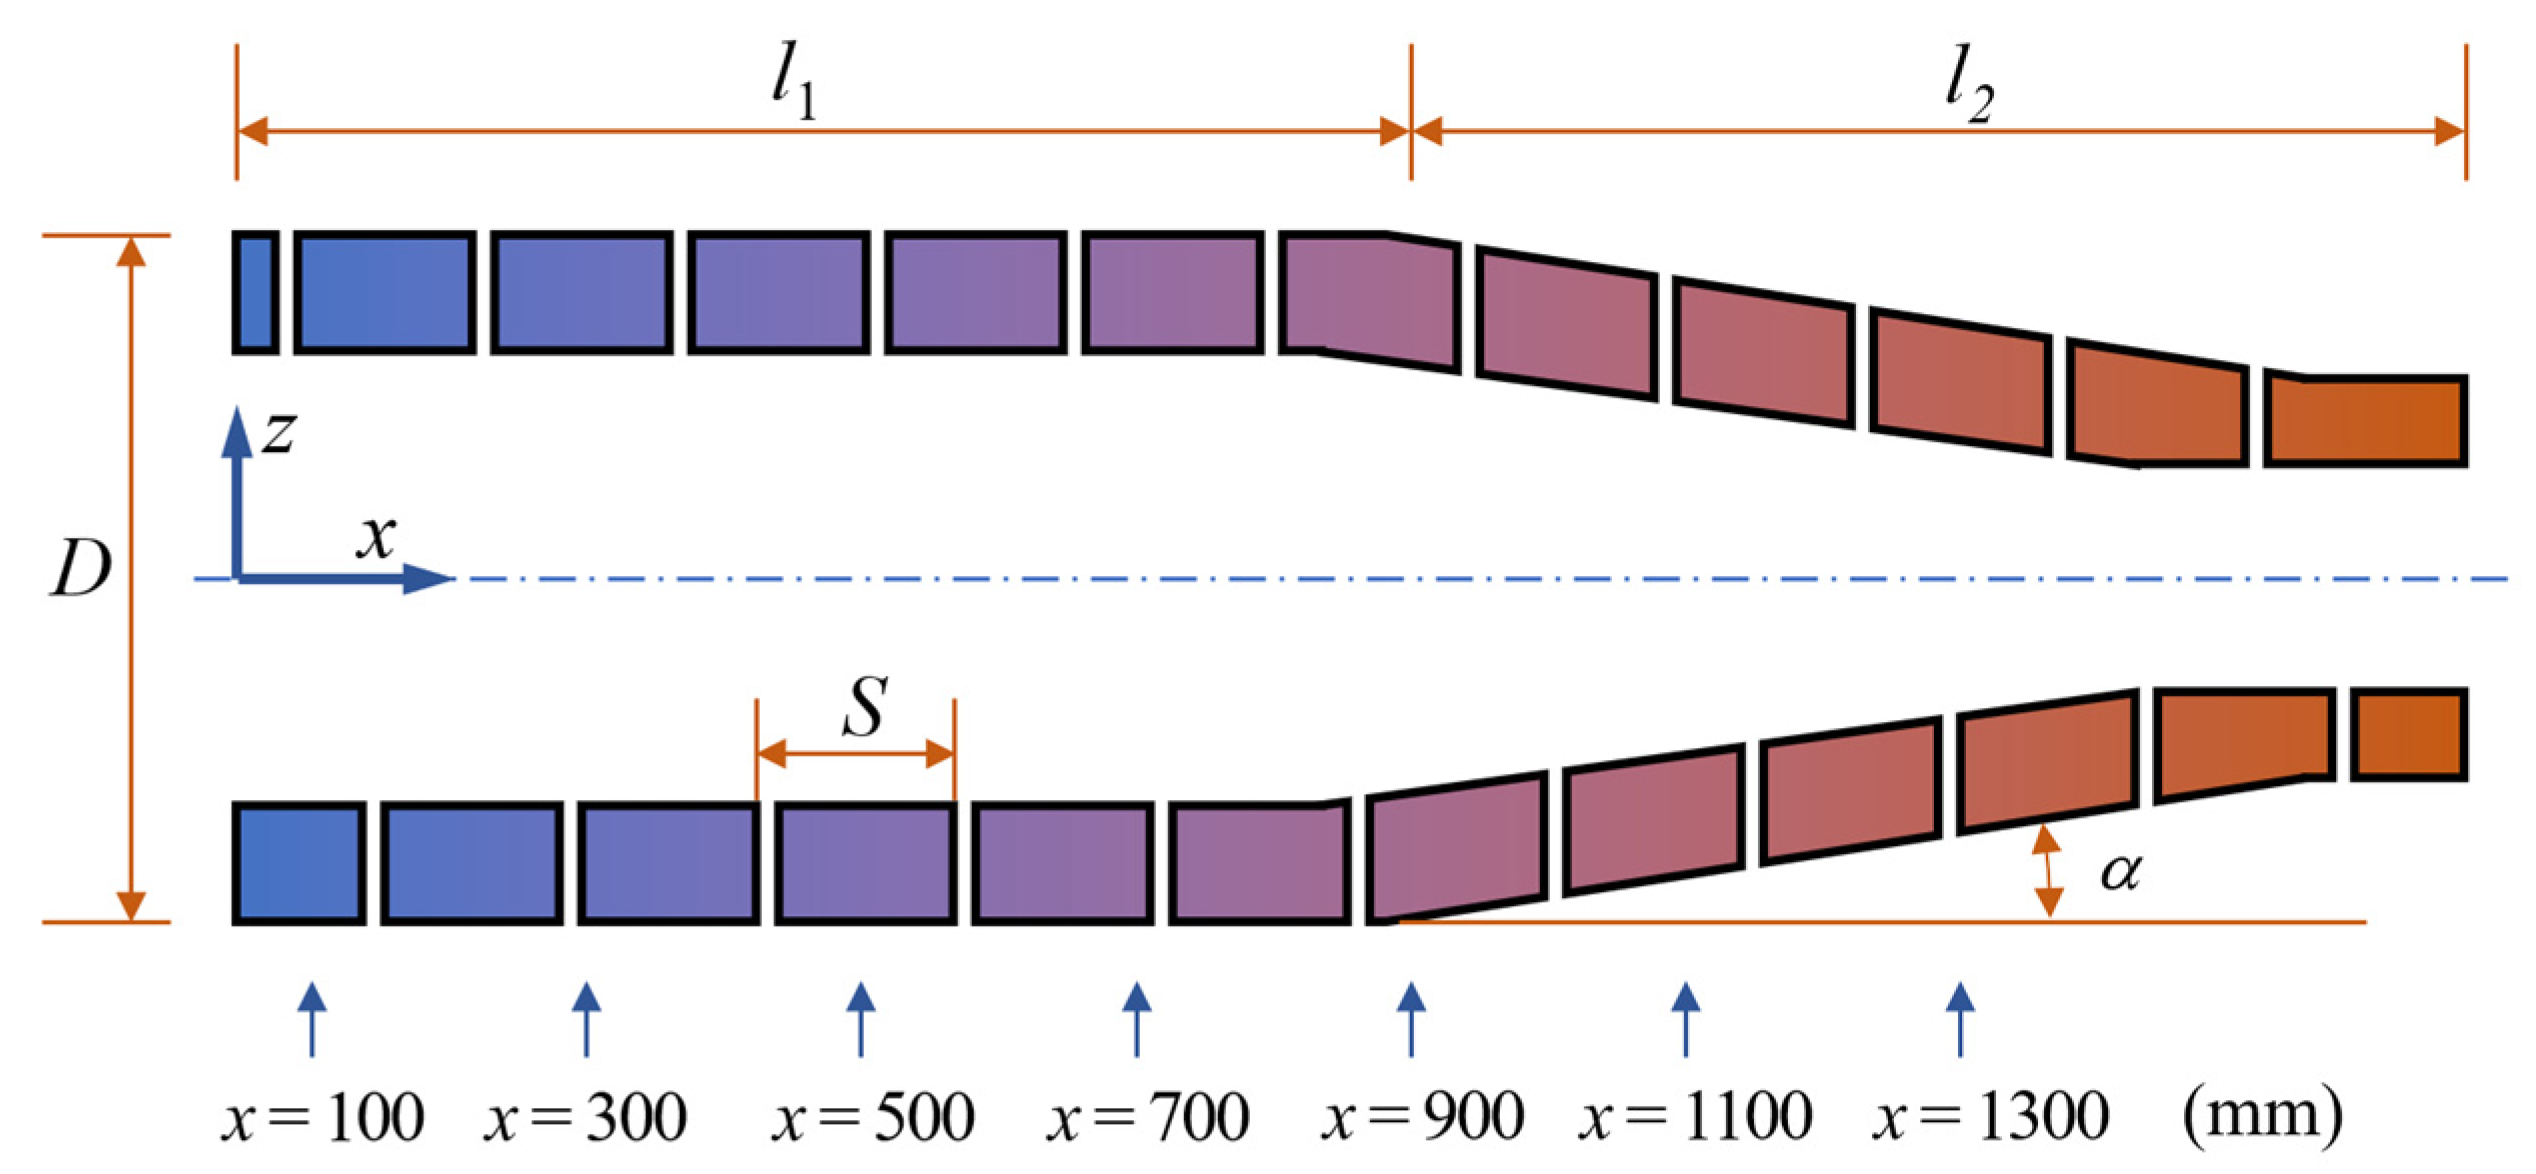
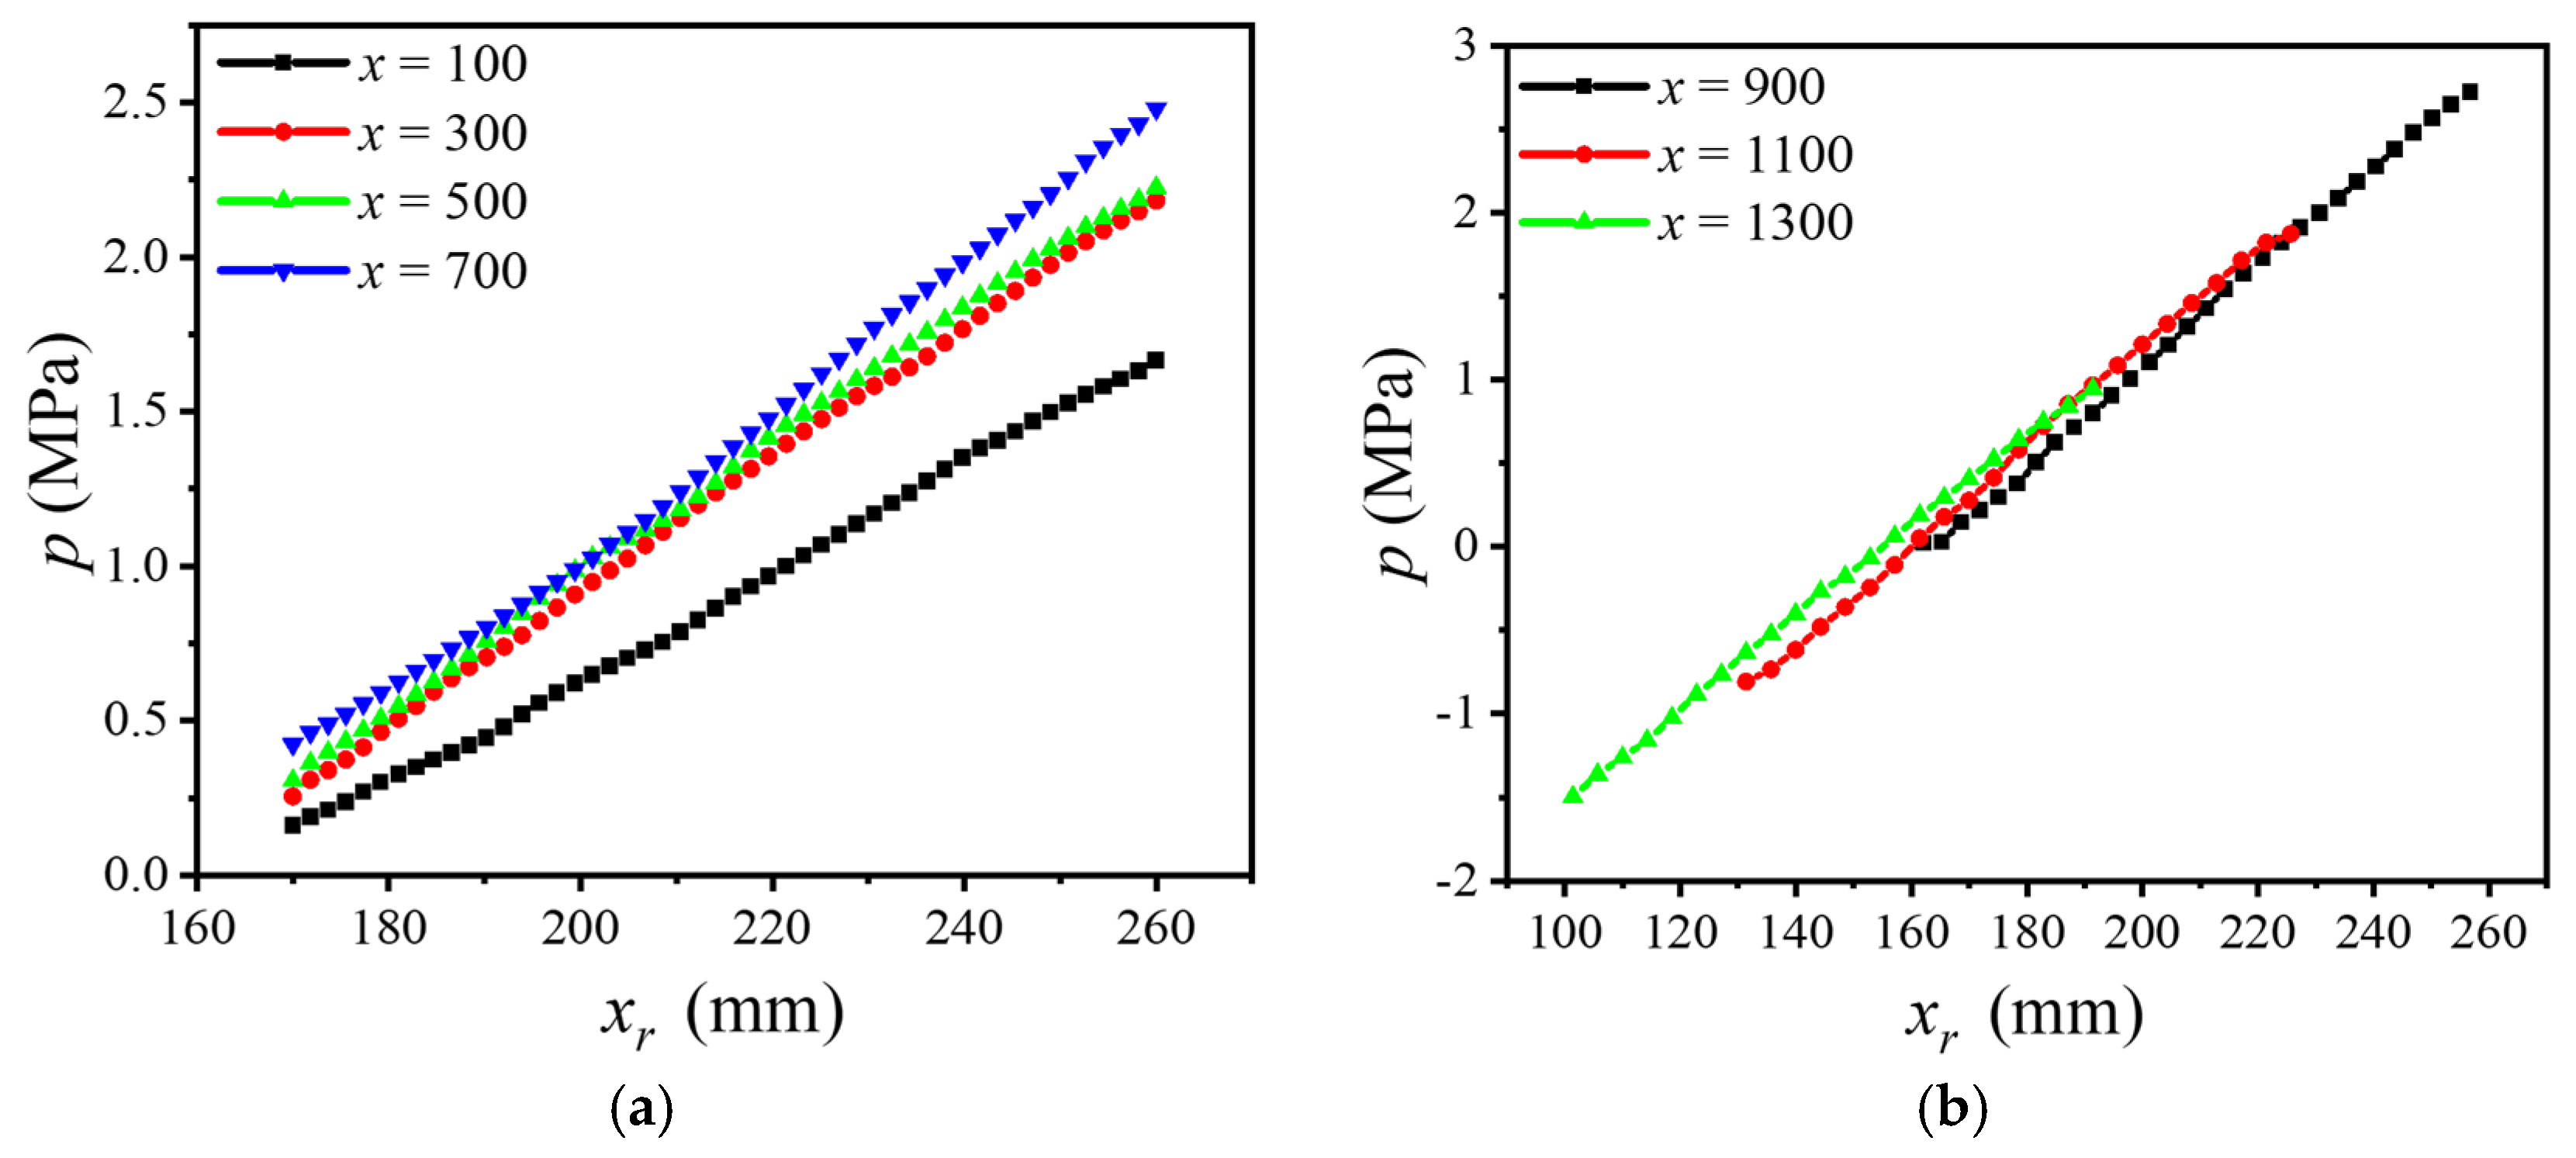
Figure 2. It can be seen that, when the number of grids exceeds 590,000, the variation of the key parameter cake solid content is less than 0.4%. Considering the calculation accuracy and cost, the mesh number of the model under different calculation conditions is about 600,000. To demonstrate the flow field characteristics, the flow field is observed and analyzed by contours of the sections at equal intervals along the axial direction, as shown in
Figure 3.
2.2. Multiphase Flow Model and Conservation Equations
There are several multiphase flow models, such as the volume of fluid (VOF), mixture, Eulerian models, etc. For stratified or free-surface flows, the VOF model is appropriate; for flows in which the phases mix or separate and the dispersed-phase volume fractions exceed 10%, the mixture and Eulerian models are acceptable. In addition, the mixture model may be preferable if there is a wide distribution of dispersed phases. If the dispersed phases are concentrated in only portions of the domain, the Eulerian model should be used instead.
For decanter centrifuges, the solid phase, as the dispersed phase, is concentrated near the cake outlet, since the sediment is pushed to the front end by the screw conveyor. Thus, the Eulerian two-phase model is selected in this paper [
5], and the volume fraction equation is
where,
is the volume fraction of phase
q.
Each of the two phases satisfies the continuity equation.
where
is the velocity of phase
q,
is the mass transfer from phase
p to phase
q, and
is the mass transfer from phase
q to phase
p.
is the source term and its default value is zero.
The equation of momentum conservation is as follows.
where
g is the gravitational acceleration.
is the external force,
is the lift force,
is the virtual mass force,
is the turbulent dispersion force, and
is the wall lubrication force. Since the main forces on the particles are centrifugal force and drag force, the effect of other forces can be neglected.
is the interphase momentum exchange coefficient and the drag force is calculated using the Gidaspow model [
17].
When
,
where
is the relative Reynolds coefficient,
is the dynamic viscosity of the liquid phase, and
is the solid particle diameter.
Compared with the standard
k-
ε model, the effect of swirl on turbulence is included in the RNG
k-
ε model [
18], enhancing the accuracy for swirling flows. While the standard
k-
ε model is a high-Reynolds-number model, the RNG theory provides an analytically derived differential formula for effective viscosity that accounts for low-Reynolds-number effects. Therefore, the RNG
k-
ε model is selected for the turbulence model in this paper, and the form of the turbulent kinetic energy and dissipation rate equations are given in Equations (8) and (9).
where
represents the generation of turbulence kinetic energy due to the mean velocity gradients.
is the generation of turbulence kinetic energy due to buoyancy.
YM represents the contribution of the fluctuating dilatation in compressible turbulence to the overall dissipation rate. The quantities
and
are the inverse effective Prandtl numbers for
k and
ε, respectively.
and
are user-defined source terms.
2.3. Boundary Conditions
The flow field is solved by using FLUENT software. A velocity inlet boundary condition is adopted at the feed tube inlet, which is defined by setting the turbulence intensity and the hydraulic diameter. The velocity is 1.2 m/s and is perpendicular to the inlet plane. The solid phase is talcum powder, and its density is 2600 kg/m3. The liquid phase is water, and its density is 998.2 kg/m3. Both can be regarded as incompressible fluids. The feed solid content is 20%, and the solid particle diameter is 20 μm. Since the flow velocity and pressure at the cake and contrate outlets are unknown, it is assumed that the normal gradient of all flow parameters at the outlet, except pressure, is zero, i.e., outflow boundary conditions are used at the outlets. No-slip conditions are used for all walls.
The MRF model is used in this paper. The moving reference frame zone rotates at 3000 r/min. The walls of the screw conveyor are defined as moving walls, rotating in the same direction at a differential speed of 50 r/min. The intersection of the moving and stationary reference frame zone is defined as an interface boundary condition.
3. Multiparameter Optimization Method
To optimize the comprehensive performance of decanter centrifuges, it is necessary to consider the effects of several main parameters simultaneously. A genetic algorithm-based method is proposed in this section. Compared with the steepest ascent method, it can handle a complex objective function and avoid being trapped in a local optimal solution.
The optimization objective of the comprehensive performance consists of power consumption and separation effect. Mathematical models can be obtained from the simulation results of the designed schemes. The simulation method can avoid manufacturing decanter centrifuges of different sizes, which is effective and economical. Orthogonal numerical tests are adopted in this paper. Compared with the overall tests, they can reduce the number of tests and shorten the period for numerical calculation. Moreover, significant levels of the parameters can be explored by this method.
3.1. Performance Evaluation Metrics
The separation performance and power consumption of decanter centrifuges are both subject to multiple parameters. Their significance levels are explored based on orthogonal numerical tests.
Decanter centrifuges are designed for removing liquid in the suspension and dewatering the cake. Thus, the cake solid content can be used to evaluate the separation performance. In addition, the power consumption affects the operating cost. Since the inlet flow rate and the cake solid content are different in each case, the definition of specific power,
, is proposed as a metric. It represents the energy required per unit volume of liquid removal.
where
P is the power required under stable operating conditions.
is the volume flow rate of the liquid removal, which equals the flow rate of the liquid phase at the centrate outlet:
The liquid phase in the feed is eventually discharged from two outlets. The continuity equations for decanter centrifuges can be expressed as
where
,
, and
are the flow rates of the feed, cake, and centrate, respectively.
,
, and
are the liquid contents of feed, cake, and centrate, respectively. Solving Equations (10)–(13) for the specific power
gives
The mathematical model of power consumption has been explored in the relevant research [
19]. It consists of feed acceleration, cake transport, windage, and transmission losses. The power required for feed acceleration and cake transport accounts for the major part. The feed acceleration power,
, is mainly used for the feed kinetic energy increase and the viscous losses during acceleration, which can be expressed as:
where
is the angular velocity of the bowl,
is the mass flow rate of the feed,
R is the bowl radius at the cylindrical section,
is the mass flow rate at the cake outlet,
is the mass flow rate at the centrate outlet,
is the bowl radius at the cake outlet, and
is the weir radius at the centrate outlet.
The decanter centrifuge is divided into four zones according to the bowl structure and whether the cake emerges from the pool [
20]. The cake transport power can be obtained by calculating the power that each zone requires and summing them. In each zone, the internal flow field is divided into micro elements along the spiral line, and the power of each element is calculated as follows.
where,
is the dimensionless power consumed by each element,
is the dimensionless radius of the cake pressure center,
S is the saturation, and
is the solid relative density.
β is the half conical angle of the bowl, and
α is the helix lift angle.
is the contribution of the Coriolis force to the power, which can be neglected. The friction coefficients among the cake, the screw conveyor, and the central shaft are
,
, and
, respectively.
is the dimensionless length of the element.
3.2. Orthogonal Numerical Test Design
An orthogonal test is a method for researching a target that has multiple factors and levels. Factors are arranged in an orthogonal table. Each level or factor appears an equal number of times. It is effective for product development and industrial engineering and has been successfully applied in numerous research areas [
21].
The specific power and cake solid content are used as the metrics for the orthogonal numerical tests in this paper. First, the cake solid content and solid recovery are obtained by numerical simulation. Then, the specific power for each scheme is calculated by the method mentioned above. Finally, the significance levels of these parameters are analyzed. The sum of the feed acceleration power and cake transport power equals the aggregate power. The three friction coefficients are taken as 0.1, and the power used for transporting the cake at the cylindrical section is considered.
For a specific suspension, the solid density, particle size, viscosity, feed solid content, and other parameters are determined by a practical process. They are difficult to adjust or improve. However, structural parameters such as the L/D ratio and half conical angle, as well as operating parameters such as the bowl speed and flow rate can be adjusted. Therefore, they are used as orthogonal test parameters.
In this paper, based on a decanter centrifuge with a bowl diameter of 520 mm, five main parameters are investigated:
L/
D ratio
δ, bowl speed
nb, differential speed
nd, flow rate
Q, and half conical angle
β. A sixth empty column is added as an error column.
Table 2 shows the factors and levels of the orthogonal tests. Five levels, six factors, and 25 schemes are arranged. A standard orthogonal table, L
25(5
6), is used. The geometric model must be rebuilt when the
L/
D ratio or half conical angle changes. The boundary conditions must be altered when the differential speed, bowl speed, or flow rate changes.
Table 2.
Factors and levels of the orthogonal numerical tests.
Table 2.
Factors and levels of the orthogonal numerical tests.
| Level | δ | | | Q (m3/h) | β (°) |
|---|
| 1 | 2.7 | 2000 | 5 | 3 | 7 |
| 2 | 2.9 | 2500 | 10 | 4 | 8 |
| 3 | 3.0 | 3000 | 15 | 5 | 10 |
| 4 | 3.1 | 3500 | 20 | 6 | 11 |
| 5 | 3.3 | 4000 | 25 | 7 | 12 |
3.3. Objective and Process of Genetic Algorithms
Three main aspects are considered to evaluate the comprehensive performance of a decanter centrifuge. The first is whether the separation effect can achieve the process requirements. The second is how to further reduce the power consumption and operating cost. The third is how to lower the manufacturing cost, such as reducing the
L/
D ratio. Thus, the minimum specific power and the
L/
D ratio are treated as the optimization objectives of the comprehensive performance, under the condition of reaching the required cake solid content. The objective functions are described by:
where,
x is a five-dimensional column vector with the
L/
D ratio, bowl speed, flow rate, differential speed, and half conical angle.
is the specific power, and
is the cake solid content. Both can be obtained by the results of the orthogonal numerical tests.
GAs (genetic algorithms) are considered one of the most widely used artificial intelligence techniques for effective search and optimization [
22]. They are stochastic searching algorithms based on the mechanisms of natural selection and genetics. A GA program coded by MATLAB software is used based on the quadratic response surface regression model of the orthogonal test results. The minimum value of the cake solid content,
, is set to 72%. The parameters for the GA are shown in
Table 3. The algorithm process is illustrated in
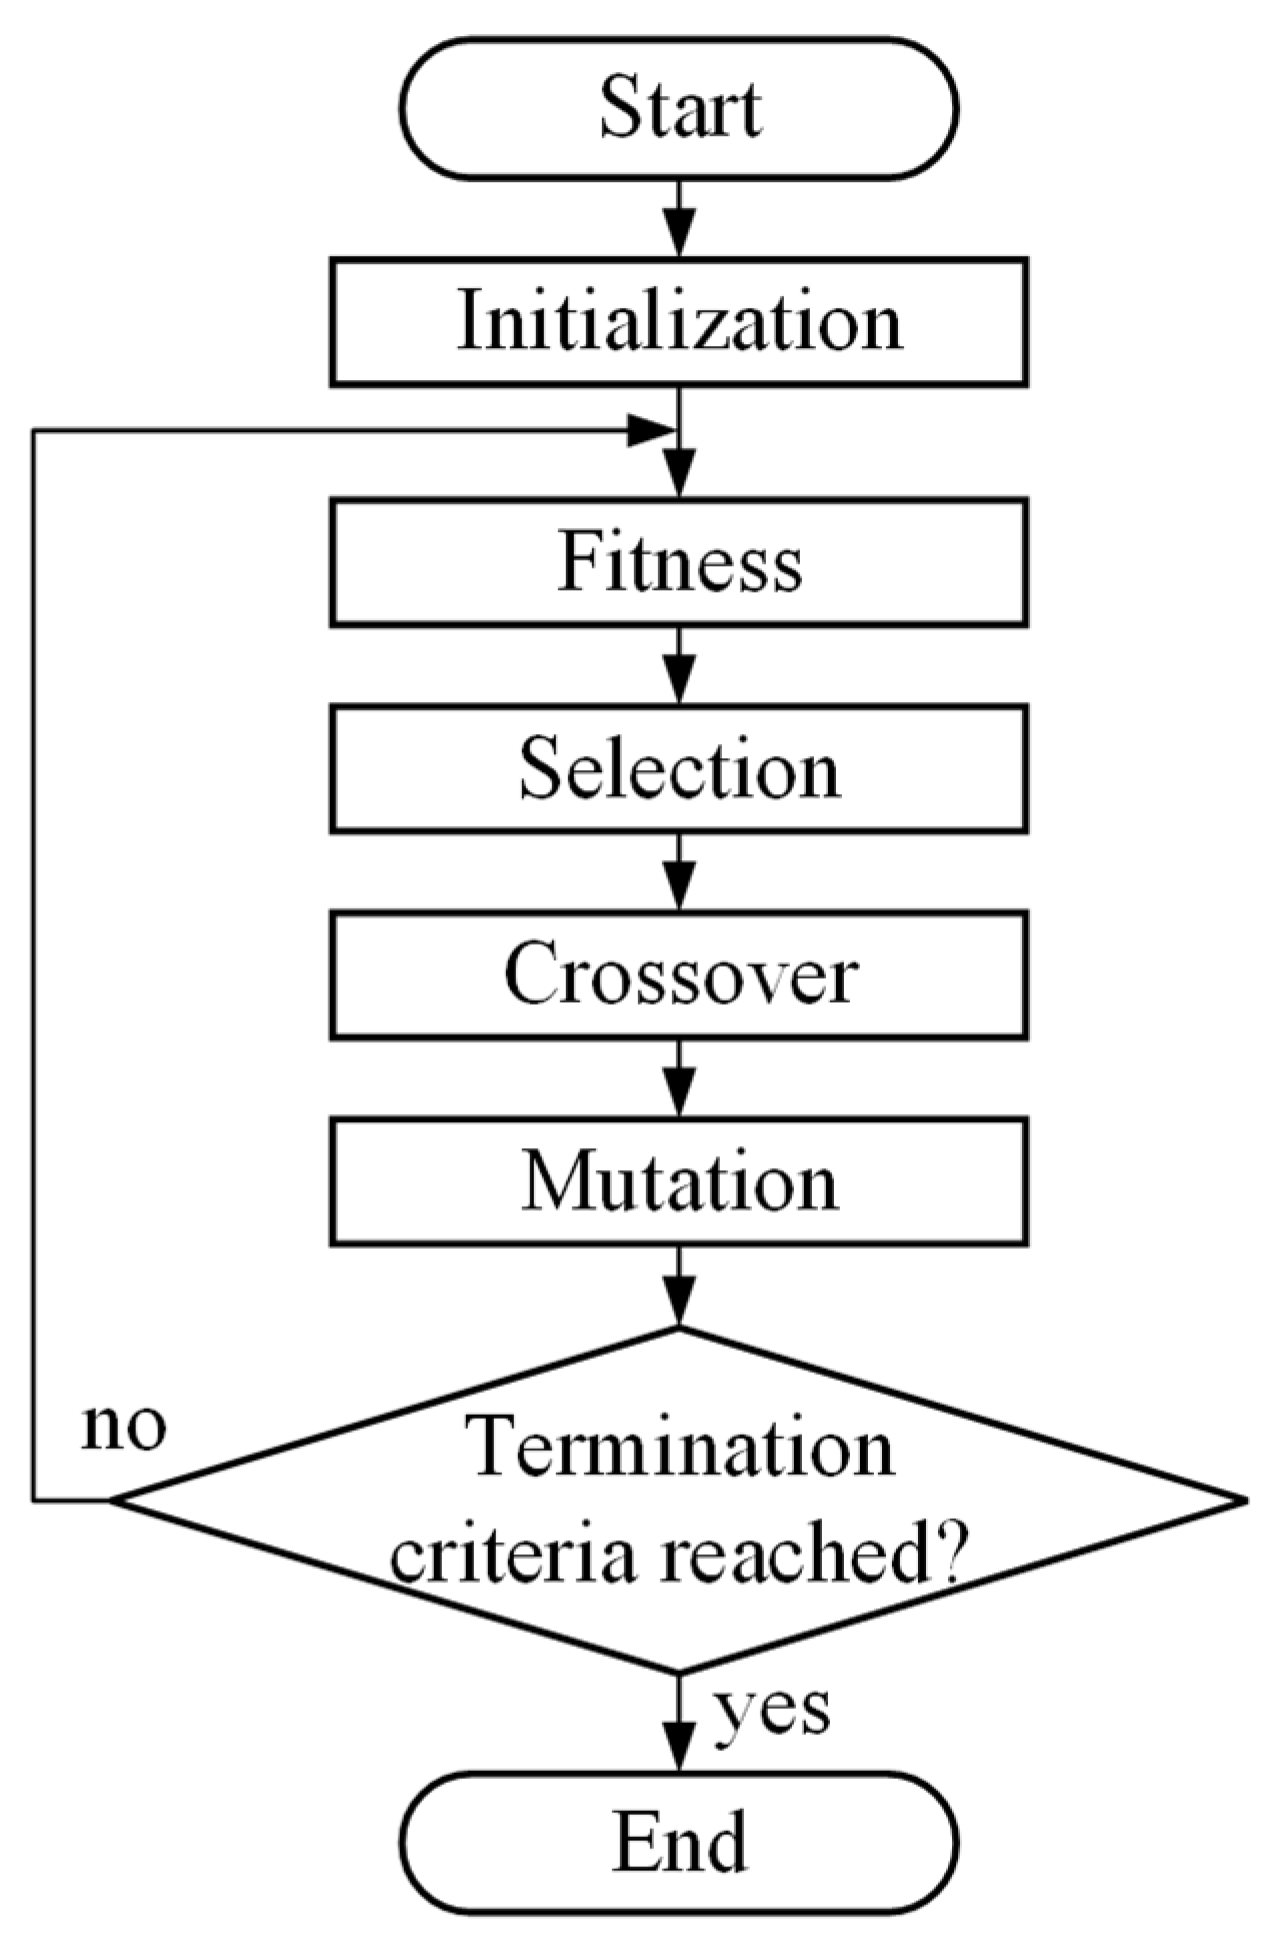
Figure 4 and relevant details are given below:
Step 1: Initialization. Randomly generate a certain number of chromosomes as a population.
Step 2: Fitness. A rank-based fitness assignment is adopted for further selection. As shown in Equation (17), there are two objective function values including the specific power and the
L/
D ratio. Their minimal values are preferred, so the fitness values are evaluated according to a descending rank of the objective function values. The minimal requirement of the cake solid content has to be satisfied, or the individual is not allowed to be selected. Thus, for individuals who fail to reach the condition of
, the fitness value is set to zero. The fitness values are calculated as:
where
N is the population size, and
Ni is the individual rank in the population based on two objective function values.
ε is the evaluation coefficient within the region [1.1, 2.0], which can affect the convergence time, and is taken at 1.1 in this study. It can be found that the fitness values are limited in the scope from 0.8 to 1.1, which means the superior individual cannot dominate extremely in the next selection to prevent premature convergence. The fitness value will increase when the rank of the individual rises, which also means the objective function values decrease since the rank is descending.
Step 3: Selection, crossover, and mutation. The roulette wheel selection method is chosen here. In this way, the fitness values of all individuals are represented by a pie chart. Each in the population is assigned a piece in the pie chart, and its size is proportional to its fitness value. Then, the wheel is rotated until the roulette stops. The pointer stops on one piece and the corresponding individual is selected. The higher the fitness value, the greater the possibility of being selected. The new individual is obtained by crossover from the gene segments of both its parents. All the factors are concatenated and encoded into a binary Gray code in the initialization step, so that parents can exchange genes from different regions to produce new individuals. Subsequently, new offspring arise after a random substitution of genes during mutation, which represents some original gene values at different regions in the coding string of the individual being replaced by random numbers with a small probability. Place new offspring as a new population and use this population for the next iteration.
Step 4: Circulation and end. When the maximum number of iterations is exceeded, the program ends.
Table 3.
Parameters for the genetic algorithm.
Table 3.
Parameters for the genetic algorithm.
| Parameter | Value |
|---|
| Population size | 60 |
| Generation number | 60 |
| Probability of crossover | 0.9 |
| Probability of mutation | 0.7 |
5. Conclusions
In this paper, the influences of the window structure and bowl–conveyor gap on the separation performance of decanter centrifuges are analyzed by numerical simulation. A genetic algorithm-based method for optimizing the comprehensive performance of decanter centrifuges is proposed. An orthogonal numerical test is performed to obtain the regression models of cake solid content and specific power, which can be treated as the objective function for optimization. After systematic structural and parameter optimization, the optimal structural parameters of the decanter centrifuge studied in this paper are obtained. The main conclusions of this paper are as follows:
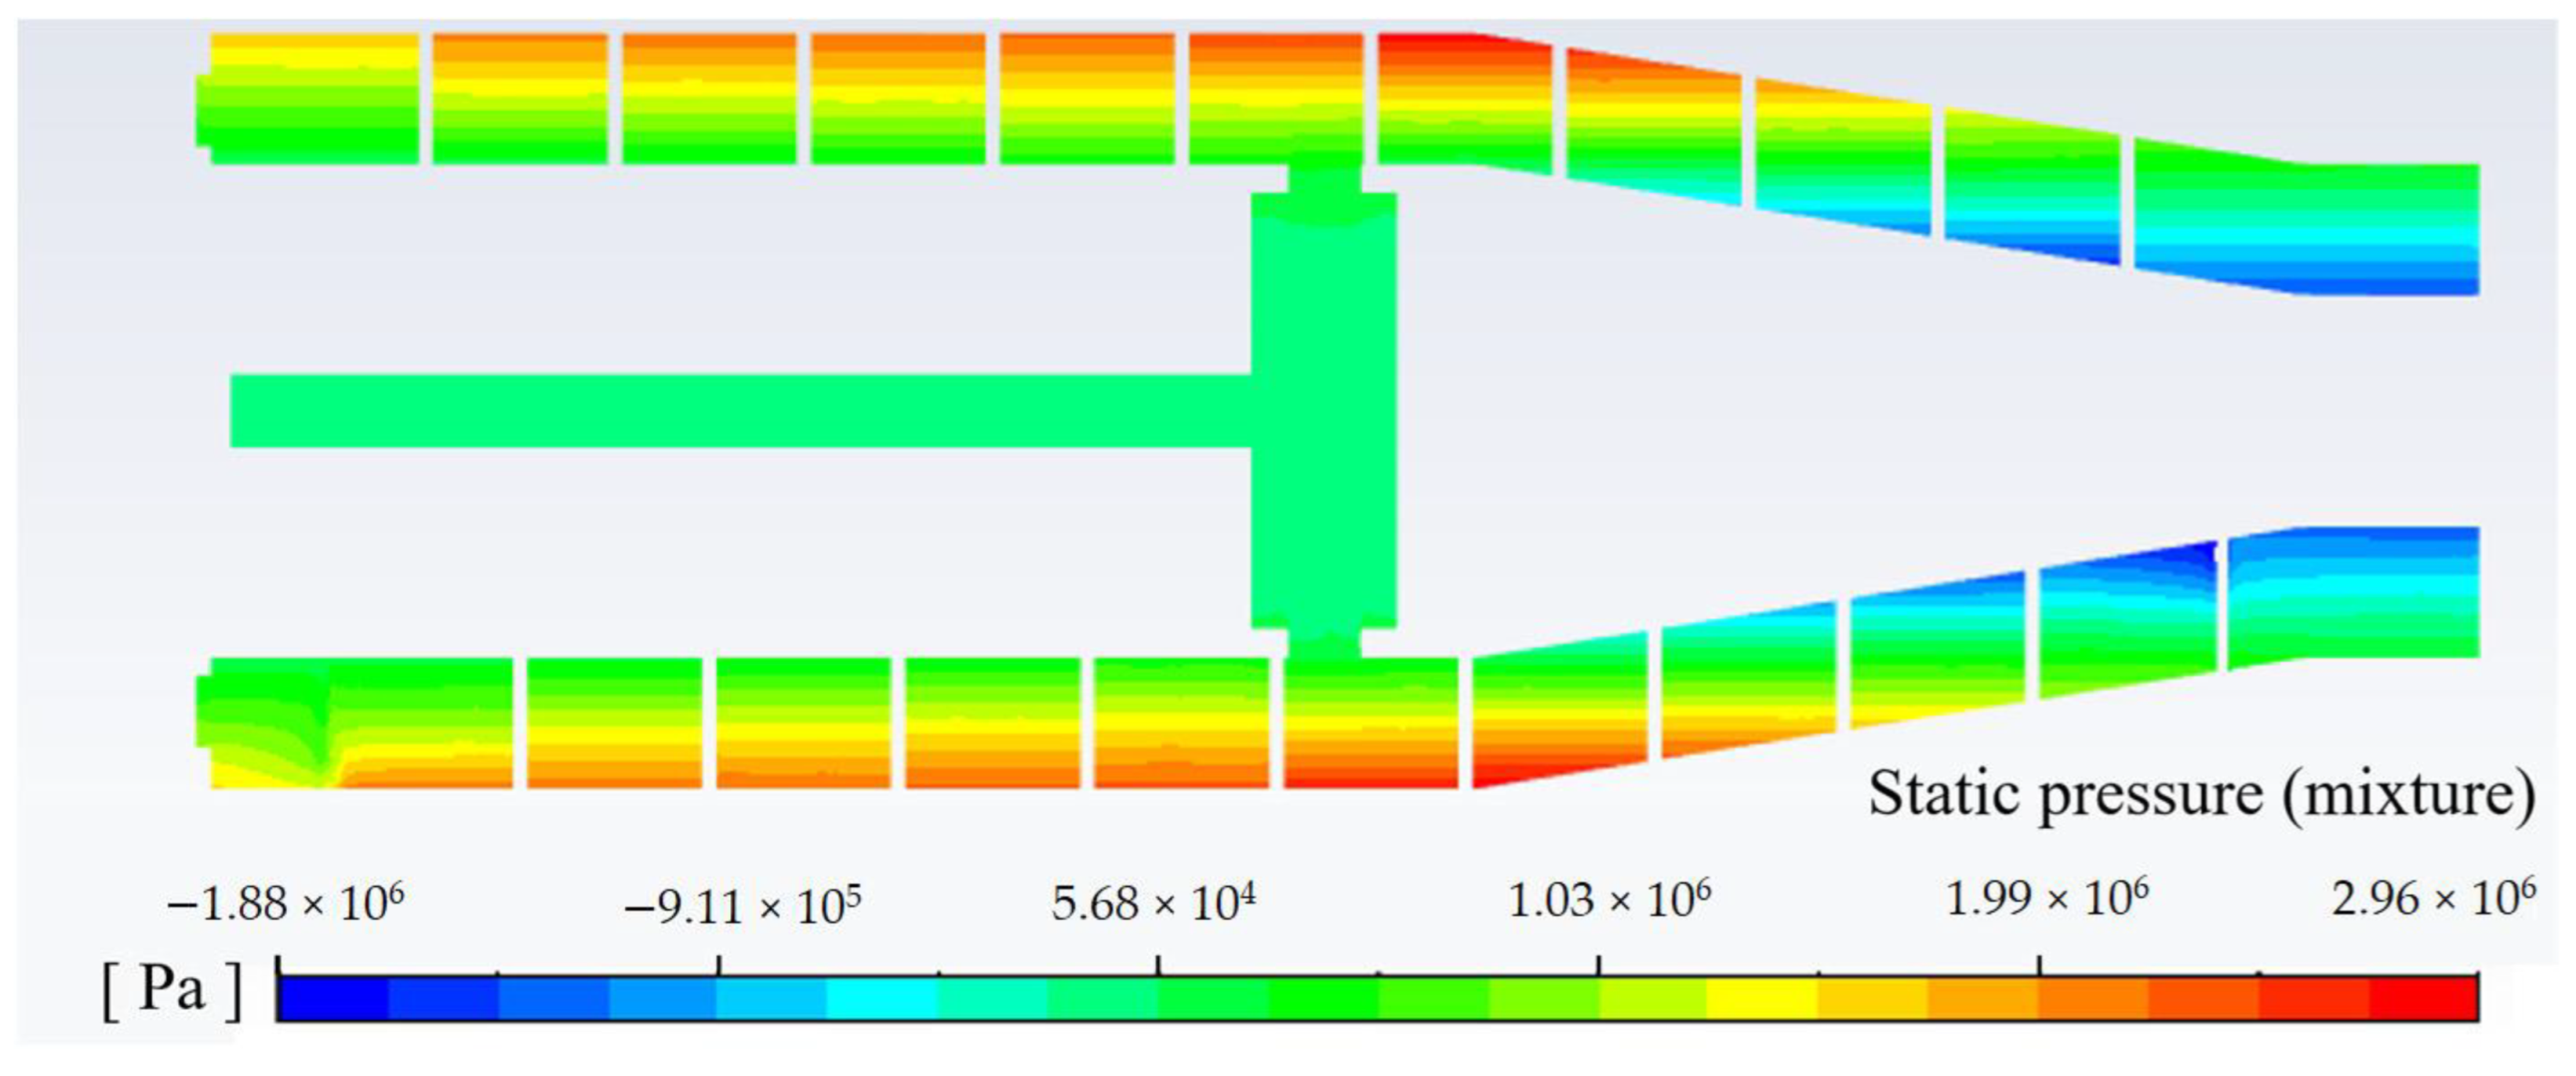
- (1)
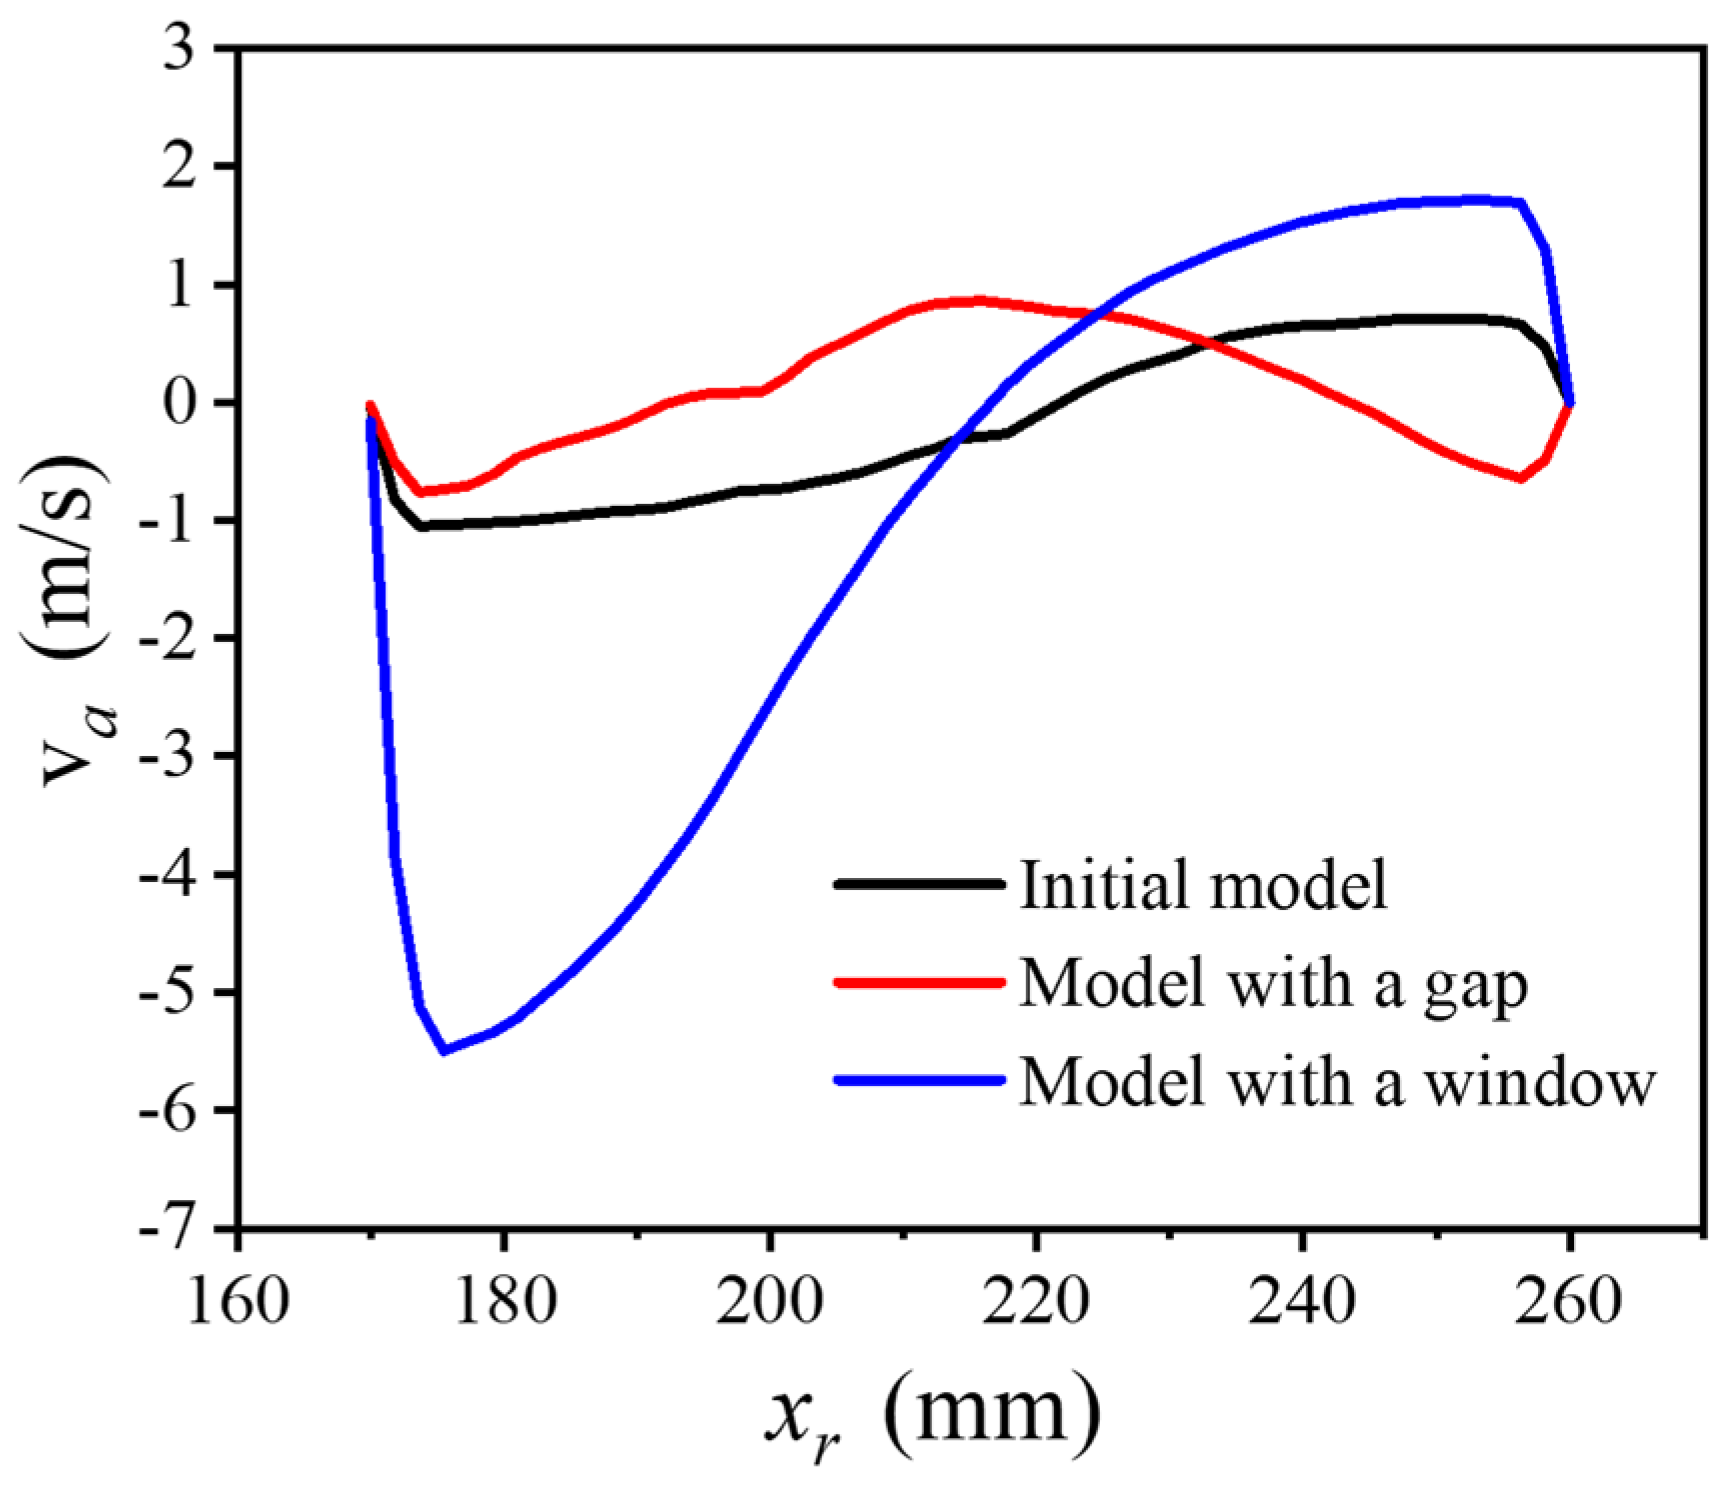
The pressure near the bowl at the junction of the cylindrical and conical sections is the highest in the whole field. The lag of tangential velocity is large at the bowl wall and small at the conveyor shaft wall, which will affect the centrifugal force on the particles, as well as their settling rate.
- (2)
When the bowl–conveyor gap increases from 0 mm to 2 mm, both the solid recovery and cake solid content decrease by 37.5% and 6.6%, respectively. With an increase in the window angle from 0° to 60°, the solid recovery and cake solid content decrease by 17.9% and 3.0%, respectively. With an increase in the window height from 0 mm to 45 mm, the solid recovery and cake solid content decrease by 18.0% and 3.5%, respectively.
- (3)
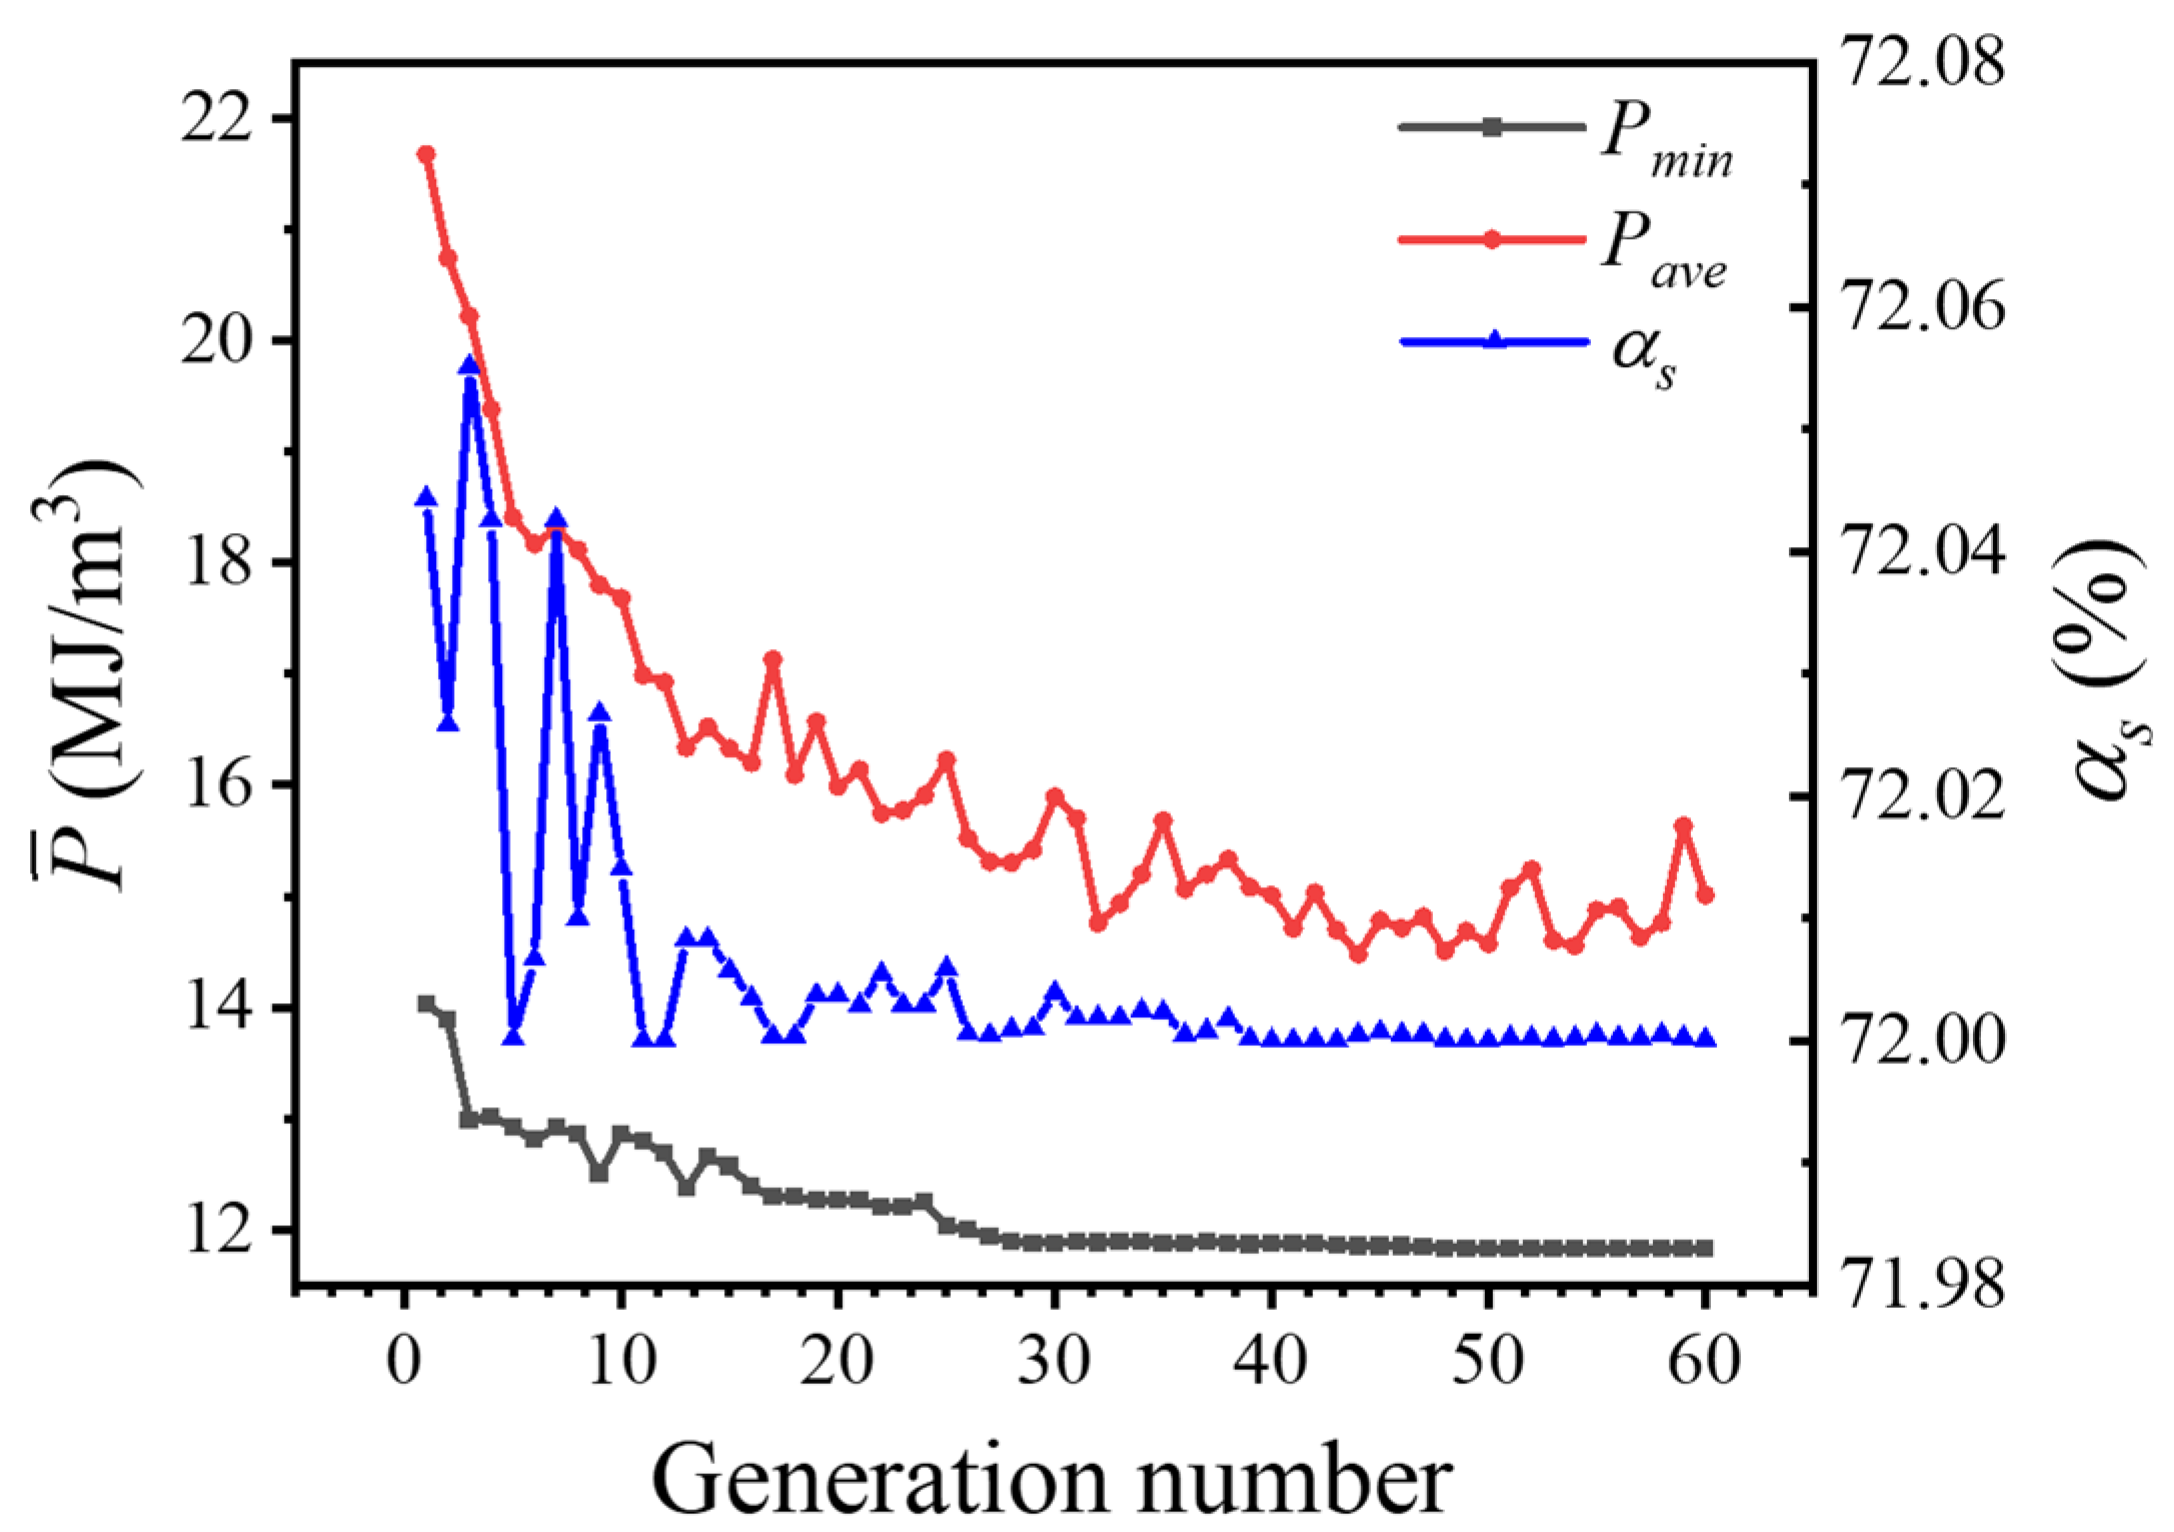
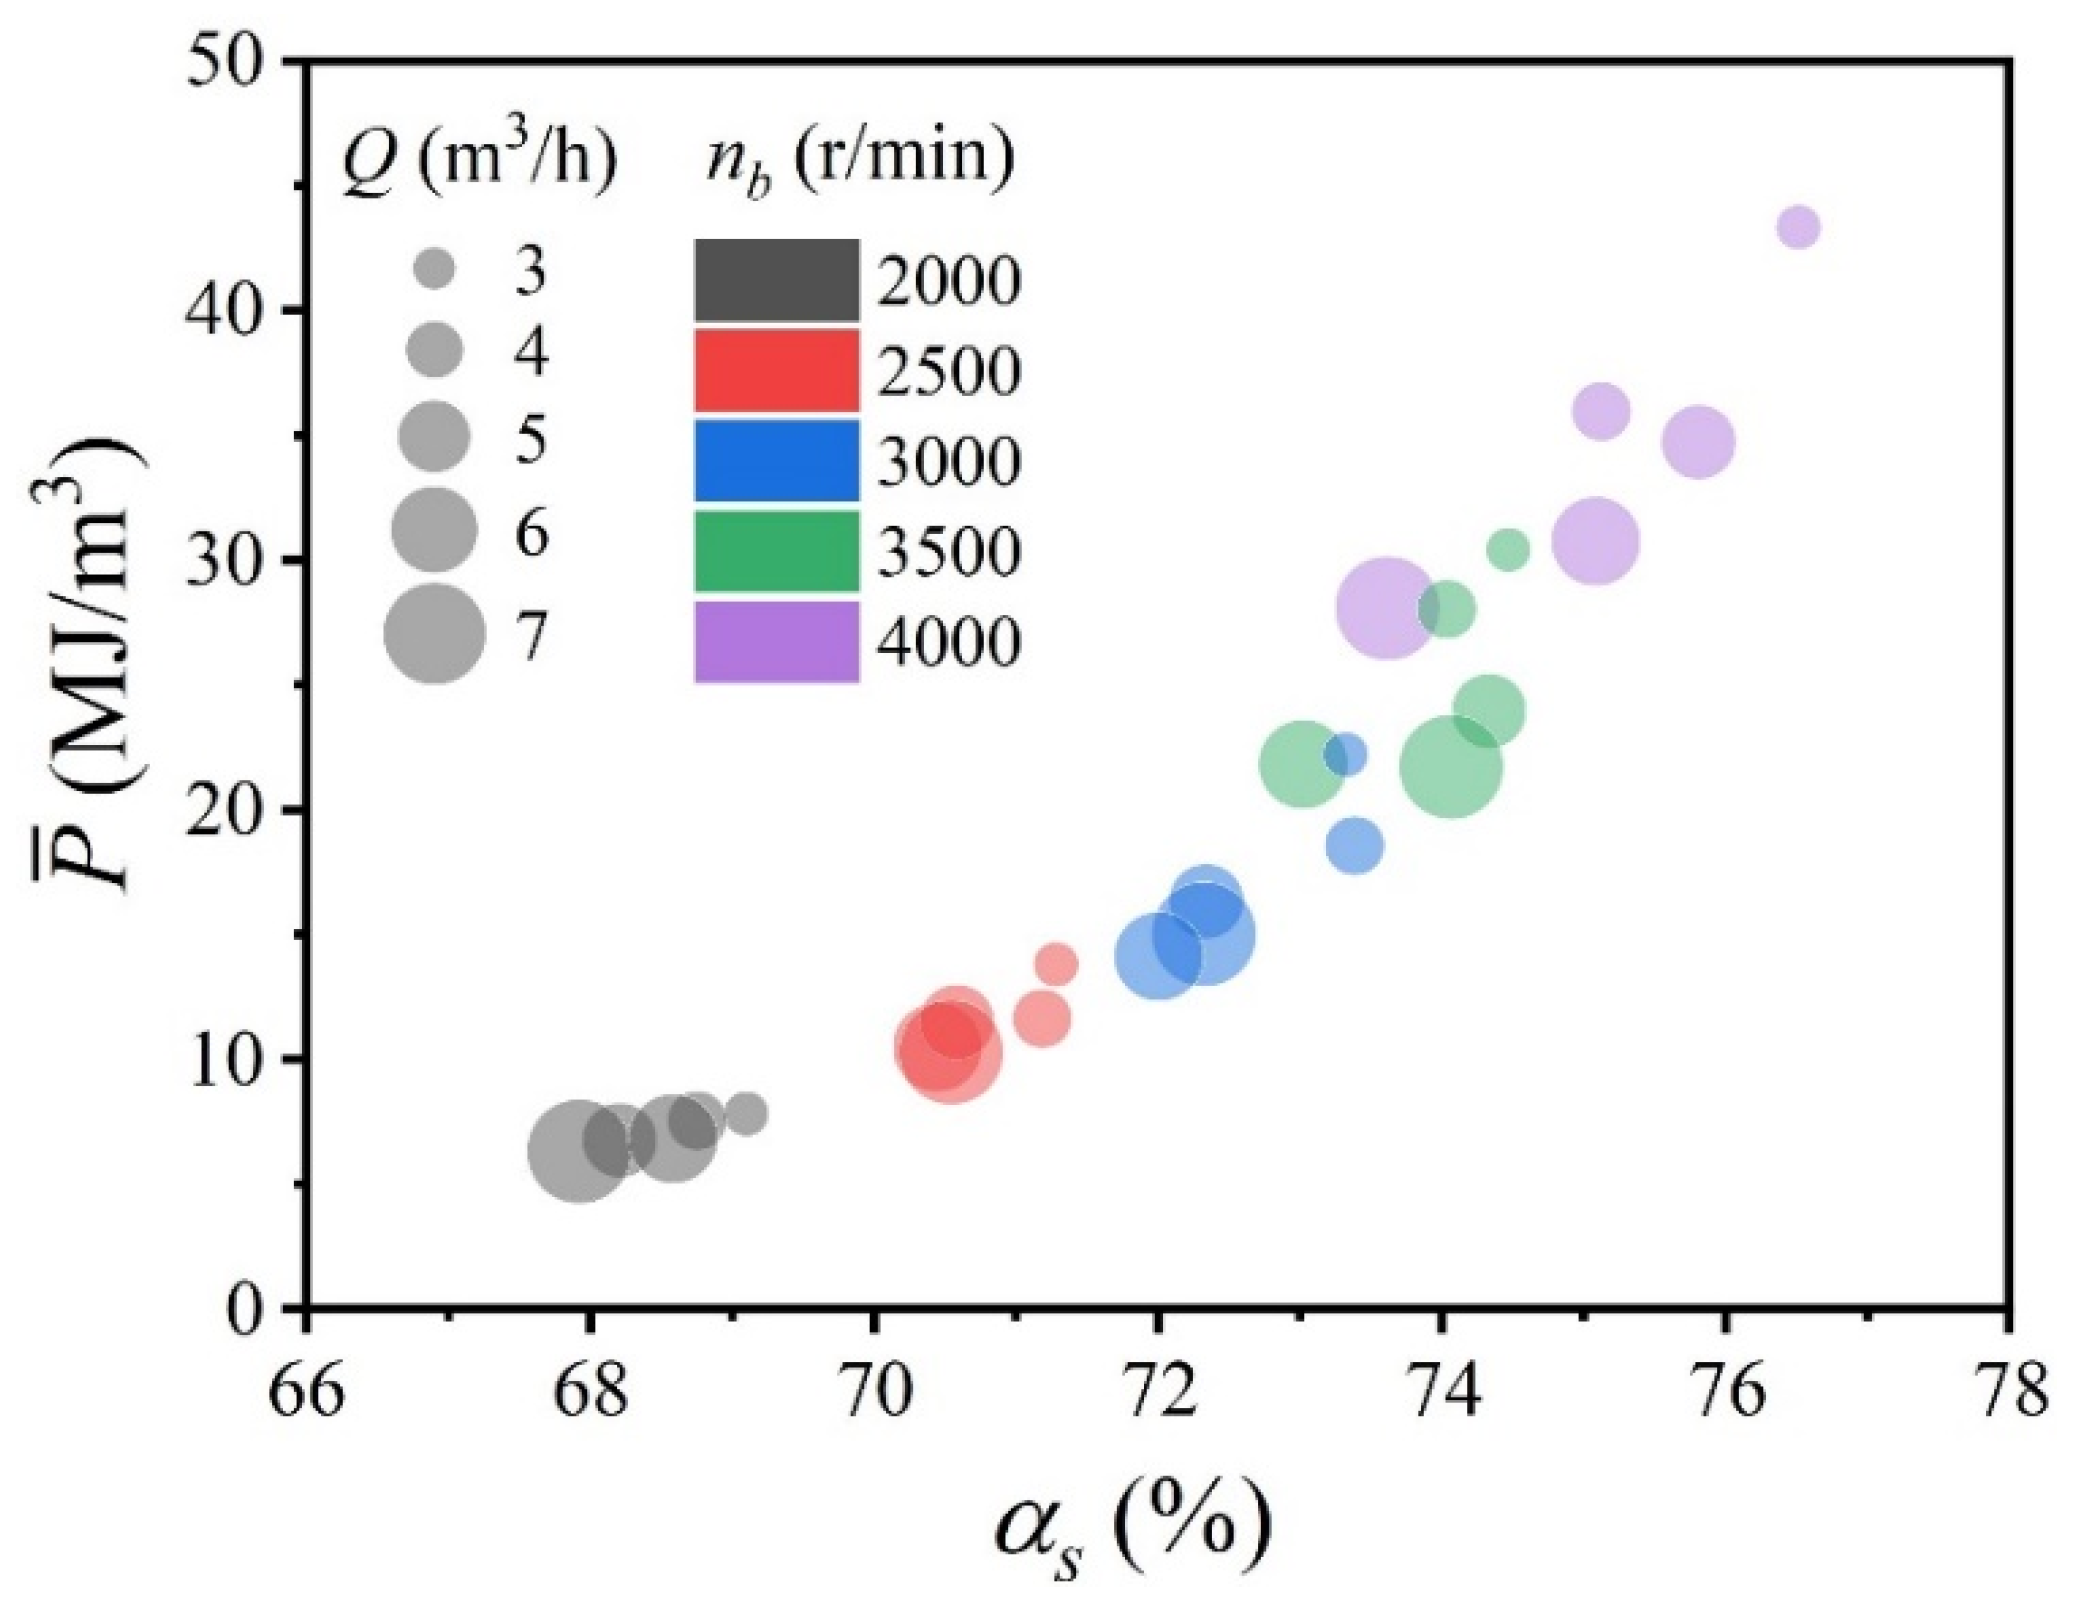
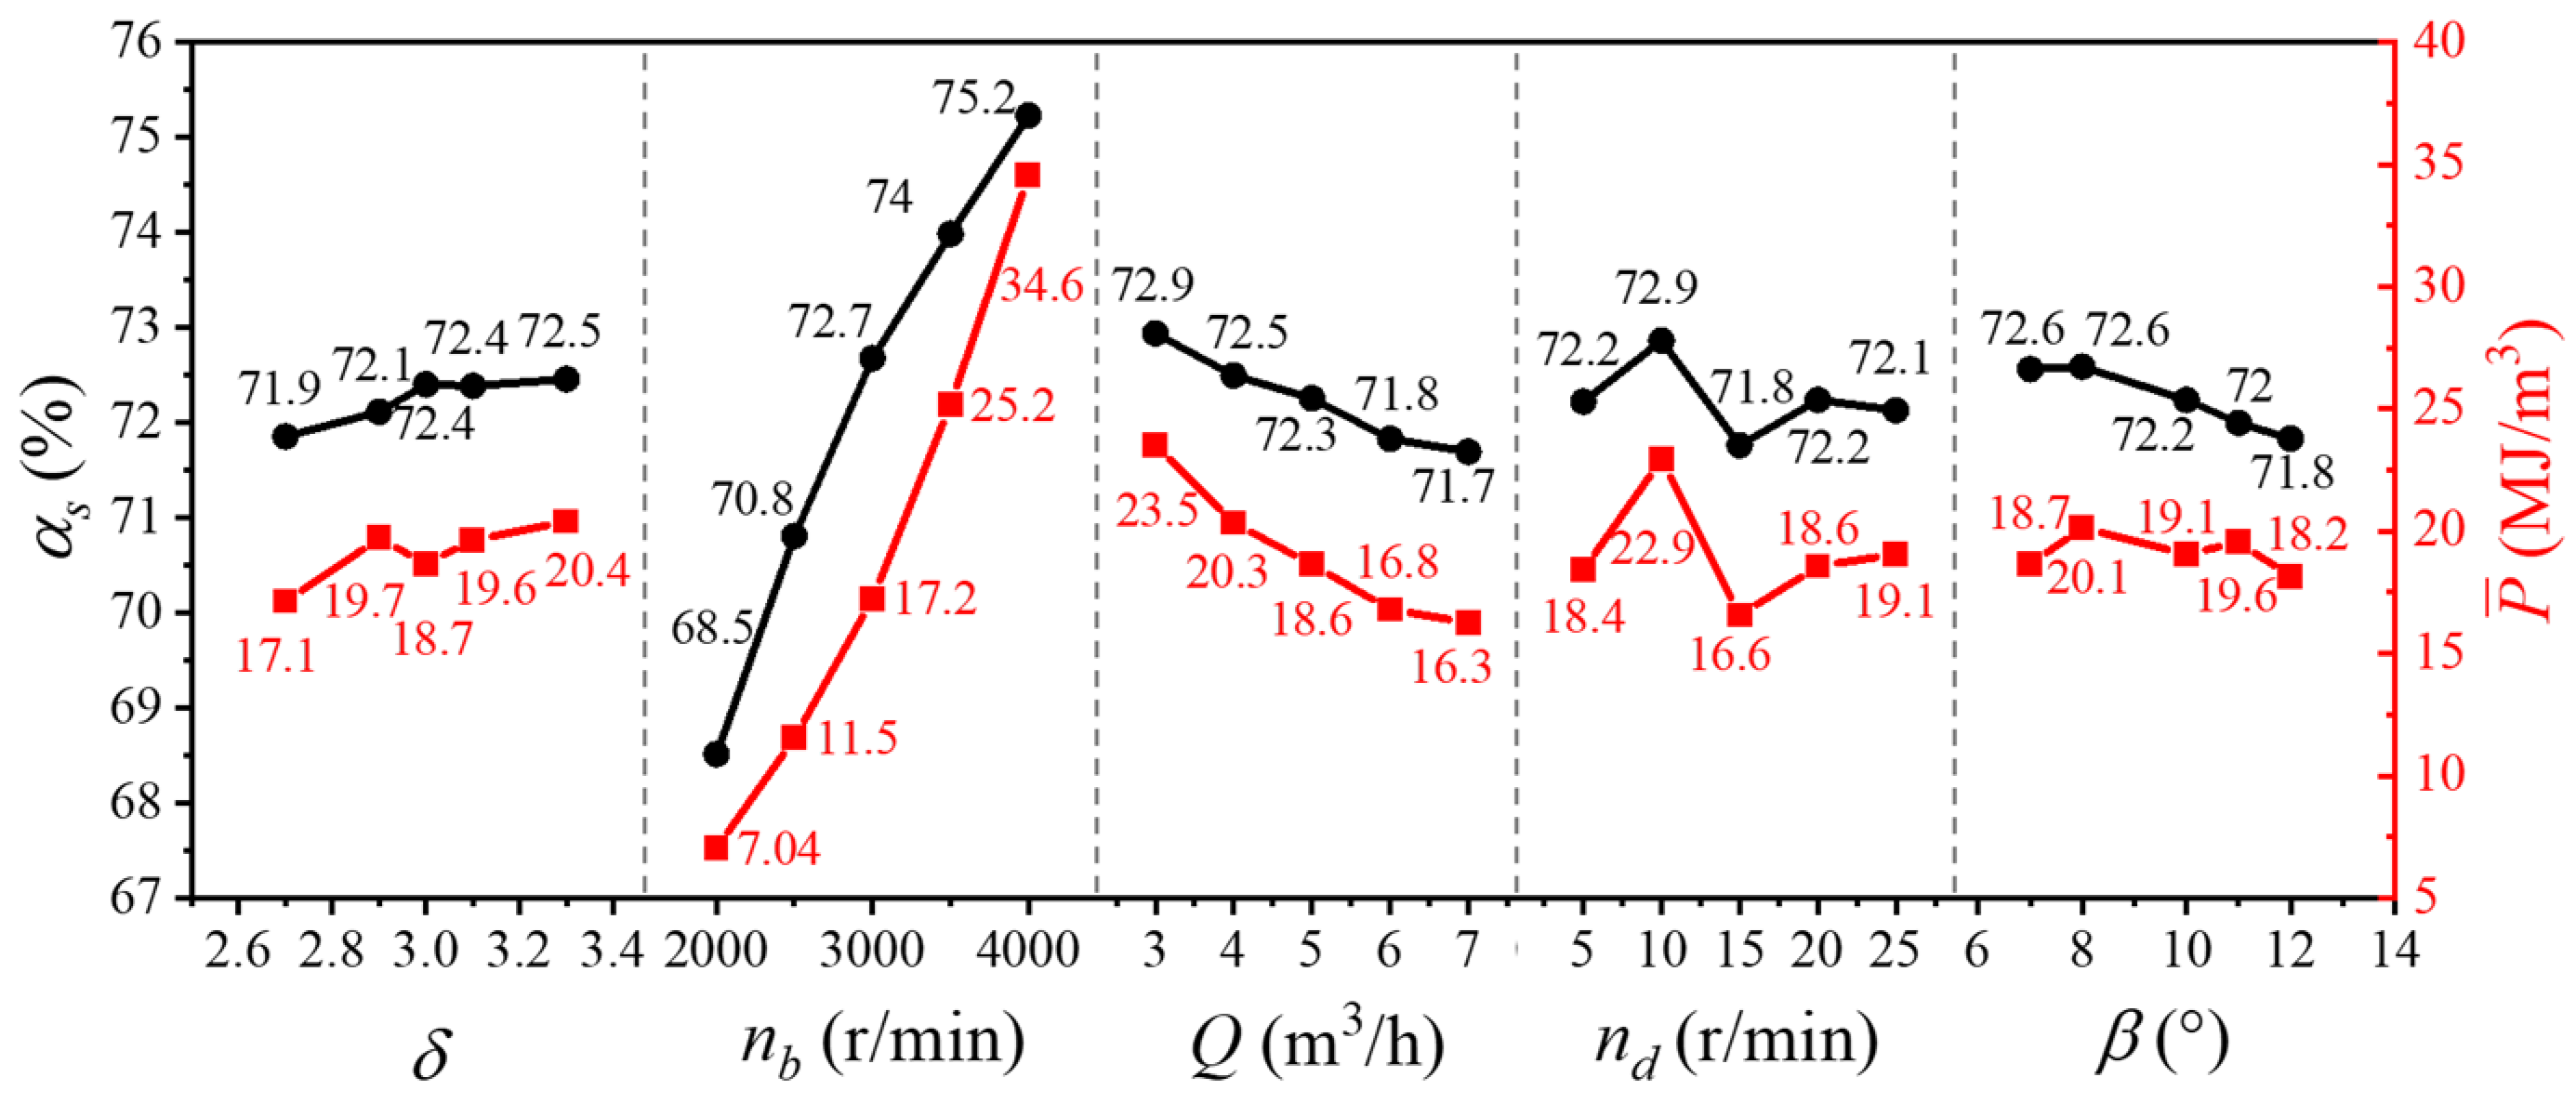
Parameter optimization shows that the bowl speed and feed flow rate have the most significant effects on the separation performance and power consumption. Compared with the minimal specific power in the first generation, the optimized specific power is reduced by 15.7%, and the cake solid content merely decreases by 0.044%.
The results of this paper and the optimization method proposed in this paper can provide a technical basis for the design of an efficient and economical decanter centrifuge.
Moreover, although the orthogonal numerical test can be utilized for parameter optimization, it may cost a long calculation time under the restriction of calculation resources. Further studies will focus on the fast optimization method combined with artificial intelligence (AI) technology in the optimization process of decanter centrifuge structure.


