Article

A Gold Nanoparticle-Based Molecular Self-Assembled Colorimetric Chemosensor Array for Monitoring Multiple Organic Oxyanions

1
Guangxi Key Laboratory of Optical and Electronic Materials and Devices, College of Materials Science and Engineering, Guilin University of Technology, Guilin 541004, China
2
Department of Organic and Biomolecular Chemistry, Ural Federal University, Mira 19, 620002 Ekaterinburg, Russia
3
Institute of Organic Synthesis, Ural Branch of the Russian Academy of Sciences, Kovalevskoy 22, 620219 Ekaterinburg, Russia
*
Authors to whom correspondence should be addressed.
These authors contributed equally to this work.
Processes 2022, 10(7), 1251; https://doi.org/10.3390/pr10071251
Submission received: 5 April 2022 / Revised: 5 May 2022 / Accepted: 6 May 2022 / Published: 23 June 2022

Abstract

:
Determination of oxyanions is of paramount importance because of the essential role they play in metabolic processes involved in various aquatic environmental problems. In this investigation, a novel chemical sensor array has been developed by using gold nanoparticles modified with different chain lengths of aminothiols (AET-AuNPs) as sensing elements. The proposed sensor array provides a fingerprint-like response pattern originating from cross-reactive binding events and capable of targeting various anions, including the herbicide glyphosate. In addition, chemometric techniques, linear discrimination analysis (LDA) and the support vector machine (SVM) algorithm were employed for analyte classification and regression/prediction. The obtained sensor array demonstrates a remarkable ability to determine multiple oxyanions in both qualitative and quantitative analysis. The described methodology could be used as a simple, sensitive and fast routine analysis for oxyanions in both laboratory and field settings.

1. Introduction

Oxyanions such as phosphonates, carboxylates and phosphates play essential roles in metabolic processes and are involved in various aquatic environmental problems. Excess phosphate in rivers, lakes and coastal waters can lead to severe eutrophication [1]. Glyphosate, a compound called Roundup, is an herbicide widely used in agriculture [2,3]. Excessive use of glyphosate can cause various severe problems due to its adverse effects on human beings and other living creatures, such as mental disorders, language malfunctions and breathing paralysis, and can even endanger life [4,5,6]. Various methods for the determination of oxyanions have been developed, including high-performance liquid chromatography (HPLC) [7], pulsed amperometric detection (PAD) [8], ion-exchange chromatography (IC) [9], gas chromatography–mass spectrometry (GC-MS) [10] and capillary electrophoresis (CE) [11,12]. Nevertheless, these methods involve complex, time-consuming operation processes and require expensive instruments, and they must be implemented by highly trained technicians. Therefore, rapid, sensitive, reliable and high-throughput oxyanion detection methods have still been widely sought.
Chemical sensors based on the lock–key strategy have been proved to be efficient in identifying specific target molecules [13]. Meanwhile, the chemosensor array provides a powerful method for multitarget detection. Sensor arrays have been widely used in target analysis (e.g., for toxic gases [14,15], pollutants [16], explosives [17,18,19], bacteria [20,21], proteins [22,23,24,25], cancer cells [26,27], medical diagnosis [28,29,30], drug mechanisms [31] and food quality control [32,33,34]). Indeed, chemosensor arrays demonstrate their virtue from basic chemical analysis to practical application [35,36].
Gold nanoparticles (AuNPs) have been widely applied in the preparation of naked-eye-recognizable chemical sensors [37,38,39]. The spectral shift of AuNPs is caused by the change in localized surface plasmon resonance (LSPR) originating from aggregation or dispersion of particles caused by chemical stimuli [40,41,42]. Meanwhile, the properties of ease of preparation and ease of surface functionalization provide AuNPs with advantages for the construction of various sensing units. A number of chemical species, such as biological thiols [43], bacterial species [44], catecholamine [45], toxic organophosphate pesticides [46] and proteins [47,48], have been successfully identified by AuNP-based colorimetric sensor arrays developed by different research groups. Recently, we reported the qualitative and quantitative detection of biogenic amines for food analysis using a AuNP-based colorimetric chemosensor array. The AuNPs are functionalized with carboxylate derivatives [49], which capture target amines with electrostatic interactions and hydrogen bonds. Presumably, a colorimetric chemosensor array comprising AuNPs functionalized with proper targeting moiety may also be capable of determining oxyanions. In another study, a simple colorimetric chemical sensor array was designed for the quantitative determination of the herbicide glyphosate [50]; competitive coordinative bonding of a metal ion (Zn2+) occurred between a catechol dye and target anions, and the concentrations of targets were determined by the changes in the optical properties of the dye. However, catechol dye has a certain toxicity, is difficult to degrade under natural conditions and causes great harm to the human body and environment. It is listed as an environmental pollutant by many national environmental protection organizations. Therefore, it is necessary to establish a pollution-free and efficient method for detecting oxyanions.
We herein report a AuNP-based colorimetric chemosensor array for the detection of oxyanions. The chemical sensors (AET-AuNPs) were fabricated by AuNPs functionalized with aminothiols with different chain lengths for the naked-eye detection of 11 oxyanions. The chain length of functional groups was modified not only to detect target oxyanions at a wide range of concentrations but also to construct a sensor array generating a colorimetric fingerprint response pattern. The qualitative and quantitative detection was processed by chemometric methods, including a linear discriminant analysis (LDA) and a support vector machine (SVM). It is worth mentioning that the prepared chemosensor array demonstrated high determination accuracy for the herbicide glyphosate. Thus, the proposed strategy for building the chemosensor array represents a step forward for oxyanion analyses based on nanoparticle technology.

2. Materials and Methods

2.1. Reagents and Equipment

Glyphosate (Glyp), malonate (Mal), oxalate (Oxa), citrate (CA), adenosine monophosphate (AMP), adenosine diphosphate (ADP), adenosine triphosphate (ATP), 4-chlorophenoxyacetic acid (4-cpa), 2,4-dichlorobenzoate (2,4-dcba), salicylate, 2-amino pyrophosphate (PPI), 2-aminoethyl mercaptan (2-AET), 3-aminopropyl mercaptan (3-AET), 6-aminohexyl mercaptan (6-AET), MES sodium salt (MES) and hydrogen tetrachlorocuprate (III) trihydrate were purchased from Shanghai Titan Scientific Co., Ltd. (Shanghai, China). Sodium borohydride, nitric acid and sodium hydroxide were purchased from local suppliers. All chemicals and reagents were of analytical grade and used without further purification. The river water was collected from Lijiang River in Guilin, Guangxi. The ultrapure water used in all experiments was purified by asura-axlm1820 (resistivity 18.2 MΩ).
TEM and high-resolution TEM images of AuNPs were recorded on a 160 kV JEM-2100F. Fourier transform infrared (FT-IR) spectra were obtained using a Thermo Nexus 470 FT-IR instrument by grinding and tableting the sample with KBr. Thermogravimetric analysis was performed using a thermogravimetric analyzer (TGA, TA Q500, TA Instruments, New Castle, DE, USA) under N2 with a temperature ramp rate of 10 °C min−1 from 30 to 600 °C. Zeta potential experiments were performed on a Zeta-sizer 3000HS (Malvern Instruments, Malvern, UK) using the nontraumatic backscattering (NIBS) technique. UV–visible spectra measurements were obtained on a Lambda 365 UV–visible spectrometer (Perkin Elmer Instruments, Waltham, MA, USA). Colorimetric sensor array experiments were performed on a 96-well plate using a PowerWaveHT microplate spectrophotometer.

2.2. Synthesis of Surface-Functionalized Gold Nanoparticles

The preparation conditions of the AuNPs were selected according to a previous report [51]. All glassware was cleaned with concentrated HCl/HNO3 (3:1, v/v) and rinsed with distilled water. Briefly, 400 mL of 0.213 M different chain lengths of aminothiols and 40 mL of 1.40 mM HAuCl4·3H2O were mixed in a 100 mL glass vial. The mixture was stirred for 20 min at room temperature in dark conditions. Then, 10 μL of fresh NaBH4 solution (10 mM) was quickly added to the aforementioned aqueous solution with vigorous stirring, the mixture solution was further stirred for 30 min followed by a centrifugation treatment. Subsequently, the obtained solids were dispersed in MEA buffer (10 mM, pH = 5.5) to obtain a wine-red solution. Finally, the wine-red solution was filtered with 0.22 μM filter paper and stored in a refrigerator at 4 °C.

2.3. Measurement

We titrated the following 11 analytes: Glyp, Oxa, Mal, CA, PPI, AMP, ADP, ATP, 4-CPA, 2,4-DCBA and salicylate (A1–A11). The specific operation is as follows: After mixing 0.9 mL of the AET-AuNPs (pH = 5.5, MES = 10 mM) solution and 0.1 mL of analyte together in a cuvette, the resulting solution was incubated. UV–vis titration of oxyanions was implemented and recorded using a Lambda 365 UV–visible spectrometer. Responses of the sensor array upon addition of oxyanions were recorded using a PowerWaveHT enzyme marker.

2.4. Colorimetric Assay

The experiments for the qualitative and quantitative analysis of the colorimetric sensor array were carried out in 96-well plates and observed with a PowerWaveHT microwell spectrophotometer. The colorimetric response of eleven oxyanions with three sensor elements was tested and collected. The specific process is as follows: First, 180 μL of AET-AuNP solution (pH = 5.5, MES = 10 mM) was mixed with 20 μL of analytes (pH = 5.5). All solutions were prepared at room temperature. Response data from 400 nm to 800 nm were measured and recorded using the PowerWaveHT microplate reader. The array assay of each sample was repeated 24 times; the obtained spectral data were subjected to a T-test, and 4 abnormal data points were eliminated, resulting in the coefficient of variation of the last 20 repeated data points being less than 9%. In such a way, a multidimensional response model (3 sensors × 11 oxyanions × 20 repetitions) was constructed. Linear discriminant analysis (LDA) was used to perform qualitative and semiquantitative analysis. Support vector machine (SVM) was used to perform principal component analysis and automatic scaling preprocessing on the dataset. SYSTAT 13.0 and Solo software were used to perform statistical analysis on all data matrices.

3. Results

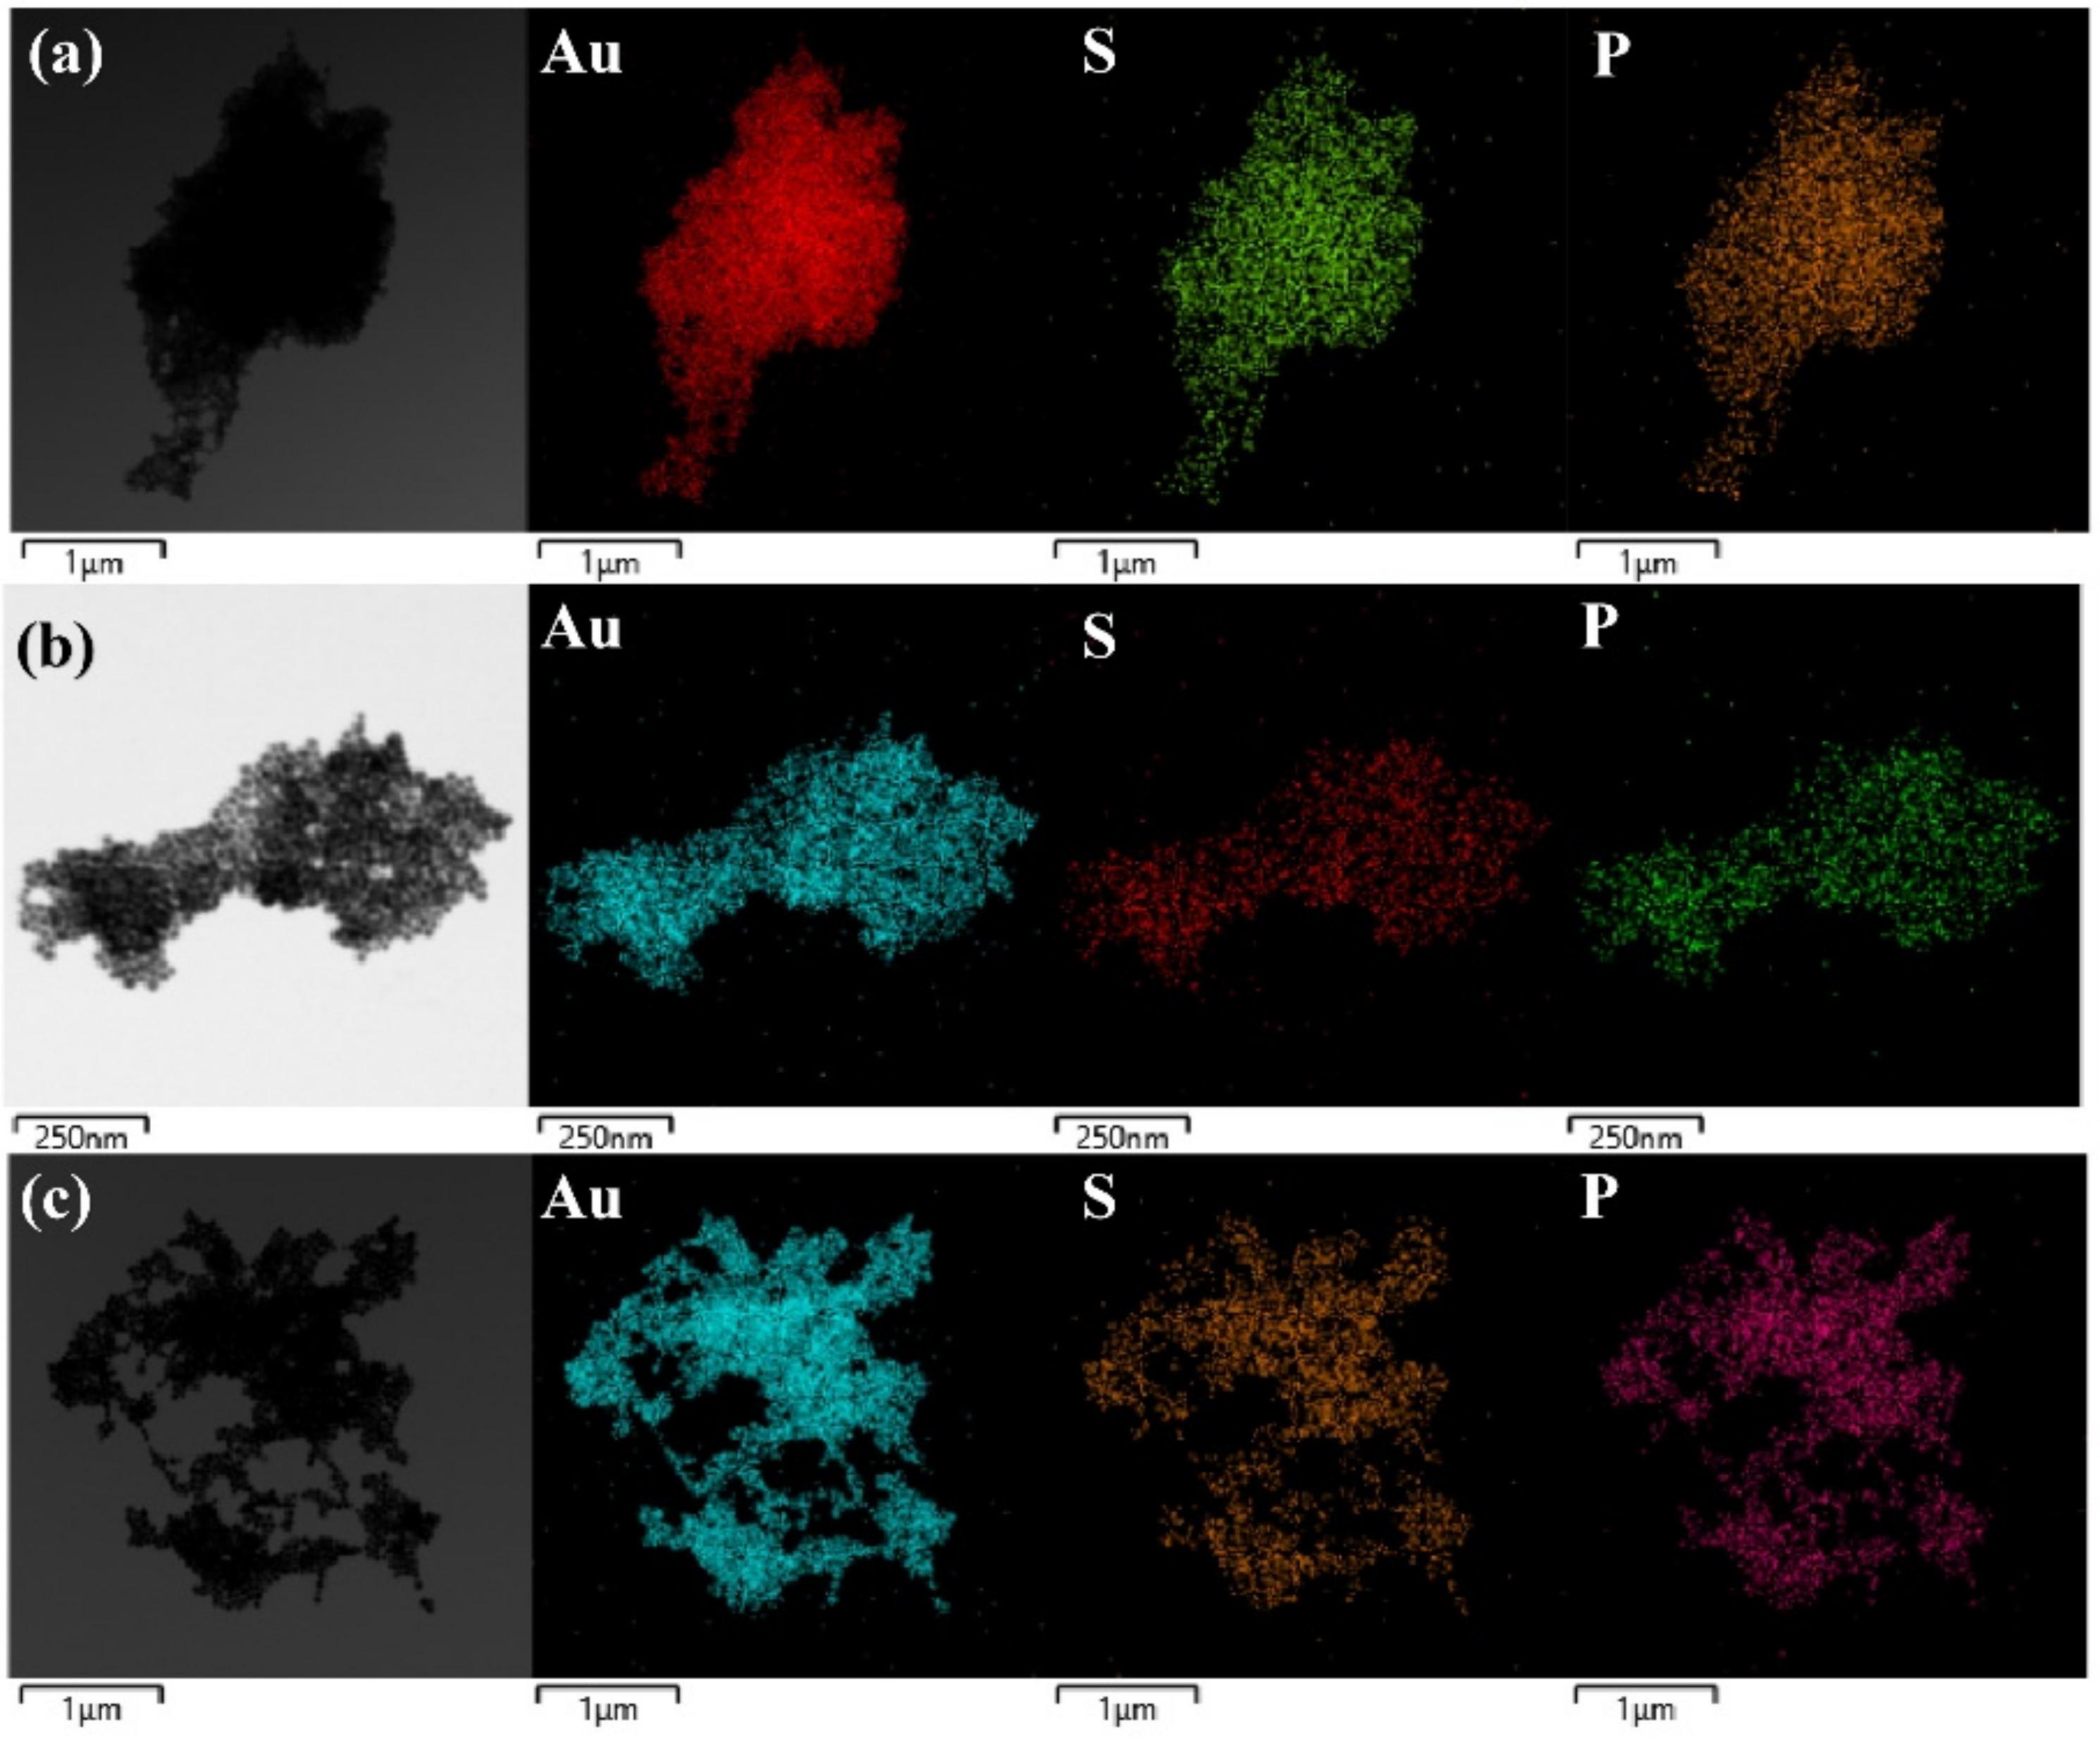
3.1. Structural Characterization of AET-AuNPs

In this work, we report a colorimetric sensor array comprising three sensors (S1–S3) that can simultaneously identify 11 analytes with good classification rates. Figure 1 shows the molecular structures of oxyanions, sensing elements and sensing diagram of the AET-AuNP colorimetric sensor array. The diameter, morphology and aggregation of nanoparticles were determined by dynamic light scattering (DLS) and transmission electron microscopy (TEM). The particle sizes of S1–S3 were 24.79 ± 1.7 nm, 28.36 ± 1.2 nm and 38.53 ± 0.85 nm (Figure 2a–c), respectively, and the morphology was spherical and uniform in size (Figure 2d–f). The colorimetric detection depended on the aggregation of S1–S3 with oxyanions, and thus the aggregation behaviors of the AET-AuNPs were investigated. The TEM results indicated that the addition of glyphosate induced the instant aggregation of sensors S1–S3 (Figure 2g–i). Meanwhile, the color of the solution changed from red to Cambridge blue (Figure 2g,h) or purple (Figure 2i). EDS confirmed that the binding events occurred between the oxyanions and aminothiols attached to the surface of AuNPs (Figure 3). The DLS result indicated that the diameter of S1 with glyphosate aggregate had been enlarged 77 times. Moreover, absorption peaks at 2501 cm−1 and 2550 cm−1 originated from the S-H stretching vibration band in FT-IR spectra (Figure 4).

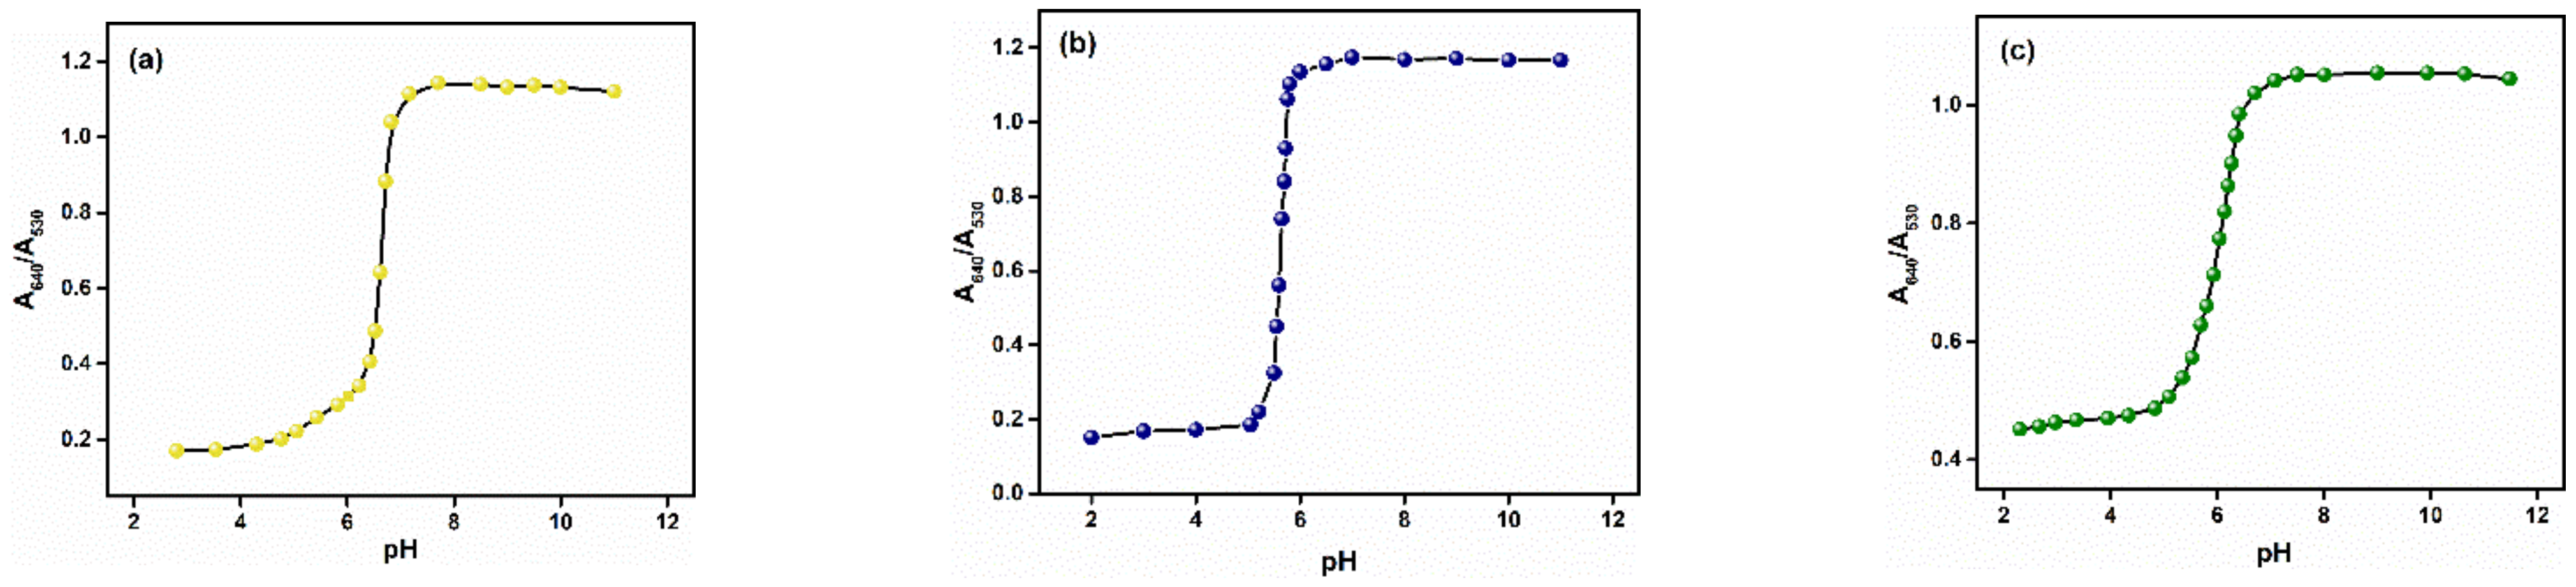
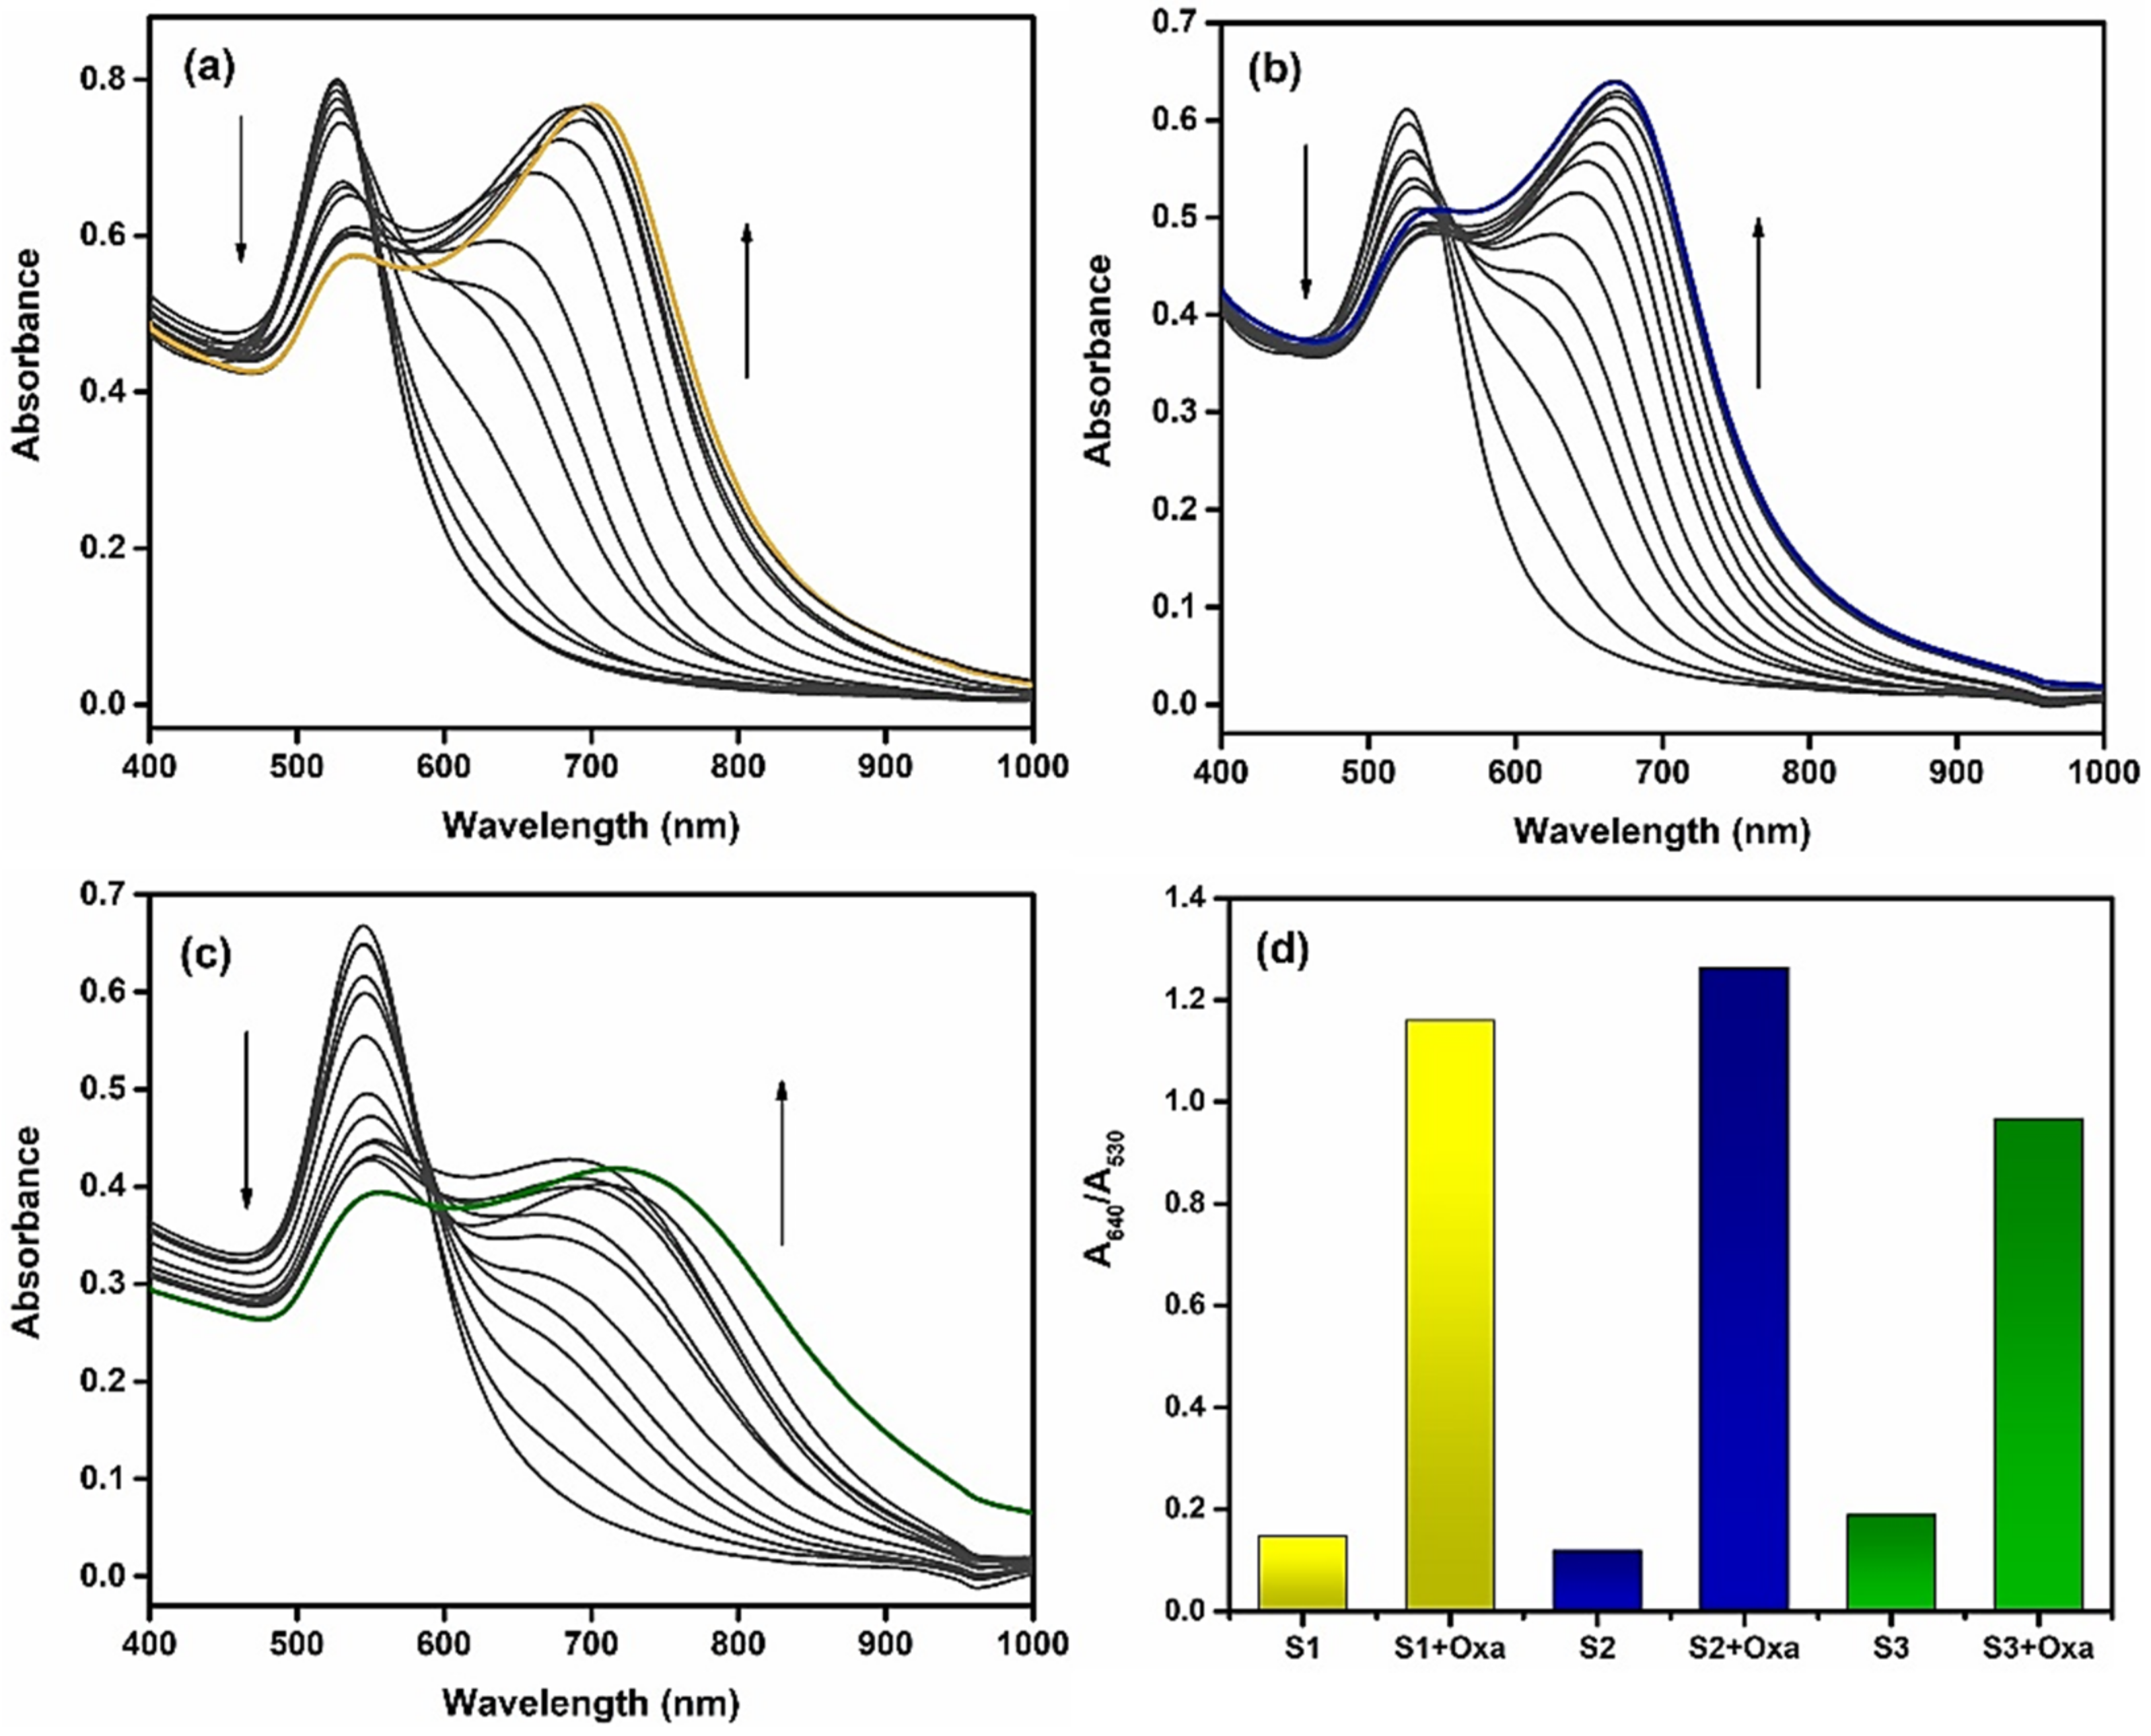
3.2. Development of the Oxyanion Sensor

Previous reports testified that both pH value and ionic strength drastically affect the aggregation of AuNPs. In order to determine the effect of pH on the prepared AET-AuNP sensors, we investigated the change in absorbance of gold nanoparticles in the pH range from 2 to 12. Figure 5 illustrates that the A640/A530 ratio of S1–S3 began to increase at pH 5.5; based on this result, pH 5.5 was determined as the optimal pH value in all sensor array assays. Next, we investigated the spectral changes of the prepared chemosensors in response to chemical stimuli in an aqueous solution by using UV–vis spectroscopy (Figures S4–S26, ESI). The absorption peaks of S1–S3 are 525 nm, 530 nm and 540 nm, respectively. Figure 6 shows drastic spectral shifts of S1–S3 in the presence of oxalate. With the addition of oxalate, the absorbance peak of S1–S3 undergoes a remarkable redshift from 530 nm to 640 nm. Notably, S1 and S2 exhibited relatively more sensitive responses to the target oxalate than S3, which suggested that the AuNPs with the shorter chain length of functional groups were more proper for designing more sensitive sensors. As shown in Figures S4–S26, the cross-reactivity of S1–S3 for A1–A11 confirmed that the prepared chemosensors are suitable for preparing a sensor array for simultaneous detection of multiple oxyanions.

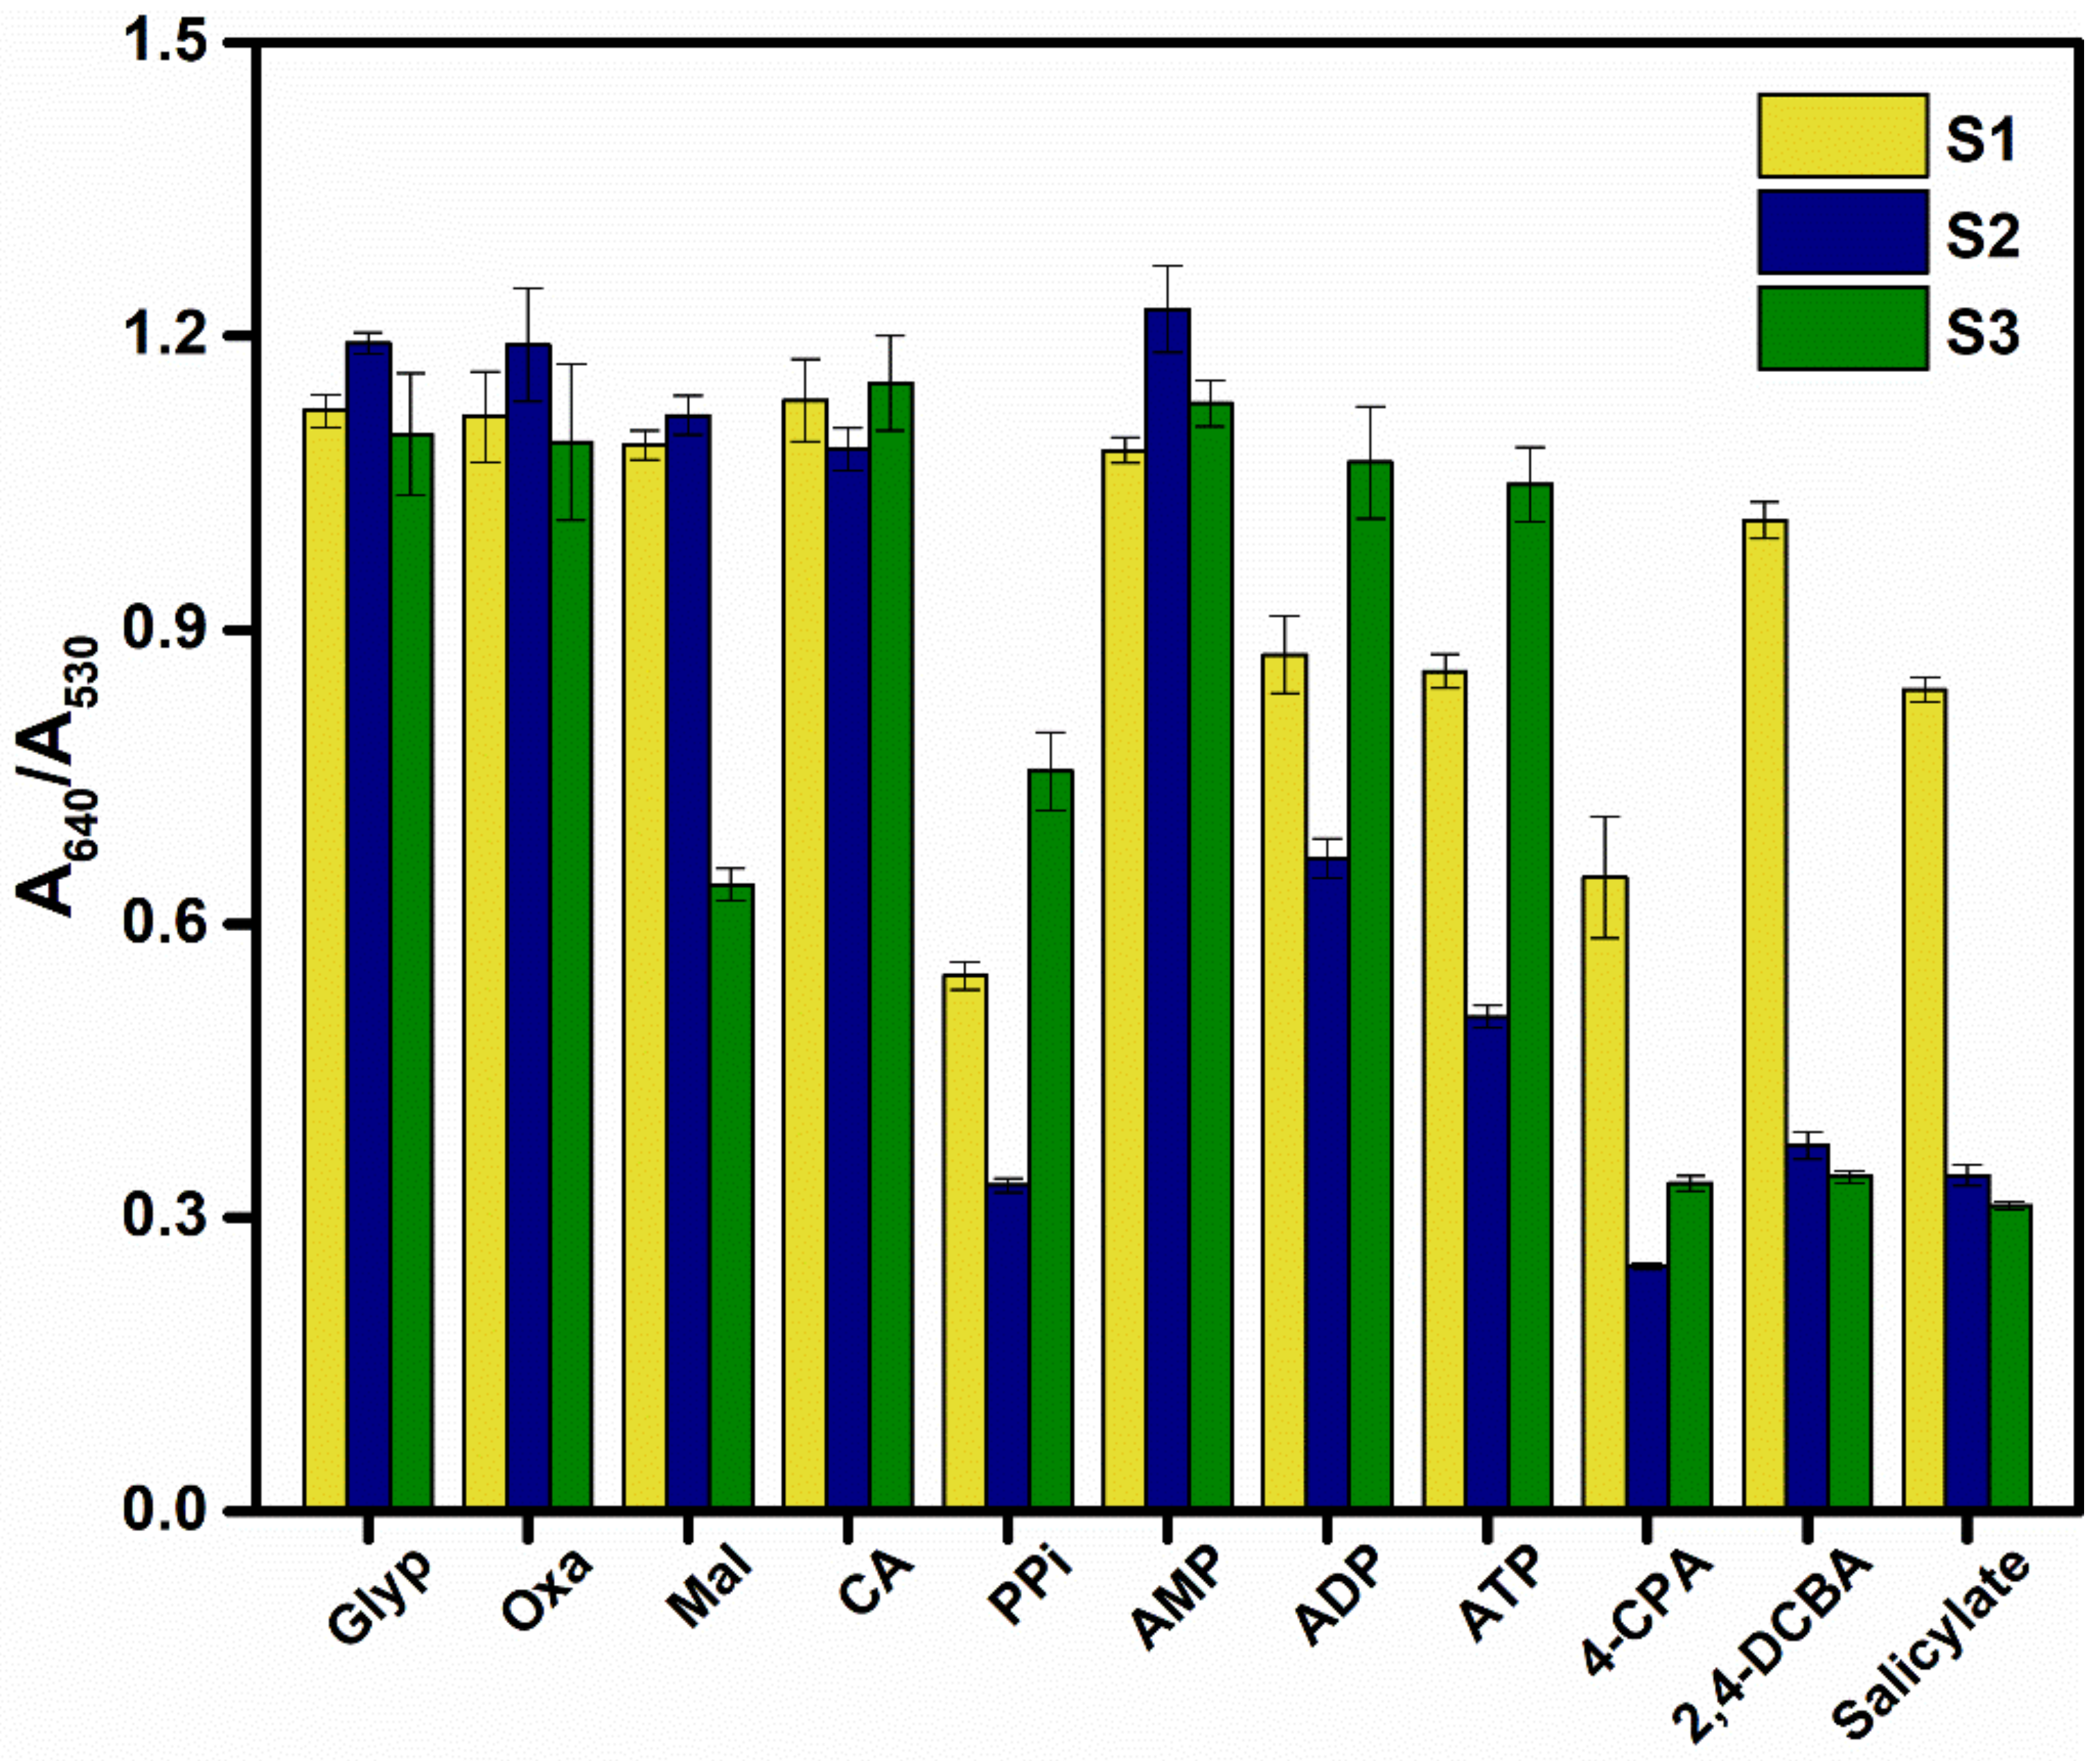
3.3. Multicomponent Analysis of Oxyanions

To illustrate the potential of the AET-AuNP-based chemosensors, we decided to fabricate a chemosensor array comprising S1–S3 for the simultaneous detection of oxyanions. The sensor array was prepared using a dispenser, and the absorbance spectra were recorded using a microplate spectrophotometer. Figure 7 shows the reactions of each sensor in the presence of oxyanions. As assumed, each oxyanion induced a distinctive change in absorbance of the individual sensors.
A multidimensional response data matrix was then created by compiling the (A1–A11) × (S1–S3) response data; the dataset included the recorded absorbance spectra of S1–S3 in the presence or absence of 11 analytes (oxyanions), and then 24 repetitions of each analyte (including four outlier data points) were carried out to evaluate the classification accuracy. Linear discriminant analysis (LDA) was employed to classify multiple oxyanions [52,53]. LDA is a commonly used supervised pattern recognition tool for reducing and classifying multivariate data. The leave-one-out cross-validation protocol (jackknife method) (see ESI) was employed to determine the correct classification of the analytes within the clusters. Figure 8 reveals the response space constructed with the first three standard factors (F1–F3). The three-dimensional LDA diagram obtained for the first three factors (F1 = 48%, F2 = 43.3%, F3 = 4.3%) shows that 11 oxyanions and the blank (240 data points in total) are clearly distinguished from each other, and 20 repeated experiments of the same oxyanions are basically concentrated together; jackknife cross-validation outputs of LDA show 100% correct classification (11 analytes and blank). This confirms that the AuNP-based chemical sensor array possesses a high potential for simultaneous detection of oxyanions in water.
After qualitatively identifying 11 oxyanions using quantitative analysis, we tested the quantitative analysis ability of the designed chemosensor array. Among oxyanions, glyphosate is usually used as an herbicide in agriculture; the overuse of Glyp may have adverse effects on animals and aquatic vegetation and may induce the proliferation of breast cancer in human beings. The nucleotide phosphate ATP plays important role in metabolism, bioenergetics and transfer of genetic information. Citrate possesses widespread biological function, notably its roles of antimicrobial action, metabolic regulation and mineralization regulation. We herein demonstrated a semiquantitative assay and simultaneous analysis of Glyp, CA and ATP by employing the AuNP-based chemosensor array. Figure 9 illustrates the clustering result with LDA and indicates the precise concentration-dependent classification. This confirmed the potential of the chemosensor array for quantitative analysis of oxyanions.
To further assess the quantitative detective ability of the prepared chemosensor array for three oxyanions in the mixtures, we implemented regression analysis by employing support vector machine (SVM) [54], which is a powerful machine learning algorithm. The calibration line can be built in mixtures to predict unknown samples. Figure 10 shows the quantitative prediction results of multiple concentrations of each oxyanion in a hybrid system. Here, we executed the SVM algorithm through the Solo software to classify the data obtained from 11 mixed concentrations. For analysis, we divided the obtained dataset into two parts; the first part was used for model construction and calibration, and the second part was used as an unidentified sample for cross-validation. Therefore, one-seventh of the concentrations (18% of the entire dataset) were analyzed as unknown concentrations using a developed model. This analysis routine was implemented for all concentrations (one by one). The accurate quantitative regression analysis proved that the developed chemosensor array with the aid of SVM is capable of predicting unknown concentrations of glyphosate, citrate and ATP, even in a hybrid system.

4. Conclusions

In conclusion, we developed a sensitive and low-cost colorimetric sensor array system based on the self-assembly of different chain lengths of aminothiols with nanoparticles for the detection of oxyanions. The as-prepared sensor array generates a fingerprint-like response originating from cross-reactive binding events with various oxyanions, including the herbicide glyphosate. Notably, the limit of detection of (LOD) for glyphosate reached 3.07 μg/mL, which is significantly higher than previous reports (Table S9 in ESI). With the aid of chemometric techniques, including linear discrimination analysis (LDA) and the support vector machine (SVM) algorithm for pattern classification and regression/prediction, the chemosensor array demonstrates a remarkable ability to detect multiple organic oxyanions in a both qualitative and quantitative manner. The described methodology can be used as a sensitive and fast routine analysis in both laboratory and field settings.

Supplementary Materials

The supporting information can be downloaded at: https://www.mdpi.com/article/10.3390/pr10071251/s1.

Author Contributions

All authors have read and agreed to the published version of the manuscript.

Funding

This research was funded by Guangxi Natural Science Foundation Program (2018GXNSFAA138131).

Acknowledgments

This work was supported by the Collaborative Innovation Center for Exploration of Hidden Nonferrous Metal Deposits and Development of New Materials in Guangxi.

Conflicts of Interest

The authors declare no conflict of interest.

References

  1. Chouyyok, W.; Wiacek, R.J.; Pattamakomsan, K.; Sangvanich, T.; Grudzien, R.M.; Fryxell, G.E.; Yantasee, W. Phosphate removal by anion binding on functionalized nanoporous sorbents. Environ. Sci. Technol. 2010, 44, 3073–3078. [Google Scholar] [CrossRef] [Green Version]
  2. Green, C.C.; Lochmann, S.E.; Straus, D.L. Acute toxicity of isopropyl methylphosphonic acid, a breakdown product of sarin, to eggs and fry of golden shiner and channel catfish. J. Toxicol. Environ. Health Part A 2005, 68, 141–149. [Google Scholar] [CrossRef] [PubMed]
  3. Steinrücken, H.C.; Amrhein, N. The herbicide glyphosate is a potent inhibitor of 5-enolpyruvyl-shikimic acid-3-phosphate synthase. Biochem. Biophys. Res. Commun. 1980, 94, 1207–1212. [Google Scholar] [CrossRef]
  4. Cerdeira, A.L.; Duke, S.O. The current status and environmental impacts of glyphosate-resistant crops: A review. J. Environ. Qual. 2006, 35, 1633–1658. [Google Scholar] [CrossRef] [PubMed]
  5. Cedergreen, N.; Ritz, C.; Streibig, J.C. Improved empirical models describing hormesis. Environ. Toxicol. Chem. 2005, 24, 3166–3172. [Google Scholar] [CrossRef] [PubMed]
  6. Guy, M.; Singh, L.; Mineau, P. Using field data to assess the effects of pesticides on crustacea in freshwater aquatic ecosystems and verifying the level of protection provided by water quality guidelines. Integr. Environ. Assess. Manag. 2011, 7, 426–436. [Google Scholar] [CrossRef] [PubMed]
  7. Stalikas, C.D.; Konidari, C.N. Analytical methods to determine phosphonic and amino acid group-containing pesticides. J. Chromatogr. A 2001, 907, 1–19. [Google Scholar] [CrossRef]
  8. Sato, K.; Jin, J.Y.; Takeuchi, T.; Miwa, T.; Suenami, K.; Takekoshi, Y.; Kanno, S. Integrated pulsed amperometric detection of glufosinate, bialaphos and glyphosate at gold electrodes in anion-exchange chromatography. J. Chromatogr. A 2001, 919, 313–320. [Google Scholar] [CrossRef]
  9. Yan, Z.; Zhang, F.; Tong, C.; Liu, W. Determination of glyphosate by ion chromatography. J. Chromatogr. A 1999, 850, 297–301. [Google Scholar]
  10. Hernández, F.; Hidalgo, C.; Sancho, J.V.; López, F.J. Coupled-column liquid chromatography applied to the trace-level determination of triazine herbicides and some of their metabolites in water samples. Anal. Chem. 1998, 70, 3322–3328. [Google Scholar] [CrossRef]
  11. Corbera, M.; Hidalgo, M.; Salvadó, V.; Wieczorek, P.P. Determination of glyphosate and aminomethylphosphonic acid in natural water using the capillary electrophoresis combined with enrichment step. Anal. Chim. Acta 2005, 540, 3–7. [Google Scholar] [CrossRef]
  12. Chang, S.Y.; Liao, C.H. Analysis of glyphosate, glufosinate and aminomethylphosphonic acid by capillary electrophoresis with indirect fluorescence detection. J. Chromatogr. A 2002, 959, 309–315. [Google Scholar] [CrossRef]
  13. Kowalski, B.R.; Bender, C.F. Pattern recognition. Powerful approach to interpreting chemical data. J. Am. Chem. Soc. 1972, 1, 5632–5639. [Google Scholar] [CrossRef]
  14. Rakow, N.A.; Suslick, K.S. A colorimetric sensor array for odour visualization. Nature 2000, 406, 710–713. [Google Scholar] [CrossRef]
  15. Lin, H.; Jang, M.; Suslick, K.S. Preoxidation for colorimetric sensor array detection of VOCs. J. Am. Chem. Soc. 2011, 133, 16786–16789. [Google Scholar] [CrossRef] [Green Version]
  16. Janzen, M.C.; Ponder, J.B.; Bailey, D.P.; Ingison, C.K.; Suslick, K.S. Colorimetric sensor arrays for volatile organic compounds. Anal. Chem. 2006, 78, 3591–3600. [Google Scholar] [CrossRef]
  17. Lin, H.; Suslick, K.S. A colorimetric sensor array for detection of triacetone triperoxide TATP vapor. J. Am. Chem. Soc. 2010, 132, 15519–15521. [Google Scholar] [CrossRef] [Green Version]
  18. Woodka, M.D.; Schnee, V.P.; Polcha, M.P. Fluorescent polymer sensor array for detection and discrimination of explosives in water. Anal. Chem. 2010, 82, 9917–9924. [Google Scholar] [CrossRef]
  19. Patil, S.J.; Duragkar, N.; Rao, V.R. An ultra-sensitive piezoresistive polymer nano-composite microcantilever sensor electronic nose platform for explosive vapor detection. Sens. Actuator B-Chem. 2014, 192, 444–451. [Google Scholar] [CrossRef]
  20. Li, X.; Kong, H.; Mout, R.; Saha, K.; Moyano, D.F.; Robinson, S.M.; Rotello, V.M. Rapid identification of bacterial biofilms and biofilm wound models using a multichannel nanosensor. ACS Nano 2014, 8, 12014–12019. [Google Scholar] [CrossRef] [Green Version]
  21. Carey, J.R.; Suslick, K.S.; Hulkower, K.I.; Imlay, J.A.; Imlay, K.R.C.; Ingison, C.K. Rapid identification of bacteria with a disposable colorimetric sensing array. J. Am. Chem. Soc. 2011, 133, 7571–7576. [Google Scholar] [CrossRef] [PubMed] [Green Version]
  22. De, M.; Rana, S.; Akpinar, H.; Miranda, O.R.; Arvizo, R.R.; Bunz, U.H.F.; Rotello, V.M. Sensing of proteins in human serum using conjugates of nanoparticles and green fluorescent protein. Nat. Chem. 2009, 1, 461–465. [Google Scholar] [CrossRef] [PubMed]
  23. You, C.C.; Miranda, O.R.; Gider, B.; Ghosh, P.S.; Kim, I.B.; Erdogan, B.; Rotello, V.M. Detection and identification of proteins using nanoparticle-fluorescent polymer ‘chemical nose’ sensors. Nat. Nanotechnol. 2007, 2, 318–323. [Google Scholar] [CrossRef]
  24. Wu, P.; Ming, L.N.; Wang, H.F.; Shao, X.G.; Yan, X.P. A multidimensional sensing device for the discrimination of proteins based on manganese-doped ZnS quantum dots. Angew. Chem.-Int. Edit. 2011, 50, 8118–8121. [Google Scholar] [CrossRef] [PubMed]
  25. Pei, H.; Li, J.; Lv, M.; Wang, J.; Gao, J.; Lu, J.; Fan, C.A. Graphene-based sensor array for high-precision and adaptive target identification with ensemble aptamers. J. Am. Chem. Soc. 2012, 134, 13843–13849. [Google Scholar] [CrossRef]
  26. Le, N.D.B.; Tonga, G.Y.; Mout, R.; Kim, S.T.; Wille, M.E.; Rana, S.; Dunphy, K.A.; Jerry, J.; Yazdani, M.; Ramanathan, R.; et al. Cancer cell discrimination using host-guest “doubled” arrays. J. Am. Chem. Soc. 2017, 139, 8008–8012. [Google Scholar] [CrossRef]
  27. Rana, S.; Elci, S.G.; Mout, R.; Singla, A.K.; Rotello, V.M. Ratiometric array of conjugated polymers-fluorescent protein provides a robust mammalian cell sensor. J. Am. Chem. Soc. 2016, 138, 4522–4529. [Google Scholar] [CrossRef] [Green Version]
  28. Geng, Y.; Peveler, W.J.; Rotello, V.M. Array-based “chemical nose” sensing in diagnostics and drug discovery. Chem.-Int. Edit. 2019, 58, 5190–5200. [Google Scholar] [CrossRef] [Green Version]
  29. Dragonieri, S.; Schot, R.; Mertens, B.J.A.; Le Cessie, S.; Gauw, S.A.; Spanevello, A.; Rabe, K.F. An electronic nose in the discrimination of patients with asthma and controls. J. Allergy Clin. Immunol. 2007, 120, 856–862. [Google Scholar] [CrossRef] [Green Version]
  30. Turner, A.P.E.; Magan, N. Electronic noses and disease diagnostics. Nat. Rev. Microbiol. 2004, 2, 161–166. [Google Scholar] [CrossRef]
  31. Rana, S.; Le, N.D.B.; Mout, R.; Saha, K.; Rotello, V.M. A multichannel nanosensor for instantaneous readout of cancer drug mechanisms. Nat. Nanotechnol. 2015, 10, 65–69. [Google Scholar] [CrossRef]
  32. Schaller, E.; Bosset, J.O.; Escher, F. ‘Electronic noses’ and their application to food. LWT-Food Sci. Technol. 1998, 31, 305–316. [Google Scholar] [CrossRef] [Green Version]
  33. Peris, M.; Escuder-Gilabert, L. A 21st century technique for food control: Electronic noses. Anal. Chim. Acta 2009, 638, 1–15. [Google Scholar] [CrossRef]
  34. Loutfi, A.; Coradeschi, S.; Mani, G.K.; Shankar, P.; Rayappan, J.B.B. Electronic noses for food quality: A review. J. Food Eng. 2015, 144, 103–111. [Google Scholar] [CrossRef]
  35. Schiller, A.; Wessling, R.A.; Singaram, B. A fluorescent sensor array for saccharides based on boronic acid appended bipyridinium salts. Angew. Chem.-Int. Edit. 2007, 46, 6457–6459. [Google Scholar] [CrossRef]
  36. Suslick, K.S.; Rakow, N.A.; Sen, A. Colorimetric sensor arrays for molecular recognition. Tetrahedron 2004, 60, 11133–11138. [Google Scholar] [CrossRef]
  37. Saha, K.; Agasti, S.S.; Kim, C.; Li, X.; Rotello, V.M. Gold nanoparticles in chemical and biological sensing. Chem. Rev. 2012, 112, 2739–2779. [Google Scholar] [CrossRef] [PubMed] [Green Version]
  38. Zhao, W.; Brook, M.A.; Li, Y. Design of gold nanoparticle-based colorimetric biosensing assays. ChemBioChem 2008, 9, 2363–2371. [Google Scholar] [CrossRef]
  39. Boisselier, E.; Astruc, D. Gold nanoparticles in nanomedicine: Preparations, imaging, diagnostics, therapies and toxicity. Chem. Soc. Rev. 2009, 38, 1759–1782. [Google Scholar] [CrossRef] [PubMed]
  40. Haes, A.J.; Zou, S.; Schatz, G.C.; Duyne, R. Nanoscale optical biosensor:  short range distance dependence of the localized surface plasmon resonance of noble metal nanoparticles. J. Phys. Chem. B 2004, 108, 6961–6968. [Google Scholar] [CrossRef]
  41. Link, S.; El-Sayed, M.A. Size and temperature dependence of the plasmon absorption of colloidal gold nanoparticles. J. Phys. Chem. B 1999, 103, 4212–4217. [Google Scholar] [CrossRef]
  42. Lin, T.; Wu, Y.; Li, Z.; Song, Z.; Guo, L.; Fu, F.F. Visual monitoring of food spoilage based on hydrolysis-induced silver metallization of Au nanorods. Anal. Chem. 2016, 88, 11022–11027. [Google Scholar] [CrossRef]
  43. Ghasemi, F.; Hormozi-Nezhad, M.R.; Mahmoudi, M. A colorimetric sensor array for detection and discrimination of biothiols based on aggregation of gold nanoparticles. Anal. Chim. Acta 2015, 882, 58–67. [Google Scholar] [CrossRef] [PubMed]
  44. Li, B.; Li, X.; Dong, Y.; Wang, B.; Li, D.; Shi, Y.; Wu, Y. Colorimetric sensor array based on gold nanoparticles with diverse surface charges for microorganisms identification. Anal. Chem. 2017, 89, 10639–10643. [Google Scholar] [CrossRef] [PubMed]
  45. Jafarinejad, S.; Ghazi-Khansari, M.; Ghasemi, F.; Sasanpour, P.; Hormozi-Nezhad, M.R. Colorimetric fingerprints of gold nanorods for discriminating catecholamine neurotransmitters in urine samples. Sci. Rep. 2017, 7, 8266. [Google Scholar] [CrossRef] [Green Version]
  46. Fahimi-Kashani, N.; Hormozi-Nezhad, M.R. Gold-nanoparticle-based colorimetric sensor array for discrimination of organophosphate pesticides. Anal. Chem. 2016, 88, 8099–8106. [Google Scholar] [CrossRef]
  47. Wei, X.; Chen, Z.; Tan, L.; Lou, T.; Zhao, Y. DNA-catalytically active gold nanoparticle conjugates-based colorimetric multidimensional sensor array for protein discrimination. Anal. Chem. 2016, 89, 556–559. [Google Scholar] [CrossRef] [Green Version]
  48. Wei, X.; Wang, Y.; Zhao, Y.; Chen, Z. Colorimetric sensor array for protein discrimination based on different DNA chain length-dependent gold nanoparticles aggregation. Biosens. Bioelectron. 2017, 97, 332–337. [Google Scholar] [CrossRef]
  49. Du, L.L.; Lao, Y.J.; Sasaki, Y.; Lyu, X.J.; Gao, P.; Wu, S.; Tsuyoshi, M.; Liu, Y.L. Freshness monitoring of raw fish by detecting biogenic amines using a gold nanoparticle-based colorimetric sensor array. RSC Adv. 2022, 12, 6803–6810. [Google Scholar] [CrossRef]
  50. Hamedpour, V.; Sasaki, Y.; Zhang, Z.; Kubota, R.; Tsuyoshi, M. Simple colorimetric chemosensor array for oxyanions: Quantitative assay for herbicide glyphosate. Anal. Chem. 2019, 91, 13627–13632. [Google Scholar] [CrossRef]
  51. Zheng, J.; Zhang, H.; Qu, J.; Zhu, Q.; Chen, X. Visual detection of glyphosate in environmental water samples using cysteamine-stabilized gold nanoparticles as colorimetric probe. Anal. Methods 2013, 5, 917–924. [Google Scholar] [CrossRef]
  52. Anzenbacher, P.; Lubal, P.; Buček, P.; Palacios, M.A.; Kozwlkova, M.E. A practical approach to optical cross-reactive sensor arrays. Chem. Soc. Rev. 2010, 39, 3954–3979. [Google Scholar] [CrossRef] [PubMed]
  53. Askim, J.R.; Mahmoudi, M.; Suslick, K.S. Optical sensor arrays for chemical sensing: The optoelectronic nose. Chem. Soc. Rev. 2013, 42, 8649–8682. [Google Scholar] [CrossRef] [PubMed] [Green Version]
  54. Minami, T.; Esipenko, M.A.; Akdeniz, A.; Zhang, B.; Isaacs, L.; Anzenbacher, P. Multianalyte sensing of addictive over-the-counter (OTC) drugs. J. Am. Chem. Soc. 2013, 135, 15238–15243. [Google Scholar] [CrossRef] [Green Version]
Figure 1. Molecular structures of oxyanion analytes (A1–A11) and AET–AuNP sensors (a); diagram of colorimetric sensor array and oxyanion detection principles (b).
Processes 10 01251 g001
Figure 2. (ac) The histograms of the nanoparticle diameter measured from DLS for S1–S3 (red) and with glyphosate (blue); TEM images of AET-AuNPs chemical sensors S1–S3 (df) and the aggregation state in the presence of 5 mM of glyphosate (gi).
Processes 10 01251 g002
Figure 3. EDS of AET–AuNP chemical sensors S1 (a), S2 (b) and S3 (c) in the presence of 5 mM of glyphosate particles. Au, S, P represents the EDS mapping of AuNP, AET–AuNP and AET-AuNP mixed with glyphosate, respectively.
Processes 10 01251 g003
Figure 4. FT-IR spectra of AET-AuNP chemical sensors S1 (a), S2 (b) and S3 (c) dispersions (red) and aggregates (black) in the presence of 5 mM glyphosate (KBr pellet).
Processes 10 01251 g004
Figure 5. The changes in UV–vis spectra of chemosensors S1 (a), S2 (b) and S3 (c) in MES buffer solution (10 mM 25 °C) in the pH range of 2–12.
Processes 10 01251 g005
Figure 6. The changes in UV–vis spectra of chemosensors S1 (a), S2 (b) and S3 (c) upon the addition of oxalate in a 10 mM MES buffer solution (pH 5.5, 25 °C). (d) Absorbance ratio (A640 nm/A530 nm) of oxalate; UV–vis spectra measured in a 10 mM MES buffer solution (pH 5.5, 25 °C).
Processes 10 01251 g006
Figure 7. Colorimetric sensor response of AuNPs (S1–S3) for 11 oxyanions; error bars reflect the standard deviations of 20 replicates of each sensor–oxyanion pair.
Processes 10 01251 g007
Figure 8. LDA plots for the data matrix of the response of the chemosensor array to 11 analytes and blank in MES buffer (10 mM). (analyte) = 5 mM; 20 repetitions for each analyte were measured. Cross-validation routine shows 100% correct classification.
Processes 10 01251 g008
Figure 9. LDA plot of the semiquantitative assay for three different oxyanions (Glyp, CA and ATP); 20 repetitions for each concentration were measured.
Processes 10 01251 g009
Figure 10. Regression analysis for quantitative estimation of oxyanion concentrations of Glyp, CA and ATP in mixtures (in 10 mM of MES buffer). Detailed concentrations are summarized in SI. Plots of actual concentrations versus predicted concentrations show high prediction accuracy for multiple concentrations of each analyte. Root-mean-square errors (RMSEs) of calibration (C) and prediction (P) attest to the high quality of the model and prediction.
Processes 10 01251 g010
Publisher’s Note: MDPI stays neutral with regard to jurisdictional claims in published maps and institutional affiliations.

