Article

Numerical Study of Factors Affecting Particle Suction Efficiency of Pick-Up Head of a Regenerative Air Vacuum Sweeper

by
Jamshid Valiev Fayzullayevich
1,2,
Gangfeng Tan
1,2,*,
Frimpong J. Alex
1,2,3,
Yongjia Wu
4 and
Philip K. Agyeman
1,2,5
1
School of Automotive Engineering, Wuhan University of Technology, Wuhan 430070, China
2
Hubei Key Laboratory of Advanced Technology of Automotive Components, Wuhan University of Technology, Wuhan 430070, China
3
Department of Mechanical Engineering, Faculty of Engineering, Kumasi Technical University, Kumasi 00233, Ghana
4
School of Civil Engineering and Architecture, Wuhan University of Technology, Wuhan 430070, China
5
Mechanical Engineering Department, College of Engineering, KNUST, Kumasi 00233, Ghana
*
Author to whom correspondence should be addressed.
Processes 2022, 10(7), 1252; https://doi.org/10.3390/pr10071252
Submission received: 18 May 2022 / Revised: 2 June 2022 / Accepted: 16 June 2022 / Published: 23 June 2022

Abstract

:
The influence of variable operational conditions affects the performance of particle collection and separation of a regenerative air vacuum sweeper. Therefore, the purpose of this paper was to numerically investigate the factors affecting the particle suction efficiency of the pick-up head. Using computational fluid dynamics (CFD), a model of an integrated pick-up head was developed based on the particle suction process to evaluate the particle removal performance. The realizable k-ε and discrete particle models were utilized to study the gas flow field and solid particle trajectories. The particle structure, sweeping speed, secondary airflow, pressure drop, and distance between the particle suction port and the road surface, as factors that affect the particle removal efficiency, were investigated. The results indicate that the particle suction efficiency increases with decreasing sweeper speed. Furthermore, the particle overall removal efficiency increased with a reduction in the distance between the suction port and the road surface as well as the control of the secondary airflow in the system. By increasing the airflow rate at the suction port, high efficiencies were achieved at a high sweeper speed and high particle densities. At a sweeper speed of 6–10 km/h, the results showed that the secondary airflow recirculation varied between 60 to 80 %, while the high-pressure drop ranged from 2200 to 2400 Pa, and the particle suction efficiency recorded was 95%. The numerical analysis results provide a better understanding of the particle suction process and hence could lead to an improvement in the design of the pick-up head.

1. Introduction

The deterioration of environmental conditions leads to pollution from natural disasters or sandstorms in various cities. The environment and streets need to be clean so that dust and particles do not negatively affect human health. Recently, climate change has led to increased dust particles being spread by strong winds on city streets, which then result in mud being deposited on road surfaces and in water supply systems during excessive rain. Maintaining clean streets and preventing blockages are important in this process. Cleaning the streets in larger cities involves many people and technologies, which leads to high costs [1,2]. Full automation of dust and particle control is a means of protecting the environment [3]. Usage of a high-efficiency regenerative air sweeper in the cleaning of urban streets prevents the spread of dust particles in the environment and effectively removes waste from the streets [4]. The sweeping suction head, which picks up the dust particles and returns the airflow to the system, is an important part of the regenerative air vacuum sweeper [5]. There are different types of particles and debris on the road surfaces, so high-efficiency road cleaners are needed to completely collect these particles.
Many researchers have contributed to evaluating and improving the efficiency of road cleaners in removing particulates [6,7,8,9]. The numerical study of the factors influencing the particle removal efficiency has been performed in [10,11]. There is evidence that particle suction can be affected by particle structure, pressure drop, and sweeper-traveling speed difference [7,10,12]. A structural change in particles can result in increased mass, which in turn impacts the vacuum power of the sweeper [13,14]. By changing the airflow rate and pressure of different inlet ducts in the centrifugal blower, it is possible to increase the particle assimilation efficiency as a result of changing the particle structure [15]. The air pressure in the pick-up head chamber changes with the diameter of the particle assimilation port, which also affects the effectiveness of the particle assimilation [8,16,17]. Measurement of the particle image speed and quality flow visualization are crucial to determining the flow areas inside the collection head of the vacuum cleaner [18]. The ability to change the flow paths inside the collection head must be evaluated to improve the performance of the vacuum system.
It is important for the suction channel to have a certain airflow rate when dust and particles are present on the road surface. This rate depends on the structure of the particles. The particle size and shape structure have very considerable effects on road dust collection [19]. A measurement of the minimum collection rate during a particle size change can provide insight into the initial rate of particle pick-up [20]. With the help of a specially adapted device for measuring the collection rate of particles, and by altering the particle composition and assimilation port diameter [21,22], the factors affecting the velocity of particles on the road surface can be identified. Kalman et al. [23] determined the effect of the lifting force of the particles and the rotation speed on the removal rate during particle collection. Through an experimental study of dust removal efficiency, Hu et al. [24] found that changes in the dust structure affect the suction efficiency. The particle composition was changed consequently to establish an empirical correlation for particles through experiments. A theoretical model based on the equilibrium of forces leading to displacement was applied, and technology was developed to find the minimum separation rate of solid particles in horizontal pneumatic conveying by analyzing the fluid motion of particles [25,26]. Analyses and experimental studies of gas flow during assimilation have probed the impact of particle sizes and density on velocity [27,28].
As the direction of particle movement is analyzed based on empirical analysis of particle dispersion and sinking from a point source in channel flow, the empirical profile of the average velocity and experimental data pertaining to the intensity of turbulence are used to determine the direction of particles [29]. It is important to develop a method to estimate the velocity of particles’ movement and removal from the regenerative air vacuum cleaner. The engineers usually pay attention to the following parameters to evaluate whether the particles are being removed efficiently from the collection head: sweeping speed and pressure drop at the collection head [10,30,31]. In addition to experiments, many researchers have looked at the particle removal efficiency and trajectory of airflow movement in the inlet and outlet ducts of a CFD pick-up head. Simulations were performed to analyze the flow area distribution and dust particle trajectory [32,33]. The Euler–Lagrange method is effective for determining the efficiency of the pick-up head particle removal [6,34]. The Reynolds stress model (RSM) and discrete particle model (DPM) can be used to predict the airflow and particle motion with accuracy [7,35,36]. To achieve a reliable solution in the research, it is advisable to compare it to other methods. Using the hybrid method, Ullah et al. [37] performed the calculation of the solutions of the degenerated uncertain Volterra integral equations. Gul et al. [38] studied the problem of fractions in the sense of Caputo in modeling spatial effects in engineering and ecology. Lei et al. [39] used CFD to study whether or not a dust explosion occurs in a dry dust collector connected to the dust cleaning pipes. Zhaowen et al. [40] performed an analysis of the flow field, and a numerical calculation of the k- ε turbulence model was applied to develop a sweep nozzle model that was highly effective at cleaning. Gilbert and Xi et al. [7,41] modeled an accelerating one-dimensional gas flow with a constant velocity gradient and Stokes flow by the motion equation, resulting in a significant optimization of the particle collection head structure. Ye et al. [42] achieved high efficiency when using a Realizable turbulent model in the process of analyzing the efficiency of particle collection through the suction port. By analyzing the qualitative and convergent characteristics, the effectiveness of the results can normally be evaluated. Sher et al. [43] conducted a qualitative and convergence analysis of the model under consideration in the process of computational and theoretical modeling of the distribution dynamics of aerosol particles compared to novel coronavirus. Through simulation and experimental measurement of the trajectory of dust particles moving through a particle collector, Zeng et al. [44] developed a high-efficiency particle collection head model.
Many researchers have researched the optimization of the particle collection head of vacuum cleaners, but they have not sufficiently studied the factors affecting the suction efficiency of the particle pick-up head of a regenerative air vacuum sweeper, or the effect of changes in particle type and structure on the suction efficiency of particles and the initial velocity of particles. During the sweeper operation, this study aims to evaluate the factors that affect dust particle efficiency and to develop a pick-up head model with high suction efficiency of particles at speeds of between 6 and 18 km/h. By determining the effect of changing the air pressure in the pick-up head chamber on the efficiency of particle collection and by evaluating the effect of the distance between the suction mouth and the road surface on particle collection efficiency, the objectives of the project are to evaluate the initial velocity of particles by simulation and experiment. To measure the suction efficiency of particles and to predict the direction of airflow, the discrete particle model (DPM) uses the commercial CFD code (ANSYS-FLUENT). The results were compared to the experimental results. A simulation analysis of the flow field at different values and gravitational forces was performed to optimize the pick-up head using a single experimental design method. A number of parameters were taken into account during the initial design.

2. Numerical Model

The regenerative sweeping suction head was designed using the ANSYS 2020R1 CFD commercial code to calculate the factors that affect suction efficiency by determining the airflow trajectory of the airflow through the suction and inlet ducts. The simulation objectives are as follows:
  • To study the direction of particle movement by observing the particle trajectory in the suction port of the pick-up head.
  • To observe the airflow direction and the factors affecting airflow through the inlet channels of the pick-up head.
  • To increase the absorption efficiency of suction dust particles by detecting the movement of ambient airflow in the direction of the suction port.

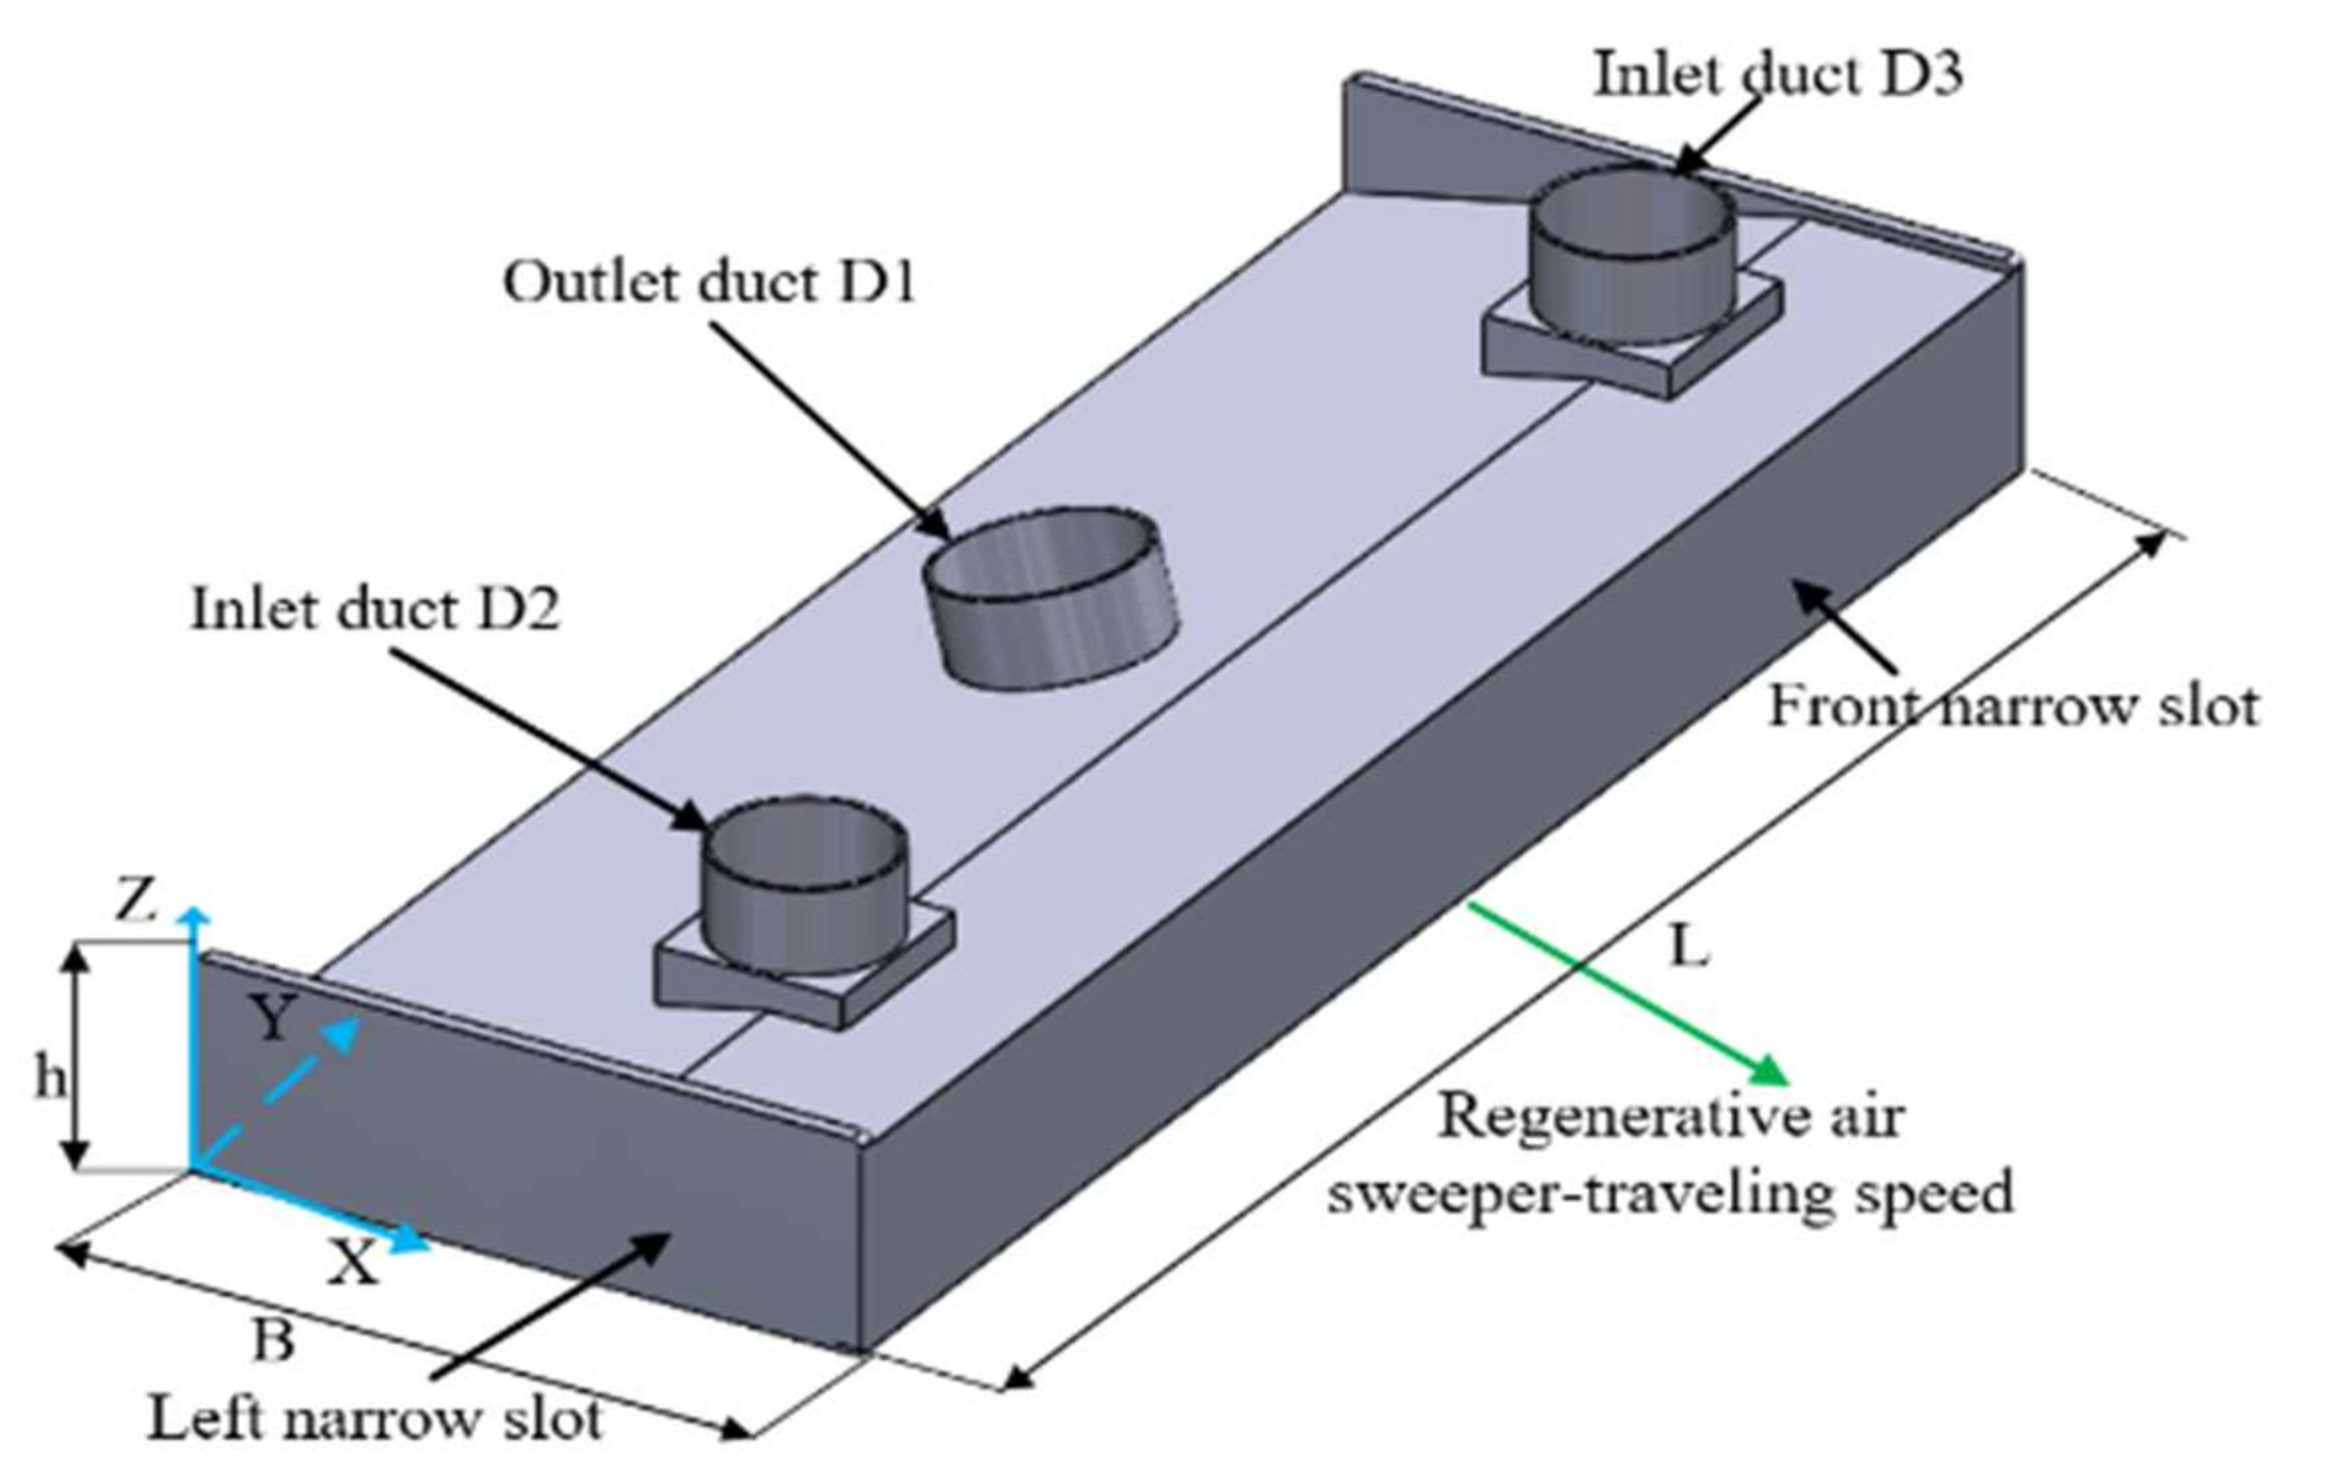
2.1. Structural Parameters of the Pick-Up Head for Dust Extraction

Typically, for sweepers with regenerative air, the pick-up head must ensure complete circulation of the airflow in the system. It is imperative for the pick-up head to ensure the system airflow is returned to the system as well as the extraction of debris and particles from the road surface. The most effective method of determining the efficiency of the pick-up head’s assimilation performance involves analyzing the CFD simulation results of the designed pick-up head [10]. The creation of meshes in computational fluid dynamics (CFD) plays an important role in increasing the accuracy and efficiency of numerical simulation [9]. CFD can provide a brief understanding of the improved pick-up head model in the first phase by determining the airflow paths in the inlet and outlet ducts [11]. The preliminary data of the pick-up head are shown in Table 1, and the physical model of the pick-up head is shown in Figure 1.

2.2. Mathematical Model

2.2.1. Equation for the Flow Field

The airflow rate through the regenerative air suction system was calculated using governing equations. Although the airflow was turbulent at high Reynolds numbers, it was not a strong rotational flow. The trajectories of the airflow can be simulated with the CFD software using appropriate mathematical models of the flow field conditions such as track, velocity, and pressure. Taking into account incompressible and steady flow, the Reynolds-averaged Navier–Stokes equations can be written as follows [7,45]:
Continuity :   u i x i = 0
where u i is the airflow velocity along with the coordinate x i .
Momentum conservation equation:
x j ρ u i u j = P x i + x j μ u i x j + T i j + ρ g i
where ρ , P, and μ are the fluid density, pressure, and viscosity, respectively. g i is the gravity acceleration, x j is the Cartesian coordinate components, u i is the time-averaged air velocity, and T i j = p u i u j ′ is the Reynolds stress tensor, which represents the turbulent fluctuations of airflow.
Two-equation turbulence models for flow field simulation are widely used in engineering applications. The two equation models are complete, i.e., non-existent additional equations are needed to model turbulence; and both depend on the Boussinesq assumption. The selection of turbulence models to predict the properties of the flow field depends on the physical model used [9,10]. To accurately describe the turbulent motion of the air stream, a k–ε model that could be performed to study the turbulent effects was used, especially for strong circulating airflow.
The turbulence energy transfer equation is given by
ρ d k d t = x j μ + ε m σ k k x j + G k ρ ε
where k is the turbulent kinetic energy, σ k is the Prandtl–Schmidt number of the turbulent kinetic energy, ε is the turbulent kinetic energy dissipation, and G k is the turbulent kinetic energy production.
The turbulent flow energy dissipation rate transmission equation is
ρ d ε d t = x j μ + ε m σ ε k x j + C 1 ε ε k G k C 2 ε ρ ε 2 k
where   G k = ρ u i u j u i x j is the turbulent kinetic energy production, and the constants are σ k = 1.0 , C 1 ε = 1.44 , C 2 ε = 1.92 ,   and   σ ε = 1.3   [6,7,10].

2.2.2. Discrete Phase Modeling

The Euler–Lagrange approach was used to predict the trajectories of particles within the regenerative air vacuum cleaner system. The airflow and particles were treated as continuous and dispersed phases, respectively. The continuous phases were described using Navier–Stokes equations. A discrete phase model (DPM) was used to describe the physical properties of the particles since the volume fraction was less than 10% [6,7].
The equation for the equilibrium of forces, based on Newton’s second law, can be written as follows [9,10]:
m p d U p d t = F d + F g + F s
where m p is the particle mass, U p is the particle velocity, F d is the drag force, F g is the gravitational force, and F s is the particle lifting force.
The drag force F d can be written in terms of the drag coefficient, C D , as follows [11,46]:
F d = 18 μ ρ ρ d ρ 2 C D R e 24 m ρ U U ρ
where ρ ρ is the particle density, d p is the particle diameter, and R e   is the relative Reynolds number, considering the particle shape. The drag coefficient C D   is defined by the correlations developed by Haider [47].
The gravitational force F g can be written as [7,10]:
F g = m ρ 1 ρ / ρ g g
The drag coefficient can be obtained from [27,28,47]:
C D = ( 2.25 R e 0.31 + 0.36 R e 0.06 ) 3.45
The free-floating velocity of a spherical object can be known. The floating velocities of spheres in different fluid ranges are different. This region is the pressure difference drag zone because the larger particles are inhaled.
The particle lifting force F s can be written as [6,9,10]:
F s = 2 K v 0.5 ρ d i j ρ p d p ( d l k d k l ) 0.25 U U p
where ρ p   and d p   are the density and diameter of the particle, respectively; U is the air velocity; v is the kinematic velocity; d i j   is the deformation tensor; and the constant is K = 2.594 [10,48,49].
The Reynolds number for a spherical particle is given by [6,50]:
R e = ρ U U p d p / μ
where ρ and d p are the fluid density and diameter of the particle, respectively; U and   U p are the air velocity and velocity of the particle, respectively; and μ is the is dynamic viscosity coefficient of air.

2.2.3. Analysis of the Initial Velocity of Dust Particles

Dust particles are the main working object of the fan exhaust system. The initial velocity of the dust particles is the lowest gas flow velocity needed for the dust particles to transition from a static state to the moving phase. When the flow velocity exceeds the minimum dust particle start velocity, the dust particles can transfer from the static state to the moving state. The starting velocity of the dust particles was determined in a horizontal circular tube.
For a single dust particle [21,23,32,51]:
U s = 1 d p D 1.5 4 f g d p 3 C D ρ p ρ ρ ,
For a small single sphere, the following equation was found [25,26]:
1.54 × 10 4 1 d p D 1.5 2 C D ρ d p 4 U s 7 ν 3 D 1 2 = f π 6 g d p 3 ρ c ρ + 1.302 × 10 6 d p 6.35 × 10 3 ρ d p 3 U s 21 ν 5 D 3 1 / 8
For the stratified accumulation of the particles:
U p = 1.27 A r 1 / 3 + 0.36 A r 1 / 4 + 0.45 × 0.70 A r 1 / 5 + 1 U s
For the Archimedes number:
A r = g ρ ρ p ρ d p 3 μ 2
where U s is the initial velocity of a single dust particle (m/s), d p is the diameter of the dust particles, U p the initial velocity of the layered dust particles, D is the diameter duct,   C D is the drag coefficient, ρ p is the true density of dust particles, ρ is the air density, f is the friction coefficient between dust particles and duct, A r is the Archimedes number, and μ is the dynamic viscosity coefficient of air, 1.84–5 Pa∙s. By calculating Equation (13), the suction mouth needs an intake wind velocity of at least 30 m/s provided by the port, so all of the particles are taken up.
It is assumed that the suction velocity is defined by the vertical drawdown (vertical force equilibrium) and is found that [21,23,52]:
U p u = 2.62 ν 13 / 21 D 3 / 21 μ 8 / 21 π 6 g ρ p ρ + 1.302 × 10 6 d 2 8 / 21
where D is the duct diameter and ρ p   is the particle density.

2.2.4. Boundary Conditions and Solution Controls

It is important to study the airflow and particle movement in typical regenerative air sweepers. During actual operation, the airflow in the system collides with atmospheric air or the road surface, as it is directed to the intake of the pick-up head. This process results in incomplete absorption and dispersion of particles in the environment as the airflow and particle trajectory is altered by the creation of negative or positive pressure around the suction port. It is important to evaluate and have a clear idea of the direction in which the trajectory of the recirculated air in the system changes during the collision with the road surface as it moves through the inlet of the suction head. The k- ε model was used to accurately describe the turbulent motion of the airflow in the inlet and outlet channels of the pick-up head and to investigate the strong recirculated airflow and turbulent effects. A discrete particle model (DPM) and particle separation efficiency are used to measure the trajectory and motion velocity [8,9,10,44,45]. A numerical analysis was conducted to determine the trajectory of wood, plastic, sand, steel, and aluminum particles in the regenerative air vacuum cleaner pick-up head. Through an injection surface, it was assumed that the particles were injected into the outdoor air. The boundary conditions consisted of two inlets for return airflow from the system, an inlet duct for atmospheric airflow with particle movement, an outlet duct for particle intake, and the walls of the collection head. The average value of the circulating airflow in the system was 15 m/s for inlet ducts D2 and D3 of the pick-up head. For atmospheric airflow and particle movement, the airflow velocity in D1 set to 25 m/s. As the expansion surfaces found the atmosphere, the inlet pressure was 0. The wall surface at the bottom of the pick-up head was a non-slip stationary wall. It was assumed that the particles with the “escape” condition would be exported to the remaining tubes when the “reflect” condition was applied to each wall to set the boundary conditions. By using the Reynolds number formula to determine the flow field determination conditions, it was found that the Reynolds number of this model is greater than 4000; therefore, a turbulence model should be used. There are three types of turbulence models: Standard, RNG and Realizable. In this paper, the Realizable turbulence model was chosen over other models because it is good for swirl domination flow currents [53,54,55,56].
The discrete phase model (DPM) is related to the physical properties of the particles and to the determination of the trajectory of the particle motion. The Rosin–Rammler model is used for the particle size distribution. The particle physics model was set to spherical. During the simulation, a discrete random walk model was used in [6,10,45]. The initial calculations for all zones were conducted. Dust-particle–wall interactions are modeled by reconstruction coefficients that determine the amount of momentum in the normal (or tangential) direction on a wall that a particle holds after impacting the wall. Collisions between the different type particles and the walls were assumed to be non-elastic in this simulation. The efficiency of particle removal was tested by removing a certain number of particles from the injection surface and observing the number of particles emitted through the outlet of the pick-up head. The main parameter settings of the simulation are shown in Table 2. The particle removal efficiency of the pick-up head is generally evaluated by its total removal efficiency of dust and particles. The quality of these shapes can be analyzed by indicators such as the curvature and aspect ratio. The mesh schematic of the pick-up head simulation model is given in Figure 2. In the overall computational domain, there are two main regions: the external air domain and the internal flow field region. A tetrahedral mesh is used for the particle suction area inside the particle port, and hexagonal mesh is used for the area outside. The mesh convergence is important in CFD Fluent. The coupling holder was used to study the mesh cleaning by additional analysis of the connecting rods in the ANSYS FLUENT using different density meshes. The first layer was set to 0.01 m to ensure that the dimensionless wall distance y + of the first-layer mesh met the calculation requirements. For the target pick-up head, the grid size of 0.015 m was used, and 0.02 m was used for the other pick-up head.
The SIMPLE method algorithm was used to complicate the airflow. Dispersion of particles was simulated using a discrete random walk model. As for dissipation rate and momentum equations, the second-order windward form was used; convergence was determined by measuring residuals as well as the difference between inlet and outlet pressure fluxes. The convergence factors of the energy equation were set to 1   ×   10 8 , and the convergence factors of other variables were set to 1   ×   10 5 . In the conservation equation, the iterations were continued until the relative error was less than 1   ×   10 5 and in the energy equation, less than 1   ×   10 8 .
Ensuring the accuracy of calculations, the independence of the mesh was confirmed. Three mesh numbers, namely 109746, 1876712, and 236665, were selected and made with the same machine underneath the same operating conditions, i.e., the error was the largest when the number of grids was 109746. The results indicate that increasing the number of grids will not lead to any difference. The calculation results of the remaining two grids were almost close to each other. We chose 236665 meshes as the basic mesh system in this study.
The total removal efficiency is the ratio between the number of particles removed from the road surface and the total number of particles to be removed per pick-up, regardless of the type and composition of the waste. Total removal efficiency can be defined as follows:
η = G 1 G 2 × 100 %
where η is the total removal efficiency, G 1   is the inlet mass flow rate (kg/s), and G 2 is the removal mass flow rate (also called the outlet mass flow rate; kg/s).
It is usually necessary to determine the weight of the particles to determine the efficiency of the separation of particles from the surface during the experiment. During the experiment, a special sieve was used to determine the amount and size of the particles, allowing us to accurately measure their size. A scale was used to measure the mass of the particles once the particle size had been determined. The mass of the particles can be used to measure the efficiency of particles on the road surface. Additional efficiency is a method that describes how well the particles are removed from the road surface as a function of the particle size and mass distribution. The ratio of the number and mass of particles on the road surface of the collected particles determines the suction efficiency of particles for the experimental results. By analogy with Equation (16), the particle removal efficiency η w of the road surface is computed using the equation.
η w = P m P m + P r m × 100 %
where η w is the efficiency of particle collection on the road surface, P m is the mass of total particles on the road surface, and P r m is the mass of residual particles after collection from the road surface (kg).
A comparison of the suction efficiency of experimentally determined particles with the simulation result was performed in the following order. First, we ensured that the size and type of particles were homogeneous, and that the airflow rate moving through the inlet and outlet ducts had the same value as in the experiment. Then, we were able to compare the results obtained in the experiment with the simulation results.
The density of the particles, which are usually on the road surface, has a great influence on the absorption efficiency. Table 3 describes the particle density.

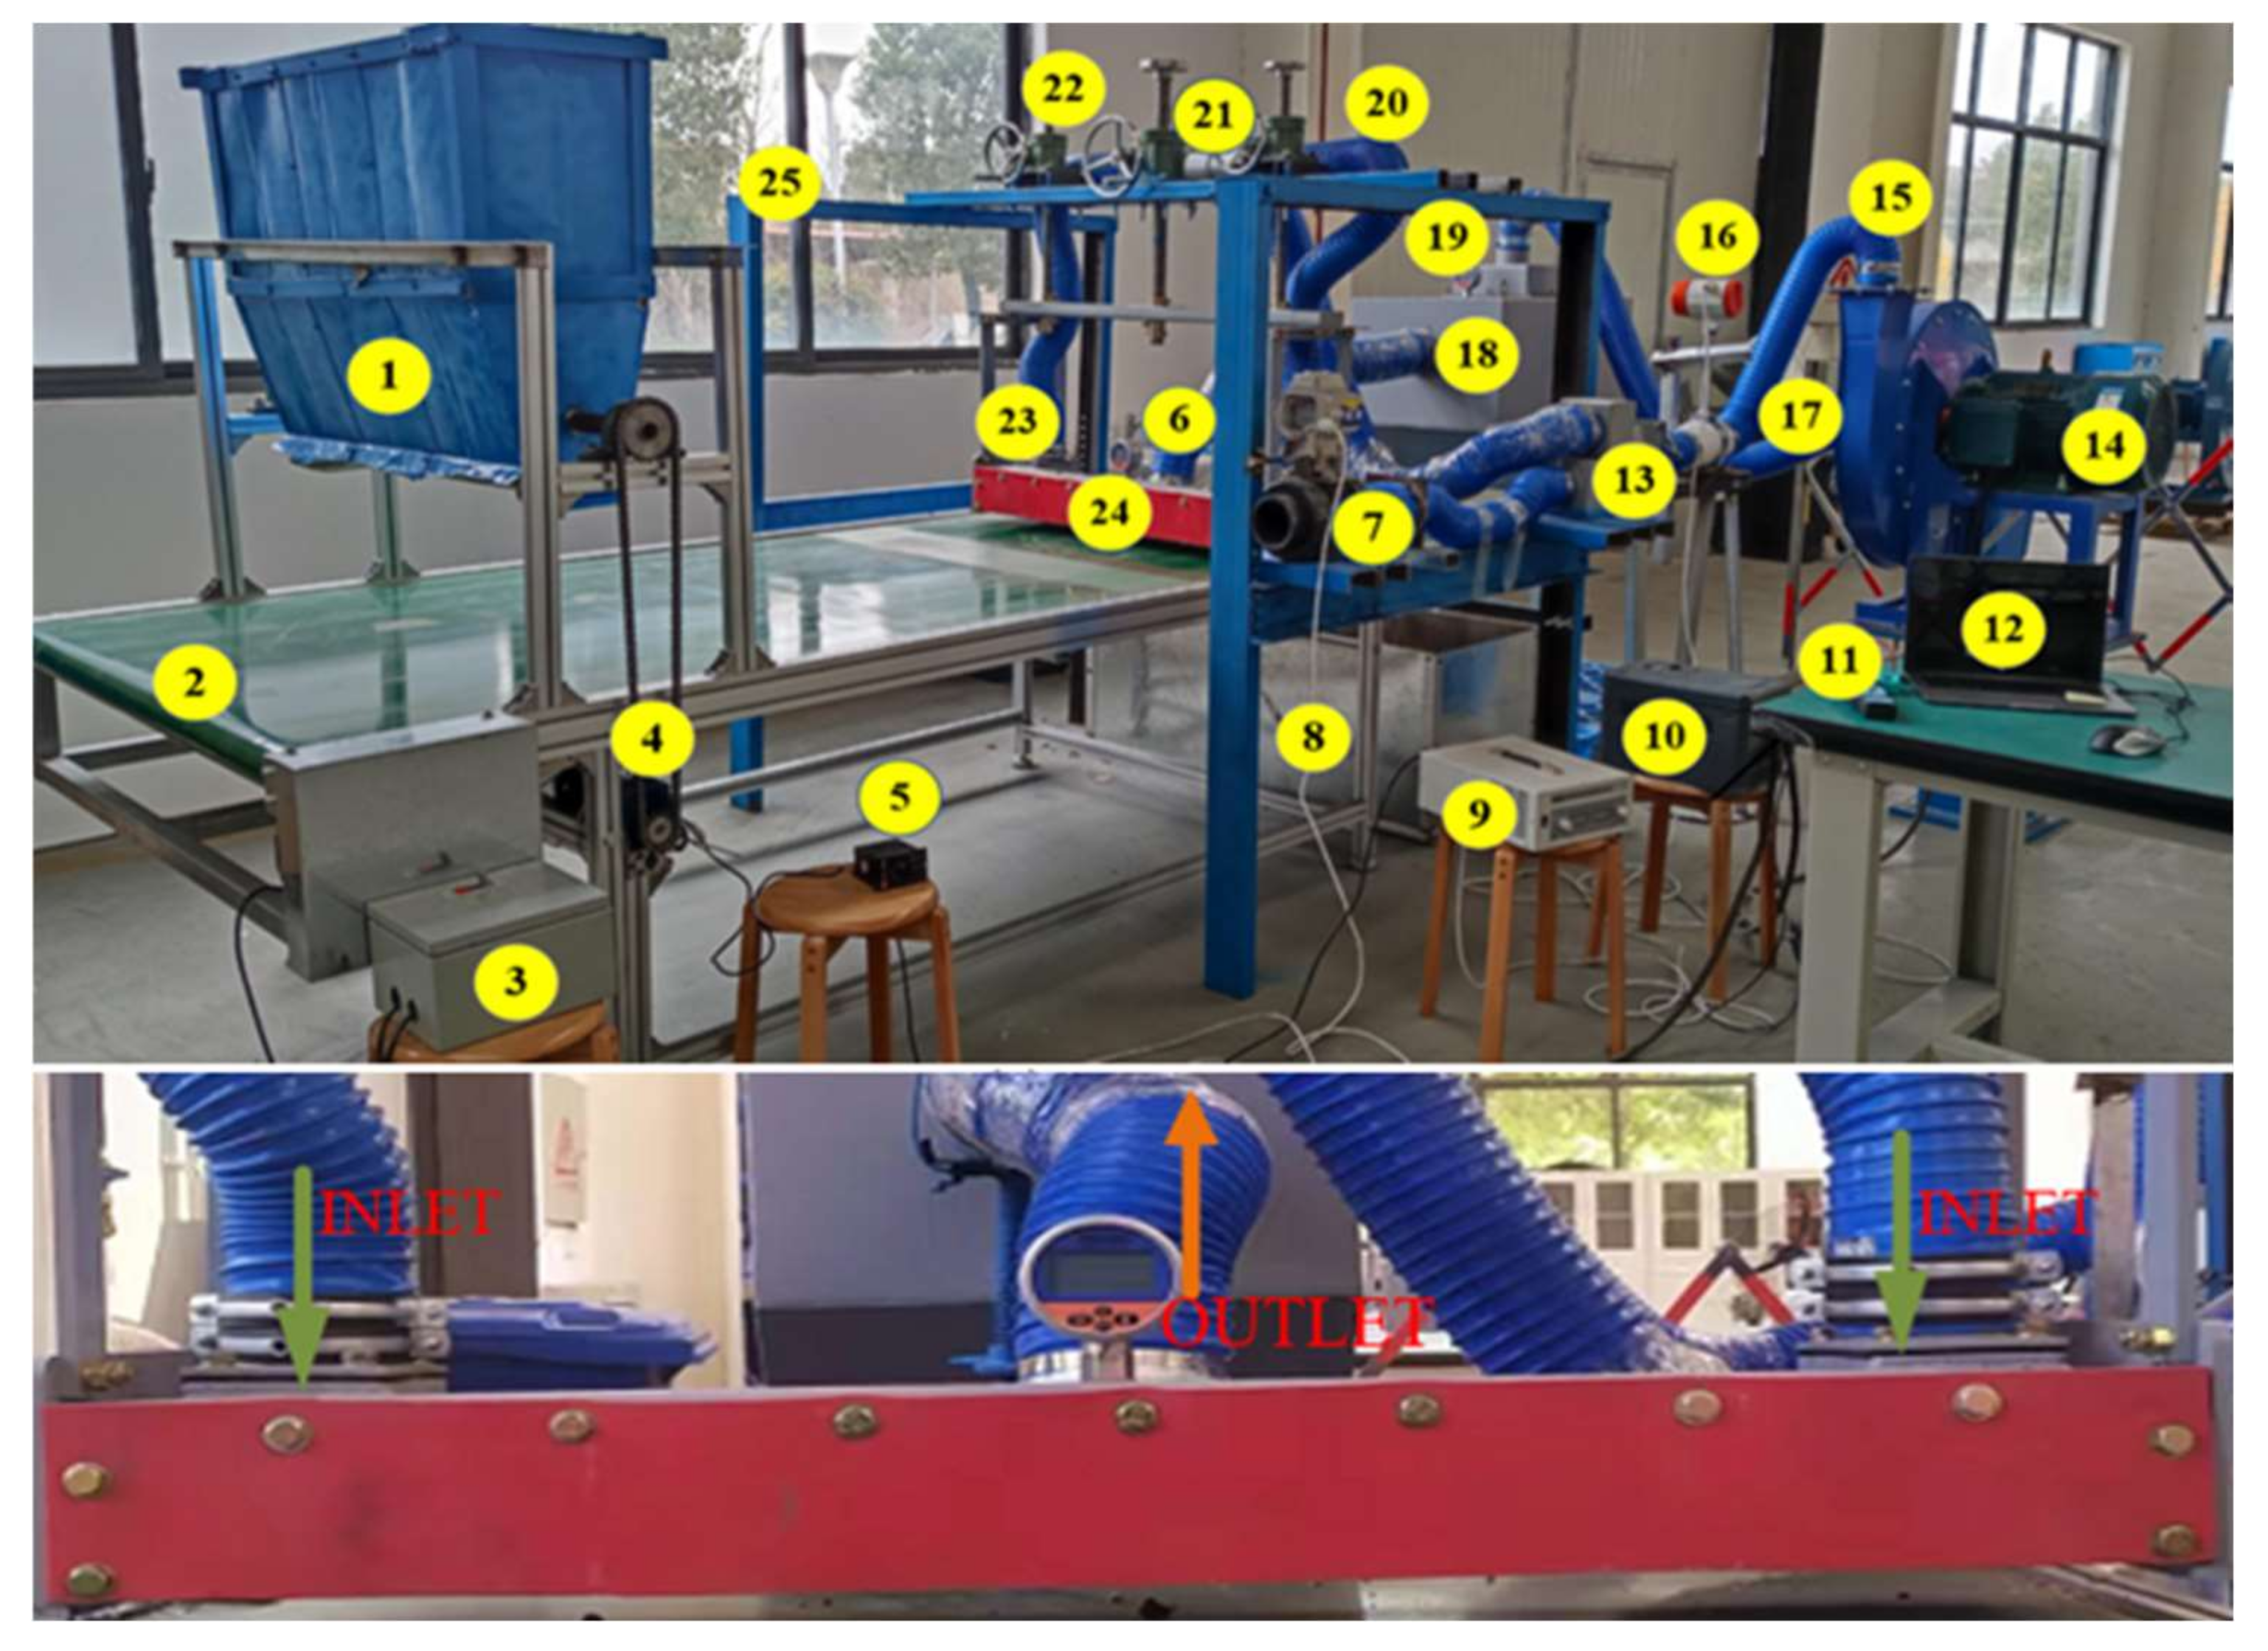
3. Experimental Setup
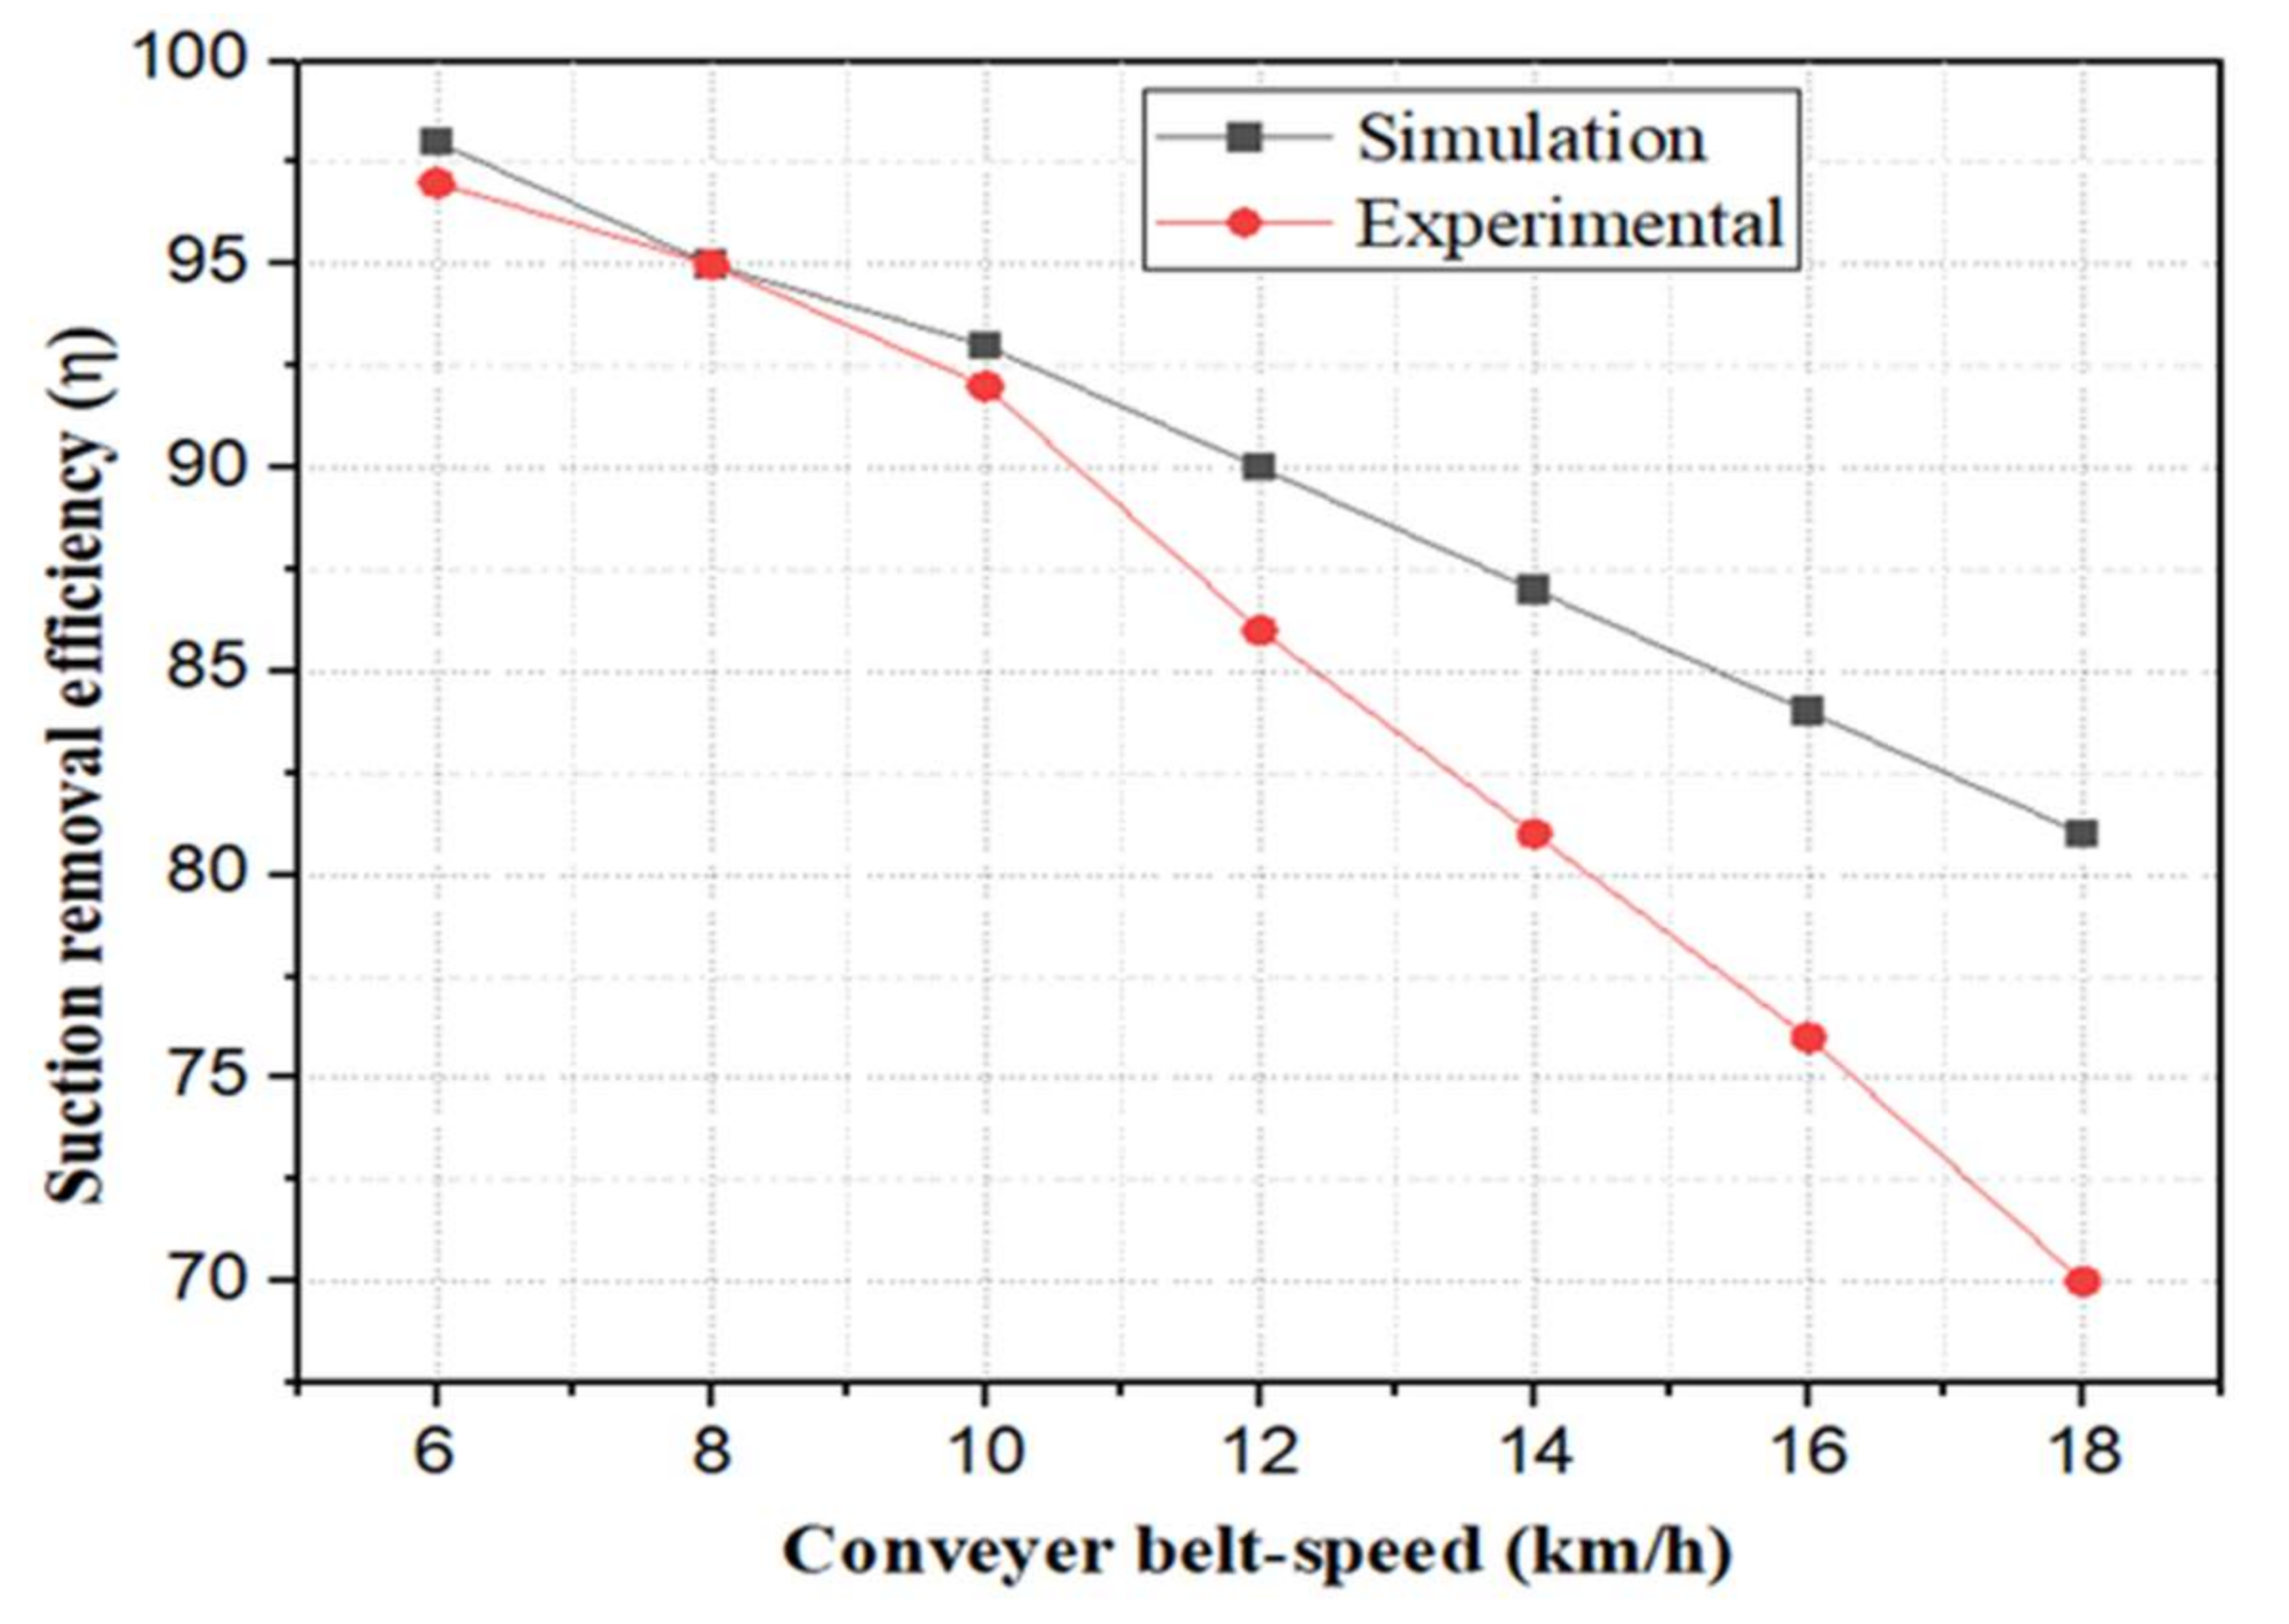
Figure 3 shows the test setup for a regenerative air vacuum cleaner. A newly designed model of the pick-up head takes into consideration the factors that affect the suction performance of dust particles. There are two inlet channels in the pick-up head for receiving the airflow that comes back from the system. The mouth of the pick-up head is conventional, and a suction mouth is present. The diameter of the suction mouth can be changed on the pick-up head. The diameter of the suction orifice used in the experiment was from 100 to 140 mm. The inlet channels of the pick-up head use smaller inlet channels with a diameter of 60 to 100 mm. When the centrifugal fan (CY200H) is running, the dust particles are absorbed from the surface of the conveyor belt by the high-pressure air stream formed at the suction port. Once the dust and particles have been sucked up into the dust collection hopper, the airflow continues to pass through the filter after it has been separated from the particles. The airflow in the intake duct ranges from 5 m/s to 35 m/s, while the centrifugal fan airflow is controlled by the frequency converter (AC SQ580-011G/015P-4). The device uses a set of special lifting devices (Hiudon SWL 2.5T) to observe how the distance between the pick-up head and the converter belt affects the suction efficiency of dust particles. These devices allow the pick-up head to move upward and downward at an angle of 30° on both sides. The conveyor belts carry out the movement of dust particles. This conveyor belt can run at speeds up to 40 km/h. A special control device can be used to adjust the speed of the conveyor belt. The conveyor belt speed can influence particle suction. For ensuring uniform distribution of dust particles, a dust feeder with an integrated control system was installed on the conveyor belt. This dust feeder can distribute particles of PM10 size up to 120 mm.
This is important because not only does the airflow from the system enter the suction mouth, but also the ambient airflow passes through the suction mouth when the air is returned through the inlet ducts of the suction head. To reduce the negative effects of the two air flows around the intake duct, an airflow splitter was used to control the return flow to the system. Regenerative sweepers use airflow that can range from 0 to 100% in the suction head inlet ducts to determine how much airflow is returned to the system to remove the dust particles as effectively as possible. A portion of the airflow exiting the system can be discharged to atmosphere or recirculated throughout the system. The regenerative air vacuum system uses a flow meter (Longly LL-DC, DN100 PTFE) to monitor the amount of the air flowing into and out of the system. The air velocity is measured by the air velocity sensor (EE660) as the air moves from the environment to the pick-up head chamber. The flow meter (Aicevoos AC-H8) determines the direction of secondary airflow in the system through the main receiving inlet ducts and measures the velocity and temperature of the secondary airflow to the environment. Detections of air pressure in the collecting head and dust collector are performed by pressure gauges (Longly PTL516). An experiment was carried out with a regenerative air-vacuum sweeper in which the conveyor belt was moved at a speed ranging from 6 to 18 km/h. The particle removal efficiency is determined by measuring the mass of particles collected on the sampling surface before and after sweeping.

Model Validation

Model verification is an important procedure to ensure the accuracy and the reliability of numerical simulation results. For high reliability, an experimental validation was performed. The validation is the reliability of simulated particle suction efficiency.
In the validation, the data used in the present study to evaluate the CFD model were obtained from Wu et al. [10]. The particle suction efficiency is expressed by η . The effect of the observed sweeper-traveling speed difference on the suction efficiency of the particles was determined by the efficiency of the sand particles used in the pick-up head suction port used in the experiment and in the relevant numerical simulation verification. The sweeping field experiments were carried out at the sweeper-traveling speed of 6 to 14 km/h, pressure drop 2000 Pa, sand particle sizes from 45 to 160 μ m , density 2500 kg/ m 3 , and on the road surface at 2.0 × 1.8 mm.
In the experiment, the geometric model and consistent boundary conditions were established. The simulation data were found to agree well with the experimental data. When the traveling speed was 6 to 16 km/h, the average deviation between the simulation results and the experimental results was less than 10%. However, when the sweeper speed is 12 to 18 km/h, the simulated values are slightly higher than the experimental values. There may be a reason for this sufficient accuracy of the DPM model in simulating the sweeper pick-up head particle suction efficiency. As for concentration, the numerical simulation results are normalized, and the average concentration at speeds of 6 to 10 km/h is very consistent with the experimental data. However, there is a small deviation from the normalized average concentration at the sweeper speed of 6 to 10 km/h, which may be due to the difference in the airflow. Despite some slight differences, the Realizable k-ε turbulence model is feasible for solving the fluid flow and solid particles.

4. Results and Discussion

4.1. Initial Flow Rate of Particle Removal Efficiency

The effect of particle shape on pick-up velocity is only briefly discussed, but experiments with a regenerative sweeper test rig can be performed to establish a definitive relationship between the particle velocity and pick-up velocity in the real conditions. Studying the effect of shape on the suction power of the sweeper shows that there is a minimum collection rate. In most cases, the waste particles on the road surface are in discrete dimers. Sweepers are typically difficult to use to clean small and heavy particles [21,23]. The velocity of the air can be calculated using Equation (15), when the particles begin to move on the surface. In Table 4, the U p u effect of the pick-up velocity of small particles on the road surface was calculated because of changes in particle size ( d p ), and particle density ρ ρ . As can be seen, the particle size and density significantly influence the rate of particle removal from the road surface. For example, the pick-up velocity of the granite particle of diameter, 3.3 mm have U p u of 13.15 m/s, while the pickup velocity of a steel particle of diameter, 2.95 mm, U p u   is 21.82 m/s. Even if the particle size is the same, the particle pick-up velocity is variable if there is a difference in the particle density. The importance of dust particle size, particle density, air density, and air viscosity were studied.
The composition of particles collected by the regenerative air sweeper was estimated by calculating their rate of uptake. Figure 4 shows the rate at which the air picks up the particles when it really starts to pull out of the particle layer. To estimate the pick-up rate due to changes in particle composition during road cleaning, the particles with an equivalent diameter of 1.5 to 15 mm were assumed. The particle extraction is calculated by solving Equation (5) for the particle size and density of the different particle types. The pick-up velocity for 1.5 mm diameter wood particles was 5.2 m/s, while for 15 mm diameter wood particles it was 15.8 m/s. The pick-up velocity of sand particles was 26.2 m/s, that of (wet) clay was 29.6 m/s, and that of asphalt was 31.7 m/s for particles with a diameter of 15 mm.
The difference in particle uptake rate can be seen with increasing particle density. Figure 5 demonstrates how particle structures affect the initial velocity of particle simulations and experimental results. The initial velocity of the particles U s is calculated by Equation (11), and the results were compared with the experimental data. In the experiment, the duration of movement of the particles on the conveyor belt was considered. When particle density of wood is assumed to be 600 kg/m3, wood particle size of 3 to 30 mm is assumed. In the process of determining the initial velocity of particles, the effect of particle density ( ρ ρ ), particle size ( d ρ ) and suction port diameter (D) is important. During the experiment, it was observed that the particle starting pick-up velocity from 3 mm to 12 mm was significantly higher than the simulation results, and the particle starting pick-up velocity found by calculation was not sufficiently calculated during the experiment. This in turn resulted in a high particle starting pick-up velocity ranging from 3 mm to 12 mm. The size accounts for 22% of the difference in the initial velocity of the particles in the range of 3 mm on average. The difference between the particle starting pick-up velocity experiment and simulation results for the particles from 15 mm to 30 mm was 4–5%. It can be observed that the difference between the simulation and the experimental results is relatively close to each other on the suction port airflow rate.
The velocity of airflow through the particle assimilation port is variable as it moves with the particles. Where the structure and mass of particles moving through the suction duct lead to a slowing of the flow [10]. The values of airflow and particle velocity are given in Table 5 and are based on the results obtained on the regenerative test rig. As the airflow from the suction port increases, more particles enter the airflow, thereby increasing the cleaning efficiency of the roadway particles. Light particles entering the suction duct and sand particles were considered different when the difference in airflow velocity was measured experimentally. When airflow in the suction channel was 20 m/s, the airflow velocity for light particles was 17.86 m/s, while the airflow velocity for sand particles in the suction channel was 15.8 m/s.

4.2. Particle Suction Removal Efficiency

The experiment was carried out in the laboratory of the Suizhou Inspection Centre of the Wuhan University of Technology. In the experimental setup, the conveyor belt as a transporting medium for the particles to the pick-up head. Sand particles ranging in sizes from 63 μm to 200 μm were used. It is possible to determine the sweeper removal effect of particles of these sizes by both experimental and simulation methods. The conveyor belt uses a dust feeder to control the movement of the particles and ensure that the particles are evenly distributed on the belt surface. By comparing the mass of granite particles before and after dust collection, the mass calculation method was used to determine the efficiency of dust particle collection [7,9,10,11]. Figure 6 shows the analysis of the different speeds of sweeper movement, the results of the total dust collection efficiency test. The numerical calculations of the CFD can be compared with those of the experimental data, which shows that the simulation results are different from the experimental data [6,13]. The simulation data were higher than the experimental results when measured. The simulation and test results were very close when the driving speed was between 6 km/h and 10 km/h. The difference between the results when the driving speed was 12 km/h and 18 km/h increased significantly. The difference between the results at a driving speed of 18 km/h was 15%. Since the simulation result was higher than the experimental results with increasing speed, the values entered with the fluent code did not lead to a sharp decrease in the result, but a relatively faster decrease in the result with an increase in speed in the real working mode during the experiment. An increase in conveyor belt speed has two effects on overall particle suction efficiency. On the one hand, the relative velocity between the particles and the moving pick-up head increases with increasing conveyor belt speed. The high speed of the cleaner encourages the particles to move toward the rear narrow slot at a greater impact angle. The suction port of the pick-up head particles cannot collect more particles smoothly with airflow, and most particles escape from the pick-up head rear narrow slot to the environment. It is also assumed that small particles can move with the airflow, and if the airflow is not fully received through the suction port, small particles can easily escape from the pick-up head chamber along with the airflow. As a result of the collision of atmospheric air with the secondary air stream, the escaped particles are not fully absorbed due to the increase in air resistance around the suction port. During the experiment, it was clarified that as the speed increases, the air resistance around the suction port also increases, and as a result of the negative pressure, the air flow in the pick-up head chamber spreads more to the environment. The reduction in particle reception time on the road surface caused by high sweeping speeds makes them less efficient than slow sweeping speeds.
In a regenerative air vacuum cleaner, it is always important to determine the trajectory of the airflow leaving the system. The ability to capture particles, typically from 1 to 100 μm through the filter, is very low. If the airflow and particle circulation in the inlet of the pick-up head and suction ducts are good, this will result in less particle scattering in the environment. In a regenerative air vacuum system, small volumes of dust are not well retained in the filter, which usually leads to recirculation in the system; thus, the composition of the secondary particulate dust will be composed of different type particles. It is important to correctly design the pathways of particle movement through the air stream due to the changes in the structure of the particles. Figure 7 illustrates the effects of varying the composition on the recirculating airflow and particle movement of the particles in the system. The flow and trajectory of particles coming through channels 1 and 2 of the pick-up head resulted in a change in trajectory due to changes in particle density. The suction efficiency of wood particles was higher than 0.80 η, while the absorption efficiency of aluminum solid particles was 0.72 η. The road cleaner moves at different speeds during operation, if the sweeper exceeds the speed limit, the collection process affects the complete absorption of small particles on the road surface if the suction chamber does not provide sufficient airflow speed to improve the suction efficiency. As part of this process, it is imperative to determine the passage of particles from the pick-up head chamber toward the suction port. A constant variability in the composition of the road surface always affects the efficiency of particle aggregation. If the particles are the same size, and the composition differs from the particle density, this will affect the velocity and trajectory of the particles when determining the collection efficiency. The effect of changes in the composition of particles on the road surface on the velocity and trajectory of the particles is shown in Figure 8. To determine the efficiency of particle collection on the road surface, the velocity and trajectory of particles ranging in size from 10 to 100 μ m were measured. The suction efficiency of wood particles was higher than 0.83 η, and the suction efficiency of aluminum particles was 0.74 η. The efficiency of particle assimilation in the pick-up head of regenerative air vacuums usually depends on many factors. Regenerative air sweepers have been found to have a positive effect on particle collection efficiency, due to air recirculation of air in the system. Figure 9 shows the effects of changes in particle composition and size on absorption efficiency. The absorption efficiency varied with the change in the particle composition. The absorption efficiency was 0.99 η when the wood particle size was 80 μ m. When the particle size was 250 μ m, it was 0.97 η. The absorption efficiency of the plastic particles ranged from 0.91–0.97 η, and the absorption efficiency of the sand particles was 0.93 η at 80 μ m and 0.82 η at 250μm. The absorption efficiency of metal particles differs more than that of other particles, and, in addition to particle size, mass is also important for absorption efficiency. Steel particles are 13% lower than the absorption efficiency of 80 μ m particles compared to light particles. For a particle size of 250 μ m, the absorption efficiency was 24%.
One of the critical factors for the suction performance of a sweeper is the airflow rate of the centrifugal fan. The particle collection efficiency is high when the airflow around the suction duct does not experience adverse pressure. Figure 10 shows the effects of increasing airflow in the intake as the composition changes. In most cases, the efficiency of the process is high due to the light particles. For leaf sizes smaller than 30 mm, the collection efficiency was 0.8 η when the airflow in the suction opening was 15 m/s, and the highest efficiency was 0.97 η when the airflow in the suction opening reached 30 m/s. In all cases, the speed of the conveyor belt was set to 8 km/h. When the assimilation efficiency of the plastic material at 15 m/s was 9%, less than the airflow in the suction mouth of the pick-up head relative to the blades. The airflow in the assimilation channel at 30 m/s was less than 4% of the suction efficiency of wood. Despite the low removal efficiency of this pick-up head, it can be seen that particle suction efficiency decreases by 15% at 15 m/s and by 6% at 30 m/s. Thus, when there is high airflow in the pick-up head’s suction mouth, the efficiency is higher when the particle composition varies.

4.3. The Effect of Sweeper Movement Speed on the Suction Efficiency of Particles

The effect of increasing the conveyor belt speed on particle assimilation efficiency is shown in Figure 11. The particle absorption efficiency varies with increasing conveyor belt speed. For a leaf particle diameter of 10–15 mm and a conveyor belt speed of 5 km/h, the efficiency is 0.96 η. The efficiency is 0.78 η when the conveyor belt speed is increased to 16 km/h. The effect on the suction efficiency was observed when the particles became larger, when the conveyor belt speed was 5 km/h and the leaf suction efficiency was 0.9 η. The suction efficiency was 0.64 η when the particle size was 60–70 mm and the conveyor belt speed was increased to 16 km/h; it can be seen that the suction efficiency decreases by 29% due to the speed change. Figure 12 shows the test result for the regenerative sweepers and shows the speed at which the optimum removal efficiency is achieved by the conveyor belt. Although the speed of the conveyor belt at 6 km/h was more than 0.93 η, of the minimum particle removal efficiency, the conveyor belt speed at an average of 10 km/h reached a maximum suction efficiency of 0.95 η, and a minimum of 0.86 η. As the speed was increased to 16 km/h, the maximum efficiency was 0.84 η, and the minimum efficiency was 0.68 η, where <50 mm of leaf particles was used in the experimental process. The experiment showed that changes in particle size at low speeds have less of an effect on extraction efficiency, whereas they have a greater effect on the particle absorption as the speed increases.

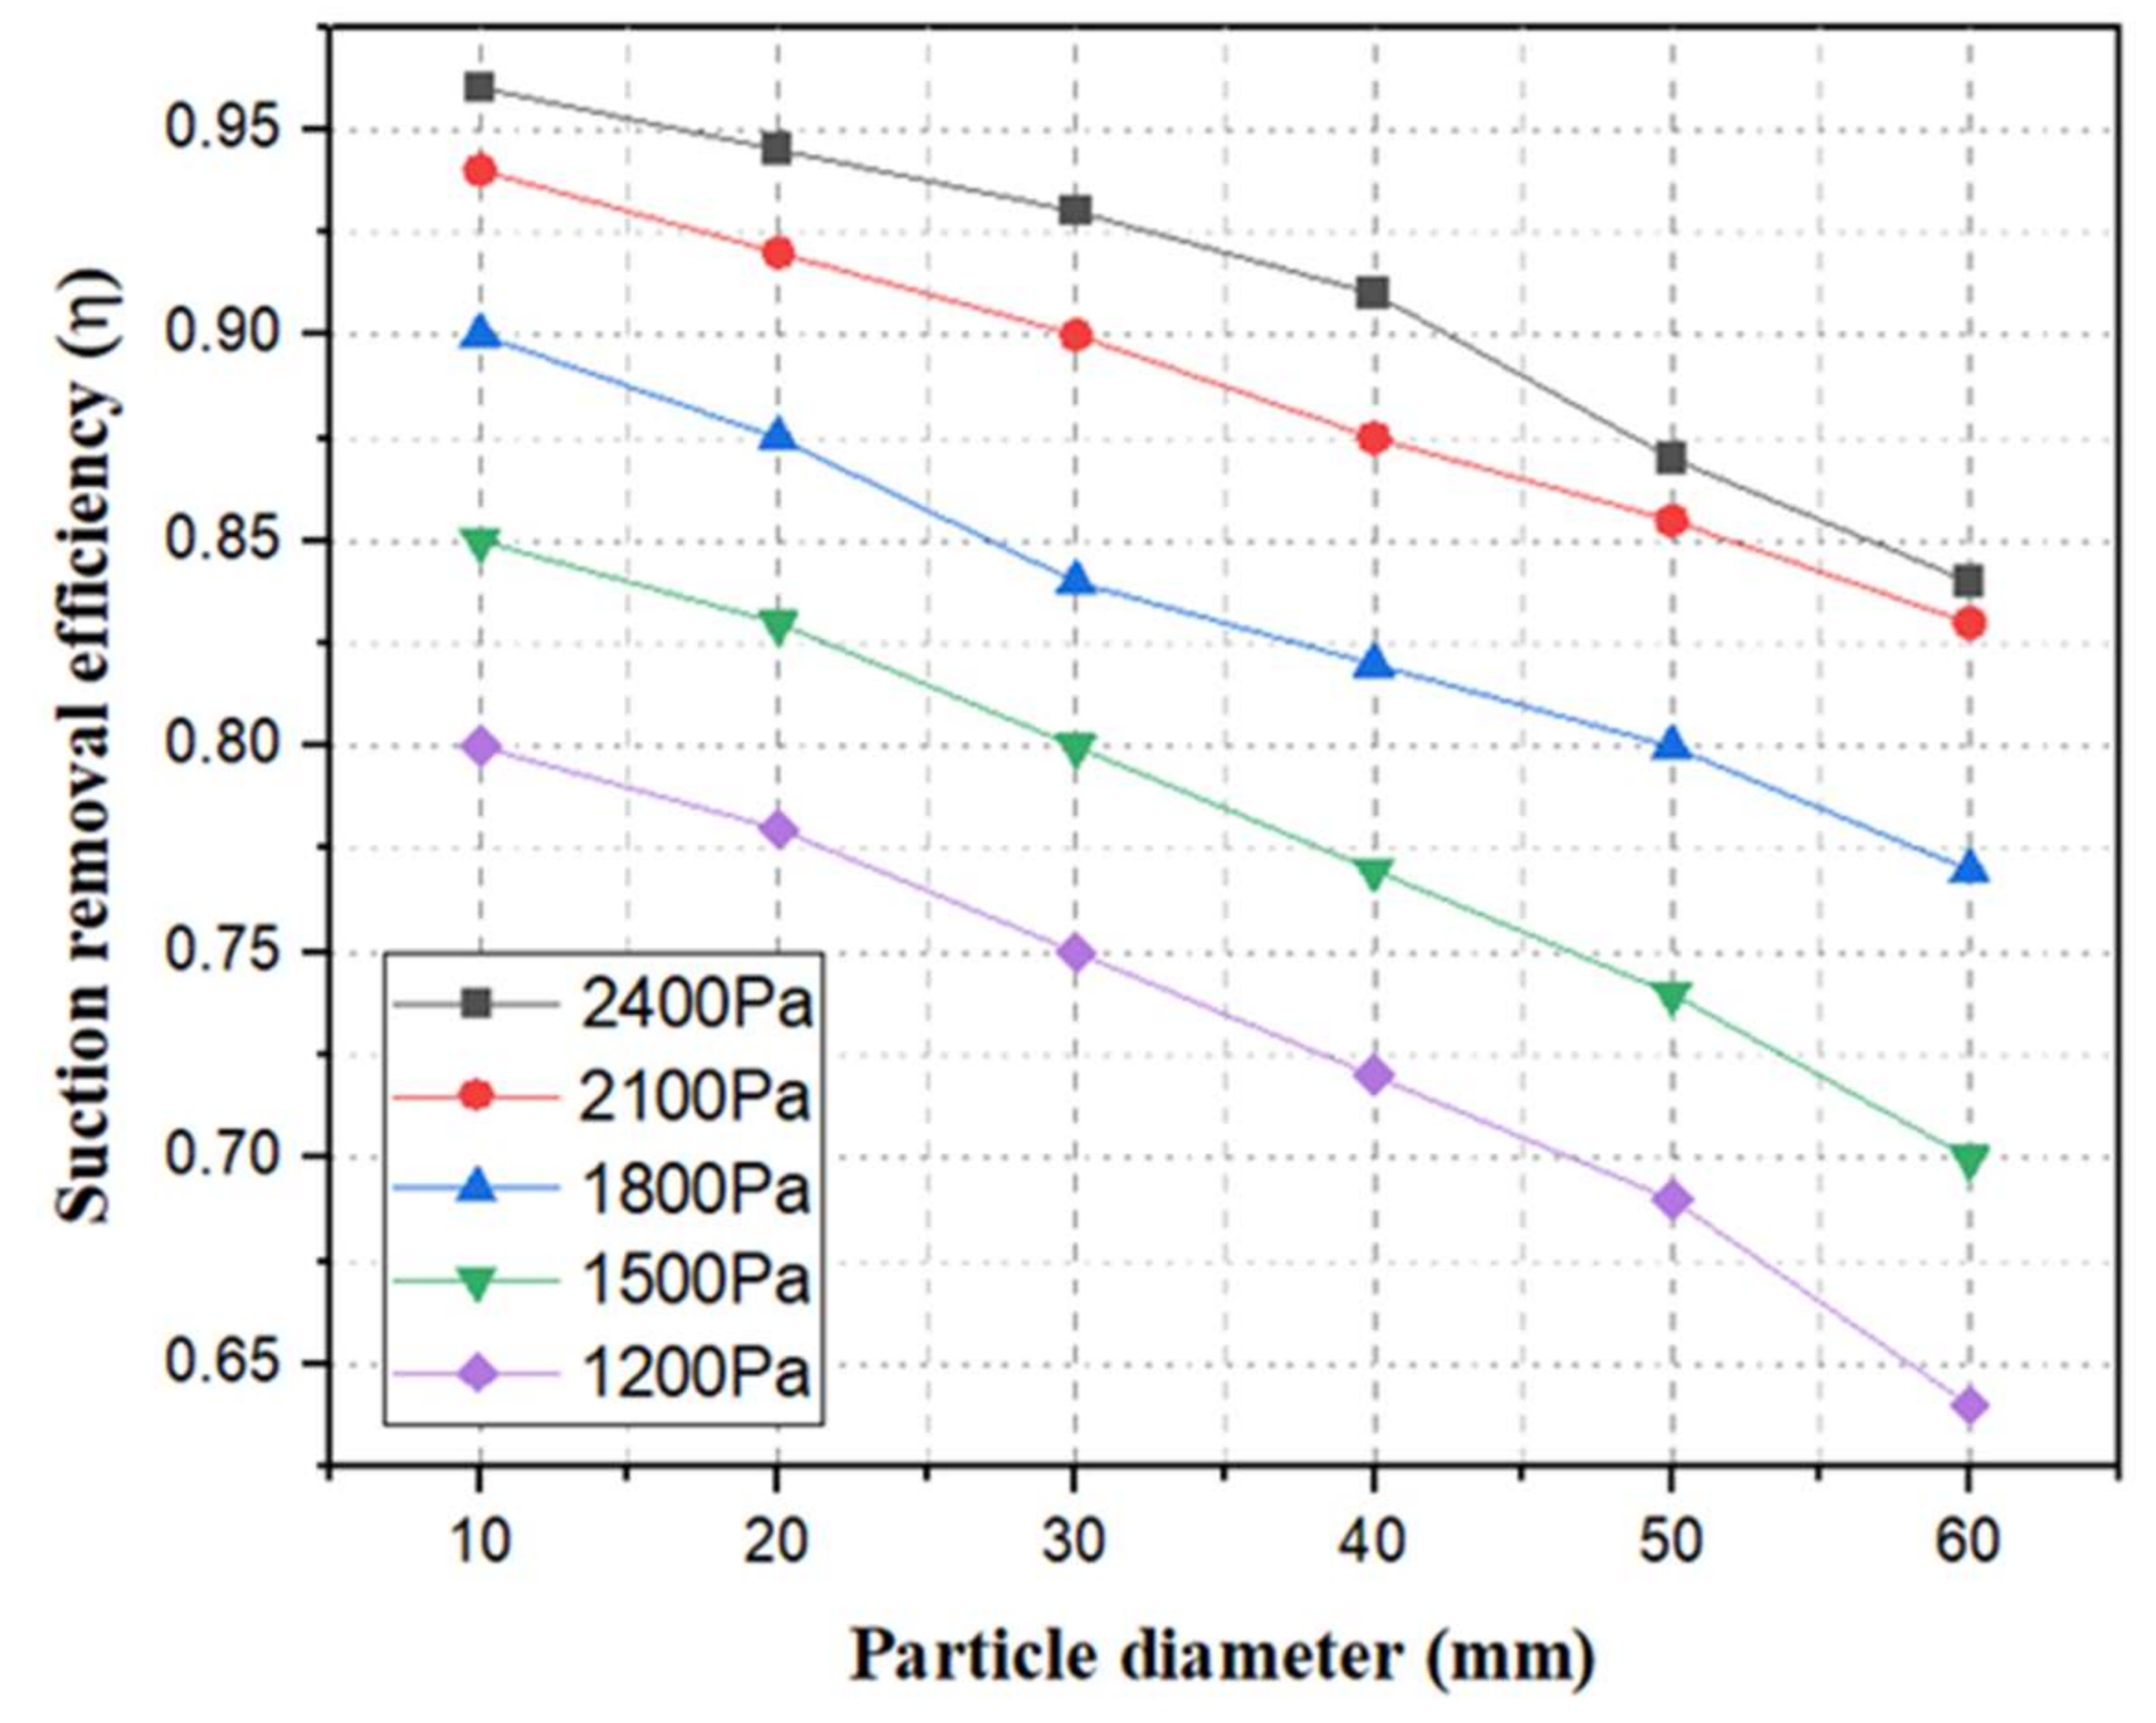
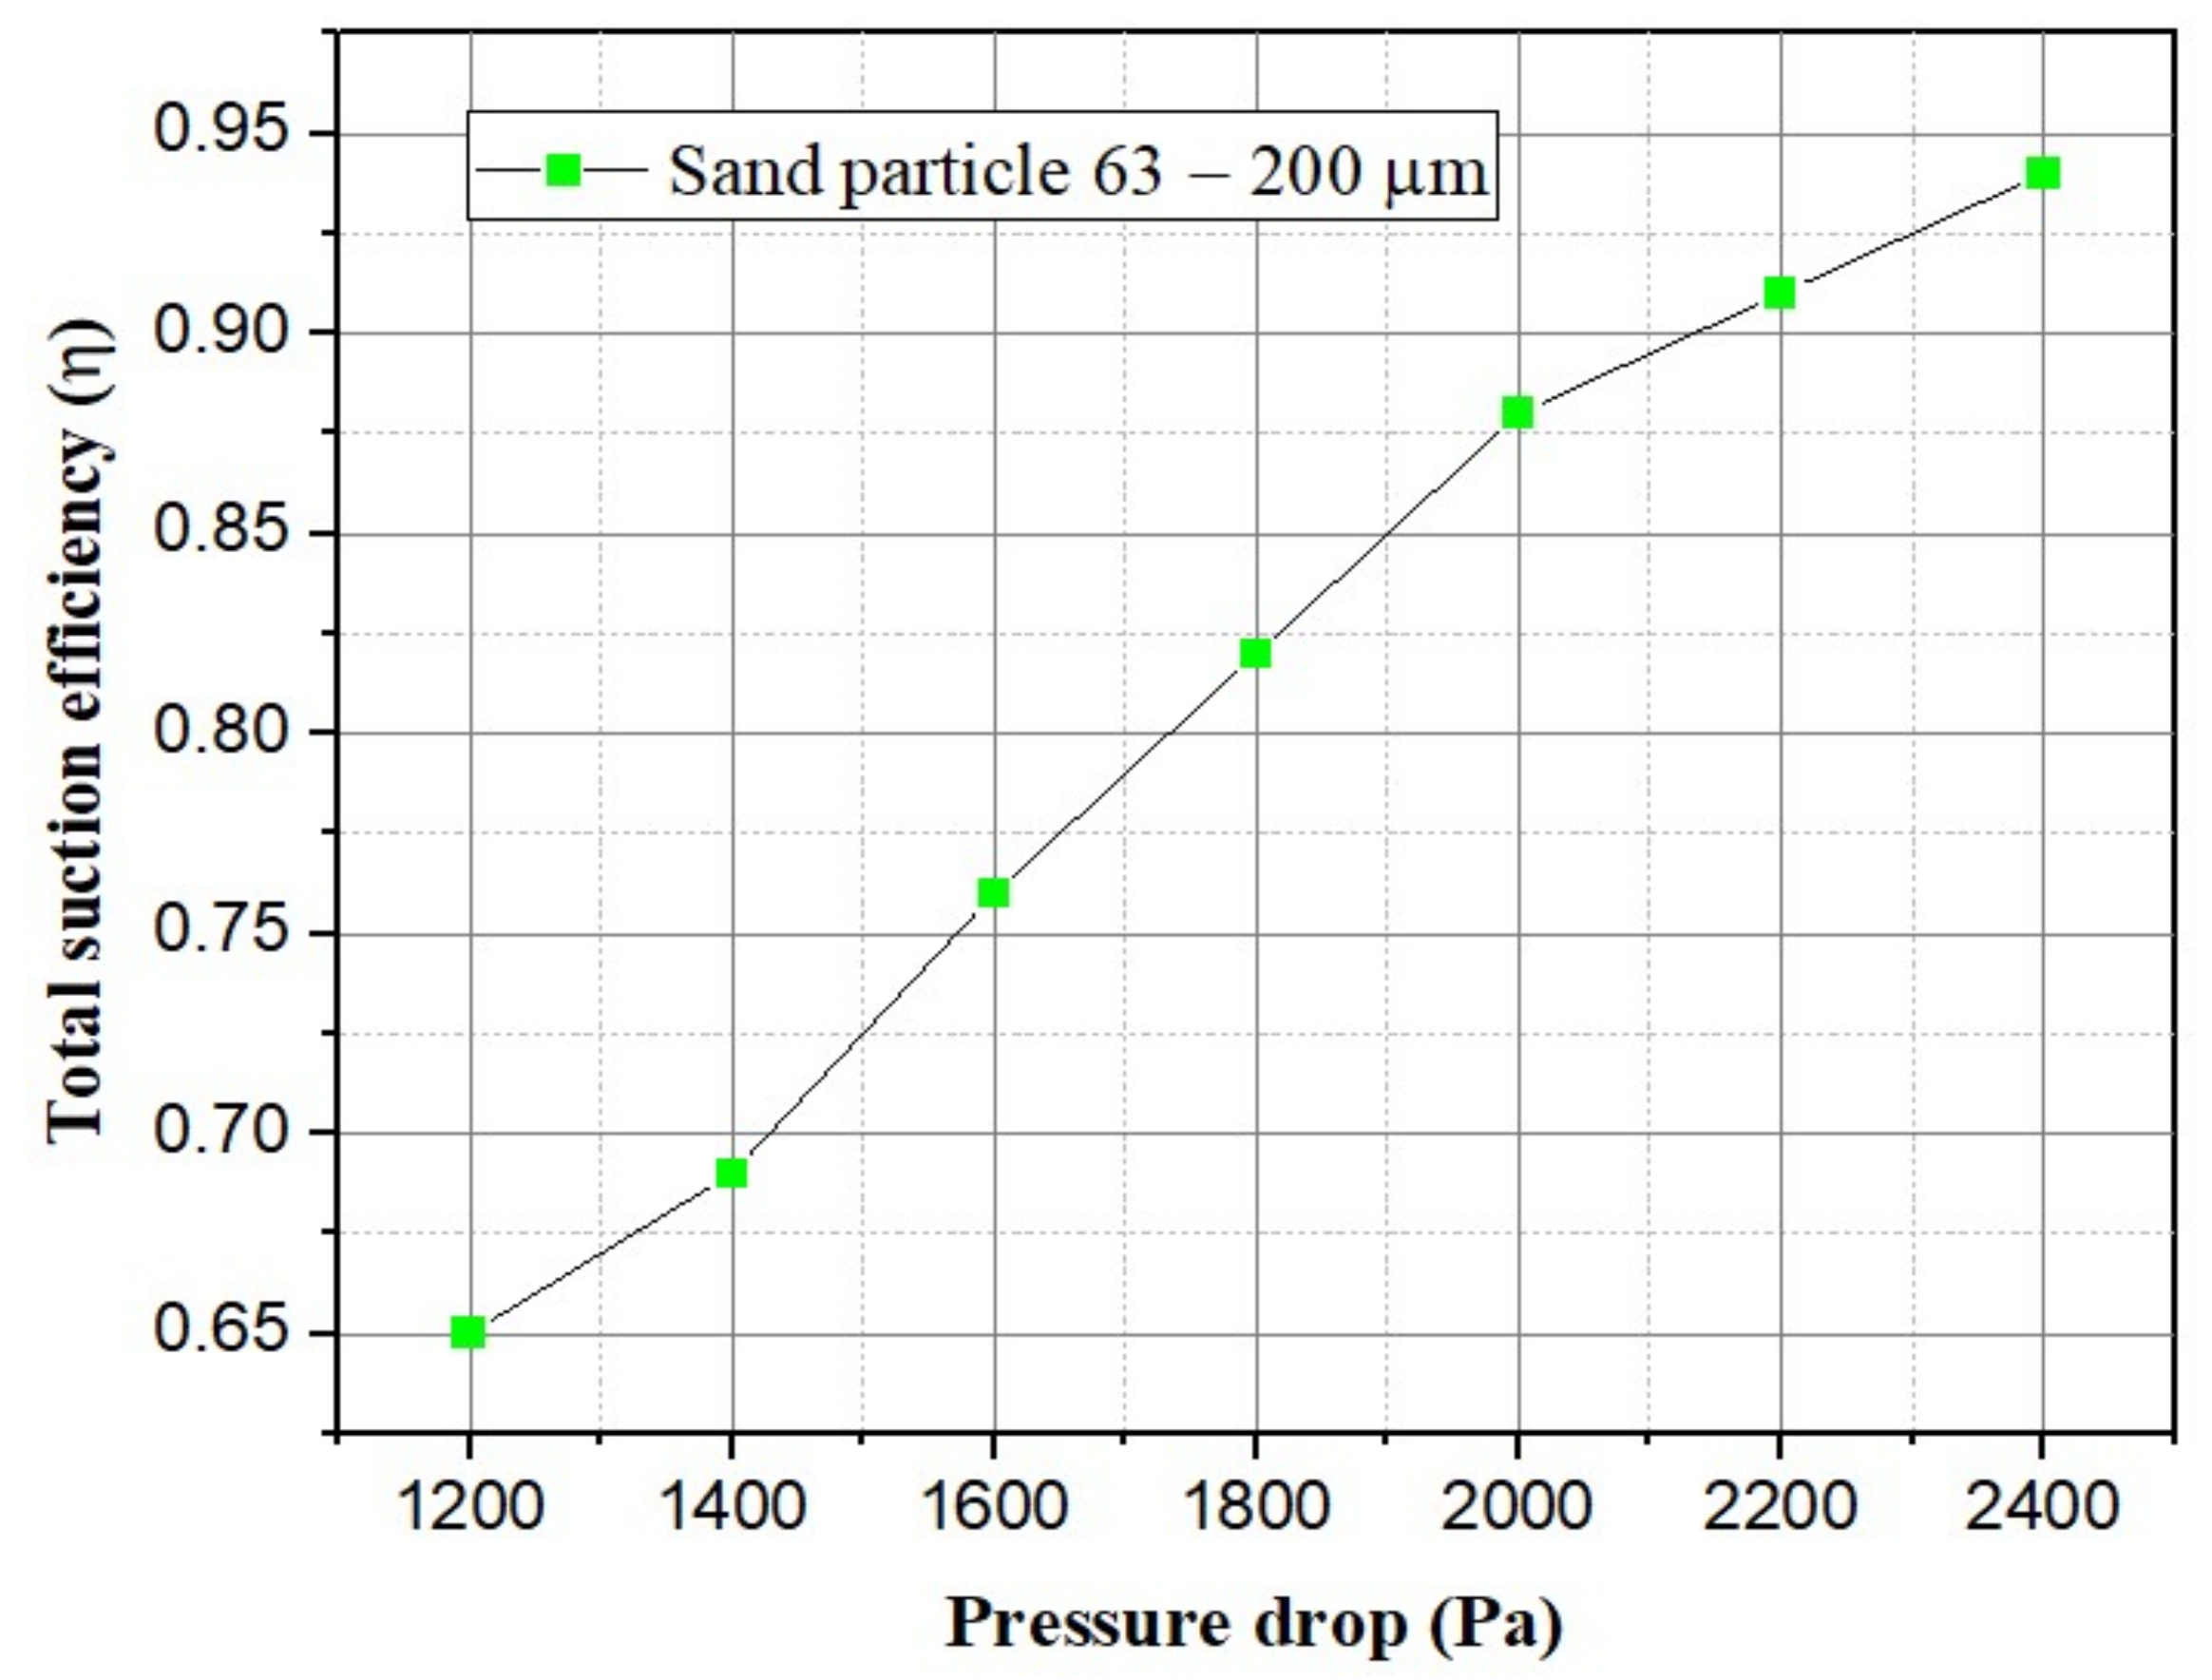
4.4. Effect of Pressure Change on Particle Suction-Removal Efficiency

Figure 13 shows the effect of pressure drop on particle removal efficiency. The efficiency for small particles decreases slightly with decreasing pressure, but it increases significantly for large particles. A pressure drop has a significant effect on efficiency in the range of 1800 Pa to 2100 Pa. For large particles, the removal efficiency does not increase significantly with a pressure drop from 2100 Pa to 2400 Pa, but relatively high efficiency is achieved at 2400 Pa [5,10]. Experience has shown that it is possible to control relatively small particles [31], and at a pressure of 2400 Pa, the removal efficiency is higher than 0.96 η when the particle size is 10 mm. Figure 14 shows the relationship between the pressure drop and the overall efficiency of particle collection. As the pressure drop increased, the overall particle collection efficiency increased. When the pressure ranged from 1200 to 1600 Pa, the efficiency increased from 0.65 to 0.76 η. The pressure was relatively stable in the range of 2200 Pa to 2400 Pa, and the efficiency was 0.91 to 0.94 η. Sand particles of sizes from 63 to 200 μm were used during the experiment.

4.5. The Effect of Changes in the Distance between the Suction Port and the Road Surface on the Efficiency of Particle Removal

The distance between the road surface and the suction opening of the suction head is crucial to collecting dust particles that are on the road. On the road surface, debris and particles are always in disorder, which sometimes makes it difficult to pick them up. Although the condition of the tracks consists of curves, elevations, and steep slopes, sweepers change their balance as they move the collection head. This can result in low efficiency in collecting particles on the road surface. Table 6 shows the distance between the suction opening of the collection head and the road surface that affects the assimilation efficiency of the particles. When the distance between the surface of the conveyor belt and the suction opening of the pick-up head is 80 mm, the assimilation efficiency of leaf particles is 0.97 η, while the distance between the suction mouth and the surface of the conveyor belt is changed to 95 mm. The removal efficiency was 0.92 η. It shows the variability of removal efficiency when the distance from the road surface to the suction mouth changes due to the change in the composition of the particles. The cleaning efficiency of the stone–sand particles was 0.80 η at an intermediate distance of 120 mm. The efficiency was 0.58 η when the distance between the road surface and the suction mouth was changed to 150 mm. The highest efficiency during the extraction experiment was the efficiency of dust particles, when the distance between the suction mouth and the road surface was 120 mm.

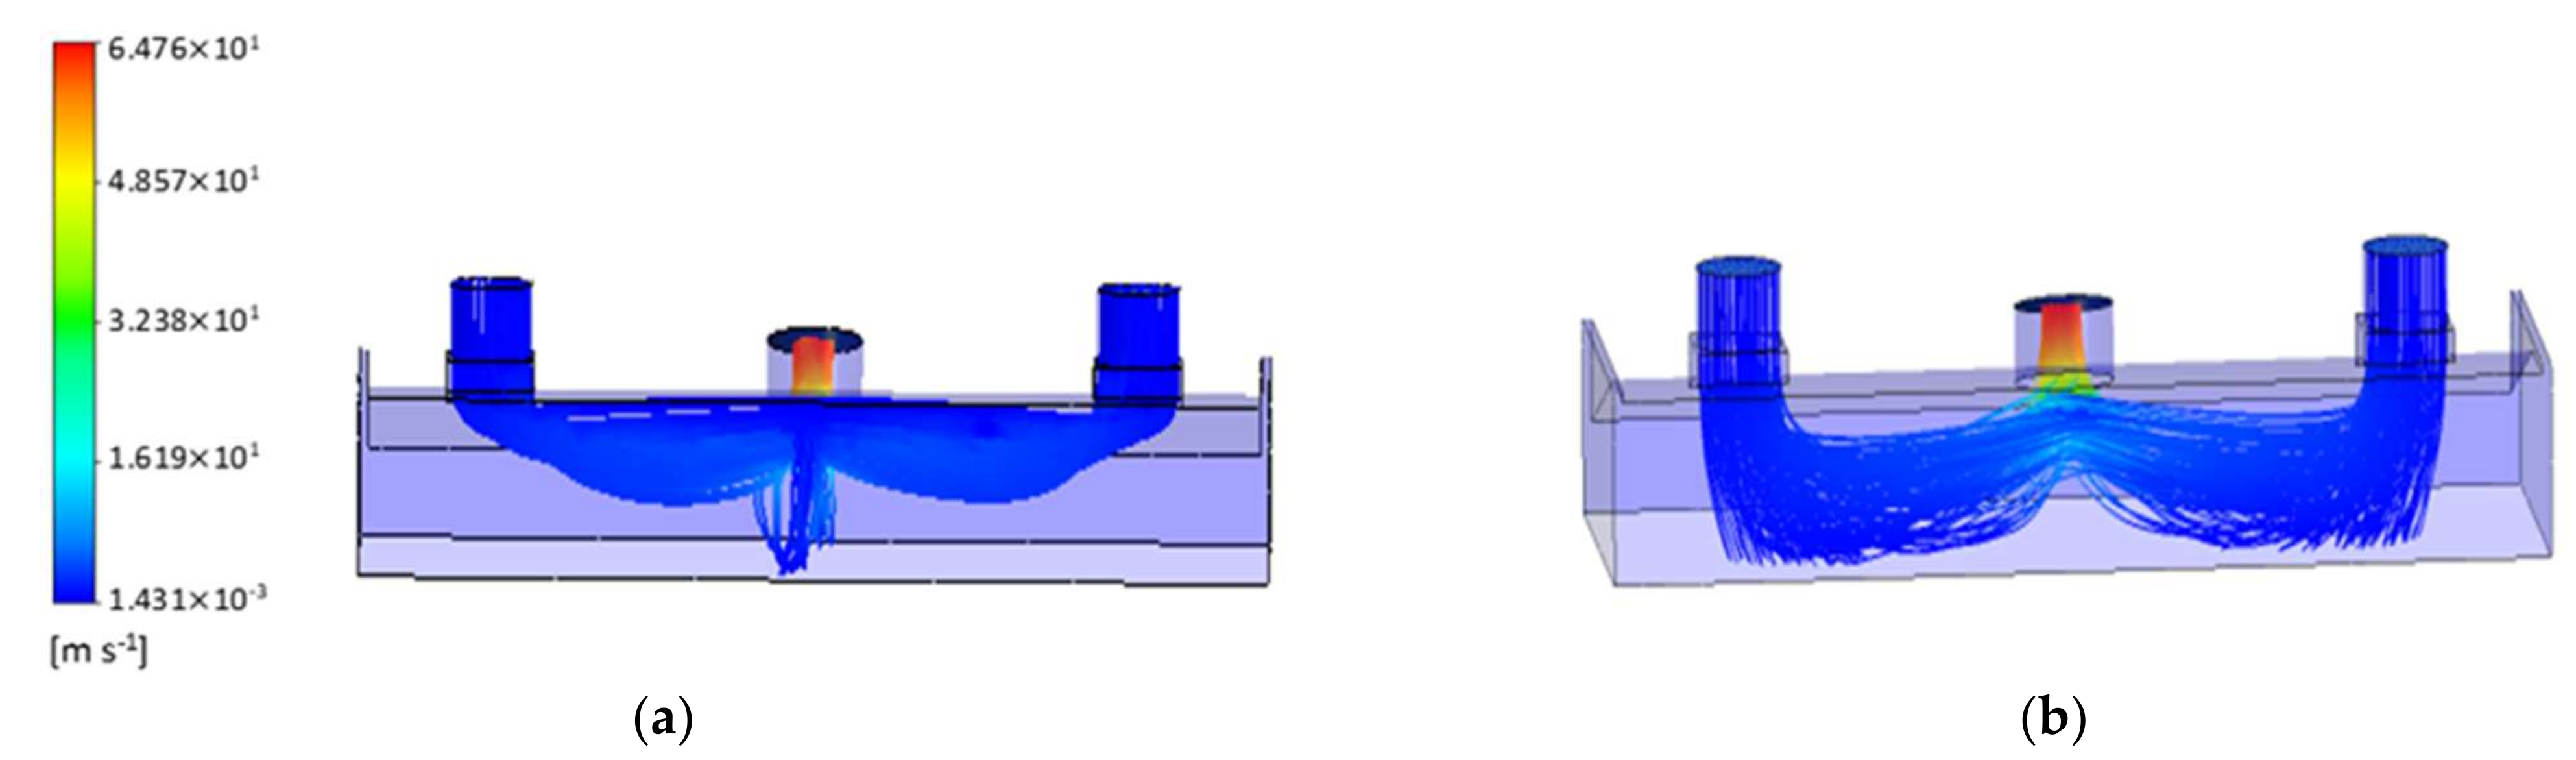
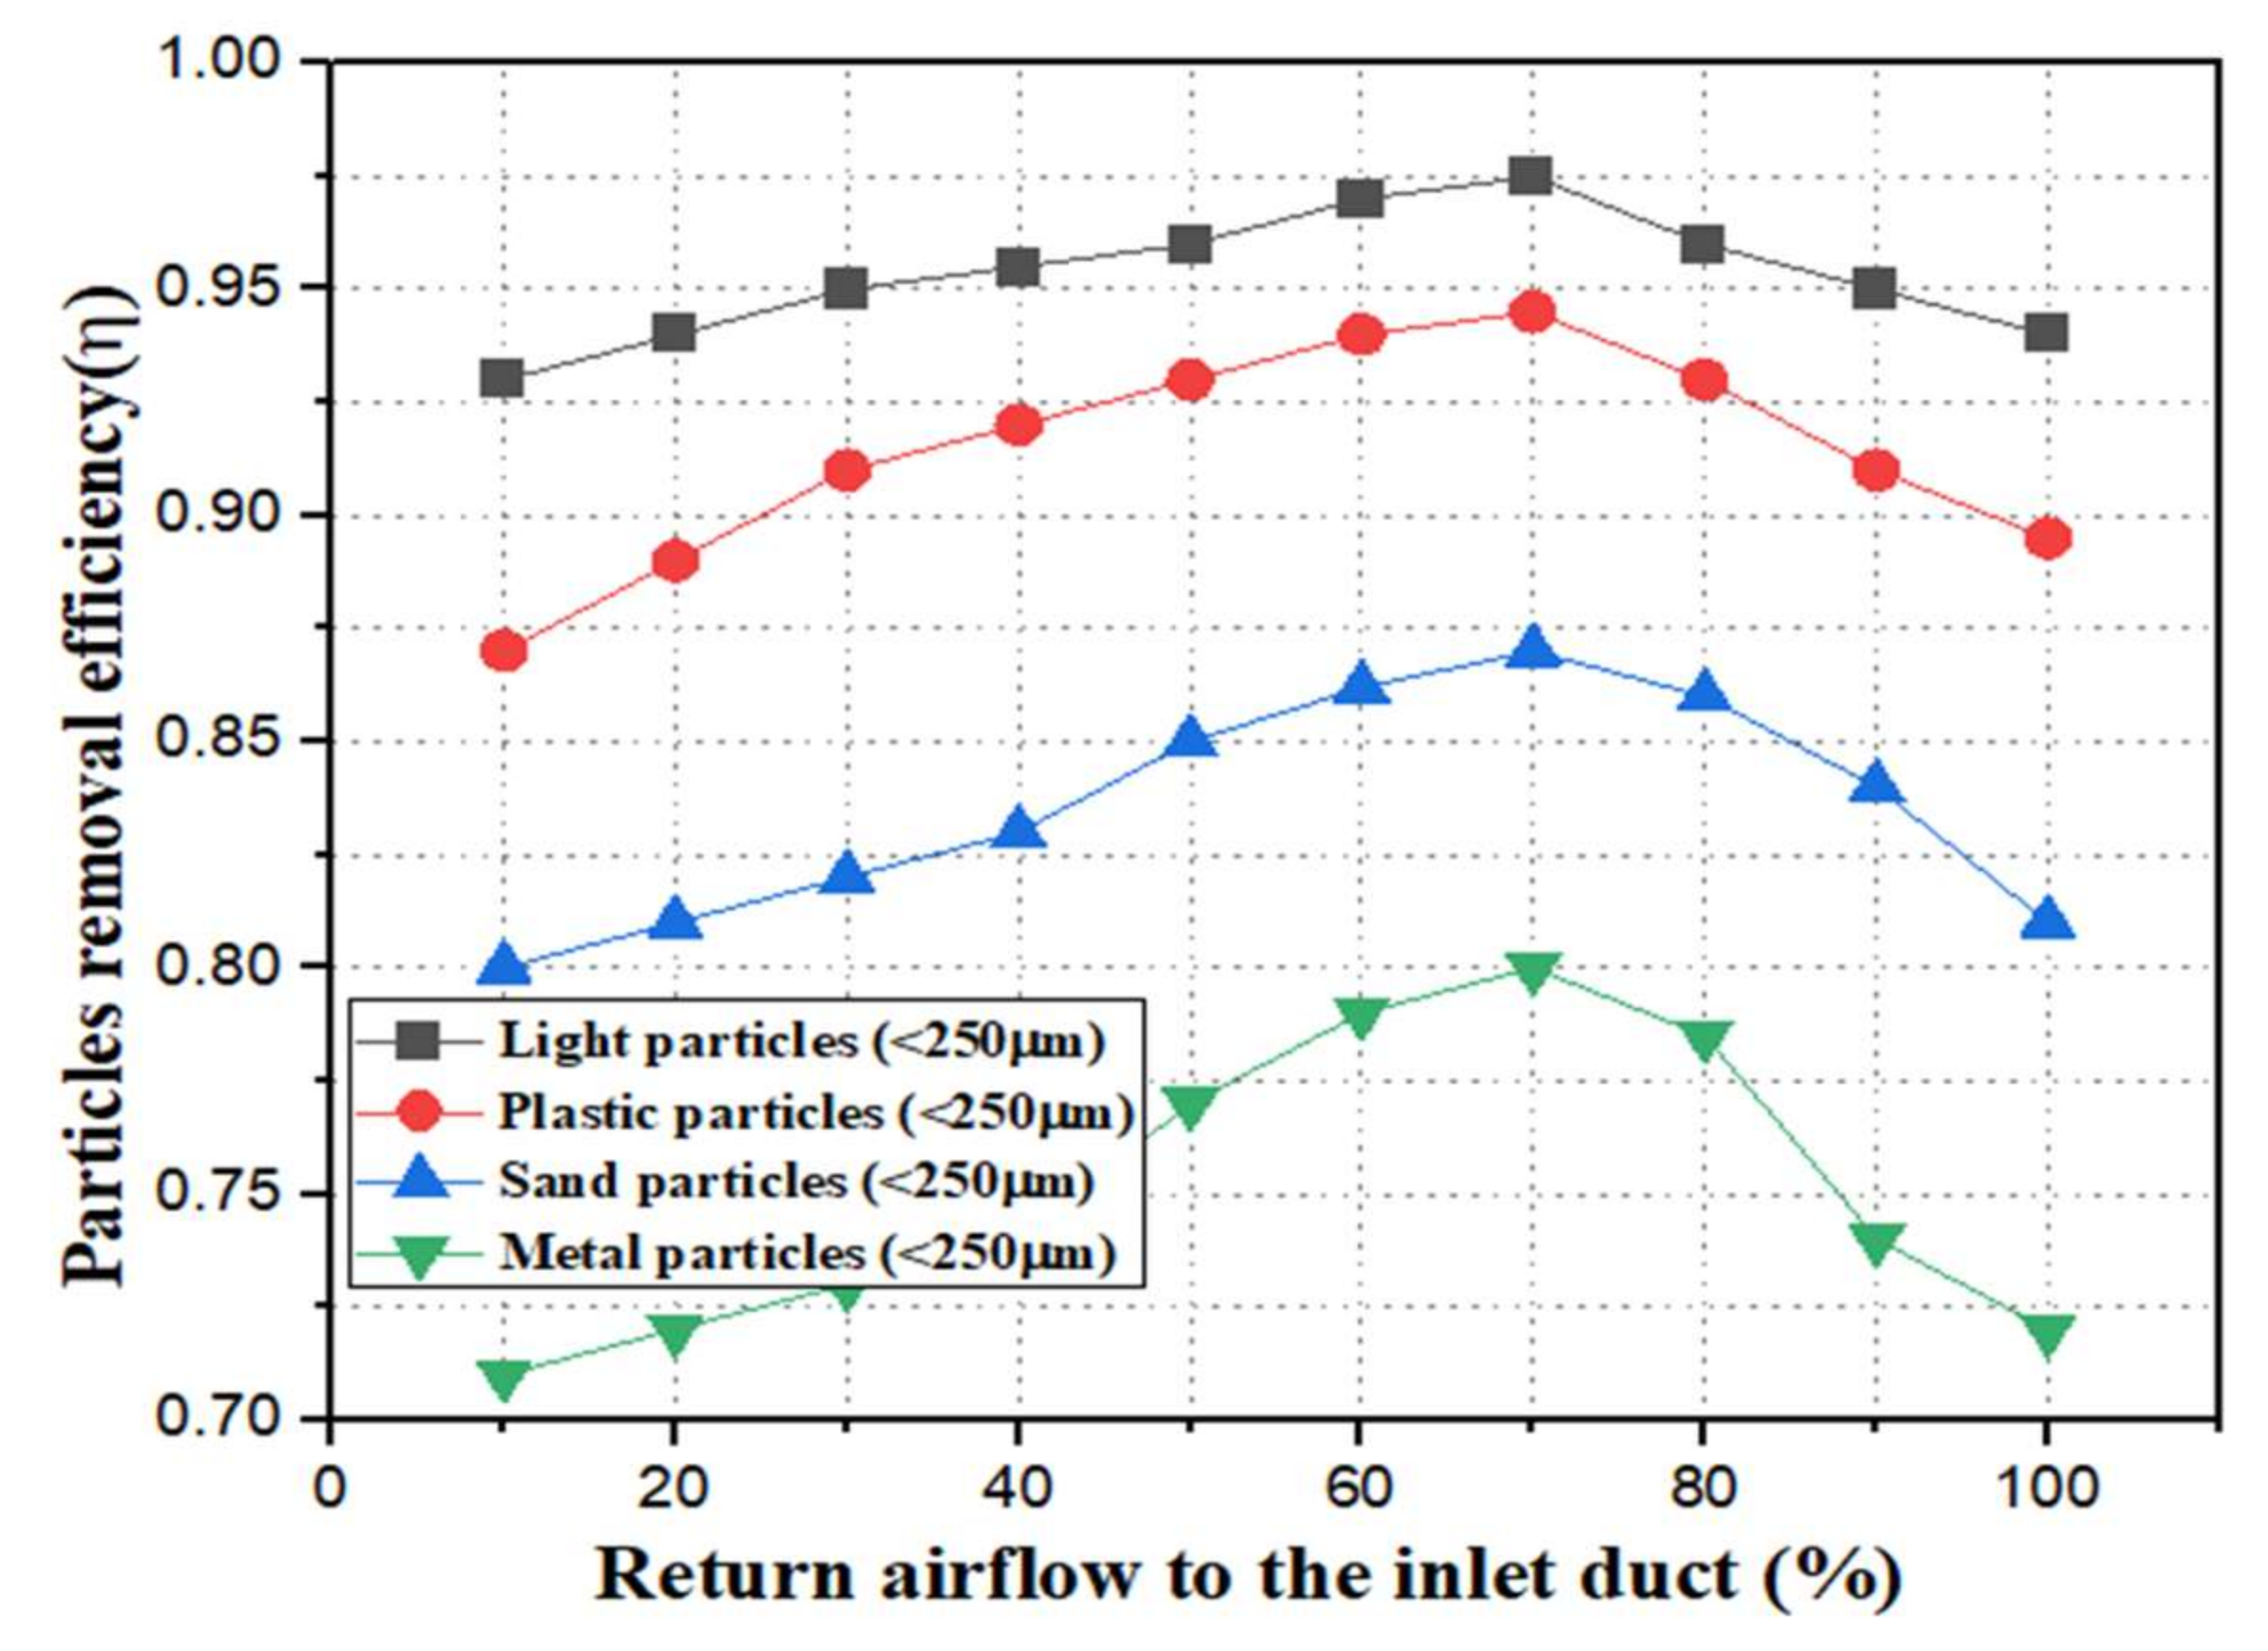
4.6. The Effect of the Recirculated Secondary Airflow in the System on the Particle Removal Efficiency

The collection head of the regenerative air vacuum sweeper plays an important role in the proper movement of air recirculation in the system due to the presence of a suction mouth and a blowing inlet duct. As the recirculating airflow in the inlet conduit of the system moves through the pickup head, the path of movement may change due to an increase in airflow velocity. When the particles move irregularly around the suction mouth, a certain part of the flow through the inlet channels of the pick-up head collides with the road surface, while the rest flows toward the suction mouth. The collision of the particle stream in the system with the particle stream on the road surface results in a change in the trajectory of the particles due to the effect on motion. Figure 15 shows the effect of the amount of flow that re-enters the system on the efficiency of the suction. The assimilation efficiency of light particles was 0.93 η, when 10% of the airflow returning from the system was directed into the inlet duct of the pick-up head, while the suction efficiency for metal particles was 0.71 η. The highest particle assimilation efficiency was obtained when 60–70% of the airflow in the system was returned through the inlet ducts of the pick-up head. When the airflow in the system was fully recirculated, the particle suction efficiency was relatively low. When the circulated airflow in the system is between 10 and 70%, it generates less resistance around the suction port, and when it is above 80%, the airflow accumulates due to the increased resistance around the suction port; as a result, the airflow increases the movement out of the pick-up head chamber.
The results of the experiment showed that the airflow in the system does not recirculate 100% in any case. A certain amount of airflow is released into the environment. There are many reasons for this: change in the trajectory of airflow moving through the inlet duct due to collision with the road surface, increase in the speed of movement of the sweeper, and negative pressure around the suction mouth.

5. Conclusions

This research, using the Euler–Lagrange method for the regenerative air sweeper pick-up head, examined the factors influencing particle removal efficiency. The results of the numerical simulation were confirmed by conducting extensive experiments on a specially designed regenerative air sweeper test-setup. The particle suction efficiency, different sweeping speeds, different particle structure, high pressure drop around the suction port when the amount of the secondary airflow circulating in the system is rotated from 0 to 100%, and changing the distance between the suction port and the surface were measured and evaluated.
Observations indicate that the initial pick-up velocity of the particles varies as their density and structure change. In the starting pick-up velocity test, 15 mm wood particles were found to move at 15.8 m/s, while sand particles moved at 26.2 m/s, and asphalt particles moved at 31.7 m/s. The effect of the particle density, particle size, and suction port diameter on the starting pick-up velocity of particles is high.
In terms of the suction efficiency of sand particles from 63 to 200 μ m, the efficiency increased from 65% to 94% when pressure varied between 1200 to 2400 Pa. As movement speeds increase, the overall efficiency of particle suction decreases. When the speed varied between 6 km/h and 18 km/h in the simulation, the overall dust collection efficiency decreased from 98% to 81%, but decreased from 97 to 70% in the experimental results. The high speed of the cleaner encourages the particles to move toward the rear narrow slot at a greater impact angle, which leads to a decrease in efficiency as the speed increases, which can be high when the sweeper is moving at a speed of 6 km/h to 12 km/h. As we measured the effect of changing the spacing distance between the suction port and the conveyor belt surface, the efficiency of particle suction decreased from 97% to 80% when the distance was changed from 120 mm to 150 mm. The experiment also included work for determination of the effect of the recirculated airflow in the suction efficiency of the regenerative air sweepers. It was found that the secondary airflow has an effect on the suction efficiency when it is fully or partially recirculated in the system. When from 10% to 100% of the airflow in the system was recirculated, there was an increase in the suction efficiency within the range of 10% to 70%, and a decrease in the suction efficiency was observed at recirculation of the air within the range of 80 to 100%. The highest positive effect in the sweeper suction efficiency was achieved when 60 to 80% of the airflow was recirculated in the system, and filtering the remaining airflow and releasing it into the atmosphere can reduce the amount of the particulate matter released into the environment. Thus, this type of pick-up head is recommended for street cleaning.

Author Contributions

Conceptualization, J.V.F. and G.T.; methodology, J.V.F.; software, P.K.A.; validation, J.V.F., G.T. and F.J.A.; formal analysis, J.V.F.; investigation, F.J.A. and Y.W.; resources, J.V.F. and G.T.; data curation, P.K.A.; writing—original draft preparation, J.V.F.; writing—review and editing, Y.W. and F.J.A.; visualization, P.K.A.; supervision, G.T.; project administration, G.T.; funding acquisition, G.T. All authors have read and agreed to the published version of the manuscript.

Funding

This study was funded by Ningxia Key R&D Planning Project (2019BFH02024) of China.

Institutional Review Board Statement

Not applicable.

Informed Consent Statement

Not applicable.

Data Availability Statement

Not applicable.

Acknowledgments

The authors give acknowledgements to the Hubei Key Laboratory of Advanced Technology for Automotive Components, Wuhan University of Technology, Wuhan 430070, China; the School of Automotive Engineering, Wuhan University of Technology, Wuhan 430070, China; and the Suizhou-WUT Industry Research Institute, Suizhou 441300, China.

Conflicts of Interest

The authors declare no conflict of interest.

Nomenclature

Parameter nameParameter meaning
C D Drag coefficient, (-)
U s Starting velocity of the dust particles, (m/s)
U p Incipient velocity of stratified dust particles, (m/s)
DDuct diameter, (mm)
LLength, (mm)
BWidth, (mm)
hHeight, (mm)
HThickness, (mm)
D1 Outlet duct, (mm)
D2 Inlet duct, (mm)
D3Inlet duct, (mm)
d ρ Particle   diameter ,   ( μ m )
m p Particle mass, (kg)
F d Drag force, (N)
F g Gravitational force, (N)
F s Particle listing force, (N)
U Air velocity, (m/s)
U p Pickup velocity (gas velocity when pickup from a layer of particles begins), (m/s)
U p u Pickup velocity (gas velocity when particles start to move on a surface), (m/s)
f Friction coefficient between dust particles and duct, (-)
g i Gravity acceleration (m/s2)
d i j Deformation tensor
A r Archimedes number, (-)
R e Reynold number, (-)
P Fluid pressure, (Pa)
x i Influence factor
G 1 Inlet mass flow rate, (kg/s)
G 2 Outlet mass flow rate, (kg/s)
K2.594, constant
σ k 1.0, constant
C 1 ε 1.44, constant
C 2 ε 1.92, constant
σ ε 1.3 constant
η w Particle removal efficiency, (%)
P m Mass of total particles, (kg)
P r m Mass of residual particles after collection, (kg)
u i Time-averaged air velocity
u Air fluctuating velocity, (m/s)
T i j Reynolds   stress   tensor ,   ( m 2 / s 2 )
G k Turbulent kinetic energy production
Greek letters
β Suction   inlet   inclination   angle ,   °
ρ g Air   density ,   ( kg · m 3 )
ρ p Particle   density ,   ( kg · m 3 )
η Particle removal efficiency, (%)
μ Dynamic   viscosity   coefficient   of   air ,   ( 1.84 5   Pa s )
v Kinematic velocity, (m2/s)
ρ Fluid   density ,   ( kg / m 3 )
ϕ Particle shape factor, (-)
k Turbulent   kinetic   energy ,   ( m 2 / s 2 )
ε Dissipation   rate   kinetic   energy ,   ( m 2 / s 3 )
Subscripts
i , j Tensor index

References

  1. Bao, Y.; Zhang, Z. Development and performance analysis of a small road sweeper and dust collector. In Proceedings of the 3rd International Symposium on Robotics & Intelligent Manufacturing Technology (ISRIMT), Virtual, 25–26 September 2021. [Google Scholar]
  2. Avsar, E.; Hanedar, A.; Toroz, I.; Alp, K.; Kaynak, B. Investigation of PM10 concentrations and noise levels of the road sweepers operating in Istanbul-Turkey: A case study. Fresen. Environ. Bull. 2010, 9, 2033–2039. [Google Scholar]
  3. Nie, W.; Zhang, X.; Peng, H.; Chen, D.; Du, T.; Yang, B.; Liu, C. Research on air curtain dust control technology for environmental protection at fully mechanized working faces. Environ. Sci. Pollut. Res. 2022, 29, 43371–43384. [Google Scholar] [CrossRef] [PubMed]
  4. Chang, Y.M.; Chou, C.M.; Su, K.T.; Tseng, C.H. Effectiveness of street sweeping and washing for controlling ambient TSP. Atmos. Environ. 2005, 39, 1891–1902. [Google Scholar] [CrossRef]
  5. Calvillo, S.J.; Williams, E.S.; Brooks, B.W. Street dust: Implications for stormwater and air quality, and environmental management through street sweeping. Rev. Environ. Contam. Toxicol. 2015, 233, 71–128. [Google Scholar] [CrossRef] [PubMed]
  6. Wu, B.; Men, J.; Chen, J. Improving the design of a pickup head for particle removal using computational fluid dynamics. Proc. Inst. Mech. Eng. Part C J. Mech. Eng. Sci. 2011, 225, 939–948. [Google Scholar] [CrossRef]
  7. Xi, Y.; Dai, Y.; Zhang, X.L.; Zhang, X. Prediction of particle-collection efficiency for vacuum-blowing cleaning system based on operational conditions. Processes 2020, 8, 809. [Google Scholar] [CrossRef]
  8. Xi, Y.; Zhang, Y.L.; Zhang, X.L.; Dai, Y. Enhancement of particle collection efficiency considering the structural interplay: Particle motion characteristics analysis. Mech. Ind. 2020, 21, 618–634. [Google Scholar] [CrossRef]
  9. Wu, B.; Men, J.; Chen, J. Study of the particle separation performance of a dust-settling hopper. Chem. Prod. Process Model. 2011, 6, 2–16. [Google Scholar] [CrossRef]
  10. Wu, B.; Men, J.; Chen, J. Numerical study on particle removal performance of pickup head for a street vacuum sweeper. Powder Technol. 2010, 200, 16–24. [Google Scholar] [CrossRef]
  11. Xi, Y.; Dai, Y.; Xiao, Y.; Li, W.; Cheng, K. Numerical study on particle suction performance of reverse blowing pickup mouth. In Journal of Physics: Conference Series; IOP Publishing: Bristol, UK, 2018. [Google Scholar] [CrossRef]
  12. Zhang, Y.C.; Yang, C.Z.; Baker, C.; Chen, M.; Zou, X.; Dai, W.L. Effects of expanding zone parameters of vacuum dust suction mouth on flow simulation results. J. Cent. South Univ. 2014, 21, 2547–2552. [Google Scholar] [CrossRef]
  13. Cai, S.; Bao, G.; Ma, X.; Wu, W.; Bian, G.B.; Rodrigues, J.J.; de Albuquerque, V.H. Parameters optimization of the dust absorbing structure for photovoltaic panel cleaning robot based on orthogonal experiment method. J. Clean. Prod. 2019, 217, 724–731. [Google Scholar] [CrossRef]
  14. Du, X.; Li, Y.; Tang, Z.; Ma, Z.; Jiang, F.; Zhou, H.; Wu, C.; Ghorbel, F.H. Modeling and experimental verification of a novel vacuum dust collector for cleaning photovoltaic panels. Powder Technol. 2022, 397, 117014. [Google Scholar] [CrossRef]
  15. Chen, X.; Yang, M.; Deng, K.; Bai, Y. Numerical analysis of a centrifugal fan for a road sweeper. In Fluids Engineering Division Summer Meeting; American Society of Mechanical Engineers: New York, NY, USA, 2017. [Google Scholar] [CrossRef]
  16. Zhijiang, O.; Zhang, Y.; Jia, G.; Yang, C.; Cao, Y.; Chen, C. Flow properties of dust suction mouth with curled edges. Mech. Sci. Technol. Aerosp. Eng. 2013, 3, 363–366. [Google Scholar] [CrossRef]
  17. Zheng, N.; Gao, X. Research and design of the cleaning and disinfecting vehicle. In Proceedings of the 2020 International Conference on Computer Engineering and Application (ICCEA), Guangzhouo, China, 27–29 March 2020; IEEE: Wuhan, China, 2020. [Google Scholar] [CrossRef]
  18. Lee, S.J. Experimental analysis of flow fields inside intake heads of a vacuum cleaner. J. Mech. Sci. Technol. 2005, 19, 894–904. [Google Scholar] [CrossRef]
  19. He, Y.; Deen, N.G.; Annaland, M.V.; Kuipers, J.A. Gas—Solid turbulent flow in a circulating fluidized bed riser: Experimental and numerical study of monodisperse particle systems. Ind. Eng. Chem. Res. 2009, 48, 8091–8097. [Google Scholar] [CrossRef]
  20. Goy, S.P.; Chew, J.W.; Hadinoto, K. Effects of binary particle size distribution on minimum pick-up velocity in pneumatic conveying. Powder Technol. 2011, 208, 166–174. [Google Scholar] [CrossRef]
  21. Hayden, K.S.; Park, K.; Curtis, J.S. Effect of particle characteristics on particle pickup velocity. Powder Technol. 2003, 131, 7–14. [Google Scholar] [CrossRef]
  22. Pang, L.; Zhang, Z.; Cui, S.; Sun, S. Experimental study of the venting characteristics of dust explosion through a vent duct. J. Loss Prev. Process Ind. 2020, 65, 104144. [Google Scholar] [CrossRef]
  23. Kalman, H.; Satran, A.; Meir, D.; Rabinovich, E. Pickup (critical) velocity of particles. Powder Technol. 2005, 160, 103–113. [Google Scholar] [CrossRef]
  24. Hu, S.; Gao, Y.; Feng, G.; Hu, F.; Liu, C.; Li, J. Experimental study of the dust-removal performance of a wet scrubber. Int. J. Coal Sci. Technol. 2021, 8, 228–239. [Google Scholar] [CrossRef]
  25. Cabrejos, F.J.; Klinzing, G. Incipient motion of solid particles in horizontal pneumatic conveying. Powder Technol. 1992, 72, 51–61. [Google Scholar] [CrossRef]
  26. Cabrejos, F.J.; Klinzing, G.E. Pickup and saltation mechanisms of solid particles in horizontal pneumatic transport. Powder Technol. 1994, 79, 173–186. [Google Scholar] [CrossRef]
  27. Neilson, J.H.; Gilchrist, A. An analytical and experimental investigation of the velocities of particles entrained by the gas flow in nozzles. J. Fluid Mech. 1968, 33, 131–149. [Google Scholar] [CrossRef]
  28. Neilson, J.H.; Gilchrist, A. An analytical and experimental investigation of the trajectories of particles entrained by the gas flow in nozzles. J. Fluid Mech. 1969, 35, 549–559. [Google Scholar] [CrossRef]
  29. Li, A.; Ahmadi, G. Dispersion and deposition of spherical particles from point sources in a turbulent channel flow. Aerosol Sci. Technol. 1992, 16, 209–226. [Google Scholar] [CrossRef]
  30. Park, I.S.; Sohn, C.H.; Lee, S.; Song, H.; Oh, J. Flow-induced noise in a suction nozzle with a centrifugal fan of a vacuum cleaner and its reduction. Appl. Acoust. 2010, 71, 460–469. [Google Scholar] [CrossRef]
  31. Rogoziński, T.; Trofimov, S. Principles of pulse-jet filters used in the woodworking industry. Ann. WULS For. Wood Technol. 2019, 105, 98–101. [Google Scholar] [CrossRef]
  32. Jiaqiang, E.; Liu, T.; Zuo, W.; Huang, Y. Simulation on entrainment process of suction mouth under negative pressure in the medium dry sanitation trucks. Appl. Mech. Mater. 2014, 711, 86–90. [Google Scholar]
  33. Jiaqiang, E.; Peng, Q.; Liu, T.; Zuo, W.; Huang, Y. Simulation optimization on sucking up dust particle by suction mouth in sanitation sweepers under the negative pressure. In Proceedings of the 2015 International Forum on Energy, Environment Science and Materials, Guangzhou, China, 25–26 August 2015. [Google Scholar]
  34. Yang, C.Z.; Zhang, Y.C.; Ouyang, Z.J.; Zhang, J.; Yang, S.Z.; Zhang, R.Z. Parametric design of dust collection port of vacuum sweeper based on flow simulation. J. Cent. South Univ. Sci. Technol. 2012, 43, 3704–3709. [Google Scholar]
  35. Zhu, H.P.; Zhou, Z.Y.; Yang, R.Y.; Yu, A.B. Discrete particle simulation of particulate systems: A review of major applications and findings. Chem. Eng. Sci. 2008, 63, 5728–5770. [Google Scholar] [CrossRef]
  36. Jin, Y.; Jiabao, P.; Hejin, A.; Lujun, Z. Relationship between flow field characteristics and dust collection efficiency of sweeper suction port. J. Eng. 2022, 2022, 389–400. [Google Scholar] [CrossRef]
  37. Alderliesten, M. Mean particle diameters. Part VII. The rosin-rammler size distribution: Physical and mathematical properties and relationships to moment-ratio defined mean particle diameters. Part. Syst. Charact. 2013, 30, 244–257. [Google Scholar] [CrossRef]
  38. Gul, H.; Alrabaiah, H.; Ali, S.; Shah, K.; Muhammad, S. Computation of solution to fractional order partial reaction diffusion equations. J. Adv. Res. 2020, 25, 31–38. [Google Scholar] [CrossRef] [PubMed]
  39. Pang, L.; Cao, J.; Xiao, Q.; Yang, K.; Shi, L. Explosion propagation in a dust removal pipeline under dust collector explosion. J. Loss Prev. Process Ind. 2022, 74, 104662. [Google Scholar] [CrossRef]
  40. Zhaowen, J.; Kai, C.; Yuming, G. Nozzle system performance analysis for suction broom road sweeper. Spec. Purp. Veh. 2012, 6, 92–97. [Google Scholar]
  41. Gilbert, M.; Davis, L.; Altman, D. Velocity lag of particles in linearly accelerated combustion gases. J. Jet Propuls. 1955, 25, 26–30. [Google Scholar] [CrossRef]
  42. Ye, J.; Jiabao, P.; Hejin, A.; and Jiamei, W. Pure electric sweeper performance analysis and test verification of dust extraction port. Appl. Sci. 2022, 12, 5188. [Google Scholar] [CrossRef]
  43. Sher, M.; Kamal, S.; Zareen, A.K.; Hasib, K.; Aziz, K. Computational and theoretical modeling of the transmission dynamics of novel COVID-19 under Mittag-Leffler power law. Alex. Eng. J. 2020, 59, 3133–3147. [Google Scholar] [CrossRef]
  44. Zeng, G.Y.; Li, X.F.; Xiao, T.Y.; Xu, Y. Simulation for the design of dust suction system of highway sweeper. Syst. Simul. 2004, 16, 2770–2773. [Google Scholar]
  45. Xin, Y.H.; Li, H.; Wu, J.J. Applications of CFD technique in the flow field analysis of road sweeper. In Applied Mechanics and Materials; Trans Tech Publ: Zurich, Switzerland, 2015. [Google Scholar] [CrossRef]
  46. Tan, G.; Chen, M.; Xu, H.; Luo, B. Vacuum cleaning vehicle dust subsidence system design. In Proceedings of the SAE 2014 World Congress & Exhibition, Detroit, MI, USA, 8–10 April 2014. [Google Scholar] [CrossRef]
  47. Haider, A.; Levenspiel, O. Drag coefficient and terminal velocity of spherical and nonspherical particles. Powder Technol. 1989, 58, 63–67. [Google Scholar] [CrossRef]
  48. Saffman, P.J. The lift on a small sphere in a slow shear flow. J. Fluid Mech. 1965, 22, 385–400. [Google Scholar] [CrossRef] [Green Version]
  49. Koshkarev, S.A.; Evtushenko, A.I.; Roschin, P.A. Modeling of cleaning of dust emission in fluidized bed building aspiratioz collector. MATEC Web Conf. 2017, 106, 07020. [Google Scholar] [CrossRef] [Green Version]
  50. Shen, H. Influence of gas flow speed on laser plume attenuation and powder bed particle pickup in laser powder bed fusion. JOM 2020, 72, 1039–1051. [Google Scholar] [CrossRef] [Green Version]
  51. Zhang, H.-J.; Wang, X.-F.; Liu, K.-K. Simulation and optimization of fan system for road sweeper. J. Highw. Transp. Res. Dev. 2018, 12, 92–97. [Google Scholar] [CrossRef]
  52. Zhou, J.; Xu, L.; Du, C. Prediction of lump coal particle pickup velocity in pneumatic conveying. Powder Technol. 2019, 343, 599–606. [Google Scholar] [CrossRef]
  53. Li, C.; Deng, Y.; Xin, Y. Flow Field Analysis and Structure Optimization of the Suction Nozzle for Road Sweeper; SAE Technical Paper, 2016-01-1356; SAE International: Warrendale, PA, USA, 2016. [Google Scholar] [CrossRef]
  54. Stefanenko, I.; Azarov, V.; Borovkov, D. Experimental optimization of dust collecting equipment parameters of counter swirling flow with coaxial leadthrough for air ventilation system and dust elimination. IOP Conf. Ser. Mater. Sci. Eng. 2019, 224, 012037. [Google Scholar] [CrossRef]
  55. Yang, D.; Liang, X.; Chen, Z.; Sun, Y.; Yin, F. Experimental study and fuzzy prediction of surface bulk negative pressure collection. IOP Conf. Ser. Mater. Sci. Eng. 2019, 612, 042037. [Google Scholar] [CrossRef]
  56. Zhan, H.; Tan, G.; Gao, Y.; Xia, J.; Xue, W.; Huang, S. Electric sweeping vehicle vacuum dust control system research. In Proceedings of the 2015 IEEE International Transportation Electrification Conference (ITEC), Dearborn, MI, USA, 14–17 June 2015; IEEE: Wuhan. China, 2015. [Google Scholar] [CrossRef]
Figure 1. Physical model of the regenerative sweeper pick-up head.
Processes 10 01252 g001
Figure 2. CFD surface mesh of the physical model.
Processes 10 01252 g002
Figure 3. Experimental setup of regenerative air-vacuum sweeper. 1—Dust feeder; 2—Conveyer belt; 3—Conveyor belt speed regulator; 4—Motor; 5—Dust feeder controller; 6—Suction mouth; 7—Electronic control valve; 8—Dust particle box; 9—Power supply BJ880; 10—Frequency converter 380 V; 11—Aicevoos Flowmeter; 12—Data equation system; 13—Air separation box; 14—Centrifugal fan; 15—Centrifugal fan outlet tube; 16—Flowmeter DN100 PTFE; 17—Centrifugal fan inlet tube; 18—Dust collector hopper with filter system; 19—Pressure gauge; 20—Blowing inlet duct; 21—Mechanical control valve; 22—Lifting devices; 23—Air velocity sensor EE660; 24—Pick-up head; 25—Frame support.
Processes 10 01252 g003
Figure 4. The particle pick-up velocity of the air when it begins to pull from the particle layer.
Processes 10 01252 g004
Figure 5. The simulation and experimental results of wood particle starting velocity.
Processes 10 01252 g005
Figure 6. Comparison of suction removal efficiency between the experiment and simulation.
Processes 10 01252 g006
Figure 7. The results of simulating the effect of changes in particle composition on recirculated flow and particle motion in the system. (a) Wood-volatiles dust; (b) Aluminum-solid dust.
Processes 10 01252 g007
Figure 8. The results of simulating the effect of changes in particle composition on the road surface on particle velocity and trajectory. (a) Wood-volatiles dust; (b) Aluminum-solid dust.
Processes 10 01252 g008
Figure 9. The results of simulating the effect of changes in particle composition and size on suction performance.
Processes 10 01252 g009
Figure 10. Experimental results of the effect of increasing the velocity of the airflow in the suction port on the efficiency of particle removal.
Processes 10 01252 g010
Figure 11. The results of experimental effects of the diameter of the blade on the suction removal efficiency.
Processes 10 01252 g011
Figure 12. The results of experimental effect of conveyor belt speed on collection efficiency.
Processes 10 01252 g012
Figure 13. Experimental result effects of different particle diameters on suction efficiency.
Processes 10 01252 g013
Figure 14. Experimental result effects of pressure drops on suction efficiency.
Processes 10 01252 g014
Figure 15. The results of experimental effect of the amount of flow that returns to the system on the efficiency of suction.
Processes 10 01252 g015
Table 1. The main dimensions of the regenerative sweeper pick-up head.
ParameterValue
Length, L (mm)1000
Width, B (mm)390
Height, h (mm)120
Thickness, H (mm)20
Outlet duct, D1 (mm)110
Inlet duct, D2 (mm)65
Inlet duct, D3 (mm)65
Table 2. Setting of parameters for the simulation calculation.
FeatureGas PhaseFeatureSolid Phase
FluidAirParticle diameter distributionRosin–Rammler
CompressibilityIncompressibleMass velocity (kg/s)0.5
Dimensions3D Gas   density   ( kg / m 3 )1.225
Time dependenceSteady stateSpread parameter (n)5.95
Turbulence model k - ε (2eqn) Min   particle   diameter   ( μ m )50
Inlet conditionVelocity inlet Max   particle   diameter   ( μ m )250
Outlet conditionPressure outlet Particle   mean   diameter   ( μ m )125
Table 3. The density of the particle on the road surface.
Material Density   ( kg / m 3 )
Wood600
Sand1650
Clay 2080
Asphalt2400
Glass2500
PVC1230
Polypropylene900
Gypsum1650
Bricks1900
Granite2600
Steel7850
Table 4. Particle pick-up velocity (air velocity at the beginning of the pick-up from the particle layer) (m/s).
MaterialShapeParticle Density,
ρ p   ( kg / m 3 )
Particle Diameter,
d p   ( mm )
Suction Duct Diameter,
D (mm)
Particle   Pick - Up   Velocity ,   U p u   ( m / s )
Asphalt concreteNon-spherical24003.4510012.33
GraniteNon-Spherical26003.310013.15
Clay (wet)Non-spherical20804.110010.24
SandSpherical16503.210011.32
GypsumNon-spherical12003.781008.83
GlassSpherical24802.910014.25
BricksNon-spherical19002.7510013.41
PVCSpherical12303.71009.06
Polypropylene PPSpherical9003.21008.98
GravelNon spherical18004.81008.59
SteelSpherical78502.9510021.82
Table 5. Values of airflow and particle velocity at the air intake of the pickup head.
Airflow Velocity
(m/s)
Light Particles Velocity
(m/s)
Sandy Particles Velocity (m/s)
1513.211.77
2017.8615.8
2522.3719.9
3027.324.15
3531.828.35
Table 6. The effect of the distance between the road surface and the suction mouth on the efficiency of particle collection.
Suction Mouth Distance with Conveyor Belt Surface, L (mm)Particle’s Size Range, d (mm)Particle Material Particle   Removal   Efficiency ,   η (%)
12010–25Leaf0.97
3PVC 0.93
8–20Wood0.91
15Paper0.98
3–5Glasses0.86
<5Stone–Sand 0.80
13010–25Leaf0.92
3PVC 0.87
8–20Wood0.85
15Paper0.93
3–5Glasses0.79
<5Stone–Sand 0.73
14010–25Leaf0.86
3PVC 0.81
8–20Wood0.80
15Paper0.89
3–5Glasses0.73
<5Stone–Sand0.66
15010–25Leaf0.80
3PVC 0.74
8–20Wood0.71
15Paper0.82
3–5Glasses0.67
<5Stone–Sand 0.58
Publisher’s Note: MDPI stays neutral with regard to jurisdictional claims in published maps and institutional affiliations.

