Article

Airflow Distributions in a Z Type Centripetal Radial Flow Reactor: Effects of Opening Strategy and Opening Rate

1
UNSW Engineering, University of New South Wales, Sydney NSW 2052, Australia
2
College of Biochemical Engineering, Beijing Union University, Beijing 100023, China
3
School of Energy and Environmental Engineering, University of Science and Technology Beijing, Beijing 100083, China
*
Author to whom correspondence should be addressed.
Processes 2022, 10(7), 1250; https://doi.org/10.3390/pr10071250
Submission received: 12 April 2022 / Revised: 4 June 2022 / Accepted: 10 June 2022 / Published: 23 June 2022
(This article belongs to the Section Chemical Processes and Systems)

Abstract

:
Computational fluid dynamics (CFD) was adopted to investigate the influence of the three-section opening strategy in the Z type centripetal radial flow reactor on the uniformity of the gas flow, which aimed to optimize the opening rate of the reactor. The simulation results showed that as the pore-opening ratio of are 10%, 16% and 29% for three sections from top to bottom of the central channel, the opening rate of the circular channel perforated plate is 10–12%, 21–25% and 30–40% from top to bottom, respectively; the uniformity of the reactor was then achieved. Through the simulation results, it was also found that the change in the opening rate at the center pipe perforated plate had a greater contribution to the gas flow mal-distribution inside the reactor. The contribution of the change in the opening rate of the annular channel perforated plate to the uniformity of the gas flow inside the reactor was smaller than that of the center pipe. Annular channel width should not be smaller, such that gas flow malfunction inside the reactor could be avoided, although high-speed velocity cases were encountered.

1. Introduction

Radial flow reactors have been widely used in many vapor-phase catalytic processes. Since the rapid development in the field of air separation and gas–solid catalytic reaction, there has been an upward trend toward the widespread use of radial flow reactors or adsorbers [1]. The primary benefit of radial flow reactors is that they have a lower bed pressure drop, lower energy consumption and smaller footprint compared with conventional axial flow reactors [1]. The annular channel distributing header is the major internal part that provides the radial flow pattern inside the reactors, which consist of a perforated wall located between the reactor wall and the catalyst/adsorbent bed. The annular space between the annular channel and the central channel is packed with catalysts or adsorbents.
The flow direction of the radial flow reactor is generally as follows. The gas flows into the annular channel through the inlet, then passes through the packed bed radially from the annular flow channel, enters the central pipe, and is finally discharged from the outlet [2].
Under the trend of super large-scale development of gas processing equipment, the demand for large-scale radial flow reactors is gradually increasing. The larger intake of air demand means the need to increase the height and adjust the diameter of the reactor. However, blindly increasing the height of the reactor increases the ratio of the height of the adsorbent bed to the equivalent diameter of the annular flow channel (height to diameter ratio), which could cause highly complex pressure changes along the height, which could result in flow non-uniformity through the bed [3,4]. Non-uniform flow could lead to a serious impact on the super large equipment, such as the gas short circuit, which causes earlier gas penetration. This may result in a significant drop in the utilization efficiency of the adsorbent, a more frequent replacement of the adsorbent, increased operating costs and reduced purification efficacy.
In view of the maldistribution of radial velocity in the reactor, researchers have applied computational fluid dynamics (CFD) methodologies to simulate and analyze gas flow characteristics inside the reactor. Prior work by Hlavacek and Kubicek [5], Calo [6], and Balakotaiah and Luss [7] demonstrated that different flow directions in the radial flow reactor could affect the efficiency of the reaction conversion. Ponzi and Kaye [8] conducted analytical studies on uniform radial flow distribution, addressing the effects on RFBR performance.
Chu et al. [9] simulated and analyzed the variation of the inside radial flow reactor flow distribution with different inlet air velocity by using CFD software and it is concluded that the greater the inlet speed, the working time of the reactor will be reduced, the switching frequency will be faster, and the operation will be inconvenient (but there are different optimal inlet speeds for reactors of different sizes).
Miao and Pang [10] draw the flow distribution traces line and come to the conclusion with the consideration of radial flow reactor should not only need to avoid the formation of a dead zone at the top of the adsorbent area but also needs to consider the uniformity when gas passes through the catalyst bed, the better uniformity it has the greater usage efficiency that the catalyst bed could have.
Li, Zhou and Lin [11] conducted a simulation using the CP-z type molecular sieve adsorber model. The results show that although the adsorber has a more uniform pressure drop overall, the pressure drop at the bottom part is relatively small, and the middle part has the highest pressure drop. The velocity variety at the bottom of the adsorber is larger than that at the top, and its speed deviation value is 13–19%. In addition, the velocity change at the top and bottom of the molecular sieve layer is smaller than that in the middle, and the velocity deviation value is 17–26%.
To investigate the axial flow distribution, Lobanov and Skipin [12] have operated an RFBR in three commercial reforming units and all the reactors are CP-z types. The test result shows that the uniform flow distribution in the reactor only occurs at the lower part of the catalyst bed; this phenomenon indicates that most of the upper catalyst bed is not fully utilized.
In the simulation results based on a CP-z type radial flow reactor, Chen et al. [13] found that when the diameter of the reactor is constant, as the height of the reactor increases, the greater the deviation of the gas velocity distribution curve from the ideal curve, the more uneven the gas distribution along the axis of the catalyst fixed bed. Moreover, the research team also indicated that if the ratio of the radius of the annular channel to the radius of the center pipe is too small, this will cause a significant increase in the flow rate at the upper part of the catalyst bed and could lead to gas penetrating faster than the lower part.
In research on the fluid distribution design of the radial reactor, Zhang et al. [14,15] proposed four calculation models: the momentum exchange model, the friction control model, the momentum exchange term dominance model and the friction term dominate model. These four models are used to calculate and design the flow inside the reactor. Furthermore, suitable design dimensions for fluid distribution forms and flow channels under various flow models are obtained.
Based on four calculation models, Zhu, Zhang and Xu [16] further studied the cross-sectional ratio relationship between the annular flow channel and the center pipe. In the 1990s, a mathematical model that can reflect the fluid flow characteristics of the radial flow reactor was established by Xu [17] based on Zhang’s research [14,15] and the article shows that for the π-flow type radial reactor, the centripetal flow type can have more uniform gas distribution than the centrifugal flow under the same conditions.
By studying four different types of radial flow reactors, Kareeri [18] found that the cross-sectional ratio relationship between the annular flow channel and the center pipe has a greater impact on the uniformity of the flow distribution. Moreover, Wang, Liu and Meng [19] modeled the laboratory small radial reactor flow experimental device and conducted numerical simulation research through the 3D modeling method. By simulating the different influences, including the flow form of the gas flow, the cross-sectional area ratio of the outer flow to the center pipe, and the opening rate of the center pipe, the results indicate that the uniformity of centripetal flow is better than centrifugal flow. Furthermore, the smaller the opening rate of the center pipe, the better the air distribution effect in the radial reactor.
In recent studies, Li et al. [20] used CFD software to implement numerical simulation to check the uniformity of the gas flow inside the CP-z type RFBF. Li first studied the relationship between the meridional pressure drop of the bed and the ratio of the cross-sectional area of the central tube to the cross-sectional area of the annular channel. By monitoring the variety of pressure drops inside the RFBR in the next step, three improved forms of gas flow distribution (including lower distributor, upper distributor, and distributor added to the upper and lower sides) are proposed. The lower distributor is a solid conical frustum, and the upper distributor is a cylindrical tube. The distributor further improves the gas flow distribution inside tFhe RFBR. Finally, Li concluded that under this RFBR model, the diameter of the cross-sectional area of the central pipe and annular channel was 0.27 m and 0.84 m, respectively; the adsorber achieved the best performance. Moreover, the pressure drop of the bed has the best uniformity when the lower distributor is a conical frustum with a length of 0.37 m and its top and bottom diameters are 0.2 m and 0.26 m, respectively; the upper distributor is a cylindrical tube with a length of 0.54 m and a diameter of 0.2 m.
On the basis of Li’s research, Chen et al. [21] continued to study the airflow distribution of the CP-z type RFBR in the process of carbon dioxide adsorption and desorption by observing the velocity changes in the contour and came to the conclusion that adding conical frustum and cylindrical tubes can improve the uniformity of adsorption and desorption processes to 97.13% and 90.07%, respectively.
Celik [22] claimed that it can reduce the maldistribution inside the radial reactor by equally dividing the distributor into three sections and in each section, the perforated annular distributor should have a different number of holes to achieve better uniform gas distribution. In the article, Celik believes that the opening rate should be divided into sections, as shown in Figure 1 The first section is 1–10%, the second section is 10–25%, and the third section is 25–50%. The gas distribution in the radial reactor can be better when the opening rate is opened in the above-mentioned style.
Thus, based on the research of the above-mentioned scholars in related fields, the application of the computational fluid (CFD) method to analyze the gas flow in the radial flow reactor can more clearly demonstrate the form of gas flow distribution inside the reactor.
Previous research results indicate that traffic distribution has a greater impact on the operation of RFBR. In the above-mentioned literature on the research of RFBR fluidity, there are few studies on the influence of the opening rate of the wall distributor on airflow distribution, and there are also fewer studies on the opening rate in large-scale industrial equipment. This article will adopt three-dimensional CFD modeling on a large-scale industrial radial flow denitrification tower. The simulation model was established by changing the area of the annular flow channel, the opening strategy of the center distributor, and the opening strategy of the annular distributor, which were studied to optimize the structure of the radial flow reactor.
Figure 2 shows a typical flow distribution pattern in a radial flow reactor. Only when the gas mass flow is equally distributed along the axial height of the packed bed can a more uniform radial flow distribution be obtained. The radial gas flow distribution on the axial height of the catalyst bed in the radial flow reactor determines the operating efficiency of the reactor. When the gas mass flow is equally divided along the axial height of the catalyst bed, a relatively uniform radial flow distribution can be obtained. On the contrary, if the gas mass flow along the fixed catalyst bed is not relatively equal, this could cause some part of the catalyst bed to flow more gas and the other part to flow less gas, which will lead to a decrease in the utilization rate of part of the bed [12].
As Kareeri, Zughbi and Al-Ali [18] mentioned in their article, for a CP-z or a CP-π type radial flow reactor, when the non-uniform flow distribution occurs, the possibility of forming a cavity between the annular channel and the catalyst bed at the bottom or top of the catalyst bed increases, respectively, as shown in Figure 2b. Thus, the CF-z or CF-π configuration of the reactor could also have the same problem shown in Figure 2e,f; the only difference is that the cavity is located between the center pipe and the catalyst bed. The CP type and the CF type configuration shown in Figure 2a,d indicate that having a radial pressure independent of the axial coordinate is an important criterion in the design of a radial flow reactor because this criterion allows the gas flow to be equally distributed as it passes through the catalyst bed. Therefore, the pressure distribution in the reactor determines the optimum utilization of the catalyst.

2. Simulation for a CP-Z-Type RFBR

2.1. Numerical Model

In this paper, the adsorption process is ignored to simplify the calculation. Moreover, because the porous media model is used in the bed of the research object, the flow rate of the flowing part of the bed is low, and the flowing gas can be considered a stable and incompressible ideal gas. Therefore, the turbulence model adopts the k-ε model, and the control equation can be expressed as follows:
(1)
Continuity equation:
·   v = 0
(2)
Momentum equation:
ρ v   · v = p + μ 2 v + ρ g + S
From the equation above, S is the source term which in this study are using one other model that is porous media model. The porous media model is used for the catalyst bed.
For the catalyst bed:
S = μ α v + C 2 1 2 ρ v v
In Equation (3), α is the permeability and C 2 is the inertial resistance factor. Ergun equation, a semi-empirical correlation equation applicable over a wide range of Reynolds numbers has been used, α and C 2 can be represented as:
C 2 = 3.5 D p 1 ε ε 3
α = D p 2 150 ε 3 1 ε 2
where the porosity of the catalyst bed is represented as ε and D p is the average diameter of the catalyst. In this simulation, the bed porosity and catalyst average diameter are assumed to be 0.38 and 4.6 mm, respectively.
(3)
k-ε equation:
ρ dk dt = x i μ + μ t σ k + G k + G b ρ ε
ρ d ε dt = x i μ + μ t σ ε + C 1 ε ε k G k + C 3 ε G b C 2 ε ρ ε 2 k
μ t = ρ C μ k 2 ε
In the formula, G k represents the generation of turbulent kinetic energy due to the average velocity gradient; G b is the generation of turbulent kinetic energy due to the influence of buoyancy; C 1 ε , C 2 ε , C 3 ε , k and ε are all constants.

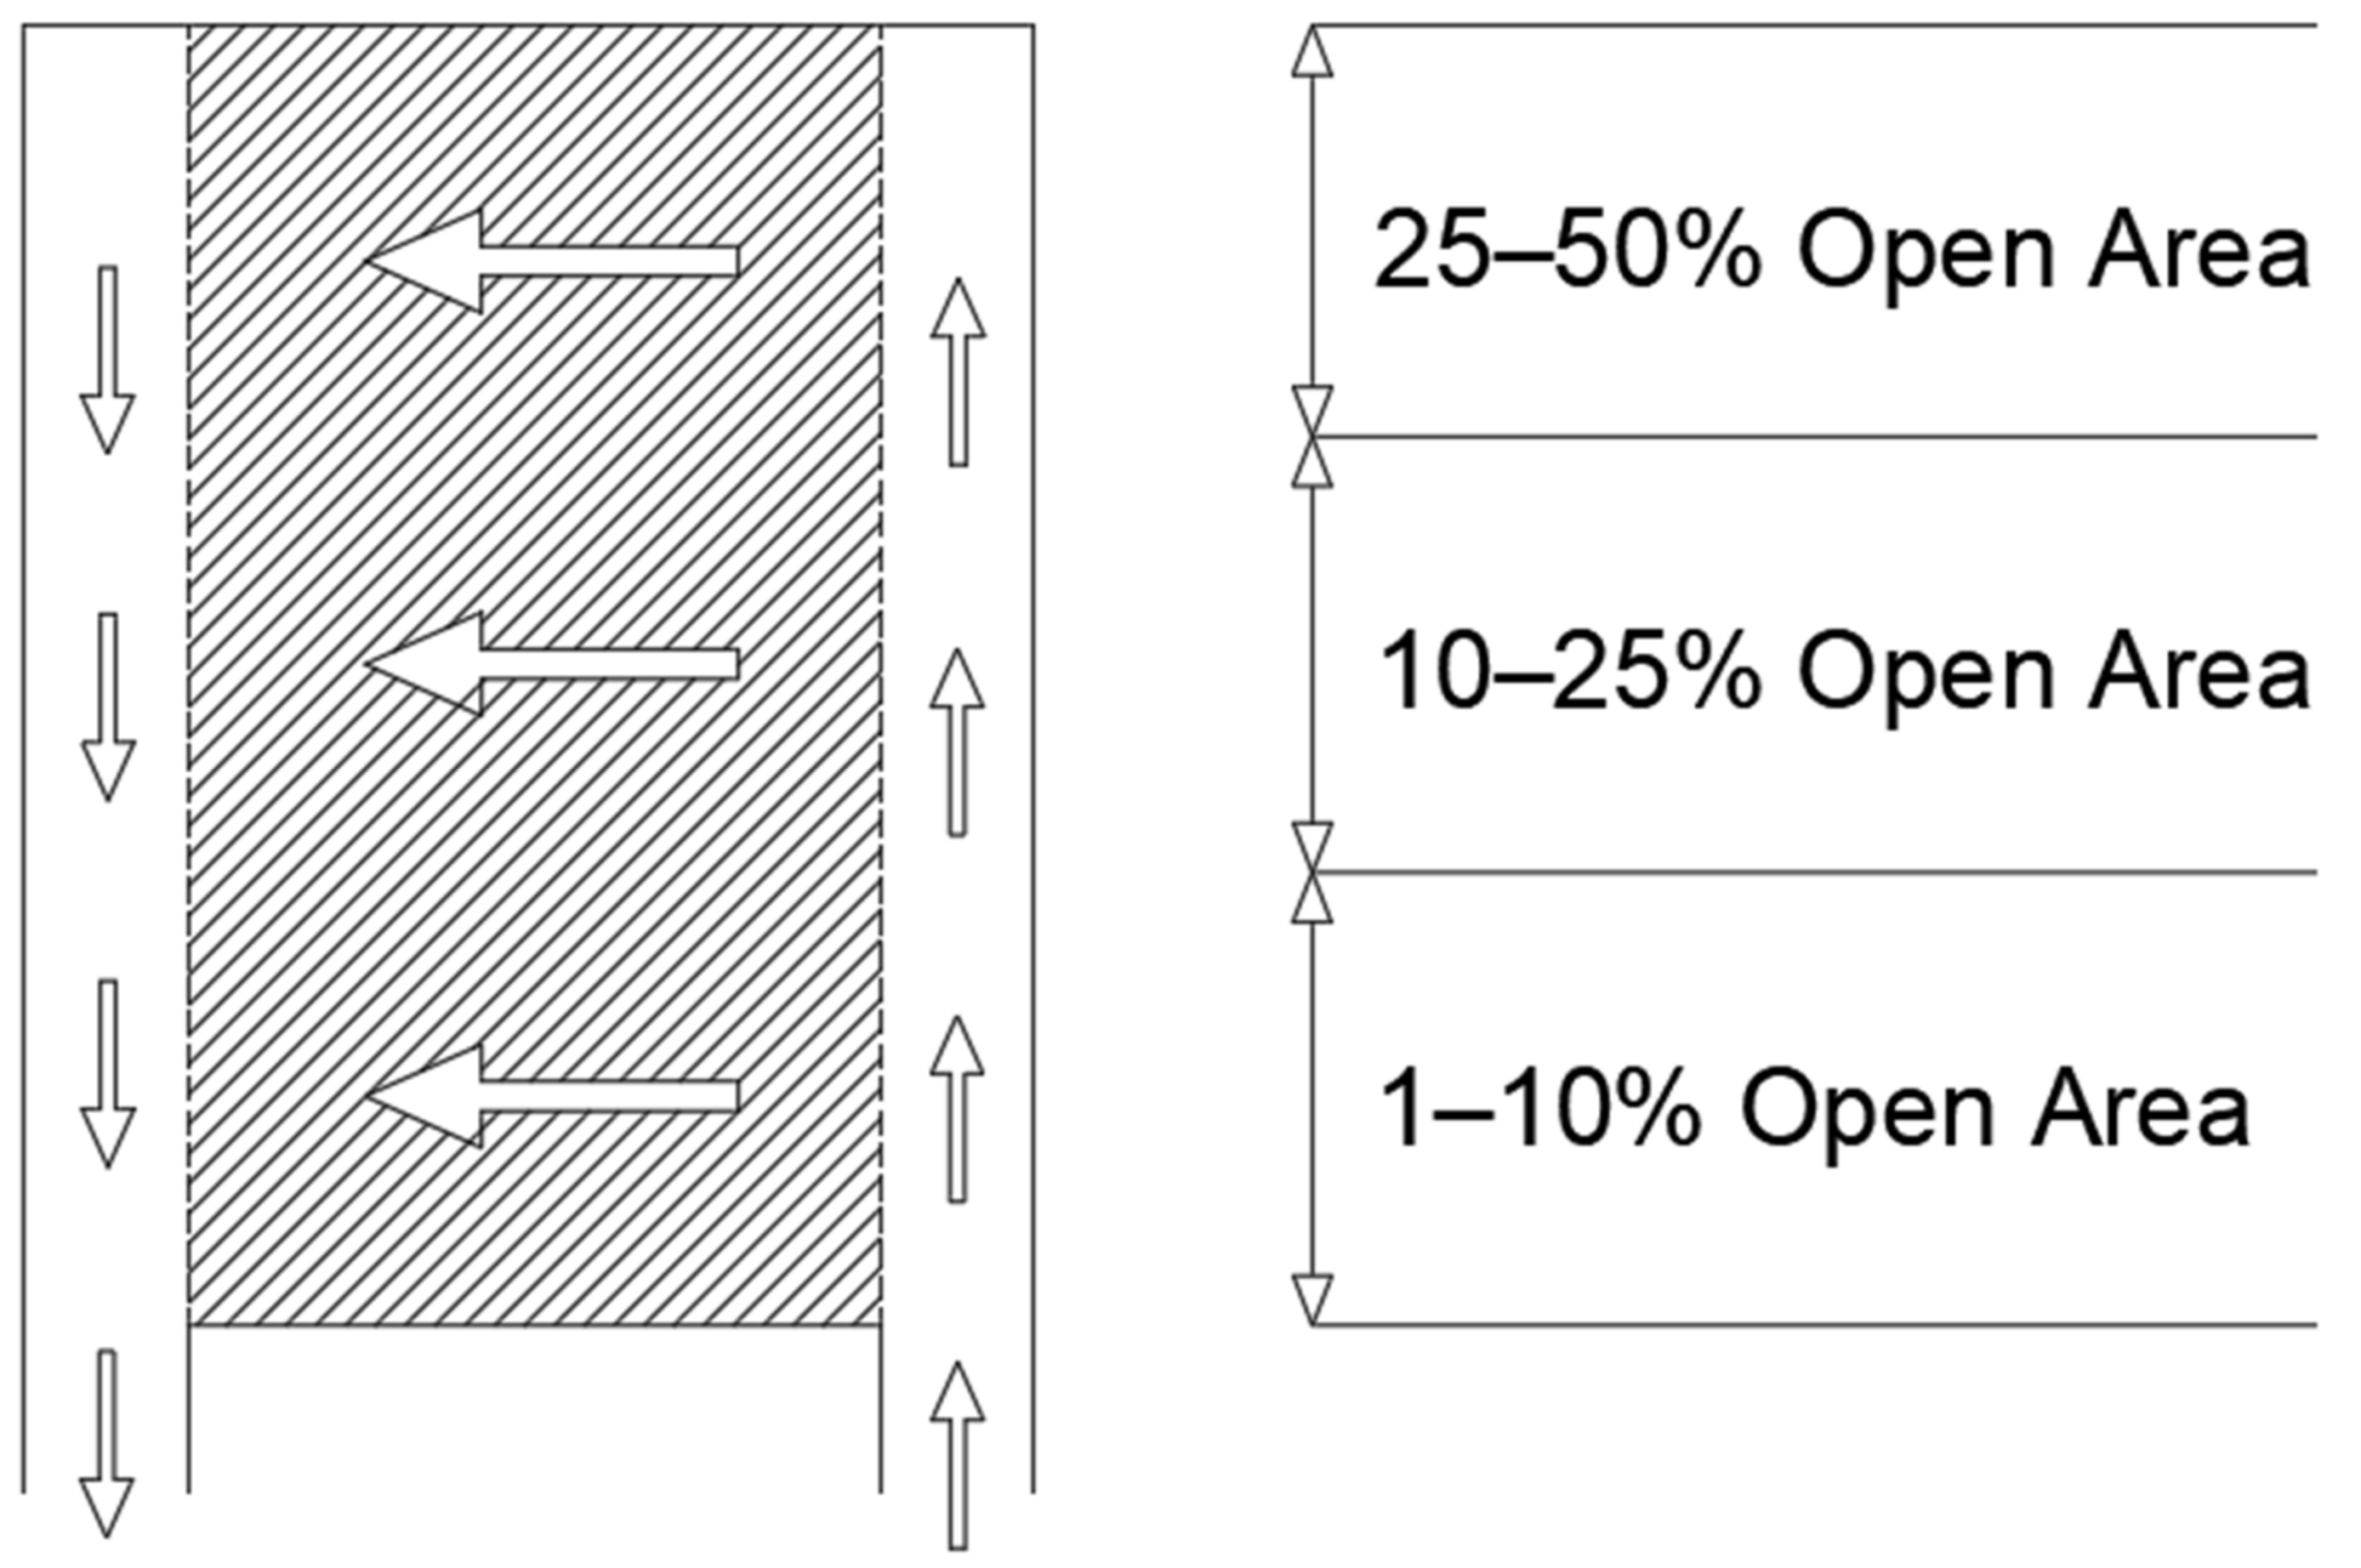
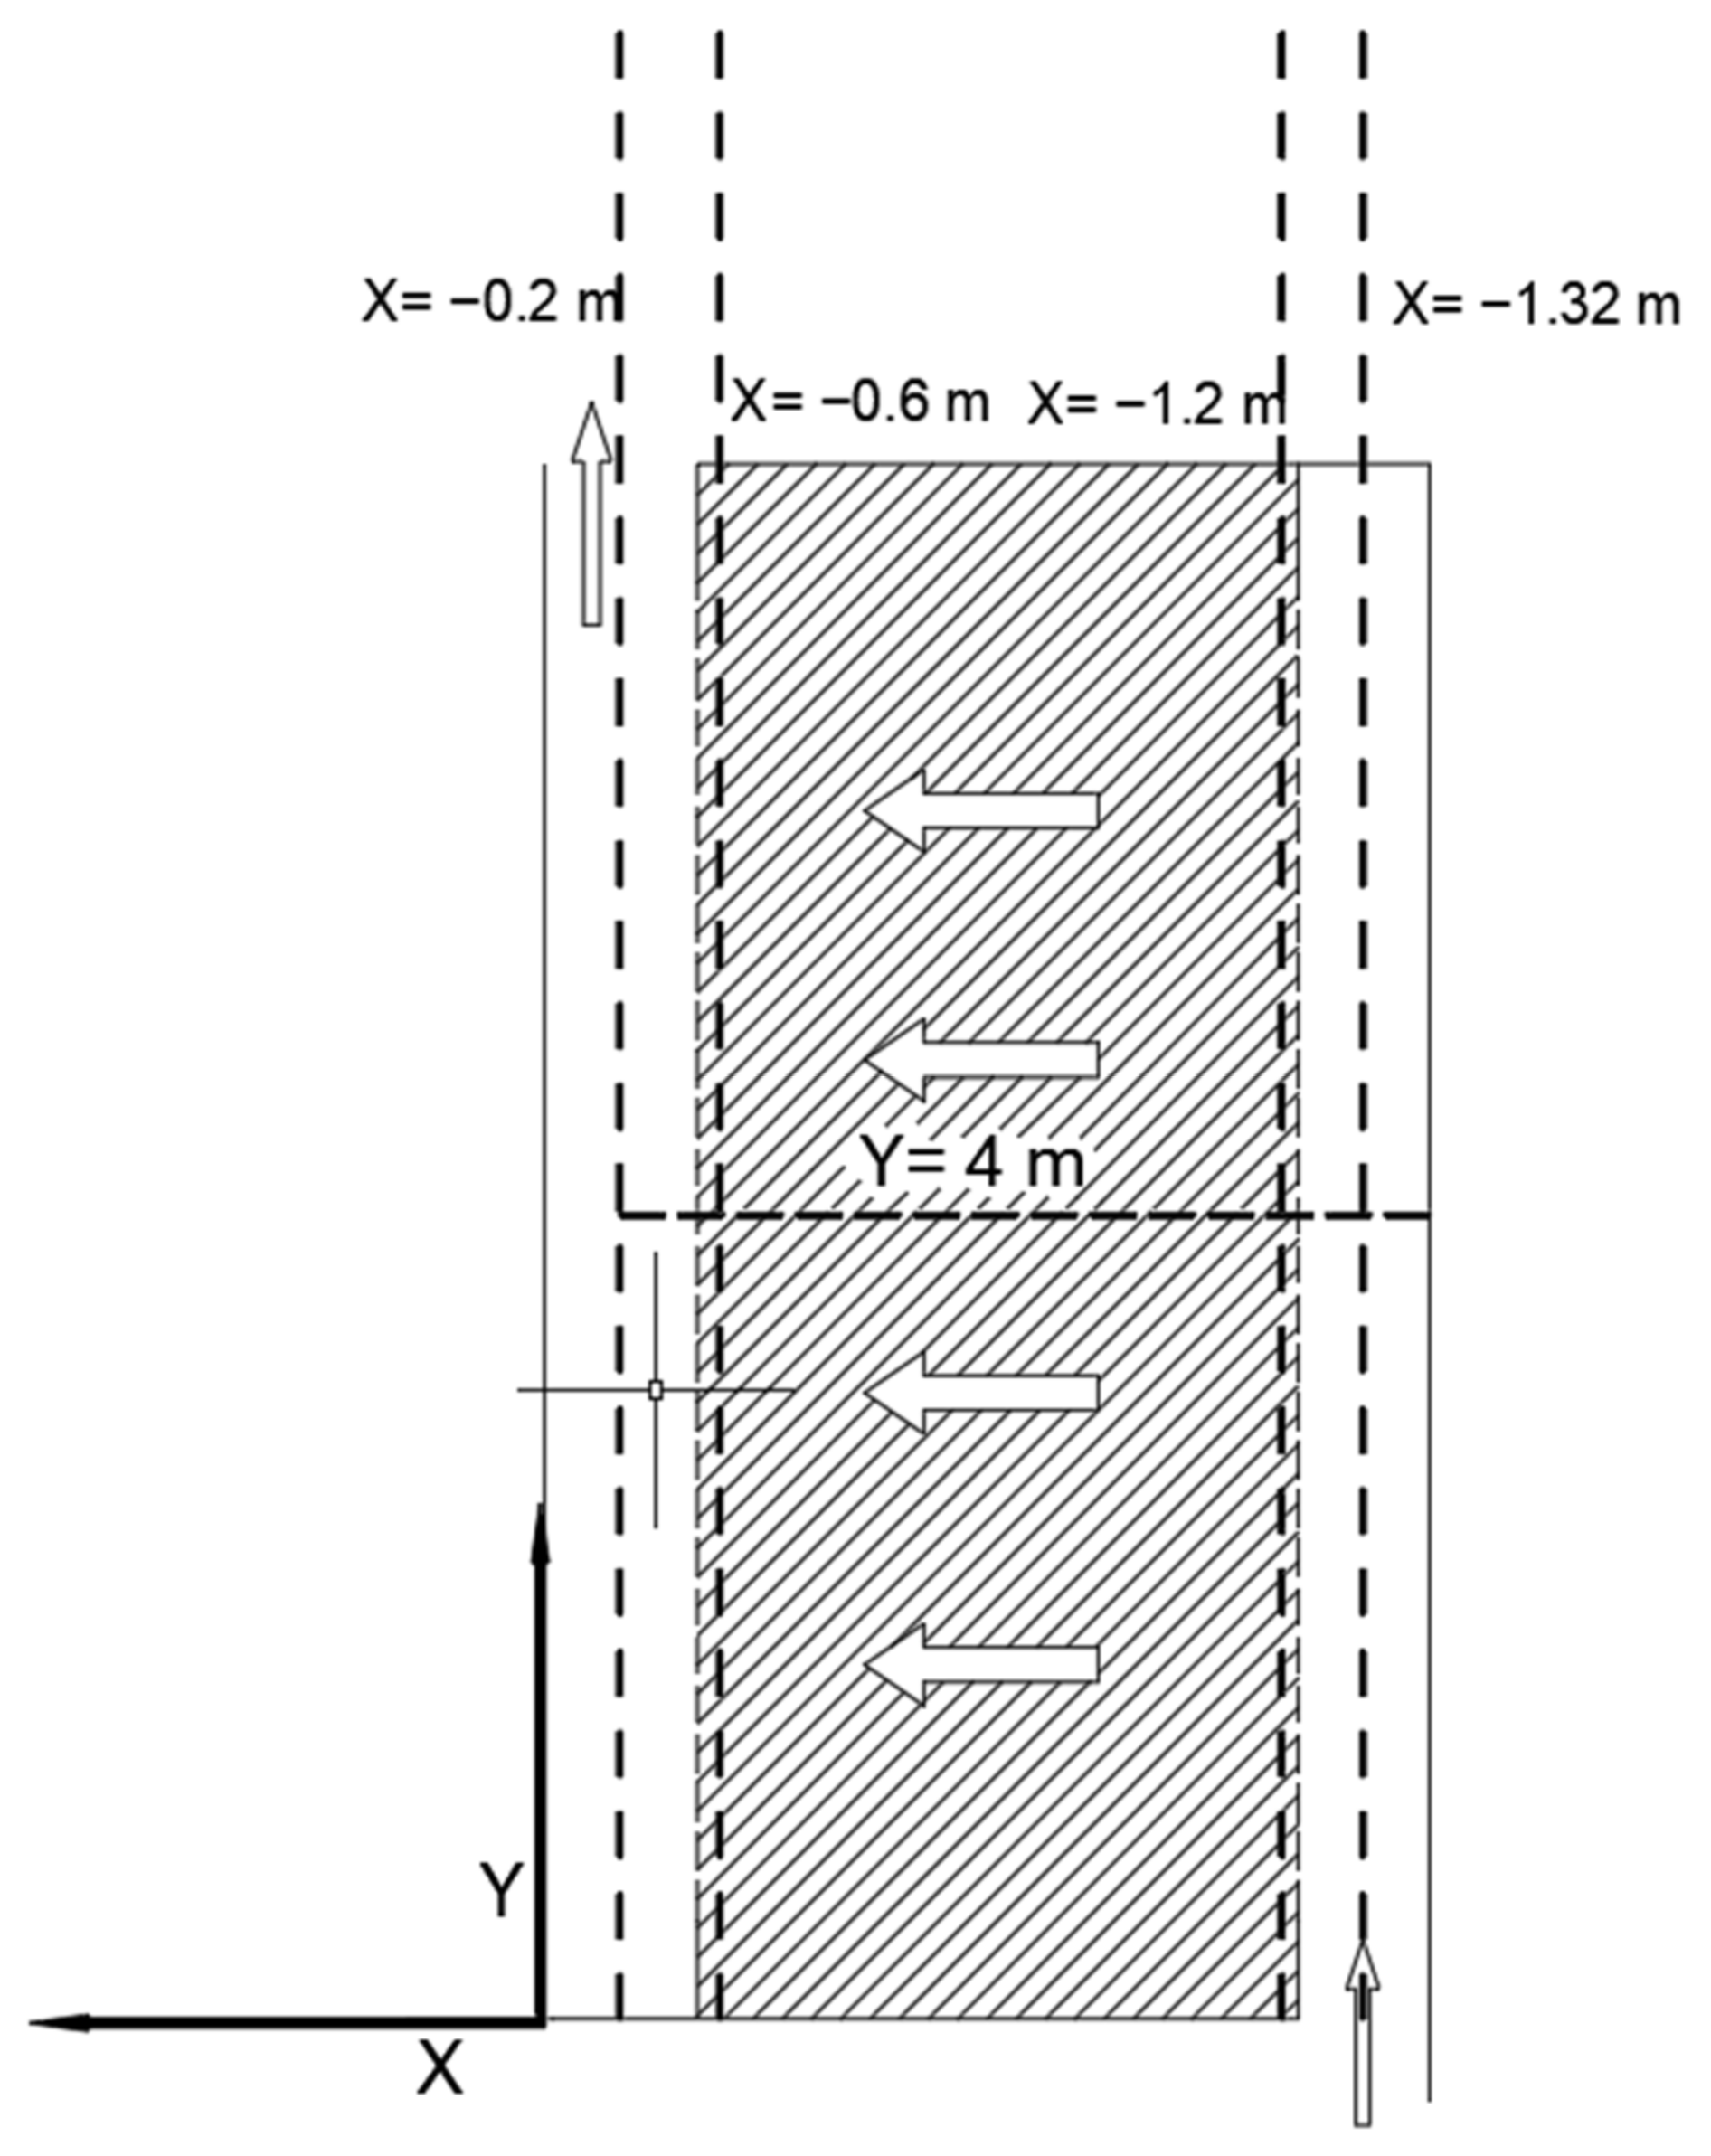
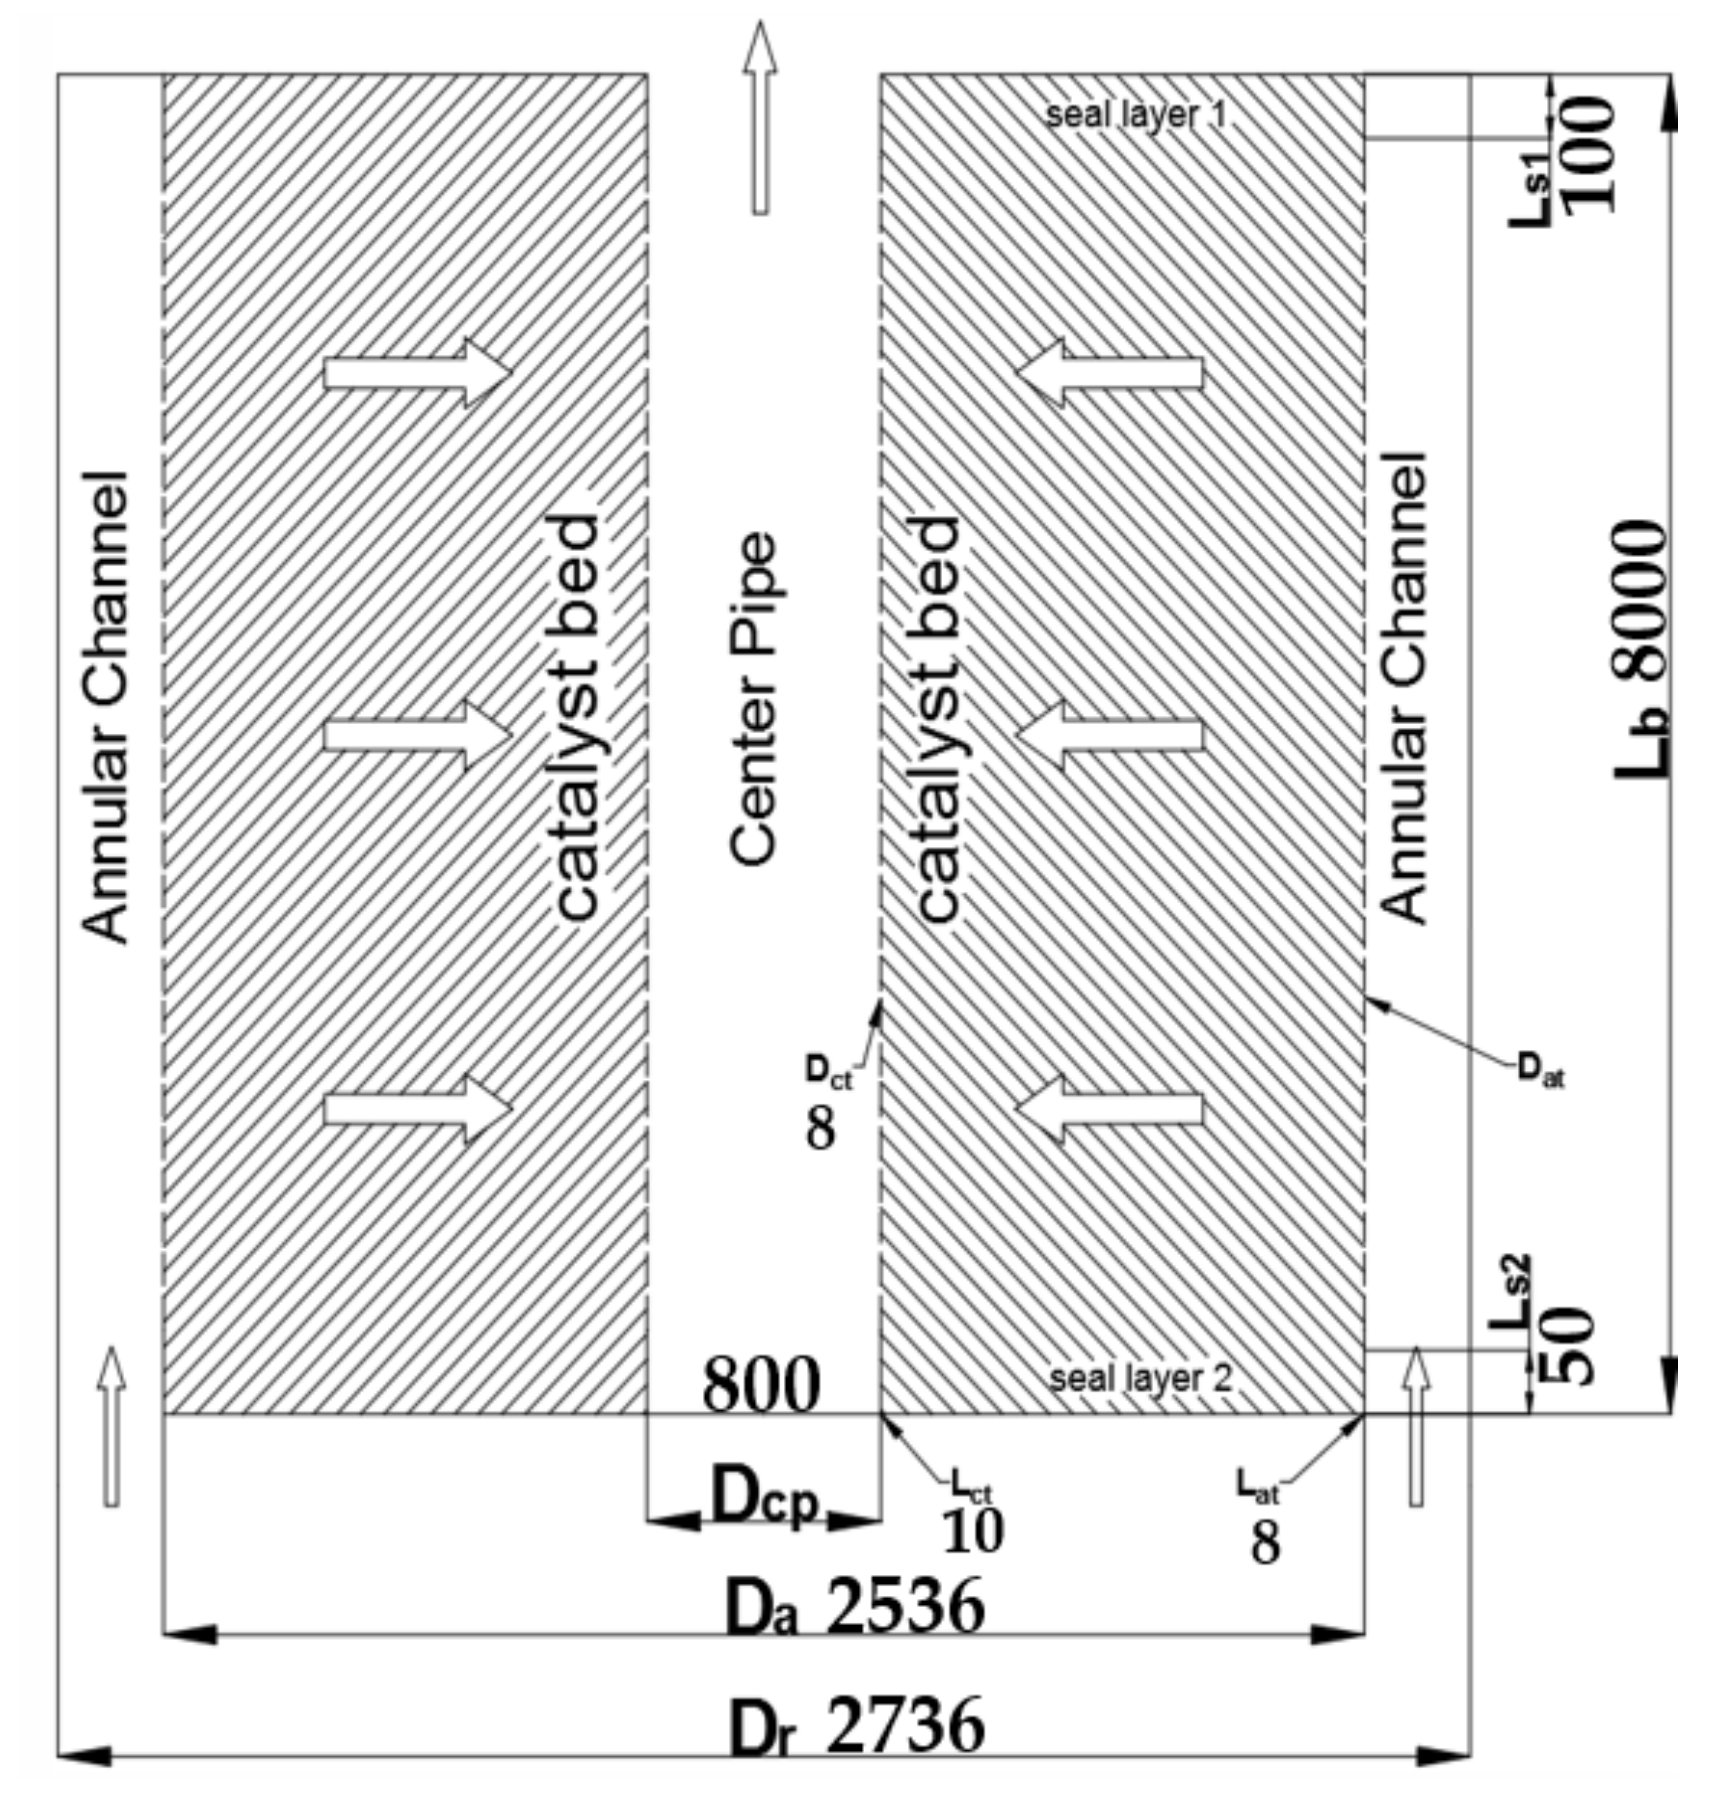
2.2. Geometrical Model

A schematic diagram of the radial flow reactor simulated in this study is shown in Figure 3. The reactor configuration adopts the CP-z configuration. The overall structure of the reactor consists of two cylinders with a distribution plate structure and the outer wall of the reactor. The gas enters the reactor inlet, flows into the annular channel, passes the catalyst fixed bed (porous medium area) through the distribution plate, and finally goes into the center pipe and then flows out from the outlet. The driving force for the gas to flow through the catalyst bed is the radial pressure drop between the annular channel and the center pipe. The reactor size and operating conditions of this RFBR model are shown in Table 1 and Table 2.
Inspired by Celik’s [22] research, which divided the distributor into three sections, each section has various opening rates (porosity) to achieve the goal of making uniform airflow. In this study, the controlled variable method was used to modify the three parameters of the reactor model by using Celik’s three-section hole-opening strategy, including the width of the annular channel, the opening rate of the inner cylinder wall distribution plate, and the opening rate of the outer cylinder wall distribution plate. By changing these three parameters, the effect of the opening rate on the gas uniformity distributed influence can be explored. The variety of these three parameters is shown in Table 3.

2.3. Assumptions and Boundary Conditions

Due to the radial flow reactor model used in this study is closer to the size of the industrial super large reactor, the geometrical model needs to be simplified with the following assumptions and boundary conditions:
(1)
The three-dimensional model will retain a 1/32 fan-shaped computing domain;
(2)
There is no temperature change during gas flow;
(3)
Feed gas is assumed to be an incompressible ideal gas;
(4)
The Y+ value is 30;
(5)
The viscous model was used as a standard k-epsilon with enhanced wall function.

3. Simulation Results and Discussion

When discussing the results, cuts were made along with the height of the distribution plate close to the center pipe side and the distribution plate close to the annular channel side to demonstrate the radial velocity changes. Figure 4 shows the location of these cuts (X, Y values).
Figure 5 shows the velocity distribution in the annular channel and the center pipe. Air enters the annular channel from the bottom at a speed of 9.71 m/s and flows in the annular channel to the top. When the gas flows upward along the annular channel, it enters the bed through the perforated wall. Therefore, the gas flow velocity in the height direction in the annular channel decreases as the height increases and reaches zero at the top.
Since the flow area at the bed is much larger than the cross-sectional area of the annular channel, the gas flow radial velocity in the bed is much smaller than that in the annular channel and the center tube. As shown in Figure 6, the circumferential flow area decreases and the velocity increases toward the center pipe. Thus, the highest velocity in the catalyst bed is located near the gas distribution plate on the side of the center pipe. Before further analysis, a mesh independence test should be performed to eliminate the influence of the grid on the numerical simulation.

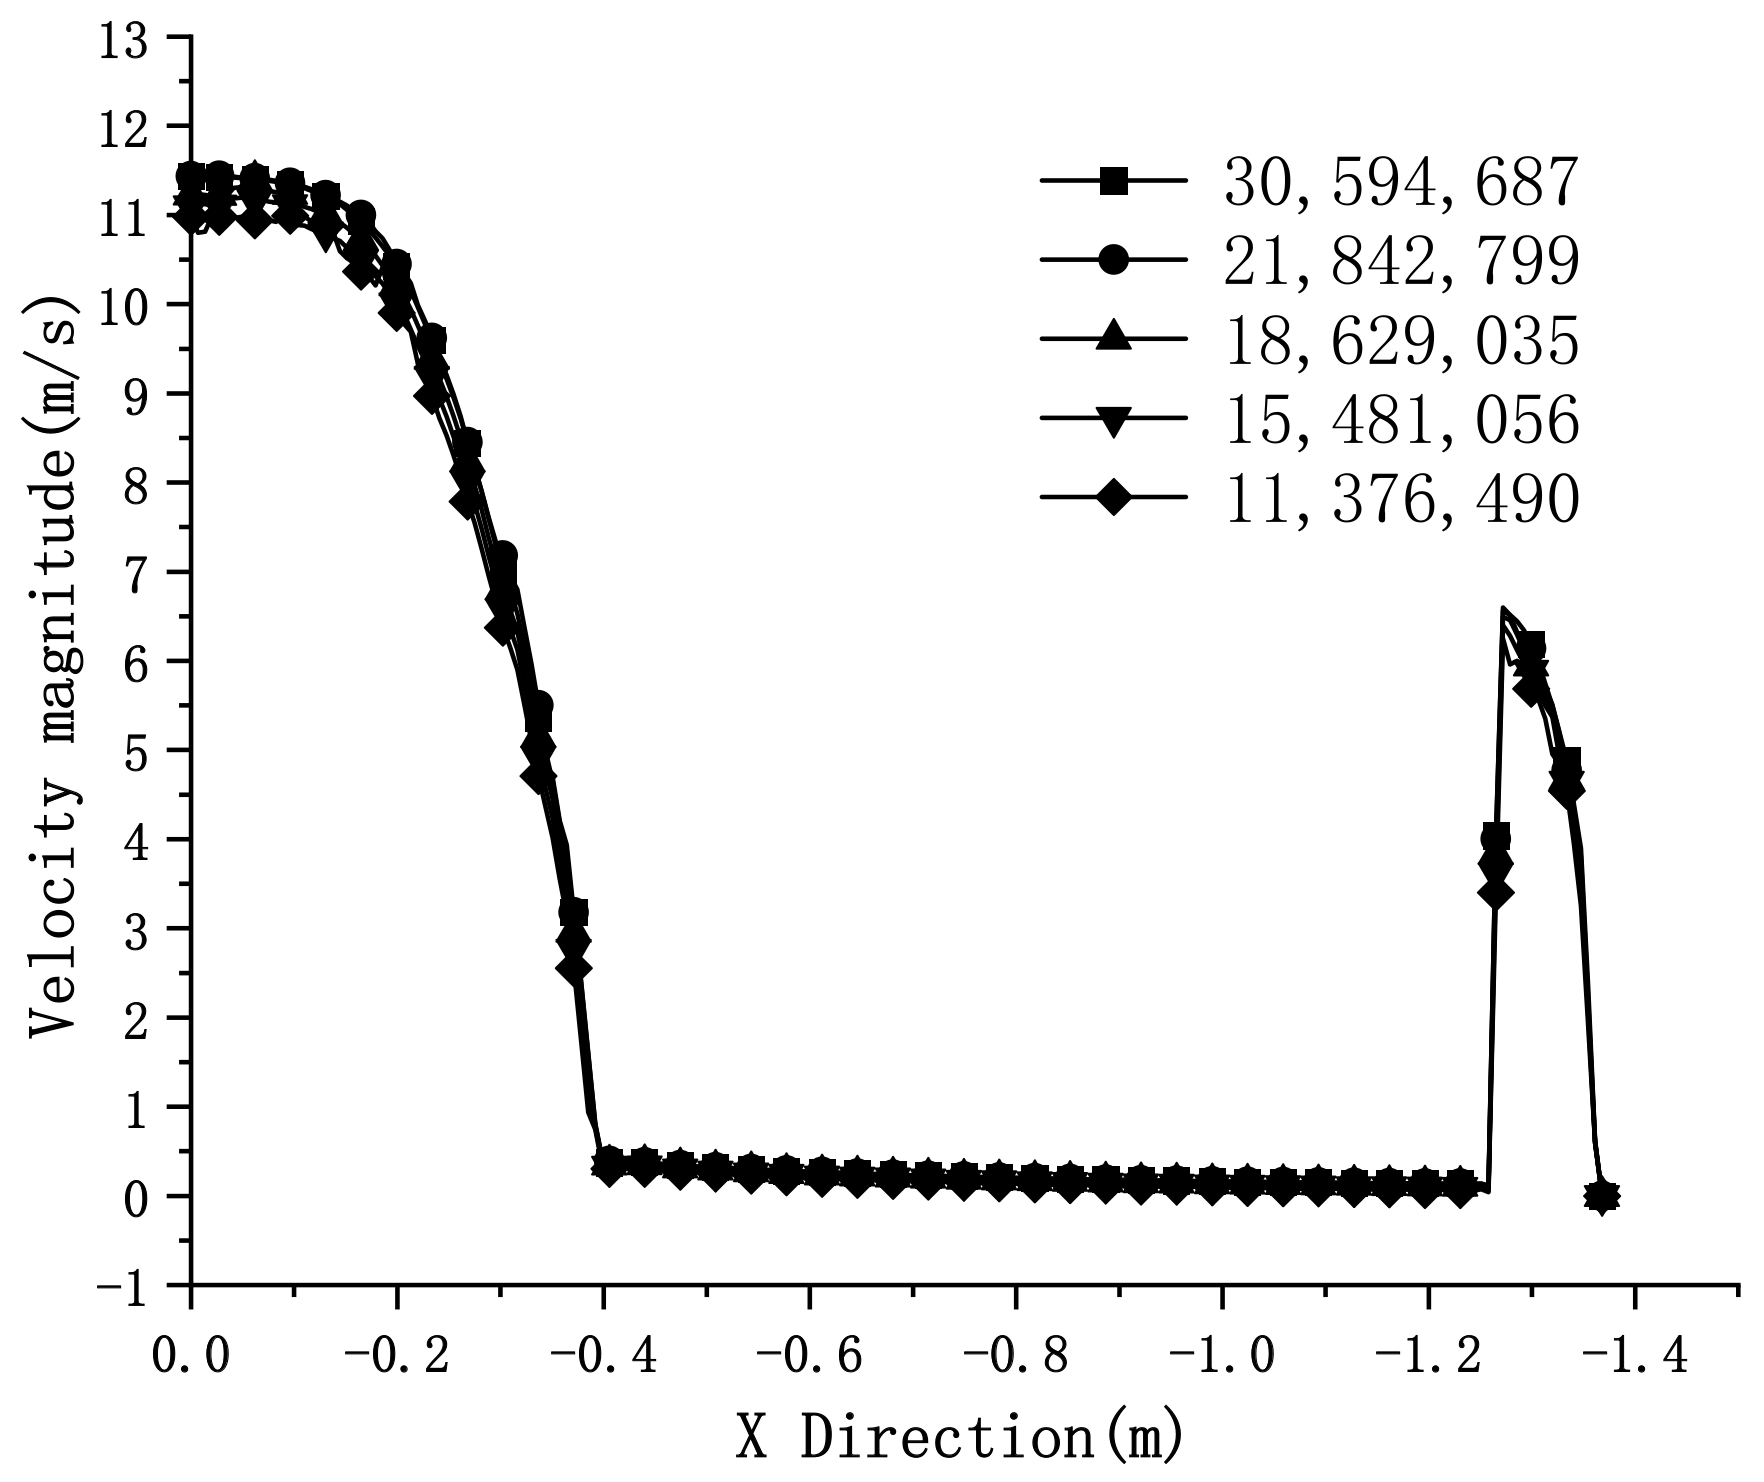
3.1. Mesh Independence Test

To optimize computing resources and ensure that the results of simulation calculations are independent of the number of meshes, mesh independence tests are carried out by gradually reducing the mesh size from a large mesh until the simulation result does not change significantly. In this study, the total number of mesh cells of 11,376,490, 15,481,056, 18,629,035, 21,842,799 and 30,594,687 are selected.
Since the three regions in the simulation model (annular channel, center pipe and bed) have different flow rates in the intercepted sections, a thorough mesh independence test is performed by plotting the radial direction velocity distribution of all mesh numbers of the reactor. From the results shown in Figure 7, the velocity distribution at the radial direction of the reactor does not vary with mesh number, except for the location of the center pipe. The difference between the simulation results obtained by different mesh numbers at the location of the catalyst bed is not obvious, which can be explained by the largest gap and the lowest velocity. Similar results on catalyst bed velocity variation are also shown in the article by Kareeri and Zughbi [18]. Figure 8 shows the flow velocity distribution in the annular channel under all mesh numbers, showing that the velocity distribution in the annular channel changes when the number of meshes increases from 11,376,490 to 15,481,056 and to 18,629,035. Therefore, it can be concluded from the mesh independence test that there are better results when the mesh numbers are 21,842,799 and 30,594,687, and there is no significant variation in the calculation results obtained by the two mesh numbers. Therefore, to optimize the available computing resources, a model with a grid number of 21,842,799 is used for subsequent calculations.

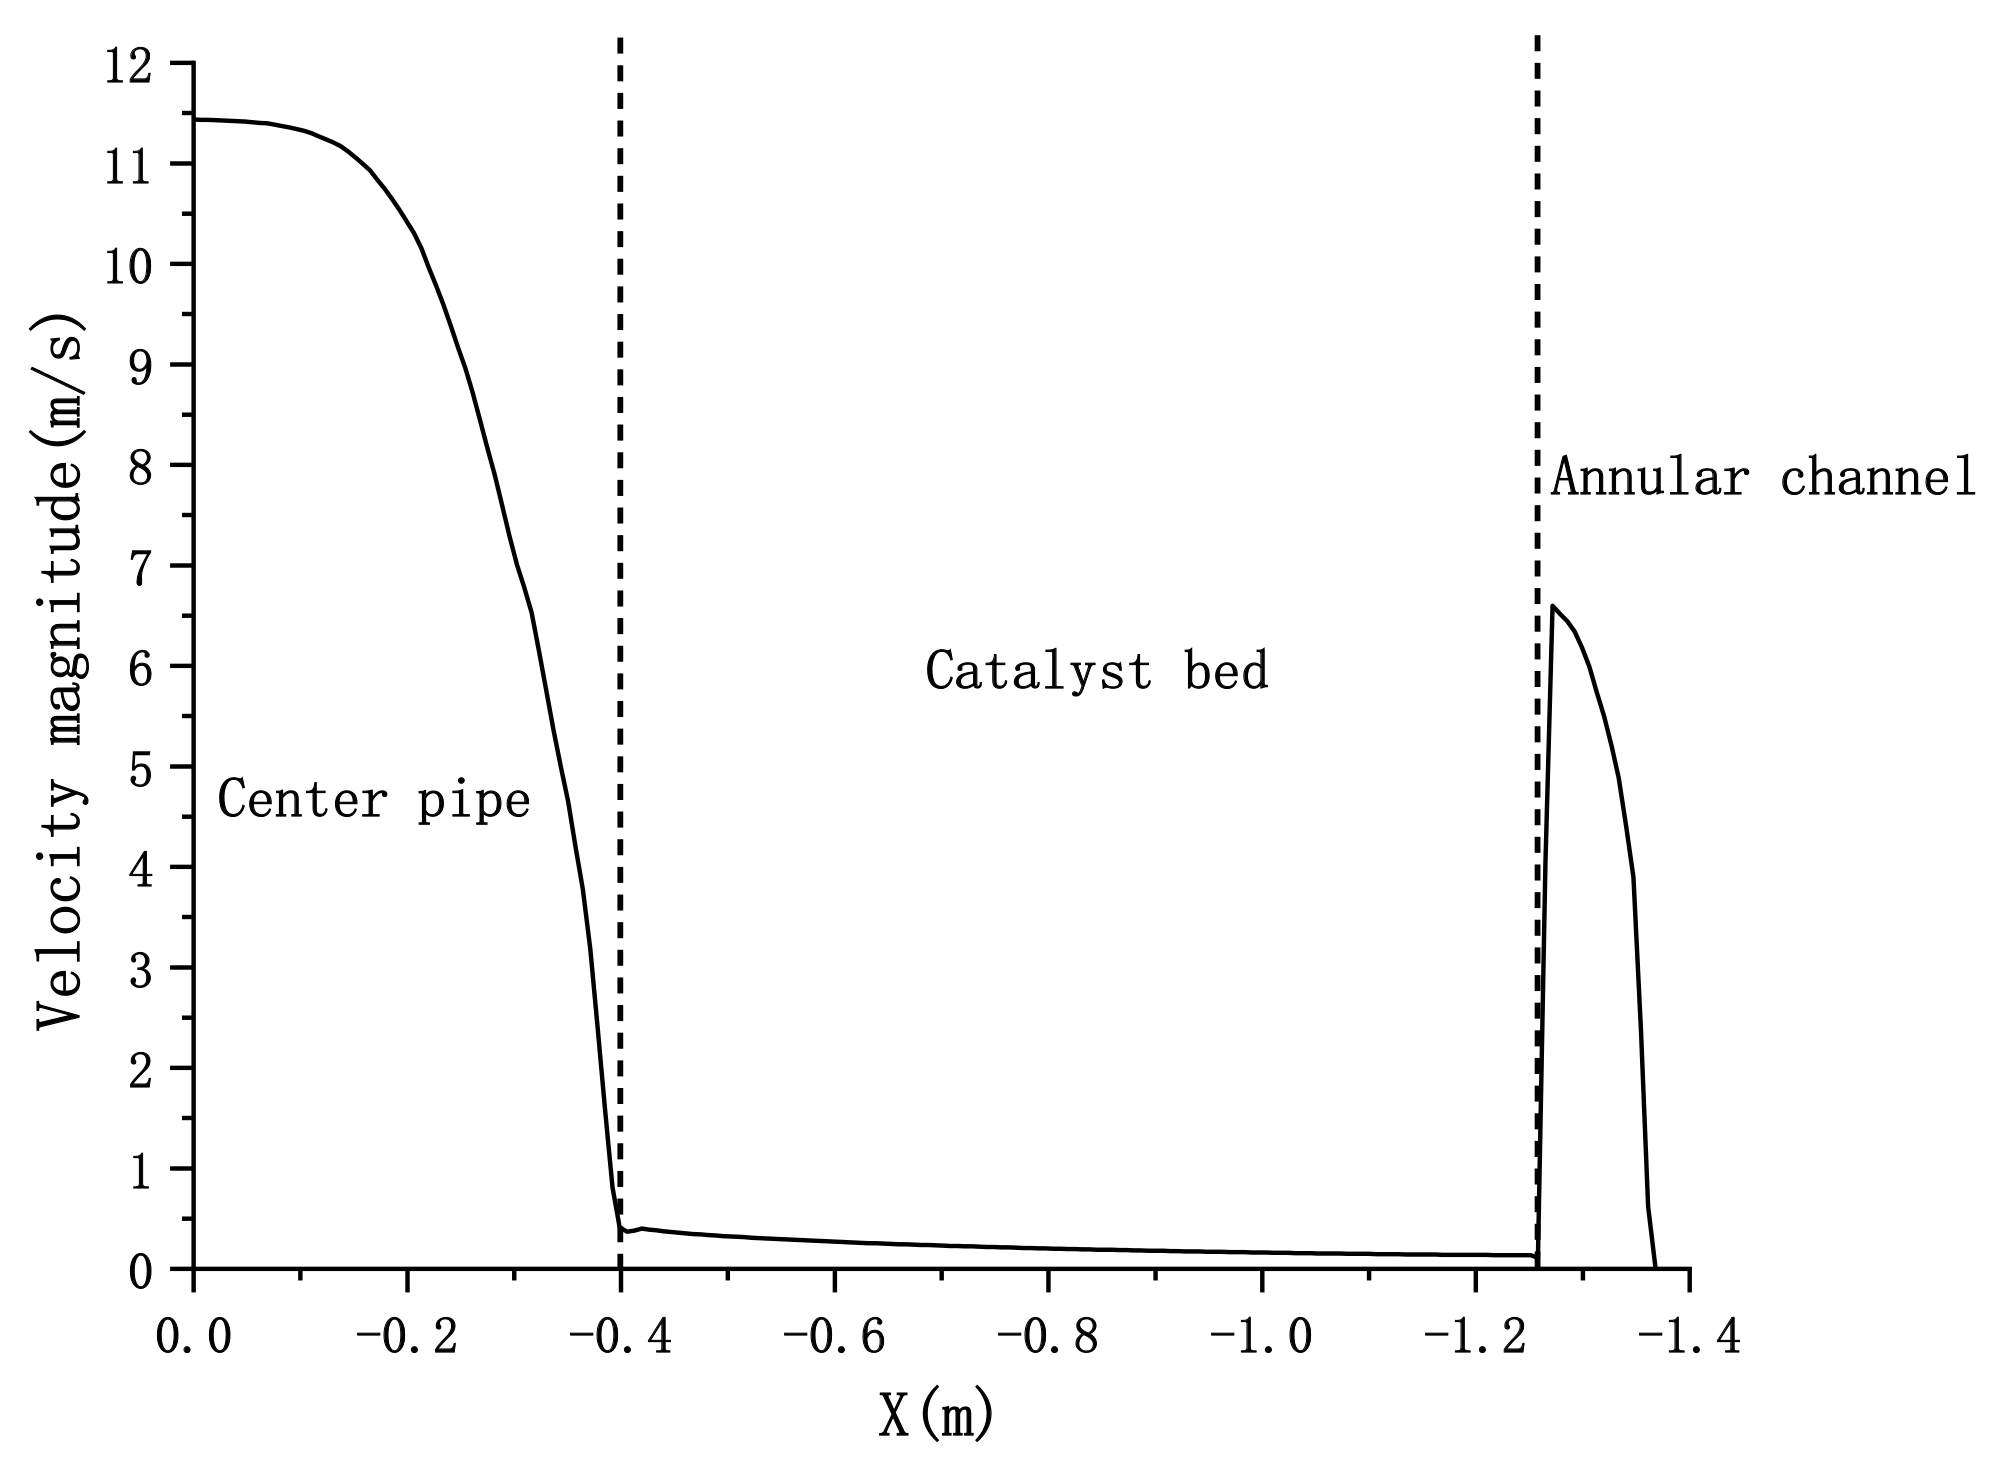
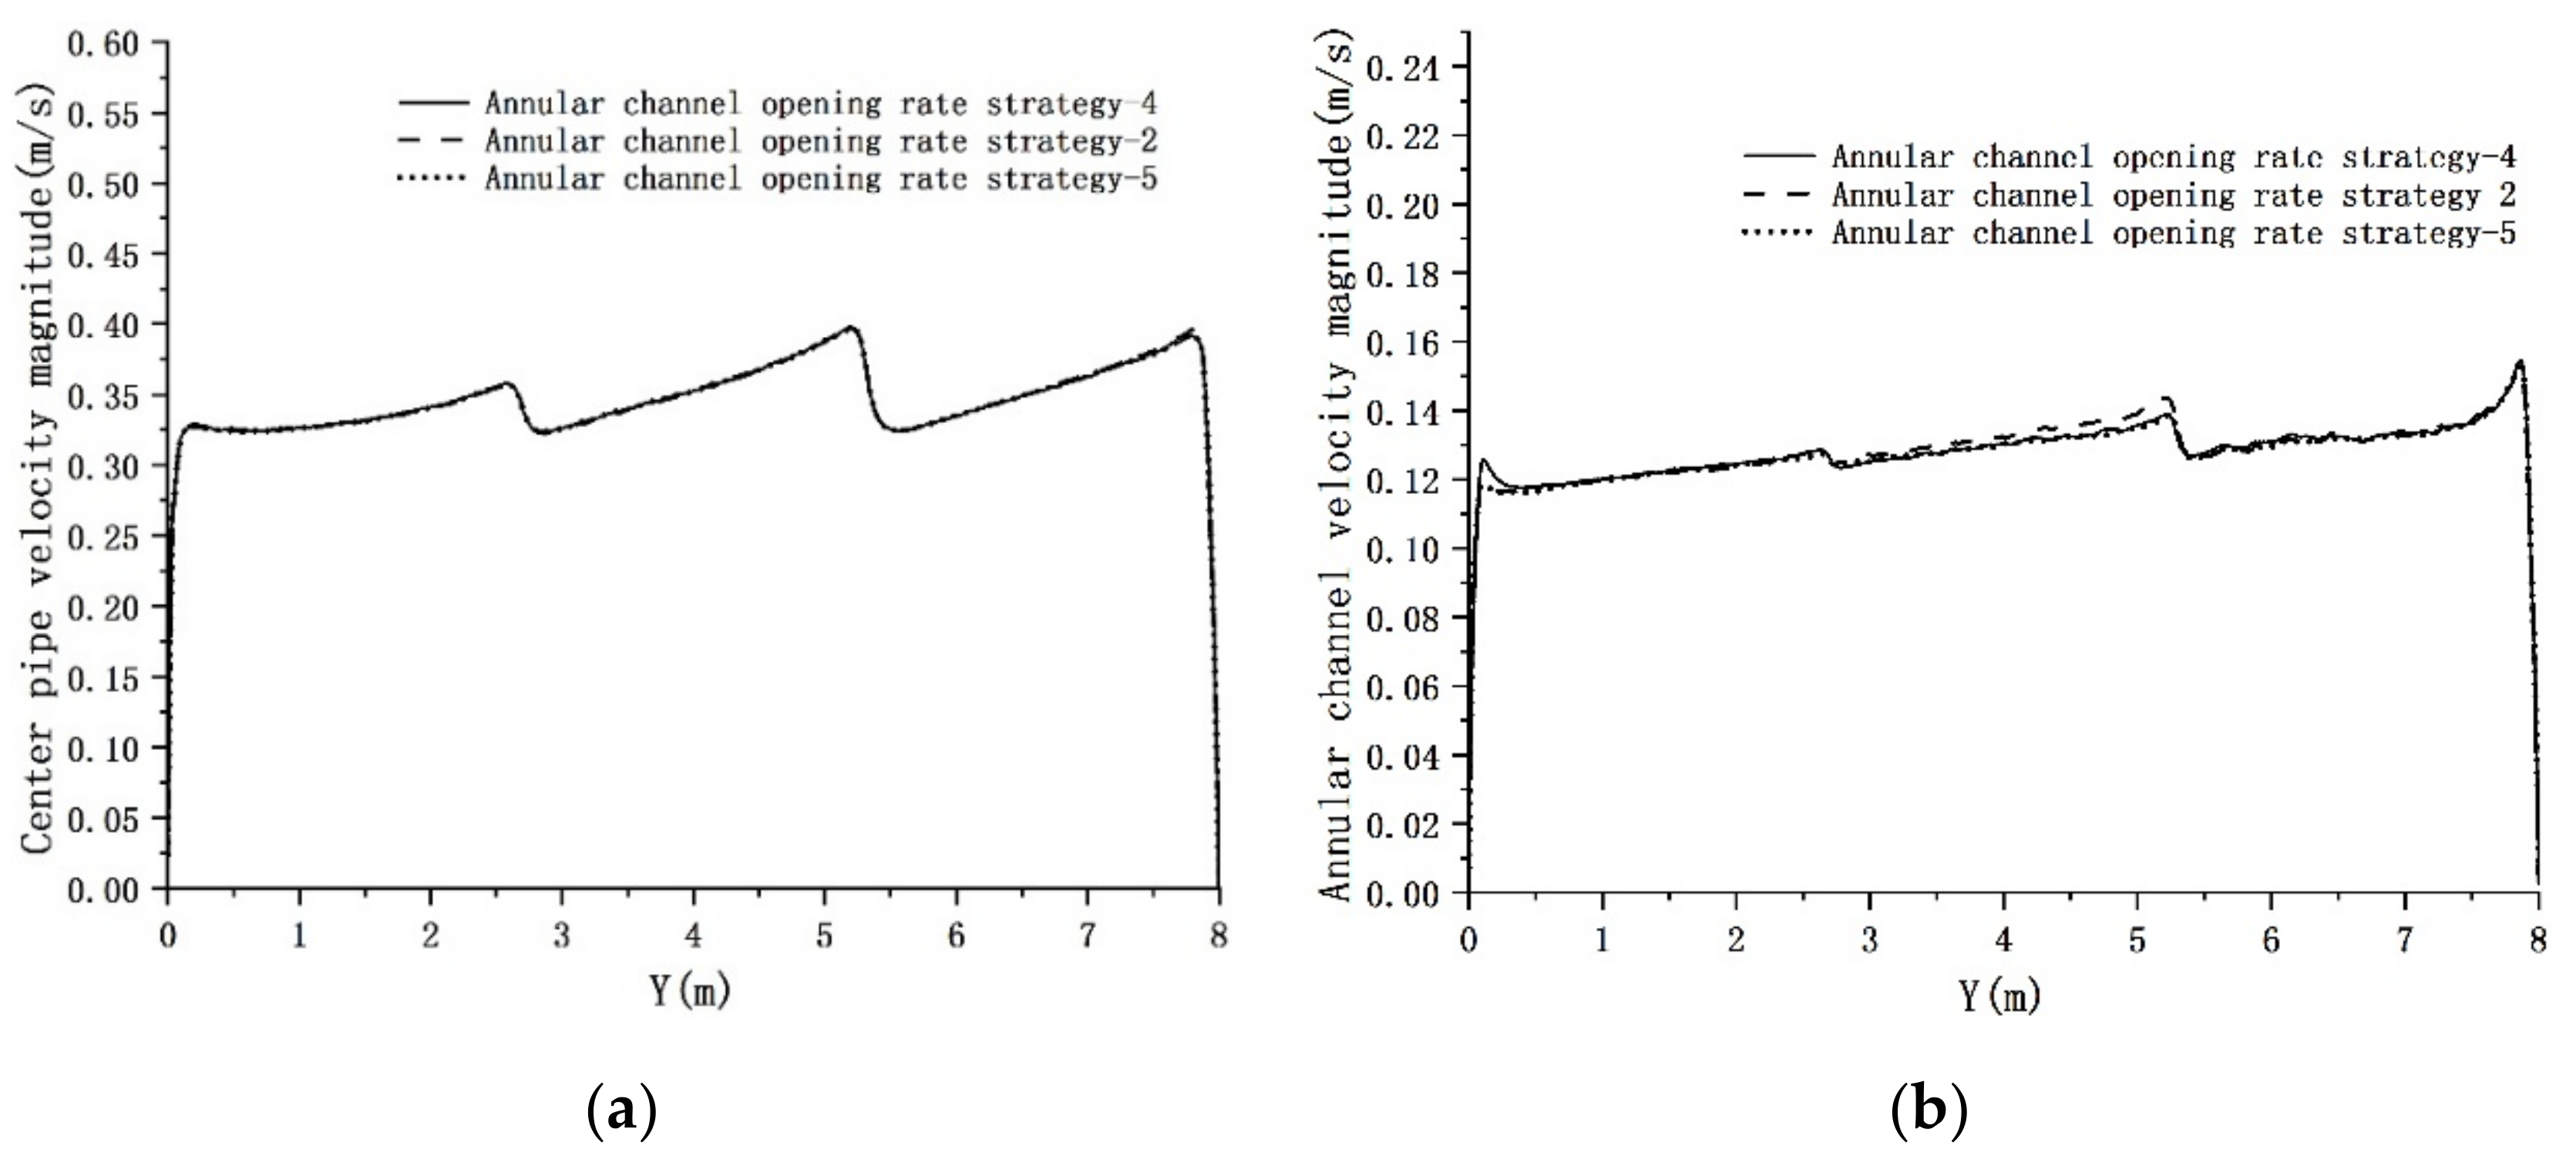
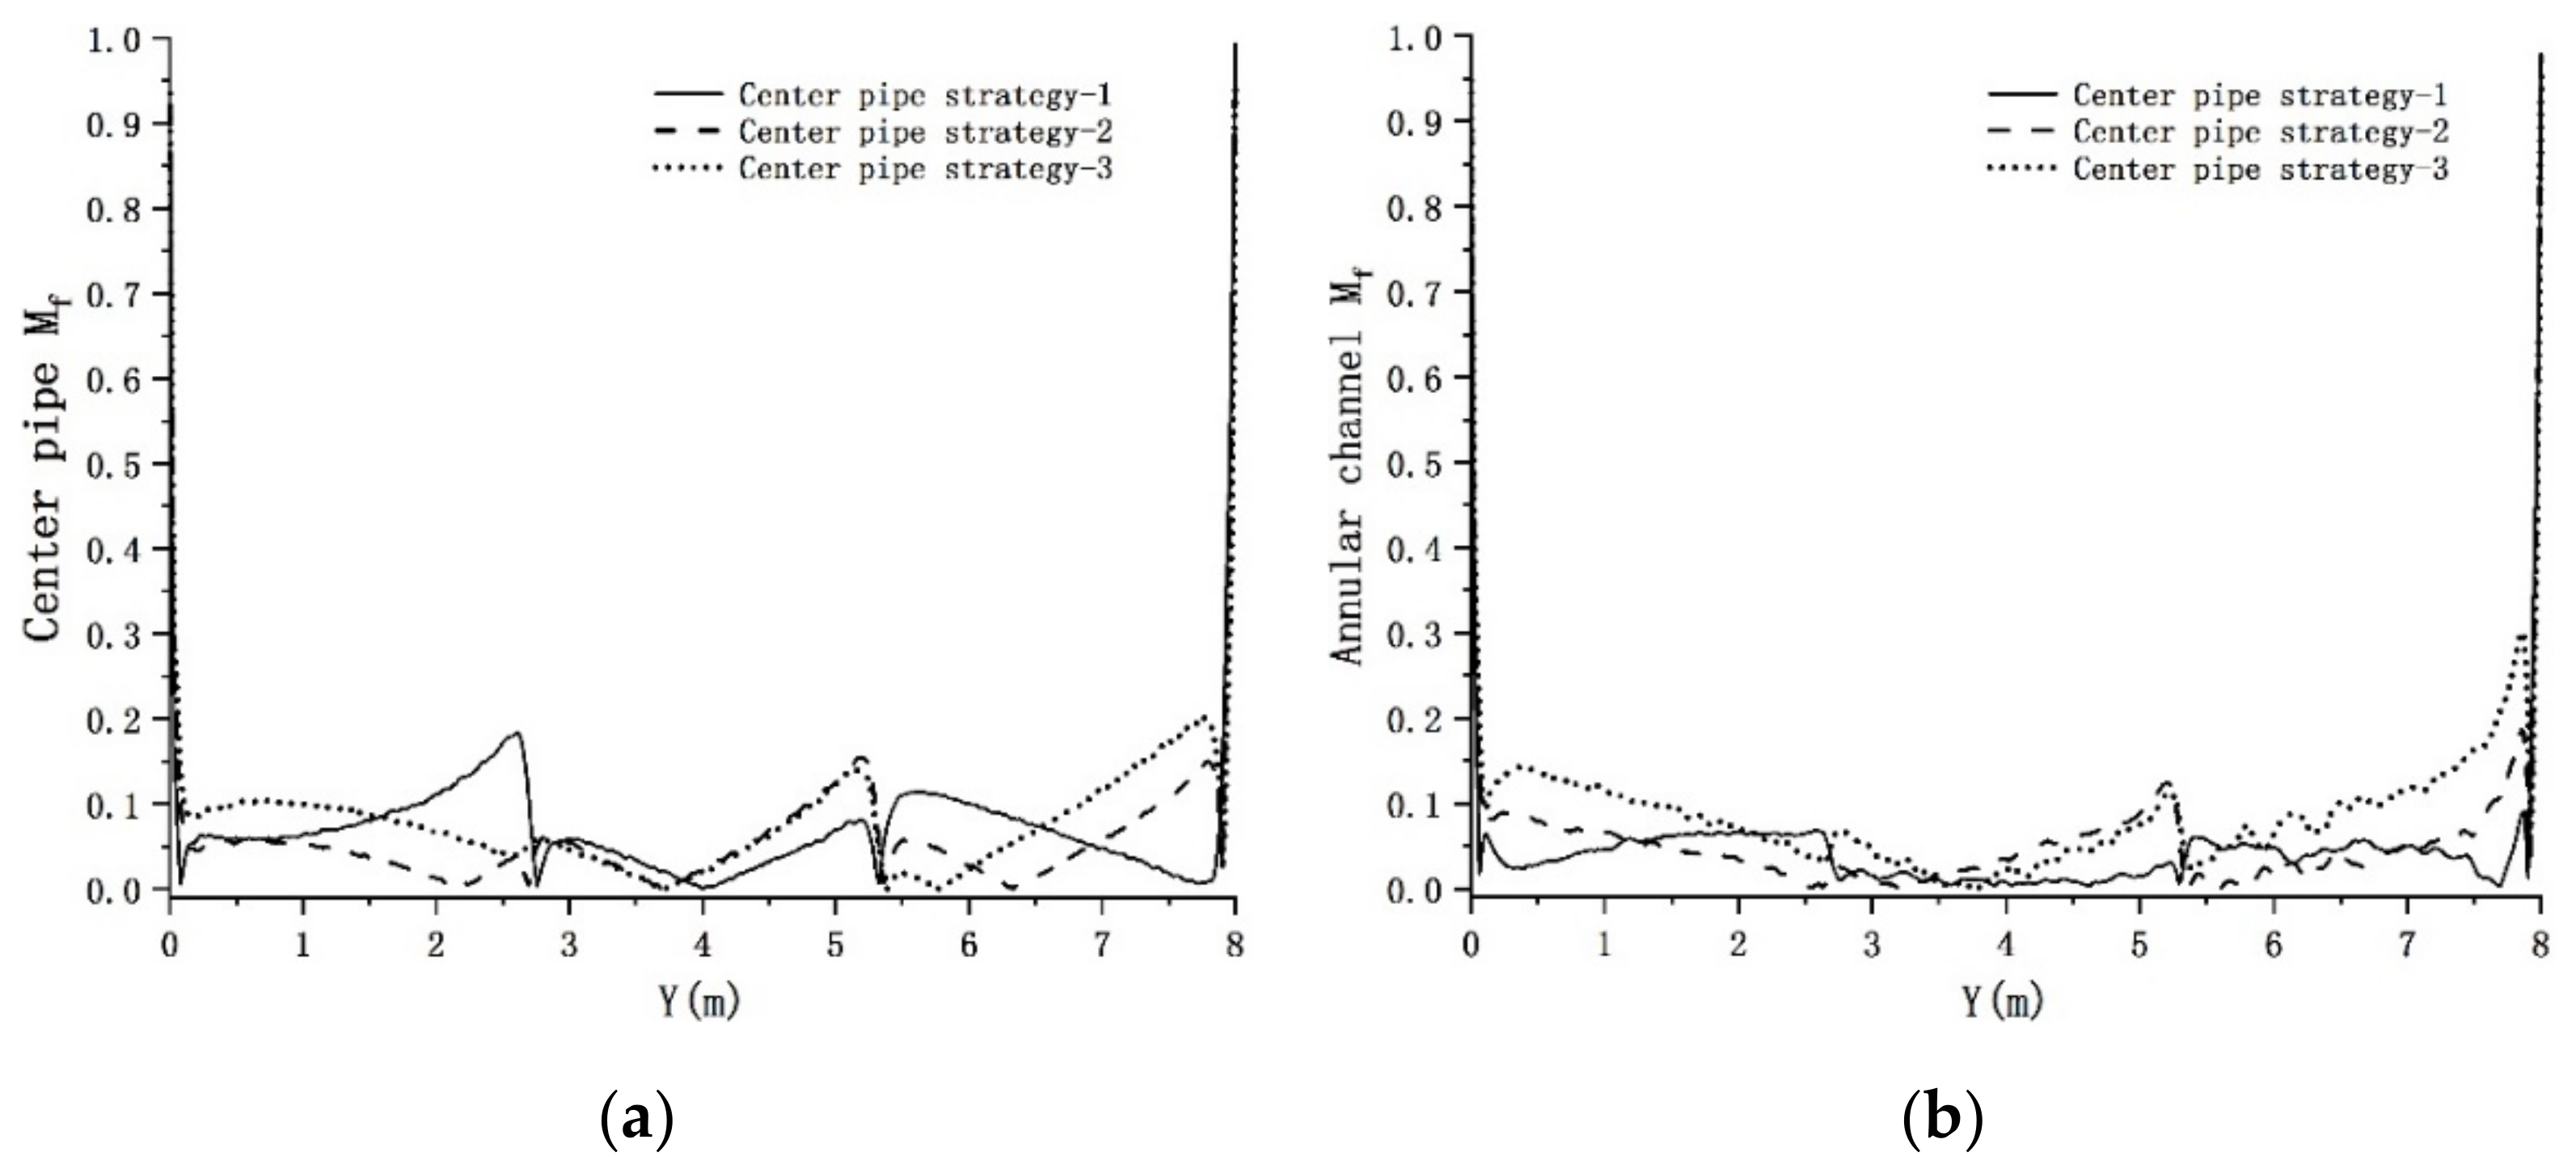
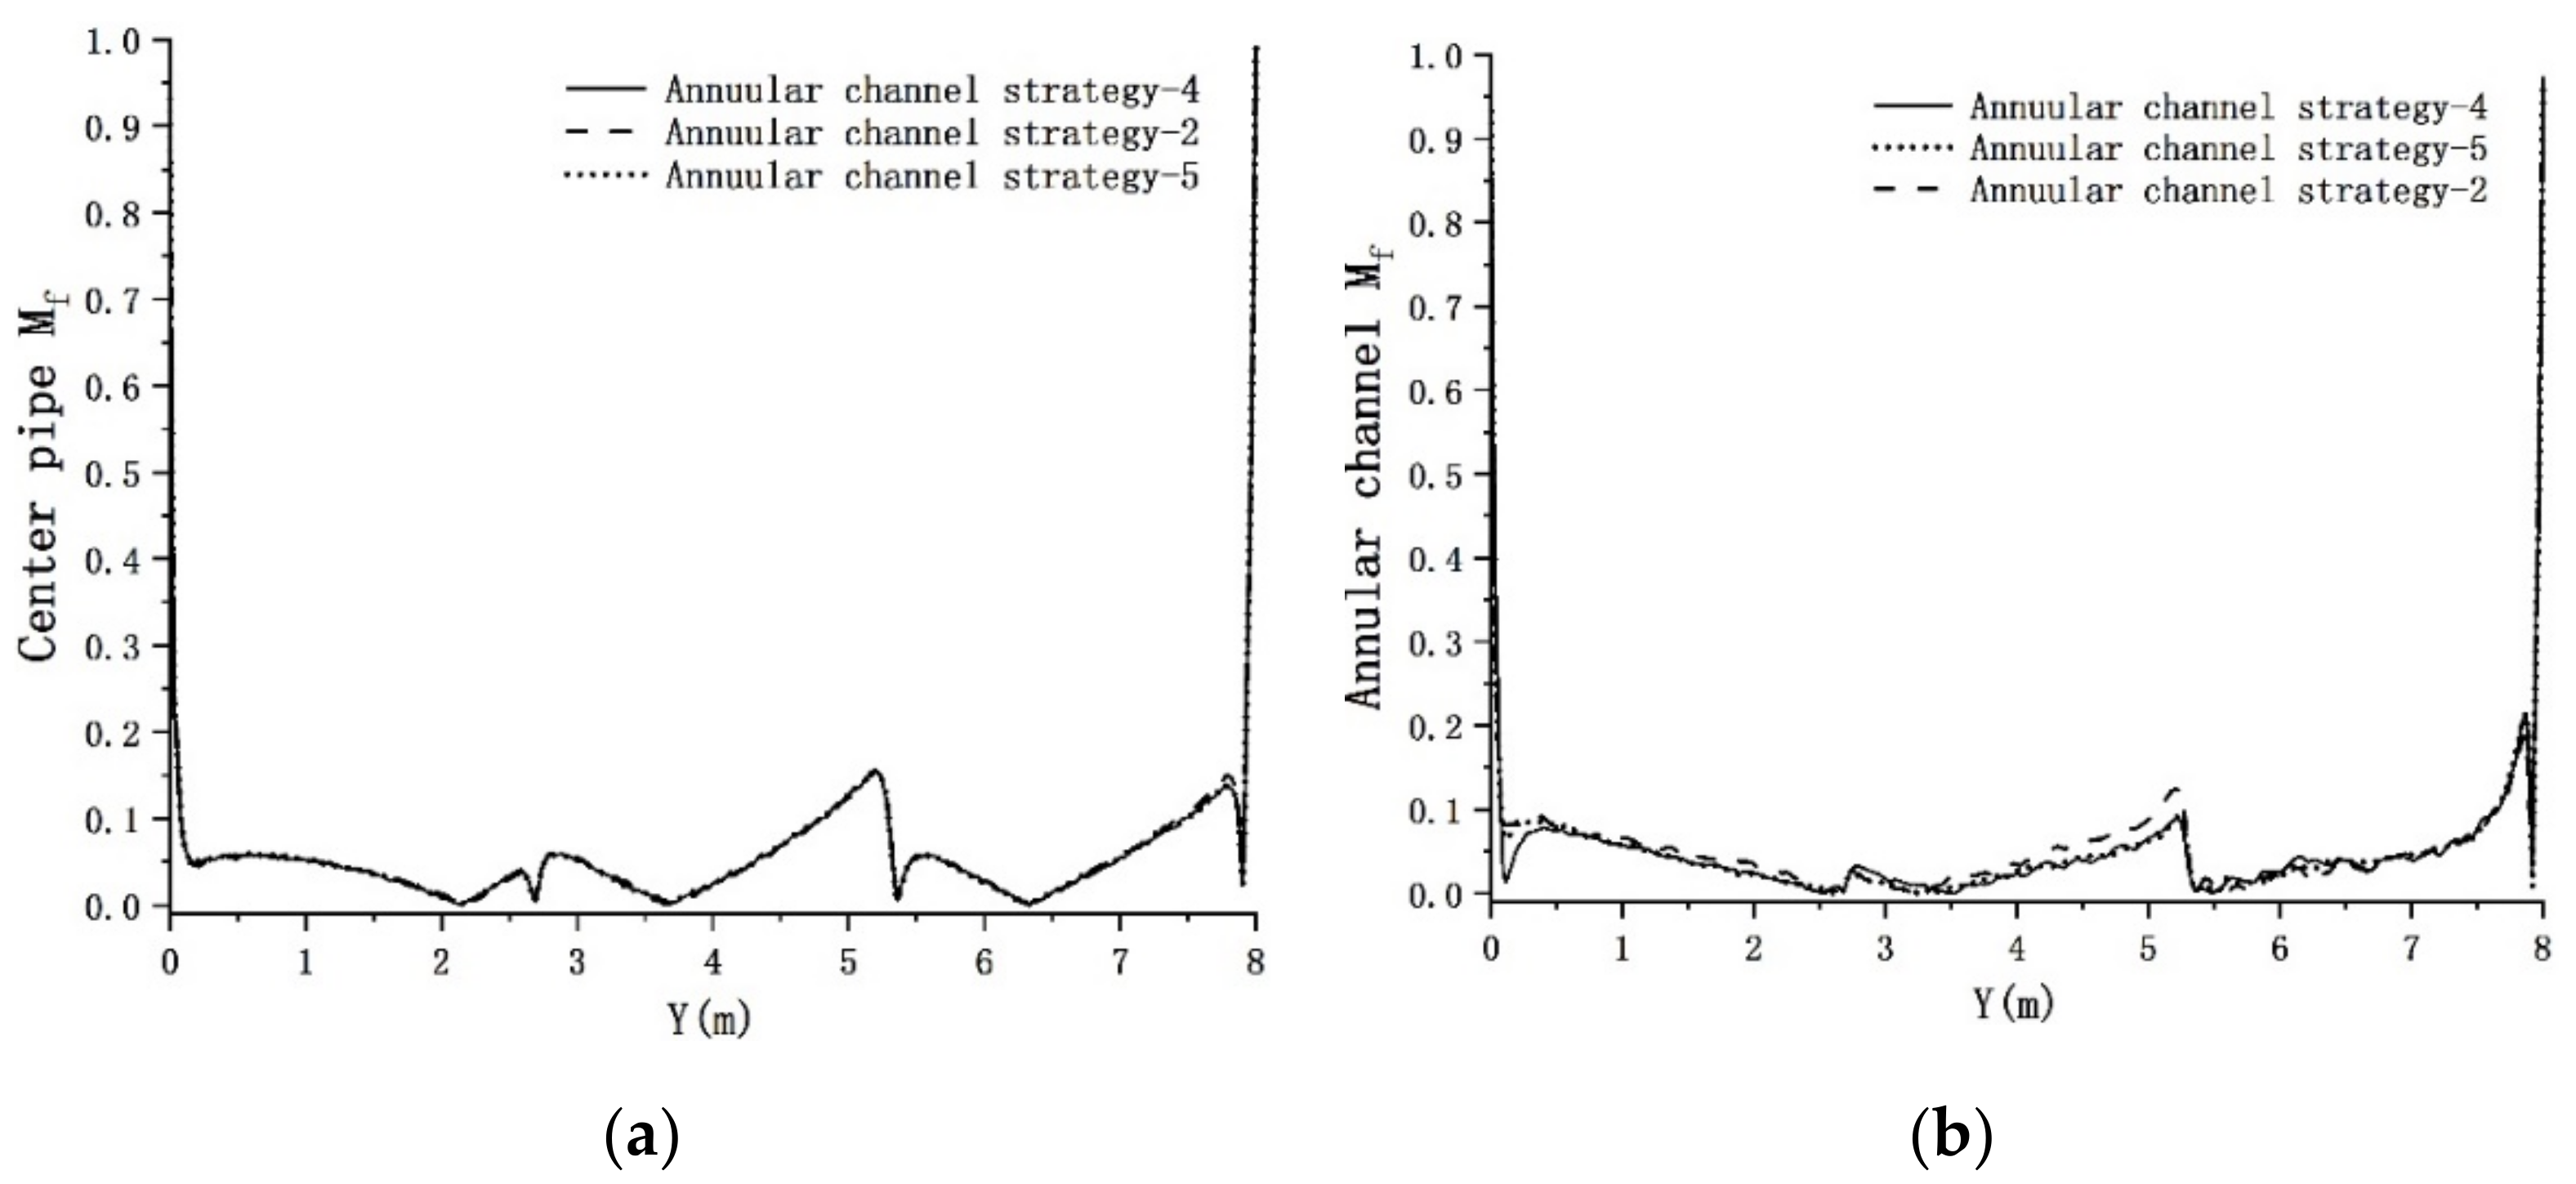
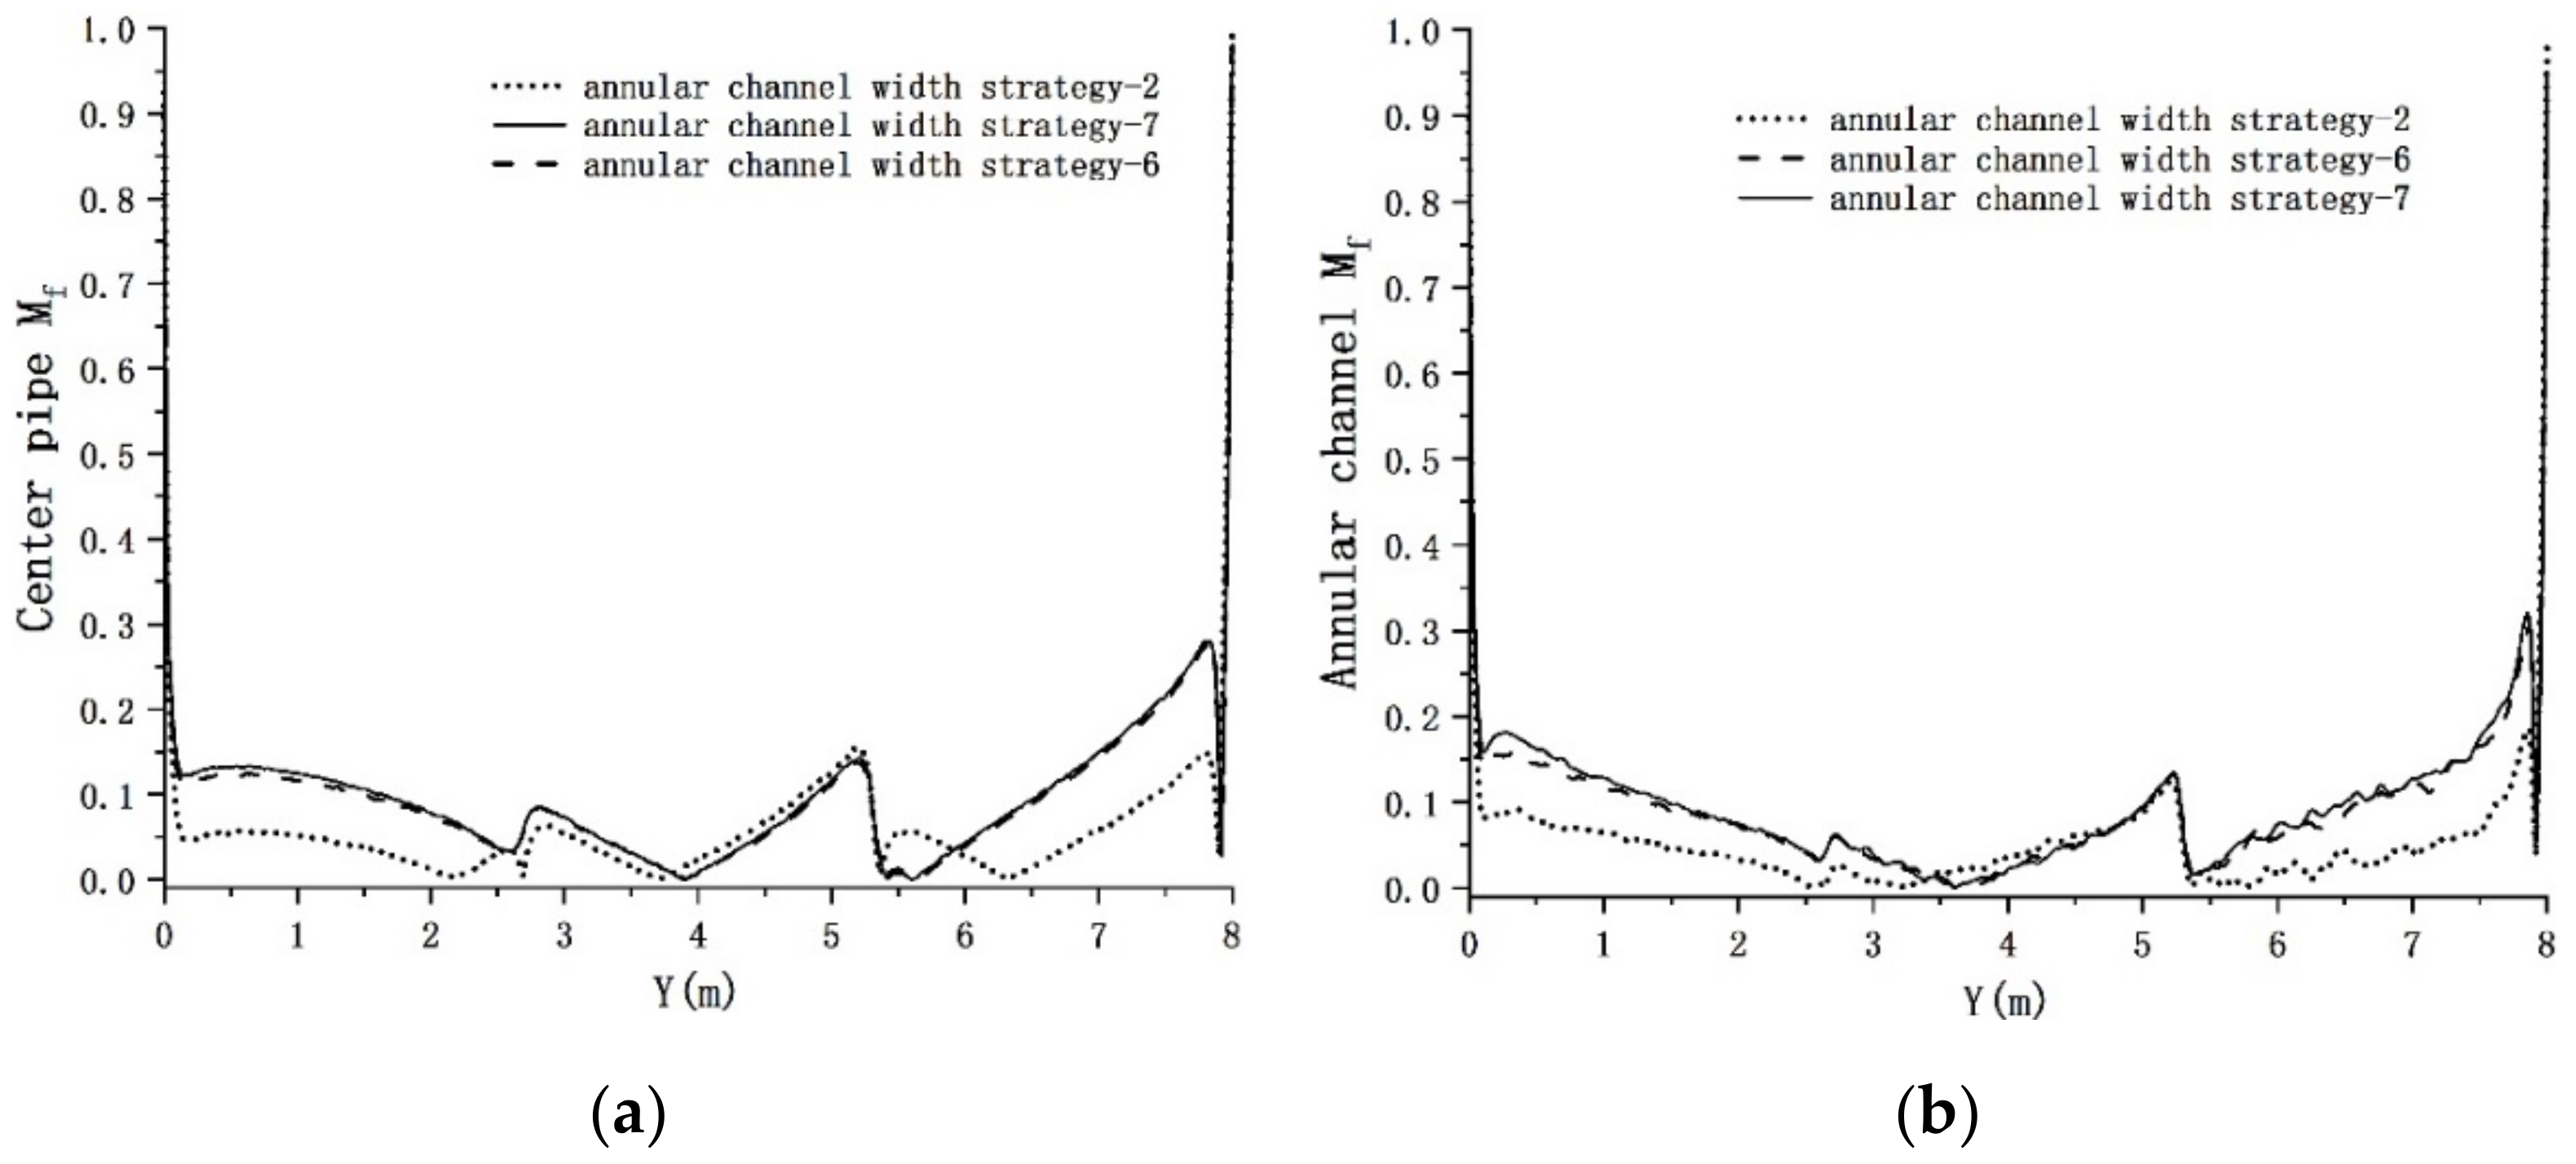
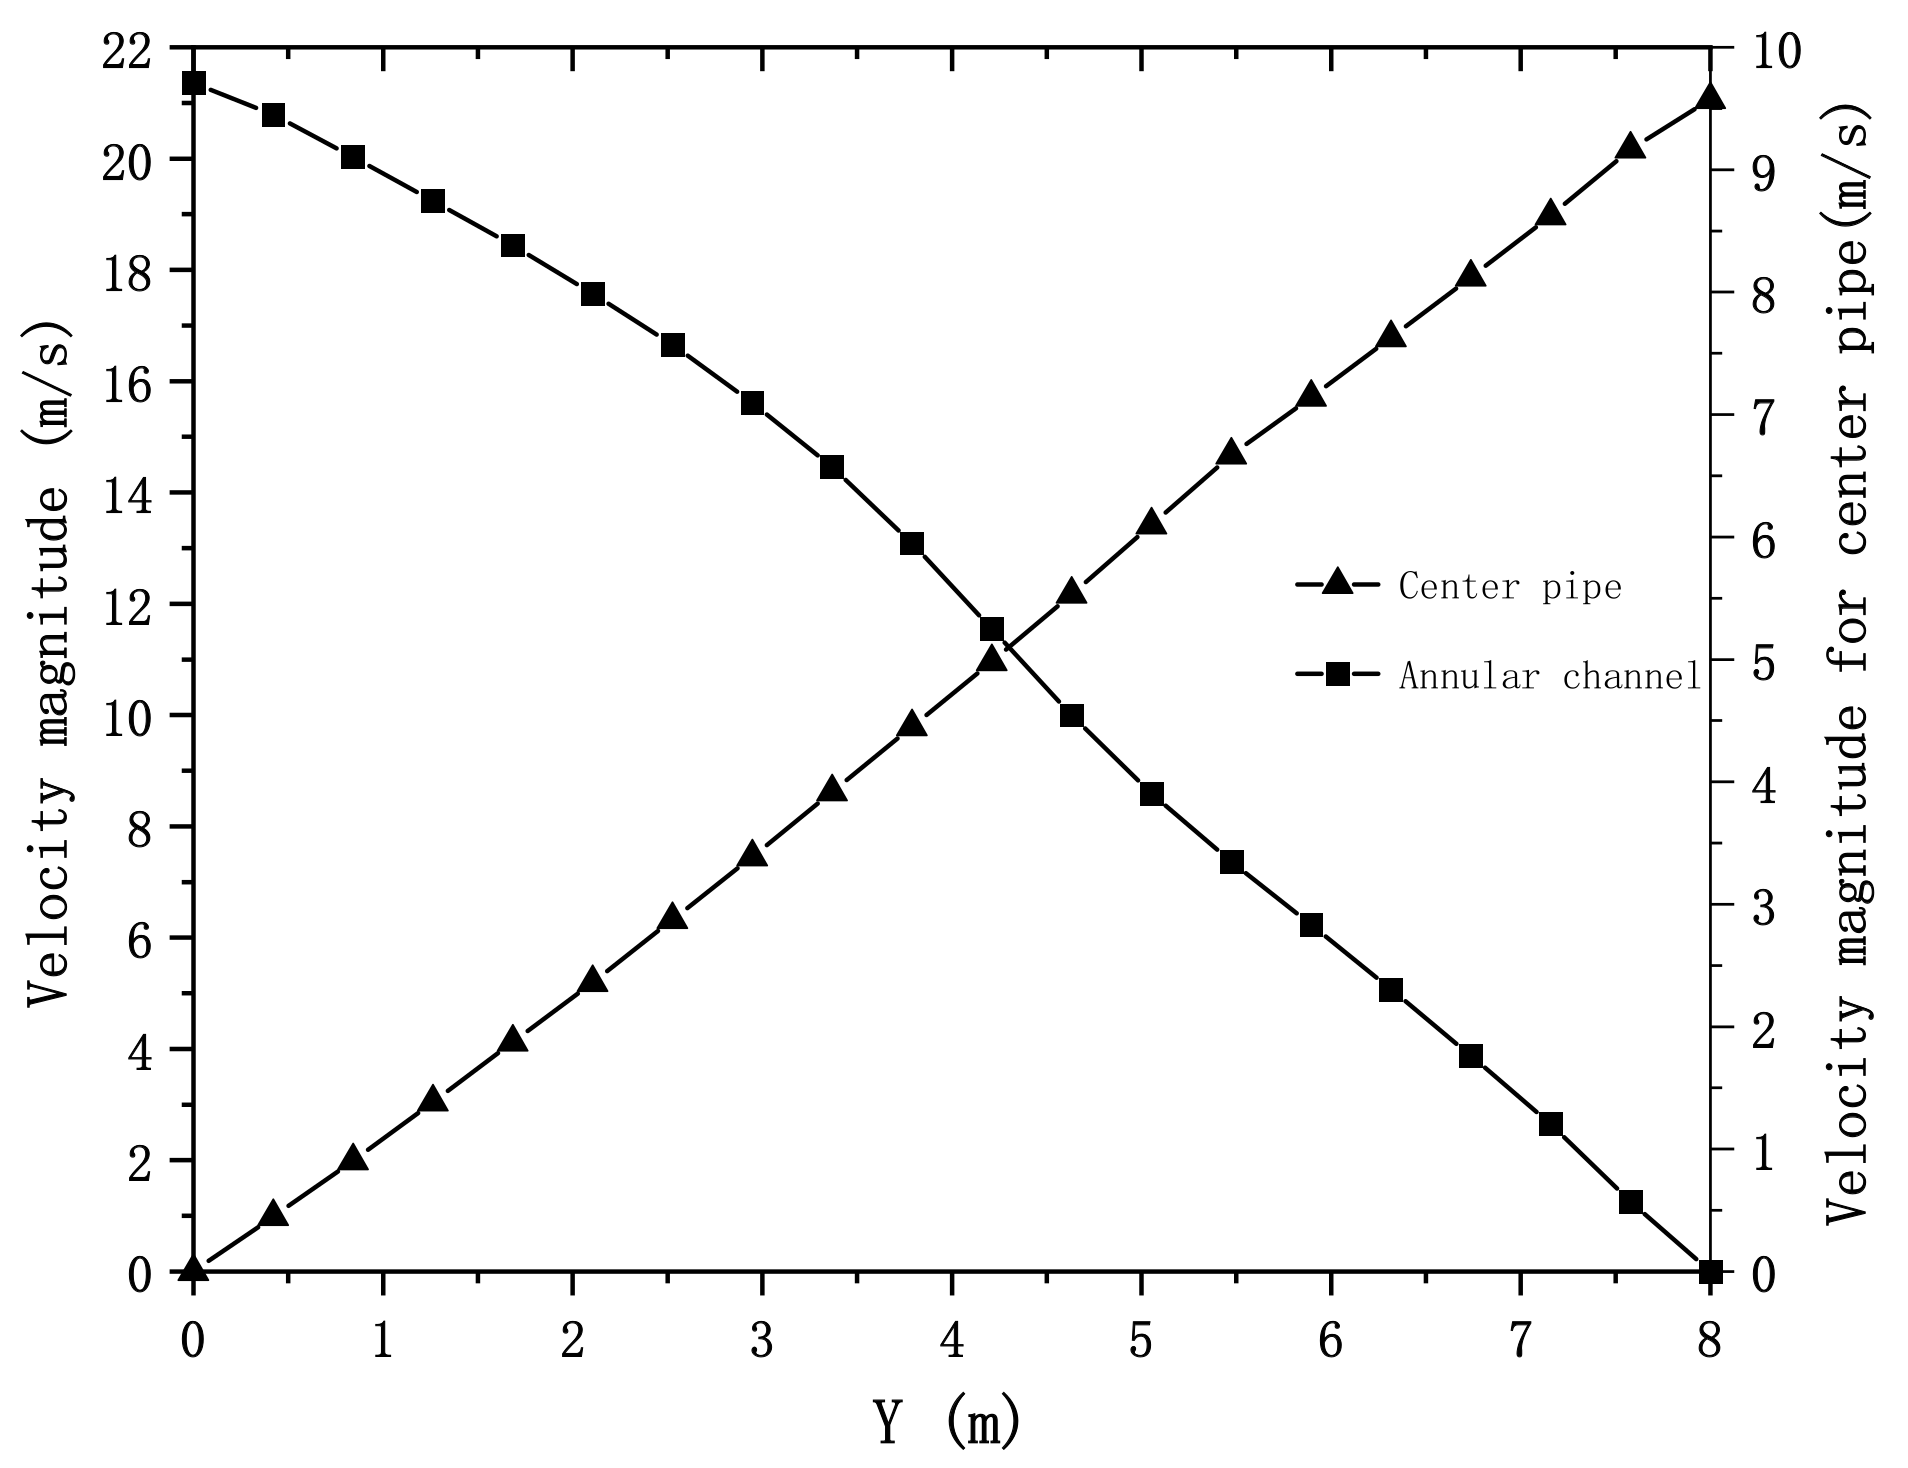
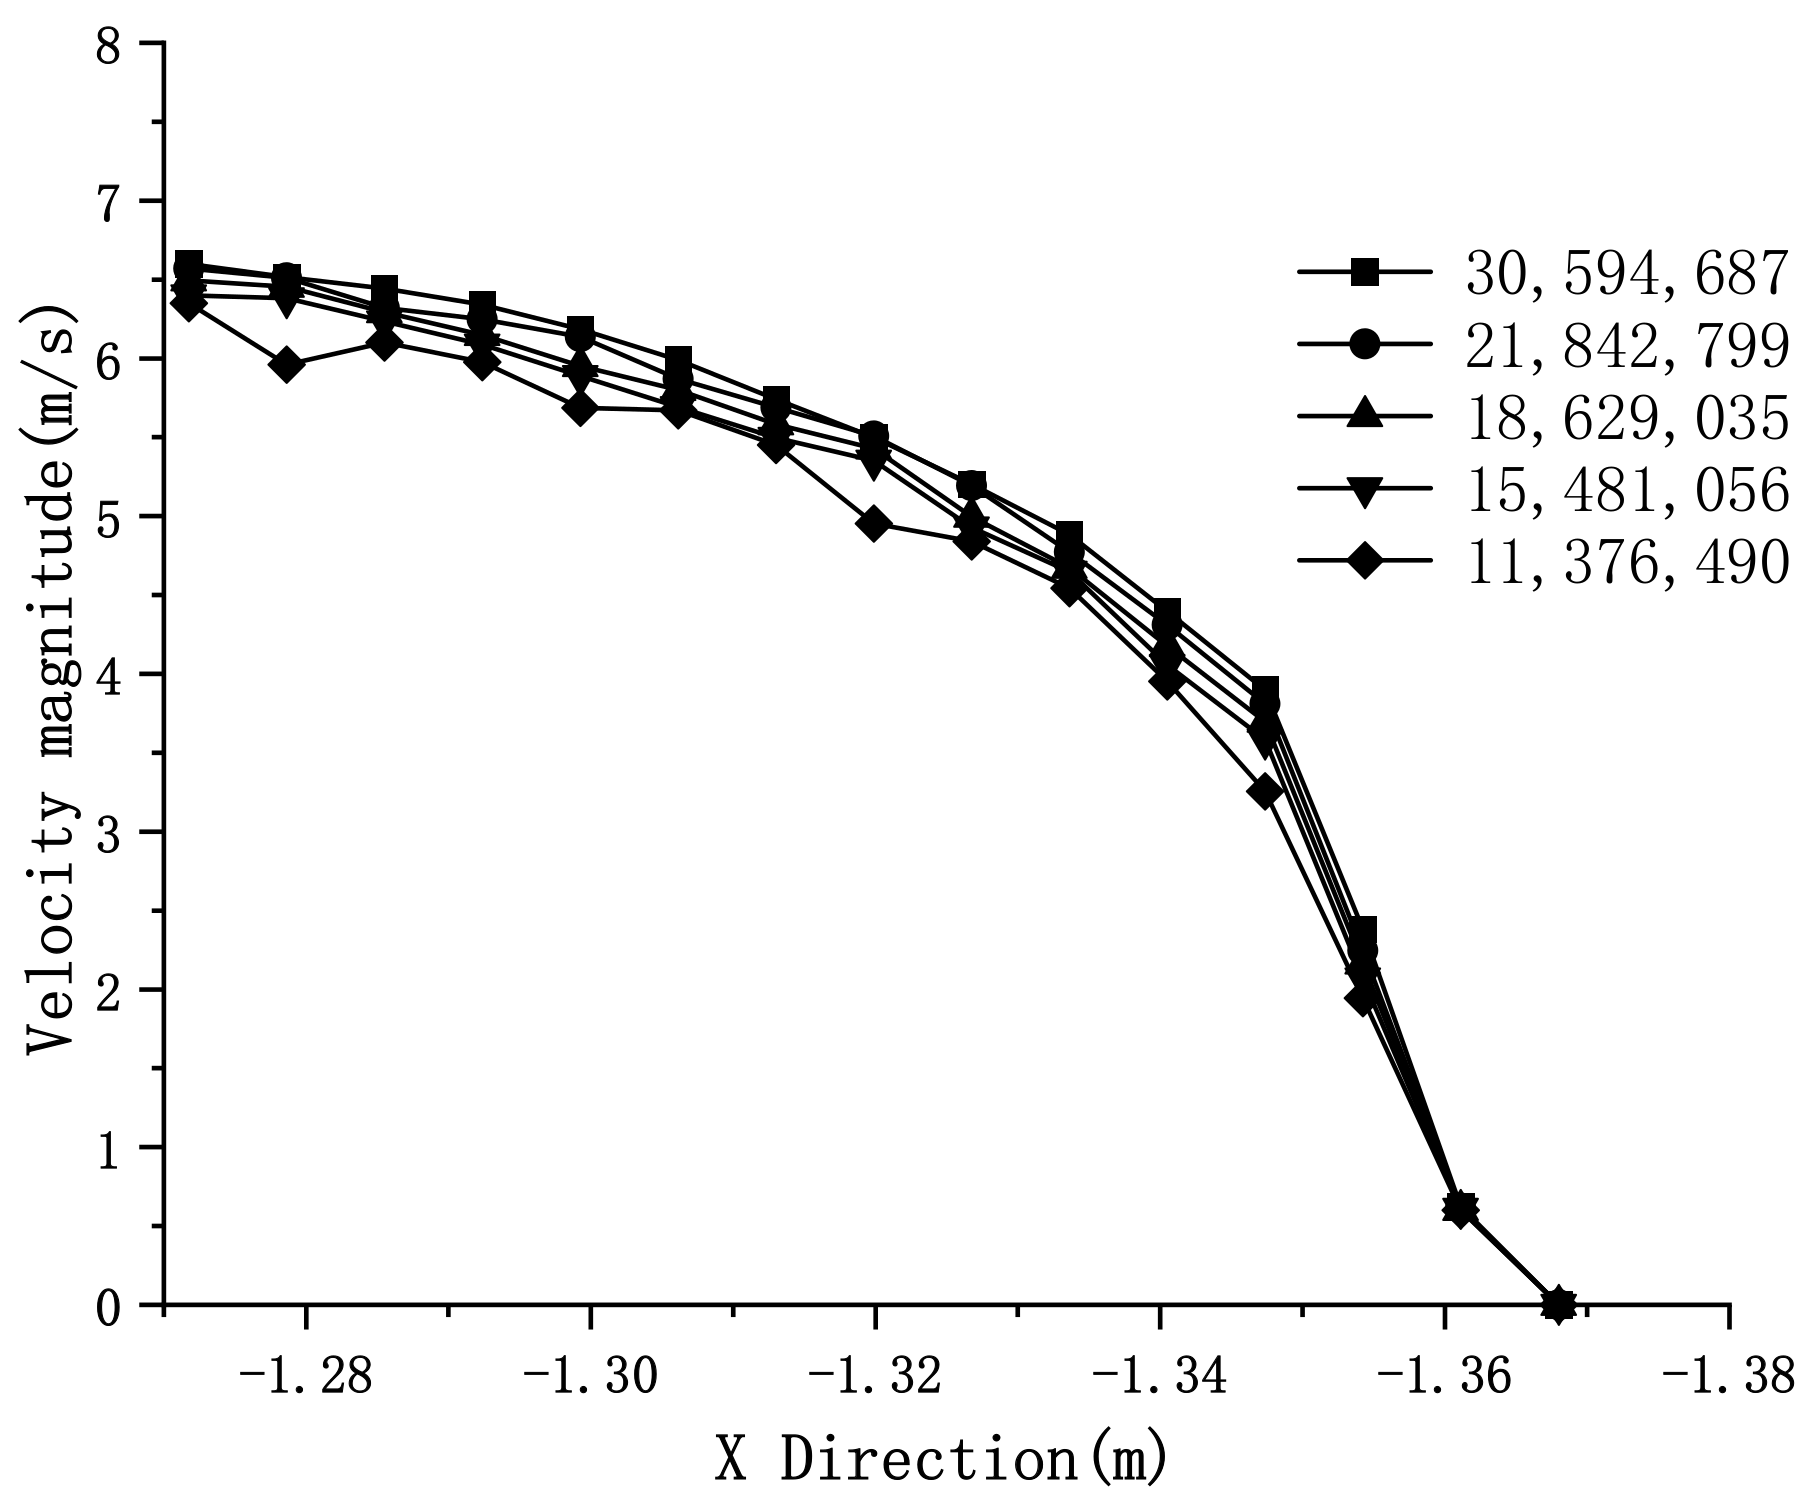
3.2. Radial Velocity Magnitude Result

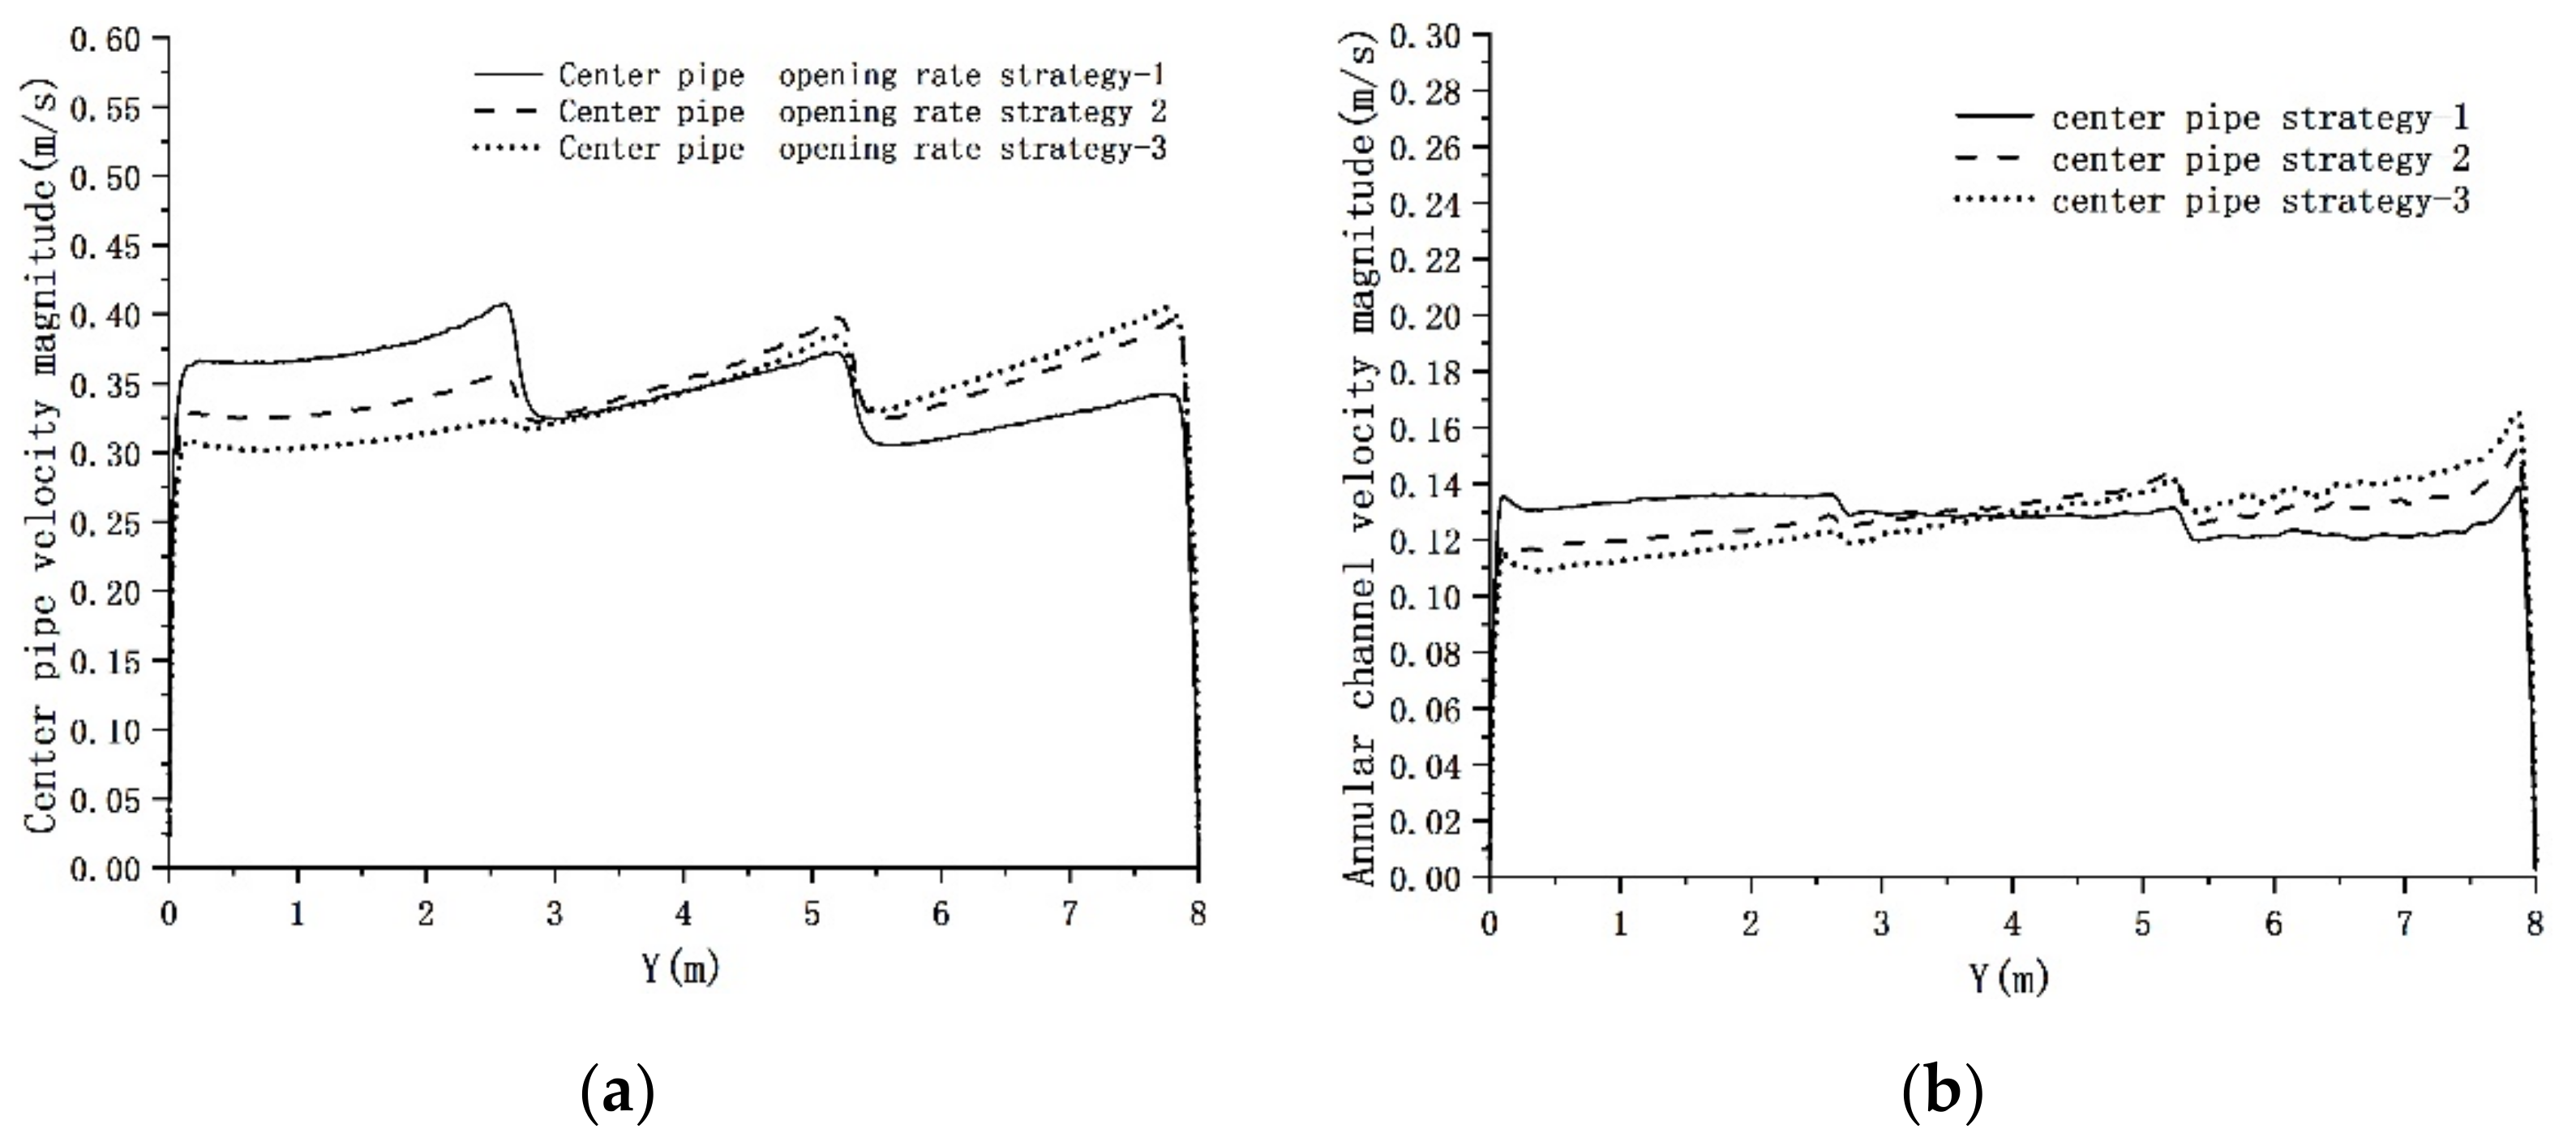
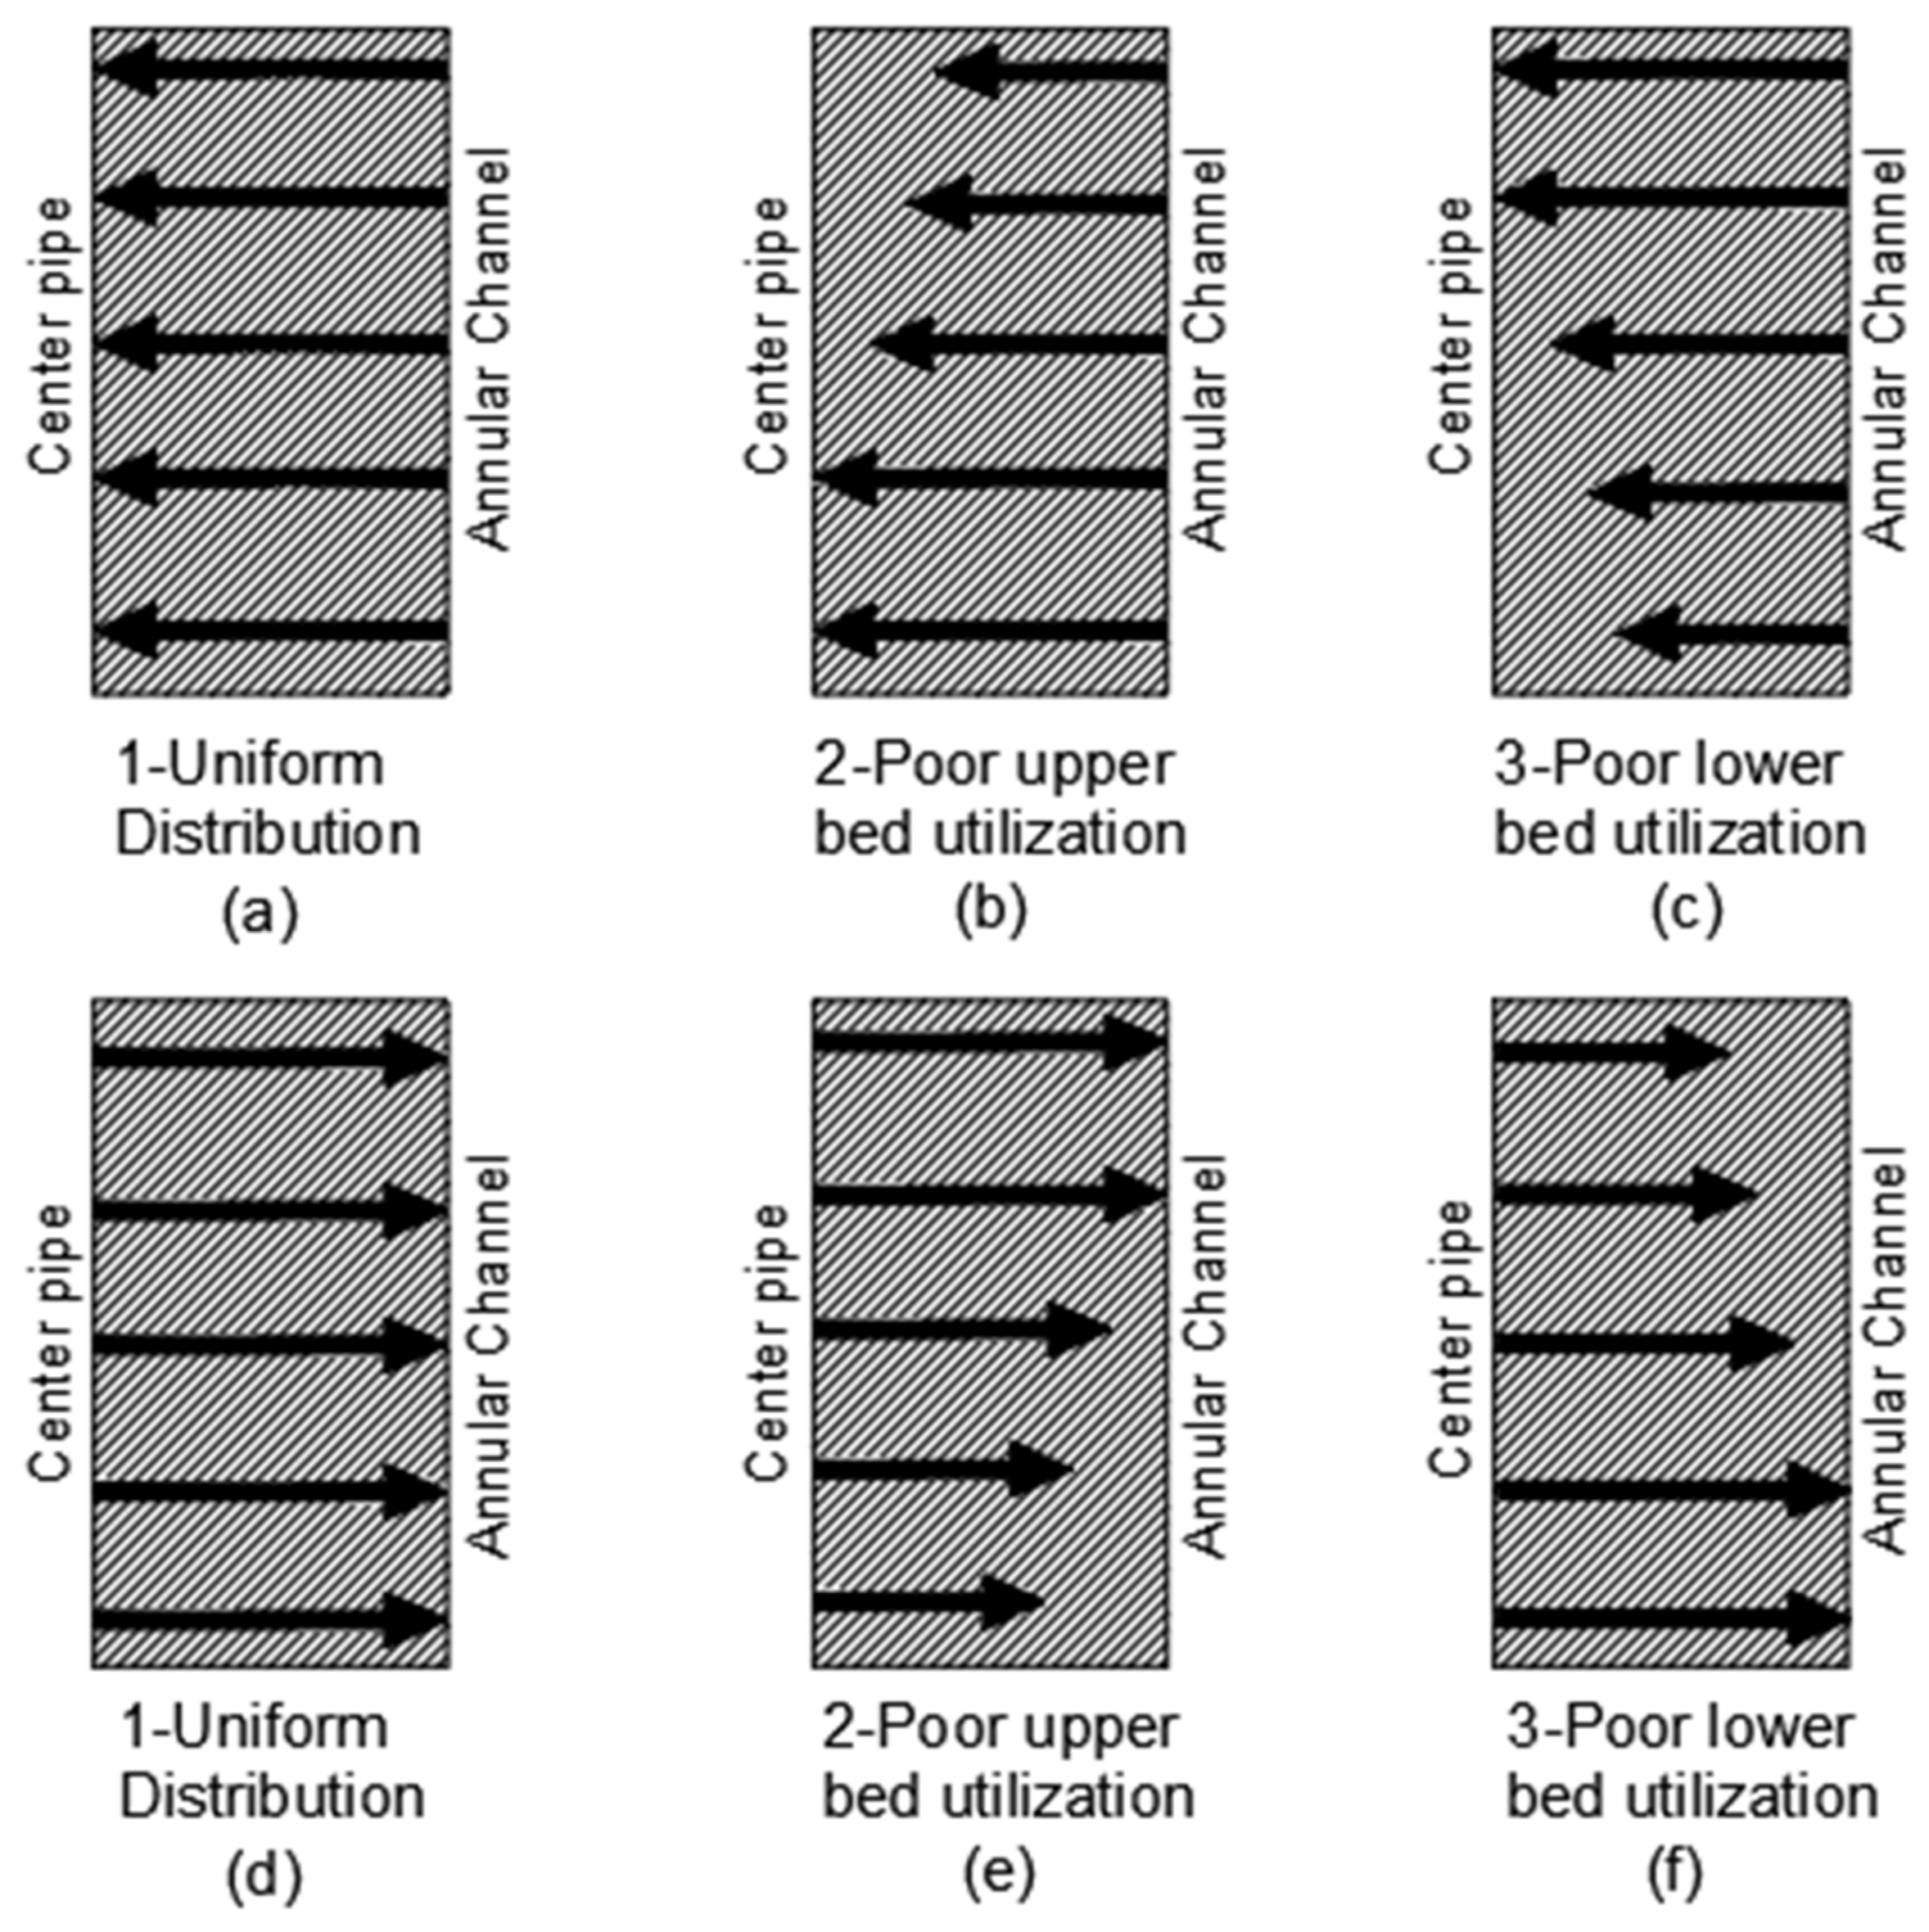
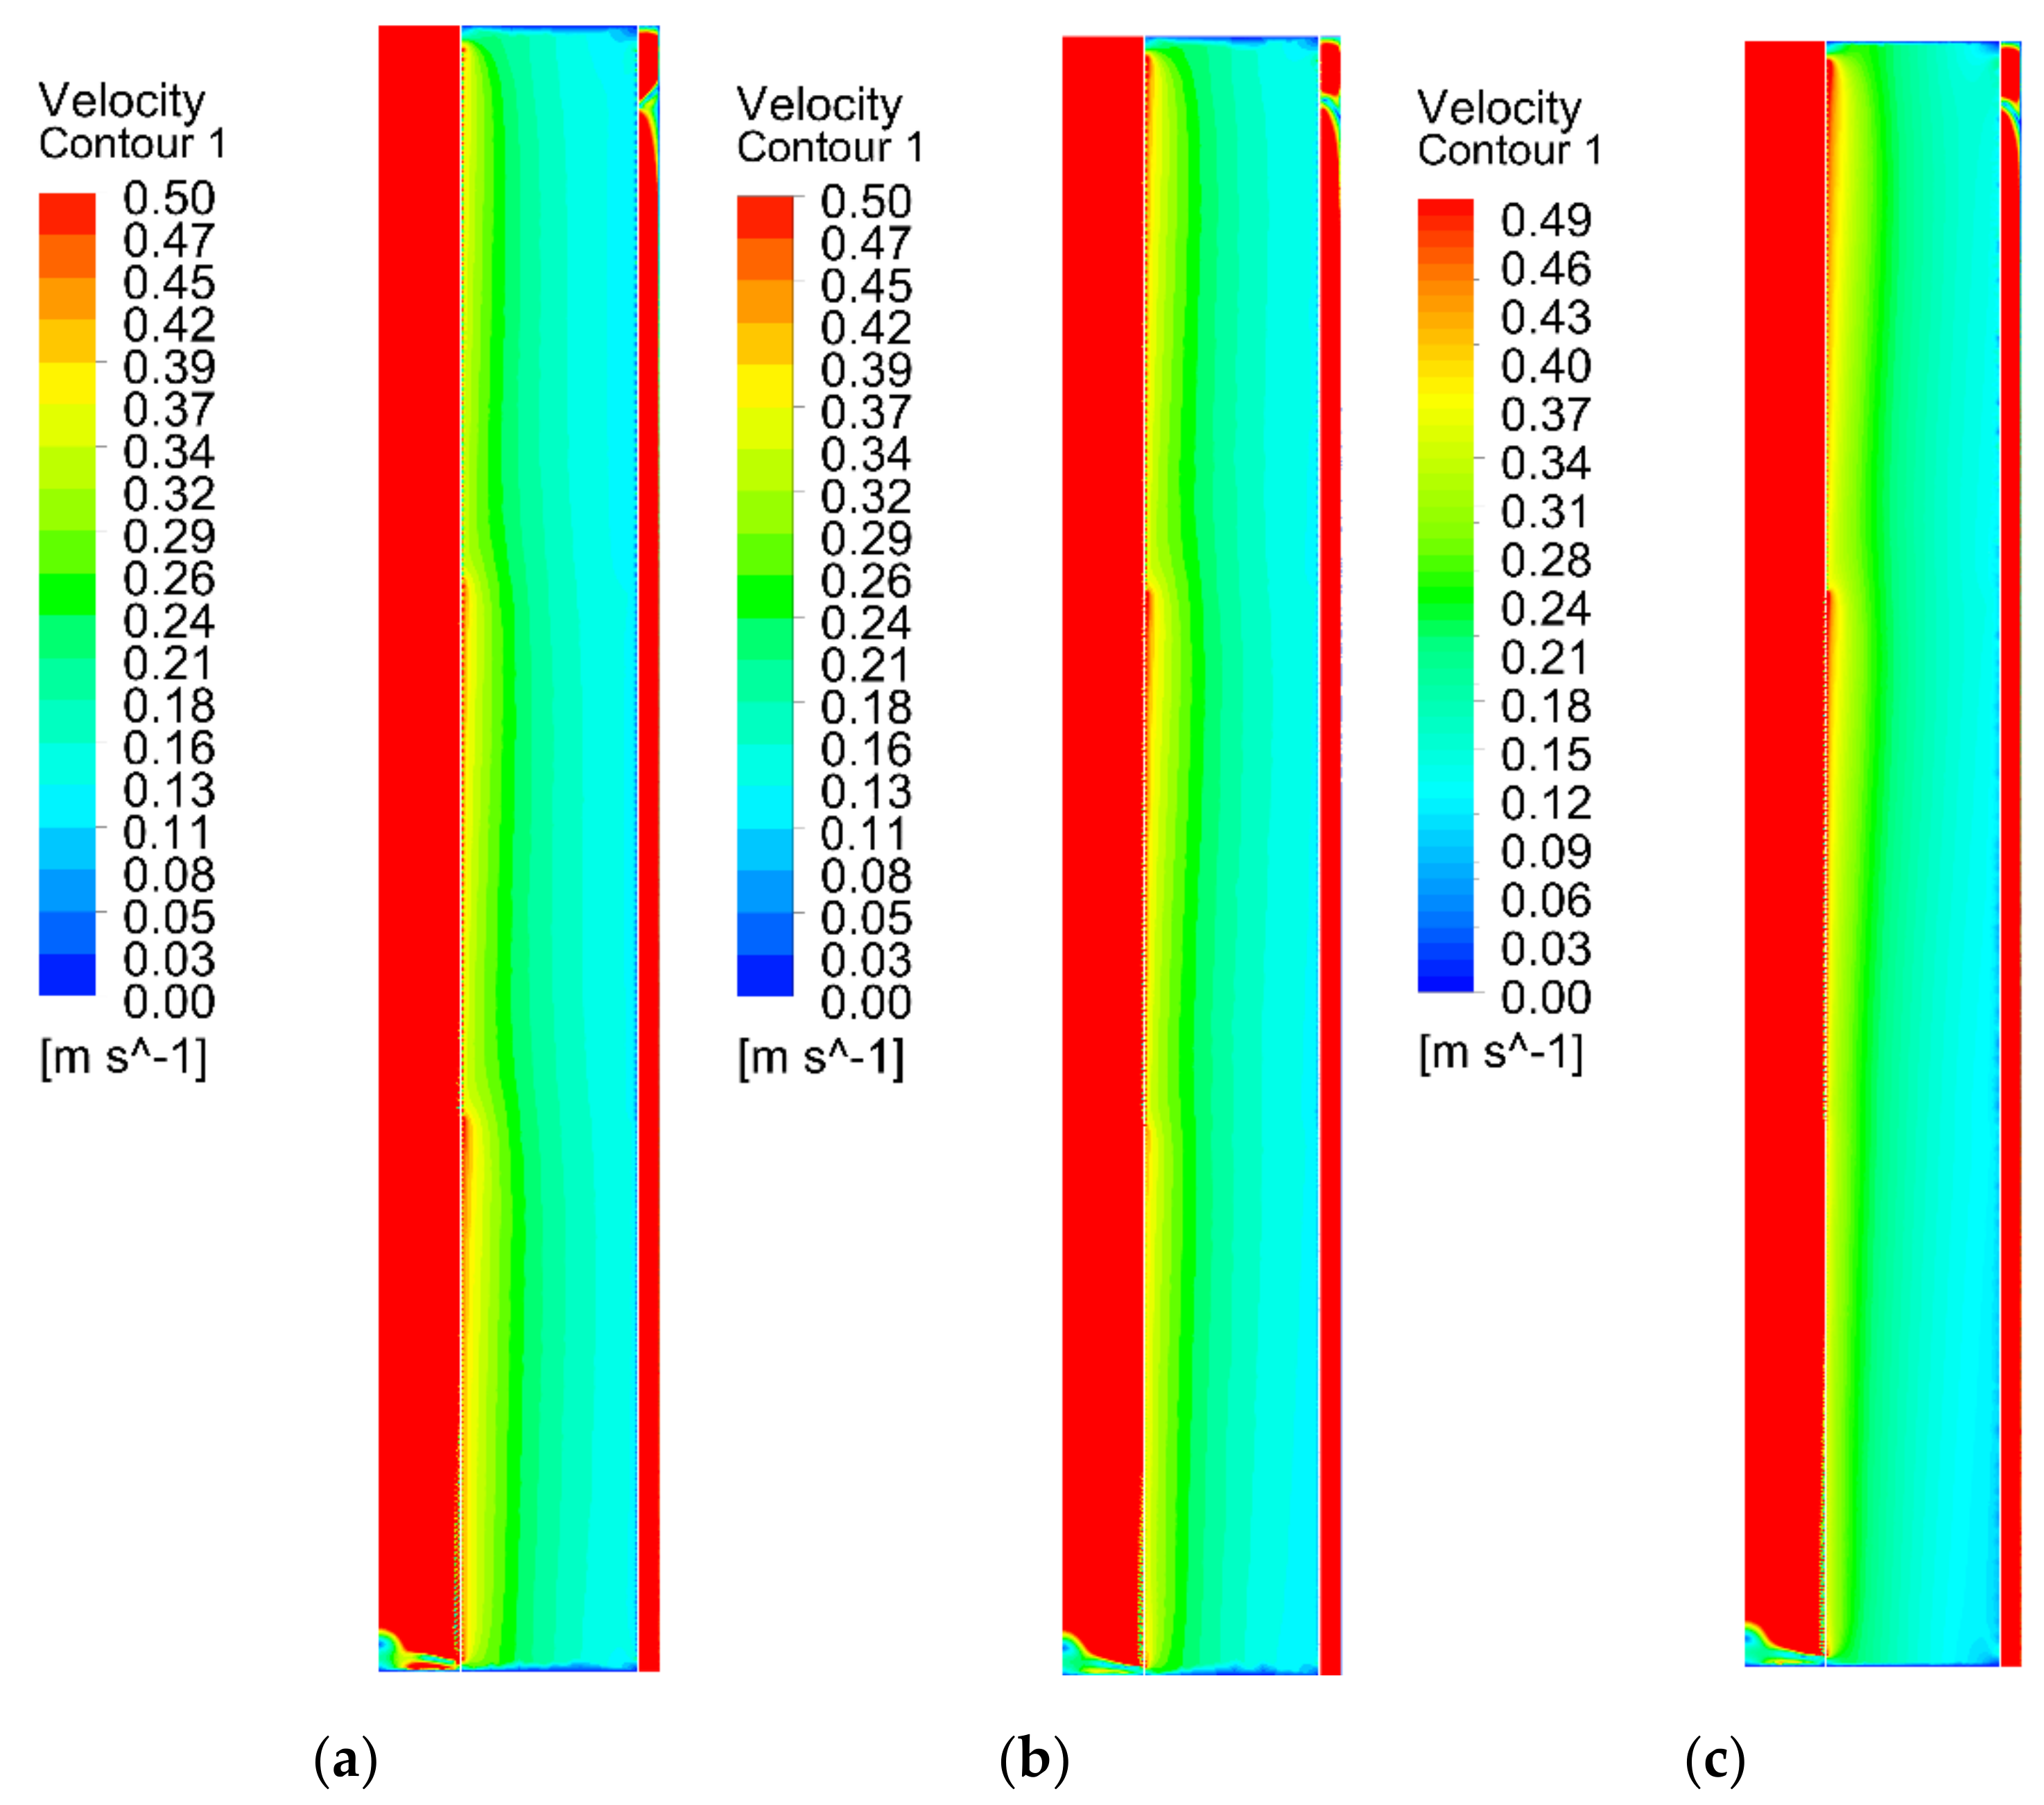
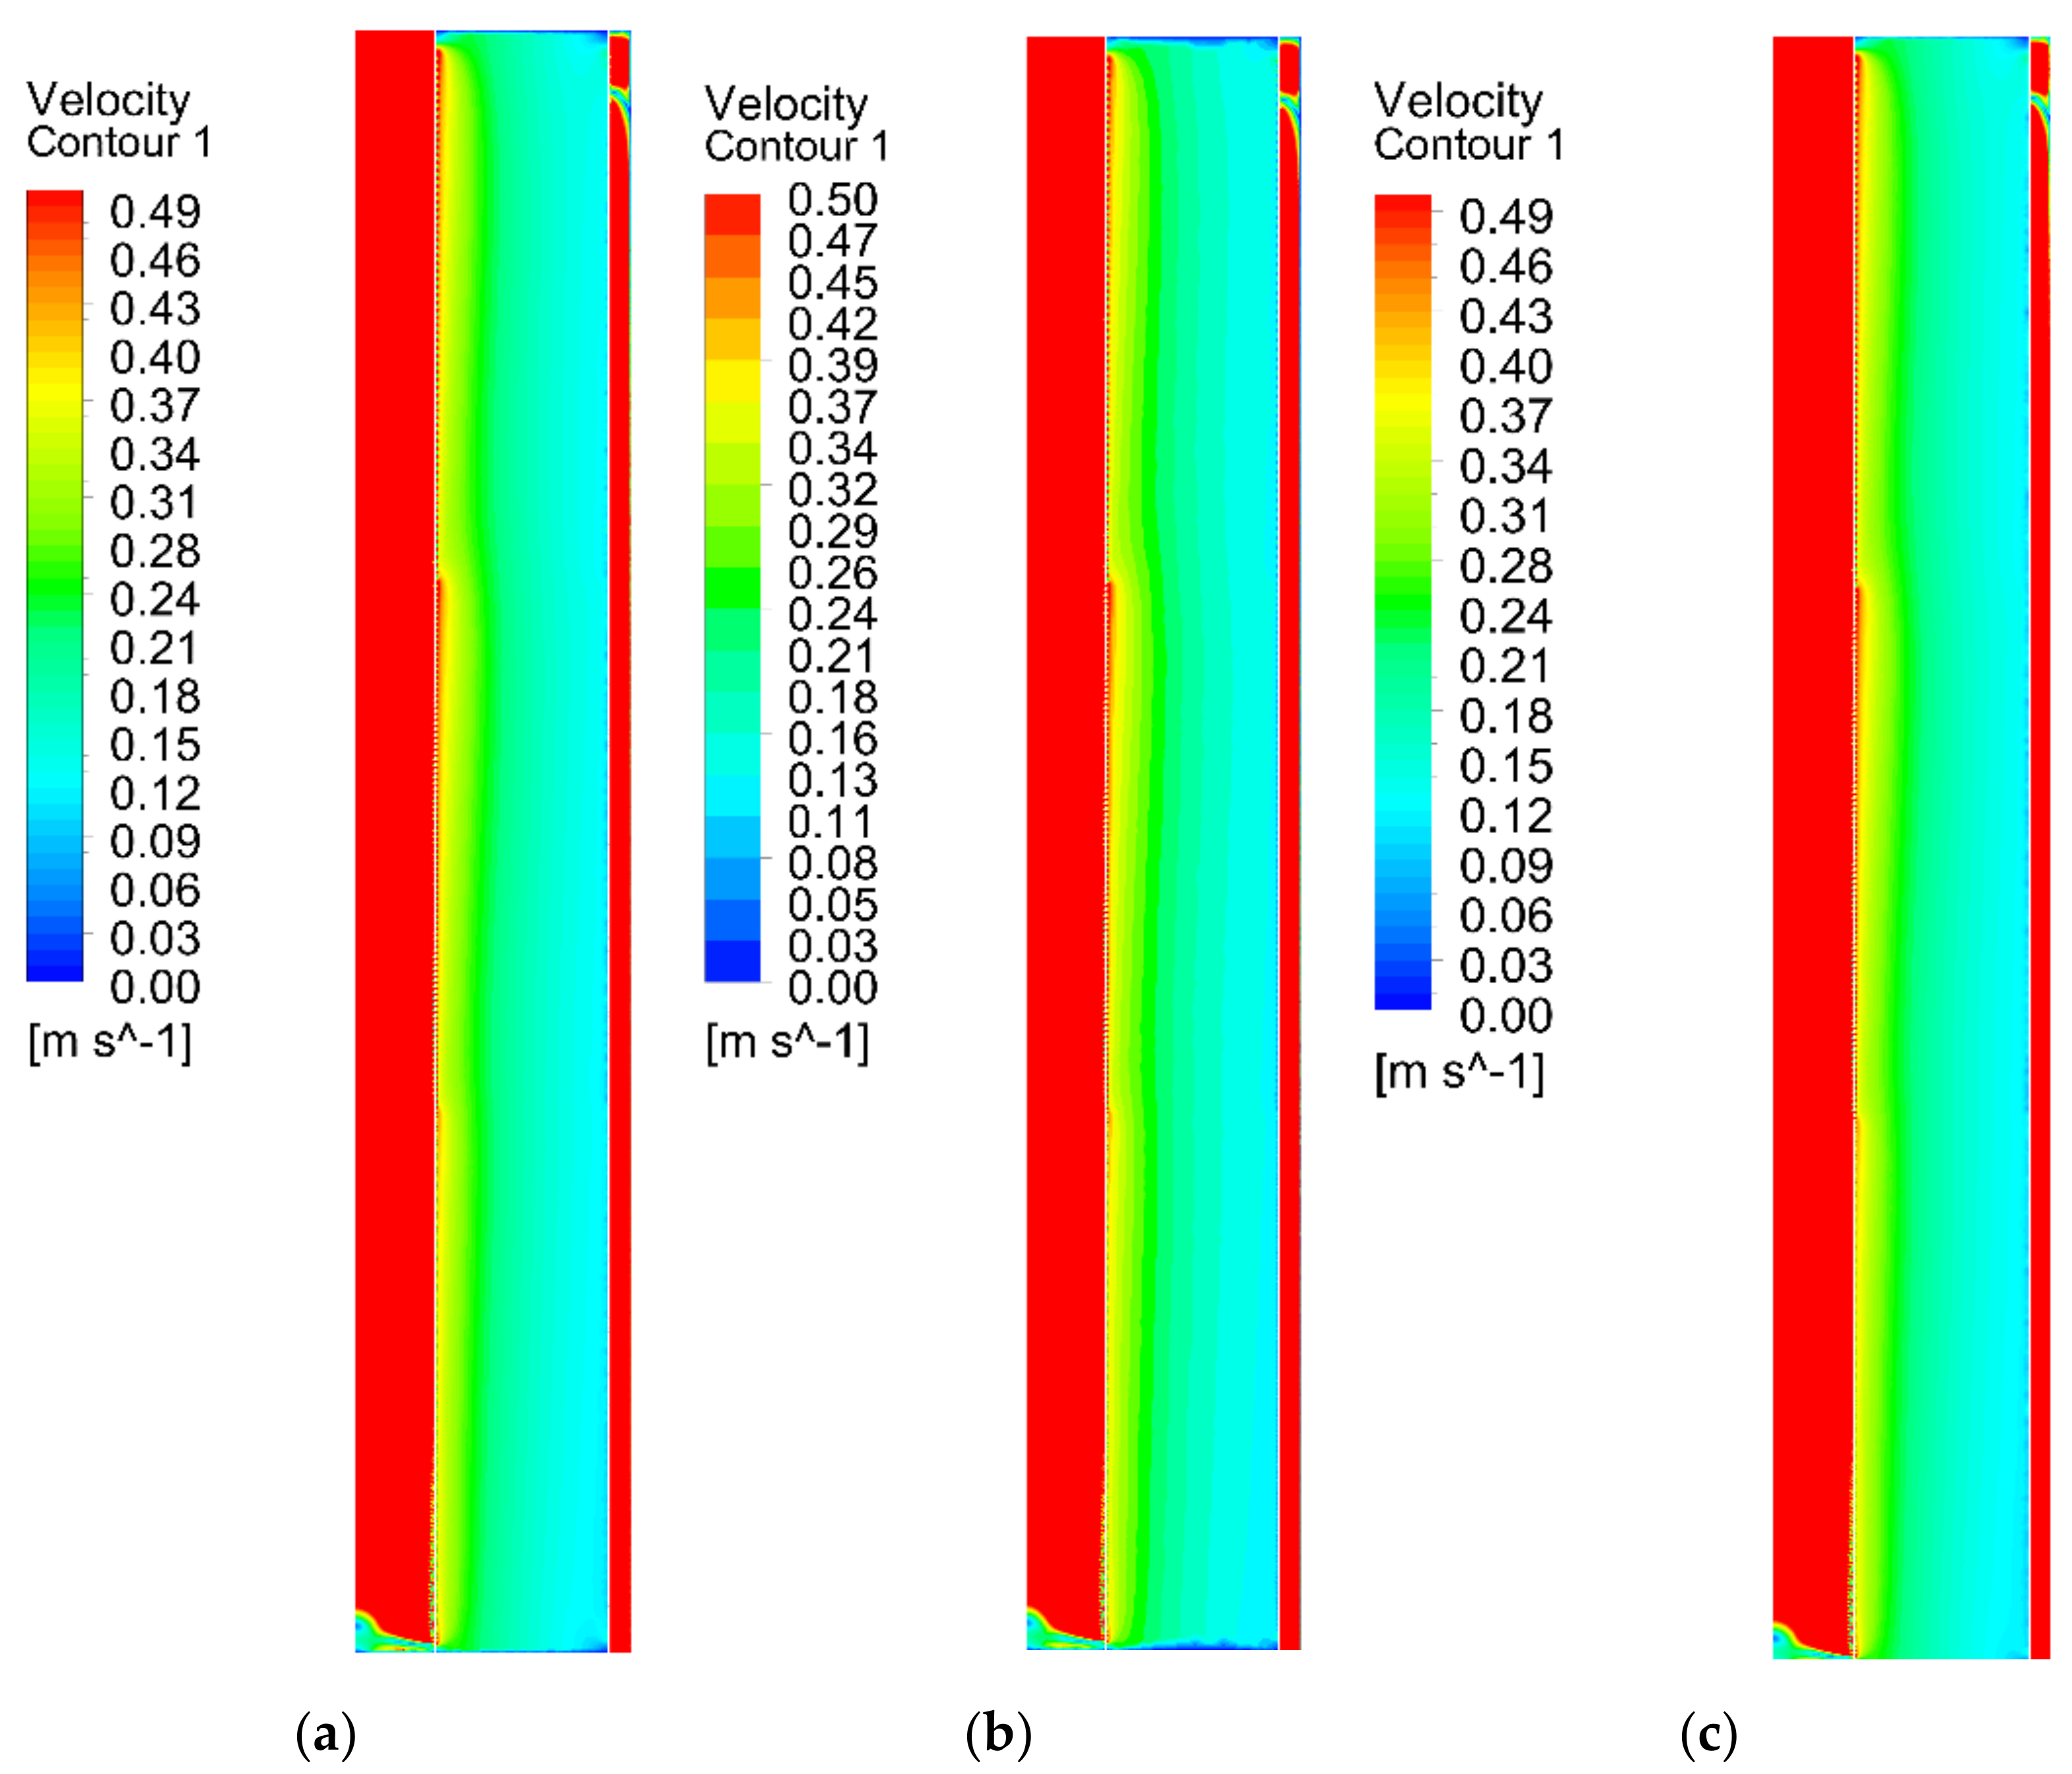
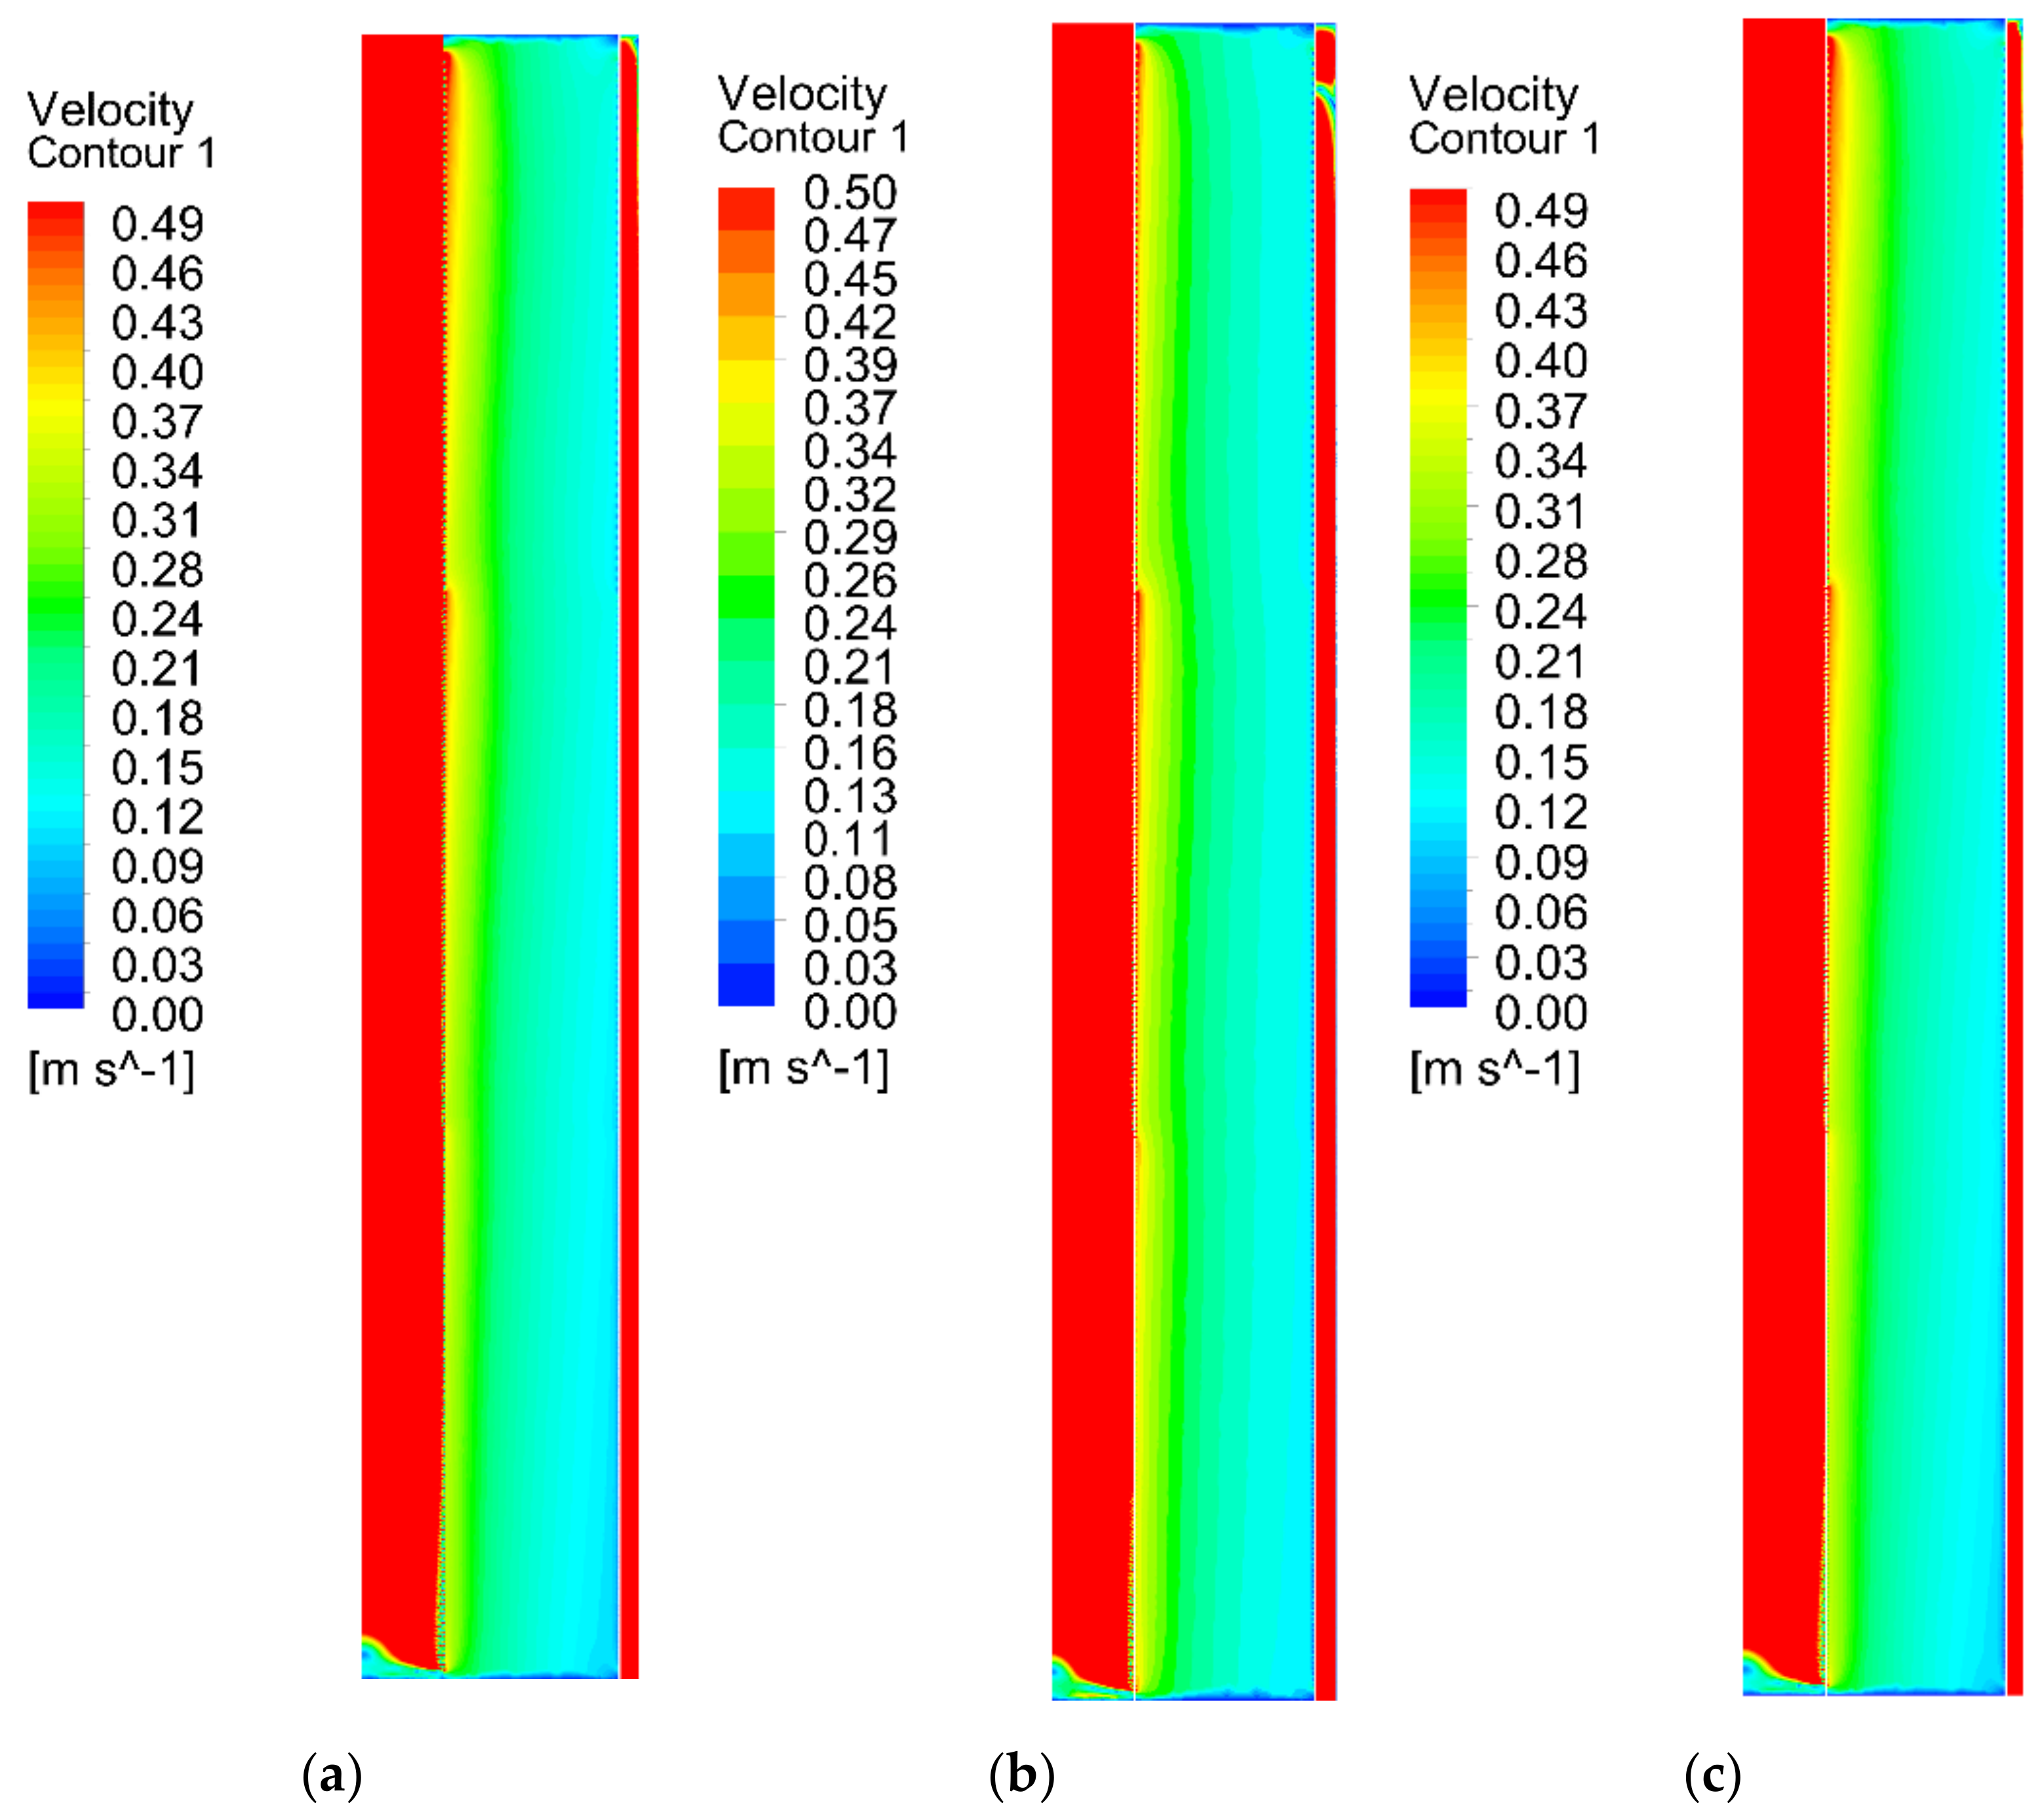
3.2.1. Flow Distribution Result

Figure 9 shows three velocity contour results with different opening rate strategies at the location of the center pipe. Through the comparison between the three contour results, it can be seen clearly at the location near the center pipe that the velocity distribution differences are obvious. The result of strategy 1 demonstrates that the velocity at the bottom part is clearly higher than the medium part and the top part. The flow velocity shows a trend of increasing from the top to the bottom. In contrast, the velocity variation in strategy 3 has a trend of decreasing from the top to the bottom. The three-stage opening gas flow velocity in strategy 2 is more uniform than those in strategy 1 and strategy 3. A higher gas flow velocity is generated at the junction between each section of the three-section opening. Therefore, for the center pipe porosity changing strategy, the comparison among these three contours shows that strategy 2 has better gas flow distribution.
For the result of the annular channel porosity changing strategy and the annular channel width changing strategy, the velocity distribution contour between these strategies (Figure 10 and Figure 11) is not obvious compared to the center pipe porosity changing strategies. Both Figure 10 and Figure 11 show that these strategies have similar velocity increase areas at the junction of the three opening sections, and the trend of gas velocity change at the junction from top to bottom is also very close. Additionally, there is a significant increase in gas flow velocity at the junction of the upper and middle sections, while the gas flow velocity changes at the junction of the bottom section more gently. For the annular channel porosity-changing strategy, the overall velocity change is that the gas flow velocity from the top to the bottom is slightly decreased. Compared with the annular channel porosity changing strategy, the velocity variation in the annular channel width changing strategy is slightly different. For strategies 6 and 7, the gas flow velocities at the top section are higher; on the other hand, they are lower at the bottom section, but it is still hard to compare each strategy.
For the different gas flow distribution strategy contour results shown above, it can be observed that the three-section porosity strategy could significantly improve the gas flow uniformity better than the single porosity strategy. Figure 12, Figure 13 and Figure 14 demonstrate the detailed radial velocity changes along the height of the reactor at the location of the center pipe (x = 0.2 m) and annular channel (x = 1.32 m) for different porosity strategies.
Figure 12 shows the velocity changes resulting from the center pipe porosity strategies. At the location of the center pipe, strategy 1 indicated that the radial velocity at the center pipe decreases stepwise from bottom to top along the height of the reactor. In contrast, the flow velocity increases stepwise from the bottom to the top along the height of the reactor at the location of the annular channel. Compared with strategies 1 and 3, the flow velocity presented in strategy 2 is relatively stable and has a smooth velocity variation. However, under the influence of the three-section opening strategy, there are three velocity peaks and the reason why these three peaks appear is the different distances between the junctions of each section. For annular channel porosity strategies based on strategy 2 in Figure 14, both results show no significant changes, especially the velocity changes at the location of the center pipe. In the strategy of annular channel width changes, both locations’ velocity magnitude results indicated that strategy 2 has the most uniform gas flow distribution at the location of the center pipe.
In conclusion, by using Celik’s three-section hole-opening strategy, the different flow profile results mentioned in this section have achieved better uniformity than a single porosity strategy because the three-section strategy could have more flexibility on the pressure adjusting in the reactor. However, this strategy will inevitably increase the pressure inside the reactor because of the increasing complexity of the porosity method. Moreover, for the gas flow non-uniformity inside the reactor, it is difficult to make the comparison directly only from the velocity contour result. The velocity variation data should be used for further comparison in the next section. In addition, it can be seen from the change of the opening porosity of the center pipe, the annular channel and the change of the width of the annular channel that these three different opening strategies have different effects on the reactor uniformity of the gas flow. The variation in the gas flow velocity inside the reactor caused by the change in porosity at the center pipe is more significant than the change in the opening rate of the annular channel and the width changes of the annular channel.

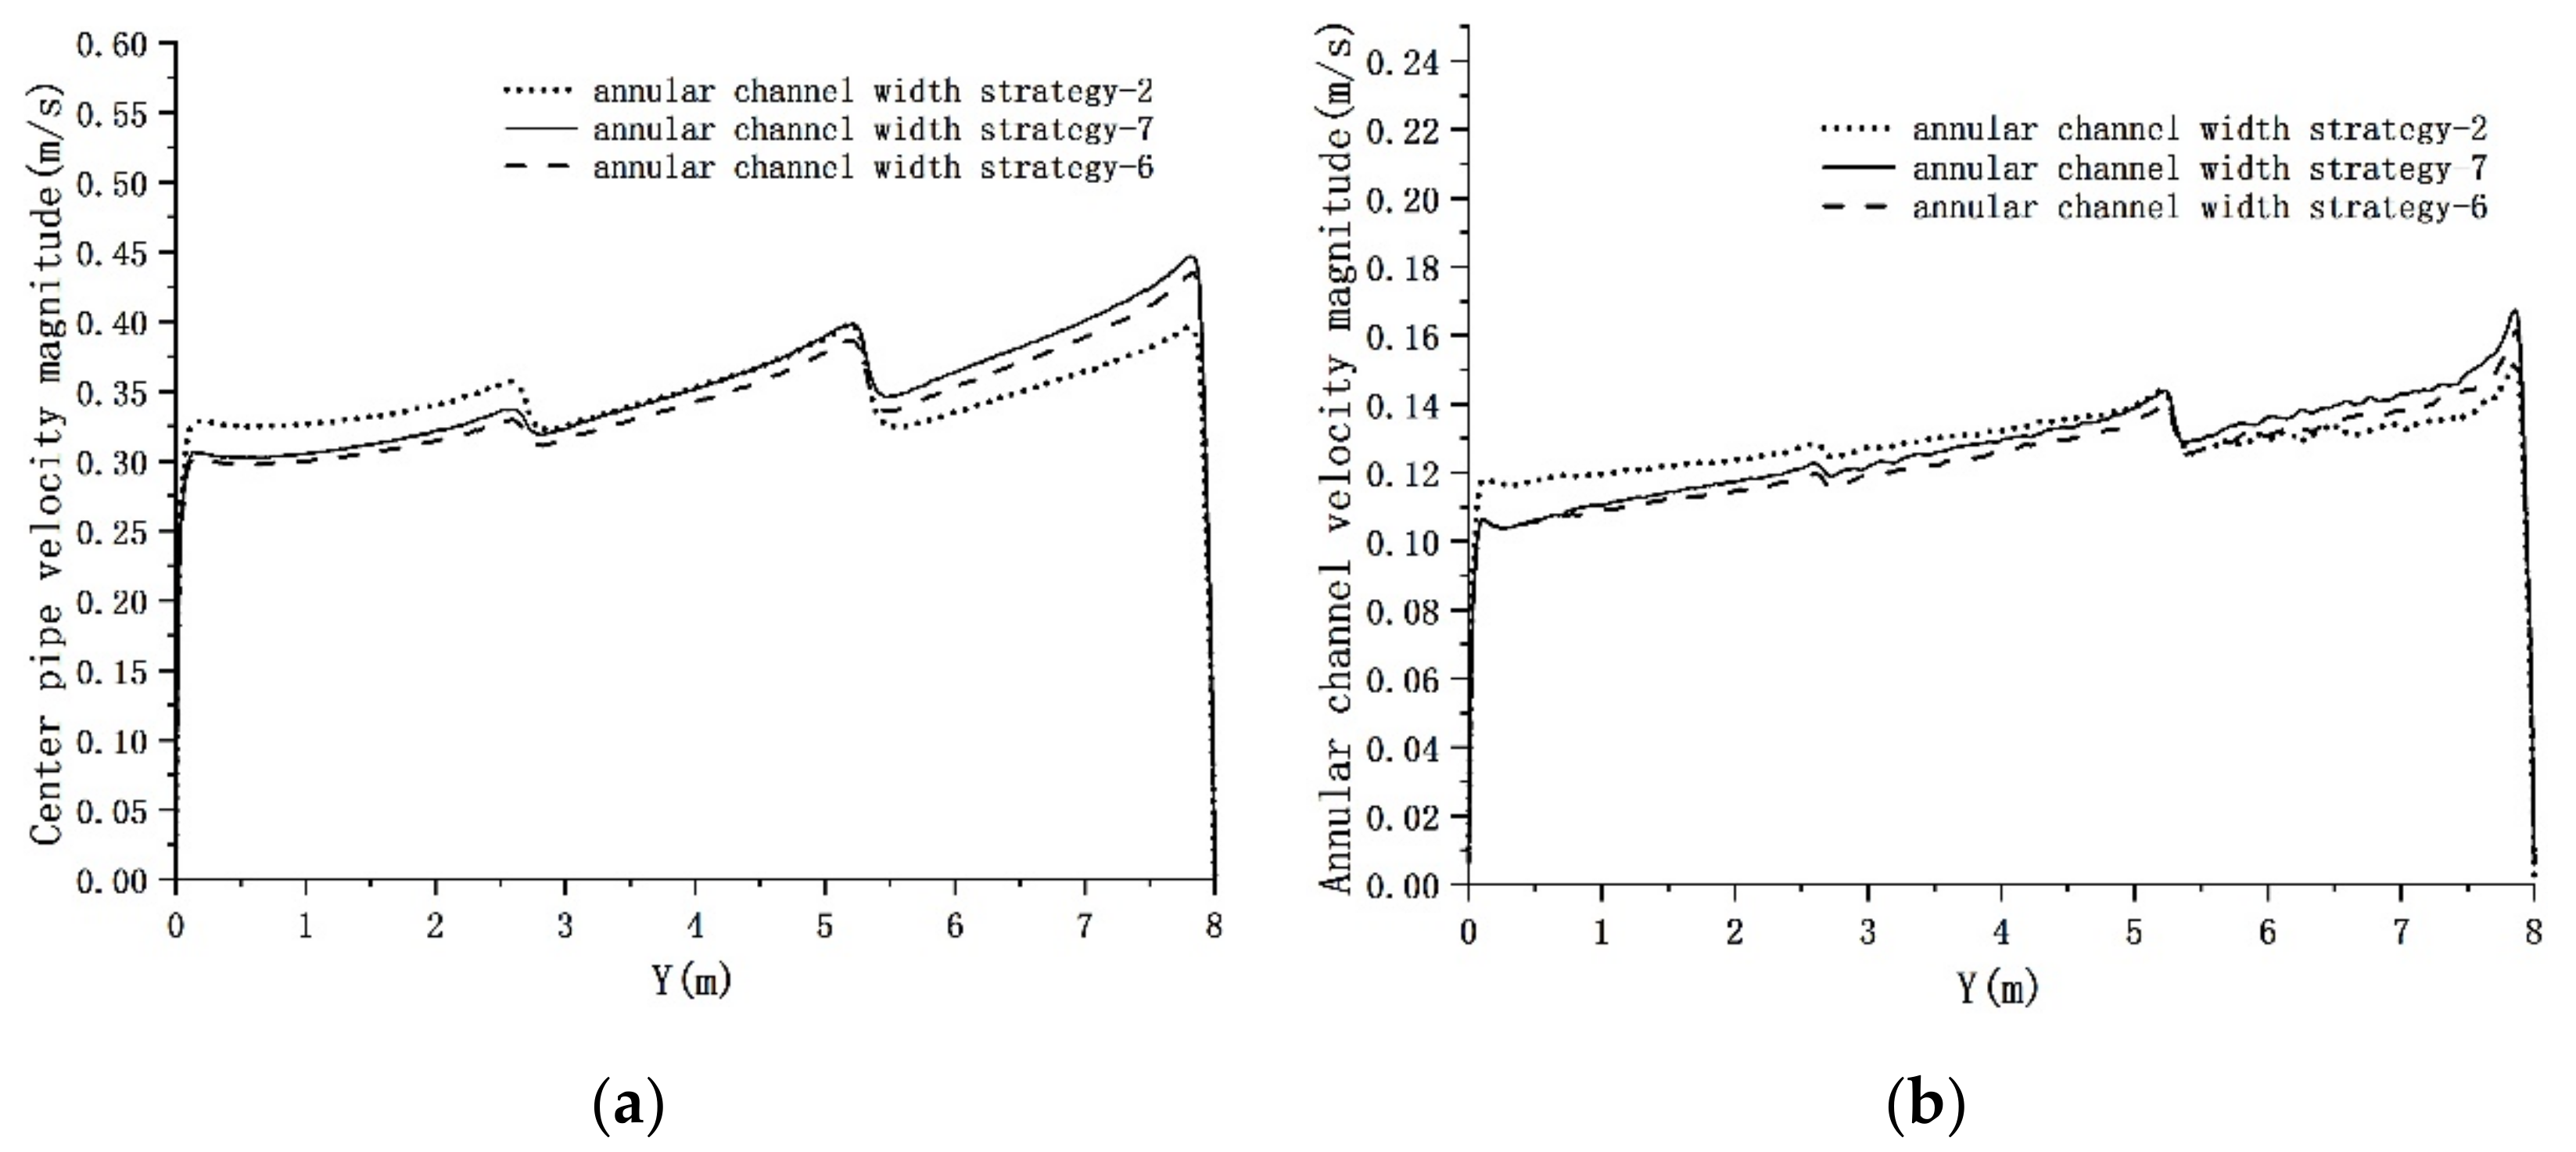
3.2.2. Flow Distribution Result

In this section, the uniformity criterion suggested by Wang et al. [19] is used, that is, the flow distribution non-uniformity, M f , represented by following equation:
M f = 1 F 0 0 F 0 w i w ¯ w ¯ 2 dF
In the above equation, F 0 is the total cross-sectional area of the catalyst bed, w i is the flow velocity at different point and w ¯ is the average flow velocity of the cross section. The average flow velocity w ¯ is define as follows:
w ¯ = 1 F 0 0 F 0 w i dF
The numerical value of the non-uniformity M f calculated in Equation (9) represents the uniformity of the gas distribution inside the reactor. The closer the M f value is to 0, the more uniform the gas distribution in the radial flow reactor and the better the effect; the larger the M f value, the more uniform the gas distribution and the more serious the deviation.
Figure 15 shows the non-uniformity curves obtained under the three different porosity strategies (strategies 1–3). By intercepting the variation results of the radial velocity along with the height of the reactor obtained by different porosity strategies at x = 0.2 m near the center pipe and x = 1.32 m near the annular channel, the non-uniformity curve is calculated, and the results show that these three hole-opening strategies have obvious differences on the non-uniformity curve. At the location of the center pipe, three non-uniformity curves all have a peak around 0.2. Compared with strategies 2 and 3, strategy 1 has a higher non-uniformity curve in the bottom and top parts of the three-section opening strategy, and the uniformity in the middle part is slightly better than strategies 2 and 3. At the location of the annular channel, the non-uniformity result of strategy 3 is obviously the worst. The result in strategy 1 has better gas uniformity in the middle part; for the bottom section and top section, the non-uniformity results in strategy 1 and strategy 2 are not easy to distinguish the differences. Based on strategy 2, strategies 4 and 5 focused on the variation of annular channel porosity. The non-uniformity result in Figure 16 shows that there is no significant change in the location of the center pipe. For the annular channel, the non-uniformity results of strategies 4 and 5 are slightly better than strategy 2, and it can be seen clearly that the middle part of the gas non-uniformity result for strategy 2 is worse than the other two strategies. Figure 17 reflects the non-uniformity result focused on the variation of annular channel width. The location of the center pipe and annular channel indicated that the non-uniformity curve of strategy 2 still had the best performance compared with strategy 6 and strategy 7.
In addition, Table 4 shows the non-uniformity parameters of the different strategies. The results below show that strategies 2, 4 and 5 have lower non-uniformity compared to the other four strategies, which means that the gas distribution inside the reactor brought by these three opening strategies is more uniform than the remaining four strategies.
Overall, the non-uniformity results demonstrated that the result of strategy 1 have more uniform gas distribution at the location of the annular channel but much worse at center pipe. For strategies 1, 2 and 3, where the porosity strategy focused on the center pipe perforated plate, strategy 2 have the best gas distribution result. For strategies 4 and 5, where porosity strategy focused on annular channel perforated plate, the non-uniformity results variety are not obvious compared with strategies 1–3. Moreover, for the strategies focused on the variation of the annular channel width, the results indicate that the non-uniformity becomes larger as the annular channel width decreases.

4. Conclusions

Fluid flow in a “Z” type centripetal flow radial flow fixed bed reactor (CP-z-RFBR) is simulated using computational fluid dynamics. The variation of several parameters including changing center pipe perforated plate porosity, annular channel perforated plate porosity and the width of the annular channel have been introduced to investigate the form of gas distribution inside the reactor. The porosity strategies are based on Celik’s research and the aim of this article is to further investigate the influence of Celik’s three-section porosity strategy in actual reactor parameters. Through the simulation results, this research reduced the range of opening ratio of each part of the perforated plate when using the three-section strategy. For the center pipe perforated plate, the porosity should be 10%, 16% and 29% from top to bottom. For annular channel perforated plates, the porosity should be 10–12%, 21–25% and 30–40% from top to bottom.
CFD calculation results indicate that the change in center pipe perforated plate porosity has a more obvious impact on the gas distribution in the reactor. Compared with the change in the center pipe perforated plate porosity, the change in the circular channel perforated plate porosity has a relatively lower effect on the gas distribution in the reactor. For the annular channel width, the simulation result shows that the larger the width of the reactor, the better its performance. This result also verifies the conclusion drawn by Kareeri [18] that when the ratio of the cross-sectional area of the central tube to the cross-sectional area of the annular channel is greater than 1, the CP-Z-RFBR has a more uniform gas flow distribution. However, the cross-sectional area of the central tube and the cross-sectional area of the annular channel should not be too far apart. In this paper, the gas distribution inside the reactor becomes less uniform after reducing the width of the annular channel. The non-uniformity result also shows the trend that reducing annular channel width leads to lower uniformity. The reason for this trend could be that excessive reduction of the annulus channel cross-sectional area results in a high velocity of gas flow into the reactor, which may increase the difficulty of perforated plates regulating gas flow uniformity.
In the design stage of CP-Z-RFBR, when the height and diameter of the reactor cannot be changed, the optimal configuration cannot be achieved through the ratio of the cross-sectional area of the central pipe to the cross-sectional area of the annular channel. At that moment, the porosity of the center pipe perforated plate (the three-section porosity strategy described in the article) should first be changed to improve the uniformity of the flow and reduce maldistribution. Second, by changing the porosity of the circular channel perforated plate to further optimize the uniformity of the gas flow in the reactor, the optimal solution can be obtained as much as possible.
Due to the large volume of the reactor used in this paper, the height of 8 m and the width of 2.7 m made the field experiment more difficult. Most of the research on radial flow reactors, for experimental research, uses reactor sizes that basically stay on small laboratory reactors, and the height of the reactor basically does not exceed 2 m. Experiments in small reactors can indeed reflect the gas flow patterns inside to some extent, but few articles have studied gas flow inside using large-scale or even super-large reactors. Similar studies, such as Kareeri and Zughbi’s simulations, use a model with a height of 2 m and a width of 0.5 m and he does not cover the experimental research. Therefore, this paper uses CFD simulation as the main form to explore the structure of the internal flow distribution of the super-large scale radial flow reactor to obtain the best flow distribution and to reduce the mal-distribution problem. At the same time, provide more references for subsequent research.

Author Contributions

Conceptualization, Y.L.; Data curation, Y.X.; Formal analysis, Y.X.; Investigation, Y.X.; Methodology, Y.X.; Project administration, H.W.; Resources, C.Z.; Software, Y.X.; Supervision, C.Z. and Z.L.; Validation, H.W.; Writing—original draft, Y.X.; Writing—review & editing, Z.L. All authors have read and agreed to the published version of the manuscript.

Funding

This research was funded by Scientific Research Project of Beijing Educational Committee (No. KM202011417007).

Institutional Review Board Statement

Not applicable.

Informed Consent Statement

Not applicable.

Data Availability Statement

Not applicable.

Acknowledgments

The authors would like to express gratitude to the Scientific Research Project of Beijing Educational Committee (No. KM202011417007) and several teachers, Zhang Chuanzhao, Wang Haoyu and Ma Xiaojun, for their great help. We would also like to thank Li Ziyi and Liu Yingshu from the University of Science and Technology Beijing for their guidance on the article.

Conflicts of Interest

The funders had no role in the design of the study; in the collection, analyses, or interpretation of data; in the writing of the manuscript, or in the decision to publish the results.

References

  1. Zheng, H.; Lin, X.; Xia, H. Development of vertical radial flow adsorbers for air separation plants. Hangyang Technol. 2015, 3, 13–19. [Google Scholar]
  2. Lu, J.L. Research on the Mechanism of Fluid Flow in a Radial Flow Adsorber. Ph.D. Thesis, Zhejiang University, Zhejiang, China, 2014. [Google Scholar]
  3. Epiepang, F.E.; Li, J.; Liu, Y.; Yang, R.T. Low-pressure performance evaluation of CO2, H2O and CH4 on Li-LSX as a superior adsorbent for air pre-purification. Chem. Eng. Sci. 2016, 147, 100–108. [Google Scholar] [CrossRef]
  4. Kapoor, A.; Yang, R.T. Roll-up in fixed-bed, multicomponent adsorption under pore-diffusion limitation. AIChE J. 1987, 33, 1215–1217. [Google Scholar] [CrossRef]
  5. Hlaváček, V.; Kubíček, M. Modeling of chemical reactors—XXV Cylindrical and spherical reaction with radial flow. Chem. Eng. Sci. 1972, 27, 177–186. [Google Scholar] [CrossRef]
  6. Calo, J.M. Cell model studies of radial flow, fixed bed reactors. In Chemical Reaction Engineering; American Chemical Society: Washington, DC, USA, 1978; pp. 550–561. [Google Scholar] [CrossRef]
  7. Balakotaiah, V.; Luss, D. Effect of flow direction on conversion in isothermal radial flow fixed-bed reactors. AIChE J. 1981, 27, 442–450. [Google Scholar] [CrossRef]
  8. Ponzi, P.R.; Kaye, L.A. Effect of flow maldistribution on conversion and selectivity in radial flow fixed-bed reactors. AIChE J. 1979, 25, 100–108. [Google Scholar] [CrossRef]
  9. Chu, L.; Wang, J.; Meng, Q.; Su, J. Analysis of Flow Filed of Radial Flow Molecular Sieve Adsorber Under Different Flow Rates. Low Temp. Spec. Gases 2014, 32, 17–20. [Google Scholar] [CrossRef]
  10. Miao, Z.; Pan, M. Application of Fluent software in the simulation of radial adsorber flow field. Chem. Manag. 2013, 10, 240–241. [Google Scholar]
  11. Li, J.; Zhou, H.; Lin, X. Numerical simulation of flow field in radial flow molecular sieve adsorber. Cryog. Technol. 2010, 2, 49–52. [Google Scholar]
  12. Lobanov, E.L.; Skipin, Y.A. Increasing the operating efficiency of radial reactors in reforming. Chem. Technol. Fuels Oils 1987, 22, 275–278. [Google Scholar] [CrossRef]
  13. Chen, Y.; Zhang, X.; Lu, J.; Qiu, L.; Zhang, X.; Sun, D. Fluid flow characteristics and structural parameter optimization of radial flow adsorber. CIESC J. 2014, 65, 3395–3402. [Google Scholar] [CrossRef]
  14. Zhang, C.; Zhu, Z.; Xu, M.; Zhu, B. Research on uniform fluid distribution design of radial reactor (I). Chem. Eng. 1980, 1, 98–112, 97. [Google Scholar]
  15. Zhang, C.; Zhu, Z.; Xu, M.; Zhu, B. Research on uniform fluid distribution design of radial reactor (II). Chem. Eng. 1980, 2, 82–89, 35. [Google Scholar]
  16. Zhu, Z.; Zhang, C.; Xu, M. Design parameters for uniform fluid distribution in momentum exchange radial reactors. Chem. Eng. 1983, 5, 48–58. [Google Scholar]
  17. Xu, M. Study on the hydrodynamic characteristics of radial flow reactor. CIESC J. 1990, 41, 181–186. [Google Scholar]
  18. Kareeri, A.A.; Zughbi, H.D.; Al-Ali, H.H. Simulation of Flow Distribution in Radial Flow Reactors. Ind. Eng. Chem. Res. 2006, 45, 2862–2874. [Google Scholar] [CrossRef]
  19. Wang, H.; Liu, Y.; Meng, Y. The influence of the gas distribution system structure of the radial flow adsorber on the gas distribution effect. Chin. J. Eng. Sci. 2015, 37, 238–242. [Google Scholar] [CrossRef]
  20. Li, Y.; Si, H.; Wang, B.; Xue, L.; Wu, X. Optimization design research of air flow distribution in vertical radial flow adsorbers. Korean J. Chem. Eng. 2018, 35, 835–846. [Google Scholar] [CrossRef]
  21. Chen, Y.; Li, Y.; Si, H.; Wang, B.; Wang, H.; Shen, Y.; Qin, Z. Numerical investigation into the distributor design in radial flow adsorber. Adv. Appl. Math. Mech. 2019, 11, 1436–1460. [Google Scholar]
  22. Celik, C.E.; Smolarek, J. Radial Bed Flow Distributor for Radial Pressure Adsorber Vessel. U.S. Patent 7,128,775, 31 October 2006. [Google Scholar]
Figure 1. Celik’s research results in the form of openings [22].
Processes 10 01250 g001
Figure 2. Flow distributions in a radial flow reactor for CP configurations (ac) and CF configurations (df). The arrow length represents the mass magnitude [18].
Processes 10 01250 g002
Figure 3. Schematic of a radial flow reactor, where Lb is the height of the reactor, Ls1 and Ls2 are the lengths of the top and bottom seal layer, Dr, Da and Dcp are the diameters of the reactor, outer bed and the center pipe, respectively, Lat and Lct are the thickness of the center pipe and annular flow distributor, respectively and Dat and Dct are the opening diameters of the distribution plate on annular channel and center pipe, respectively.
Processes 10 01250 g003
Figure 4. Schematic of the values for x and y, which cuts are taken.
Processes 10 01250 g004
Figure 5. Velocity variation along the axial direction in the annular channel and the center pipe.
Processes 10 01250 g005
Figure 6. Velocity variation along the radius of the reactor at Y = 4.
Processes 10 01250 g006
Figure 7. Velocity variation along the radius in the reactor at Y = 4 with 5 different mesh sizes.
Processes 10 01250 g007
Figure 8. Annular channel velocity variation alone for the bed length for five mesh sizes.
Processes 10 01250 g008
Figure 9. Velocity contour at the location of the center pipe; (a) Velocity contour for strategy 1; (b) Velocity contour for strategy 2; (c) Velocity contour for strategy 3.
Processes 10 01250 g009
Figure 10. Velocity contour at the location of the annular channel; (a) Velocity contour for strategy 4; (b) Velocity contour for strategy 2; (c) Velocity contour for strategy 5.
Processes 10 01250 g010
Figure 11. Velocity contour by changing the annular channel width: (a) Velocity contour for strategy 6; (b) Velocity contour for strategy 2; (c) Velocity contour for strategy 7.
Processes 10 01250 g011
Figure 12. Radial velocity changes at different locations: (a) Radial velocity changes at the center pipe; (b) Radial velocity changes at the annular channel.
Processes 10 01250 g012
Figure 13. Radial velocity changes at different locations: (a) Radial velocity changes at the center pipe; (b) Radial velocity changes at the annular channel.
Processes 10 01250 g013
Figure 14. Radial velocity changes at different locations: (a) Radial velocity changes at the center pipe; (b) Radial velocity changes at the annular channel.
Processes 10 01250 g014
Figure 15. Non-uniformities for different Center pipe strategies: (a) non-uniformity at the location of the Center pipe, (b) non-uniformity at the location of the Annular pipe.
Processes 10 01250 g015
Figure 16. Non-uniformities for different annular channel strategies: (a) non-uniformity at the location of the Center pipe, (b) non-uniformity at the location of the Annular pipe.
Processes 10 01250 g016
Figure 17. Non-uniformities for different annular channel width strategies: (a) non-uniformity at the location of the Center pipe, (b) non-uniformity at the location of the Annular pipe.
Processes 10 01250 g017
Table 1. Dimension parameters of the reactor.
DimensionsDrDaDcpLbLs1Ls2LatLctDatDct
Values (mm)27362536800800010050810108
Table 2. Boundary conditions used in the simulations.
Operating Condition Inlet   Flow   Rate   ( m 3 / s )Catalyst Bed PorosityCatalyst Average Diameter (mm)Feed Gas Material
Values2.780.384.6Air
Table 3. Variable parameters of the reactor.
Changing Center Pipe Opening Rate
Central channel pore opening ratioAnnular channel pore opening ratioAnnular channel width (mm)
upmiddledownupmiddledown
Strategy 17%10%20%10%21%34%100
Strategy 210%16%29%10%21%34%100
Strategy 315%25%34%10%21%34%100
Changing Annular Channel Opening Rate
Center pipe opening ratioAnnular channel opening ratioAnnular channel width (mm)
upmiddledownupmiddledown
Strategy 410%16%29%8%20%30%100
Strategy 210%16%29%10%21%34%100
Strategy 510%16%29%12%25%40%100
Changing Annular Width
Center pipe opening ratioAnnular channel opening ratioAnnular channel width (mm)
upmiddledownupmiddledown
Strategy 210%16%29%10%21%34%100
Strategy 610%16%29%10%21%34%90
Strategy 710%16%29%10%21%34%80
Table 4. Non-uniformity results.
Non-UniformityAnnular ChannelCenter Pipe
Strategy 10.01140.0384
Strategy 20.01240.035
Strategy 30.01560.0385
Strategy 40.0120.0348
Strategy 50.01180.0348
Strategy 60.01540.0441
Strategy 70.01650.0466
Publisher’s Note: MDPI stays neutral with regard to jurisdictional claims in published maps and institutional affiliations.

