Article

On Reassessment of the HWMA Chart for Process Monitoring

1
Department of Mathematics, King Fahd University of Petroleum and Minerals, Dhahran 31261, Saudi Arabia
2
Department of Mathematics, COMSATS University Islamabad, Wah Cantt Campus, Punjab 47040, Pakistan
3
Industrial and Systems Engineering Department, King Fahd University of Petroleum and Minerals, Dhahran 31261, Saudi Arabia
4
Interdisciplinary Research Centre for Smart Mobility and Logistics, King Fahd University of Petroleum and Minerals, Dhahran 31261, Saudi Arabia
*
Author to whom correspondence should be addressed.
Processes 2022, 10(6), 1129; https://doi.org/10.3390/pr10061129
Submission received: 17 May 2022 / Revised: 28 May 2022 / Accepted: 2 June 2022 / Published: 5 June 2022
(This article belongs to the Special Issue Reliability and Engineering Applications)

Abstract

:
In the recent literature of process monitoring, homogeneously weighted moving average (HWMA) type control charts have become quite popular. These charts are quite efficient for early detection of shifts, especially of smaller magnitudes, in process parameters such as location and dispersion. A recent study pointed out a few concerns related to HWMA charts that mainly relate to its steady-state performance. It needs to be highlighted that the initial studies on HWMA focused only on the zero-state performance of the chart relative to other well-known memory charts. This study reinvestigates the performance of the HWMA chart under zero and steady states at various shifts. Using the Monte Carlo simulation method, a detailed comparative analysis of the HWMA chart is carried out relative to the exponentially weighted moving average (EWMA) chart with time-varying limits. For several values of design parameters, the in-control and out-of-control performance of these charts is evaluated in terms of the average run length (ARL). It has been observed that the structure of the HWMA chart has the ability to safeguard the detection ability and the run-length properties under various delays in process shifts. More specifically, it has been found that HWMA chart is superior to the EWMA chart for several shift sizes under zero state and is capable of maintaining its dominance in case the process experiences a delay in shift. However, the steady-state performance depends on the suitable choice of design parameters. This study provides clear cut-offs where HWMA and EWMA are superior to one another in terms of efficient monitoring of the process parameters.

1. Introduction

Quality is the ability of a product or a service to satisfy the clients’ requirements. Quality assurance departments of companies monitor their processes to improve the quality of product or services. Statistical process control (SPC) is a toolkit containing some efficient tools, among which the control chart is the most widely used [1]. The control chart helps to investigate the variations in a process, classified as common-cause and special-cause variations. The presence of common-cause variations alone implies that the processes is in an in-control (IC) state, while the addition of special causes leads the processes to an out-of-control (OOC) state [2]. Shewhart, exponentially weighted moving average (EWMA), and cumulative sum (CUSUM) are the most popular charts in SPC that are used for effective monitoring of the process parameters.
Roberts [3] introduced an EWMA chart for efficient monitoring of small shifts in the process parameters. Later, some modifications and advancements were devised to further improve the structure. A few of these are mentioned here [4,5,6,7,8,9,10,11,12,13,14,15,16,17,18,19,20,21,22,23,24]; however, they are also mentioned in various other studies.
The homogeneously weighted moving average (HWMA) method has gained a lot of popularity in quality control research in recent years. Abbas [25] proposed an HWMA chart for efficient monitoring of small and moderate shifts using an optimized weighting scheme. It was observed that HWMA outperformed the EWMA chart for various amounts of shifts under zero state. Later, the structure of the HWMA chart was used in many other studies, such as those mentioned in [26,27,28,29,30,31,32,33,34,35,36,37,38,39,40,41], among others.
Recently, Knoth et al. [42] criticized a memory-type structure termed the progressive mean (PM) control chart by Abbas et al. [43]. In reply to that criticism, Abbas and Riaz [44] proposed a slight modification in the implementation of the PM control chart to recover its steady state performance. In their article, Knoth et al. [42] also raised few concerns related to the steady-state performance of the HWMA control chart. This study reinvestigates the properties of the HWMA chart under zero and steady states for various shift sizes in the process mean. A detailed comparative analysis of the HWMA chart is conducted and is compared with the time varying EWMA chart. The performances of the HWMA chart under the two states are studied in the form average run-length (ARL), which is the average number of samples until an OOC signal occurs. It is denoted by A R L 0 and A R L 1 for the IC and OOC states, respectively [45].
The remaining article is organized as: Section 2 provides a control charting structure of the EWMA and HWMA charts. Section 3 provides a performance analysis of the two charts. Section 4 concludes the study with some useful recommendations.

2. EWMA and HWMA Charts

Assume Y as the process variable following normal distribution with mean μ and known variance σ 2 , i.e., Y ~ N ( μ ,   σ 2 ) . Let y i t be the i th observation at time t taken from Y with mean y ¯ t and variance s t 2 ,   t = 1 ,   2 , and i = 1 ,   2 , ,   n . Moreover, we define μ = μ 0 + δ σ n , where μ 0 is the mean of an IC process and δ is the magnitude of shift in the process mean (if any) in σ n units. Using this information, EWMA and HWMA charts are described below.

2.1. EWMA Chart

The EWMA chart uses current and lag information in such a way that small and persistent shifts are accumulated. The EWMA charting statistic is based on weights, such that its most recent value has a larger weight and the less recent value has smaller weights are decrease as the observations become less recent. The plotting statistic Z t of the EWMA chart for monitoring process mean μ y is
Z t = λ y ¯ t + ( 1 λ ) Z t 1   with   Z 0 = μ 0
where λ is the sensitivity parameter of the EWMA chart, such that 0 < λ ≤ 1, i.e., for smaller and larger values of λ , the EWMA chart becomes more sensitive to the smaller and moderately larger shifts, respectively. The starting value of Z t at t = 0 is Z 0 = μ 0 and the mean and variance of Z t are given as μ 0 and n 1 σ 2 [ λ 2 λ { 1 ( 1 λ ) 2 t } ] , respectively. It is noted that the EWMA statistic Z t given in (1) becomes the classical Shewhart control chart at λ = 1 [46].
The time-varying control limits of the Z t chart are given as follows:
L C L t = μ 0 L z σ λ { 1 ( 1 λ ) 2 t } n ( 2 λ )     C L = μ 0 U C L t = μ 0 + L z σ λ { 1 ( 1 λ ) 2 t } n ( 2 λ ) }
where L z is the control limit coefficient that helps with fixing a pre-specified A R L 0 .

2.2. HWMA Chart

The plotting statistic H t of HWMA chart is defined as follows:
H t = ω y ¯ t + ( 1 ω ) y ¯ ¯ t 1   with   y ¯ ¯ 0 = μ 0
where ω (smoothing/sensitivity parameter with 0 < ω   1 ) is the weight assigned to the current sample, ( 1 ω ) is the weight homogeneously assigned to all past samples, and y ¯ ¯ t 1 is the mean of previous t 1 means, defined as: y ¯ ¯ t 1 = k = 1 t 1 y ¯ k t 1 .
The expression given in (3) can be written as follows:
    H t = ω y ¯ t + ( 1 ω ) k = 1 t 1 y ¯ k t 1 H t = ω y ¯ t + ( 1 ω ) [ y ¯ t 1 t 1 + y ¯ t 2 t 1 + + y ¯ 1 t 1 ] }
with mean and variance given as follows:
E ( H t ) = μ 0 V ( H t ) = ω 2 σ 2 n   ( if   t = 1 ) = σ 2 n ( ω 2 + ( 1 ω ) 2 ( t 1 ) ) ( if   t > 1 )
The control limits of H t chart are given as follows:
L C L t = ( μ 0 L H σ ω 2 n i f   t = 1 μ 0 L H σ ω 2 n + ( 1 ω ) 2 n ( t 1 ) i f   t > 1     C L = μ 0 U C L t = ( μ 0 + L H σ ω 2 n i f   t = 1 μ 0 + L H σ ω 2 n + ( 1 ω ) 2 n ( t 1 ) i f   t > 1 }
where L H is the control charting constant that fixes a pre-specified A R L 0 .
In the initial study on the HWMA chart, Abbas [25] focused on the zero state performance of the chart relative to other well-known memory EWMA control charts. A recent study by Knoth et al. [42] raised issues related to several memory-type control charts, e.g., the triple EWMA control chart by Alevizakos et al. [47] and the double progressive mean control charts by Alevizakos and Koukouvinos [48]. They also pointed out some concerns related to the HWMA chart that are mainly related to its steady state performance. The major concern states, “In steady-state HWMA always loses its performance and becomes impractical”. This concern is indeed not always true, and hence needs a further investigation. The two charts under discussion indeed have their own efficiency zones that need to be identified carefully, which is the main motivation of the current study. This study reinvestigates the performance of the HWMA chart under the zero and steady states and identifies the dominating zones for the HWMA chart over the EWMA chart specially in terms of steady state ARL.

3. Performance Evaluation

This section highlights the biased comparison of HWMA with the EWMA control chart by Knoth et al. [42]. For the said purpose, we considered several choices of delays in the shifts ( τ ) ranging between 0 at various shifts ( δ ) in the process parameters. Here, τ represents the number of IC samples before a shift has occurred in the process mean, i.e., τ = 0 refers to a zero-state shift. It is to be noted here [42] restricted their comparison between HWMA and EWMA charts to τ ( 0   ,   500 ) . By doing so, they concluded that the steady-state performance of HWMA chart is inferior to EWMA for smaller values of λ . In fact, the comparison of HWMA and EWMA in Section 3.2 of Knoth et al. [42] was tilted towards proving the deceitful inferiority of the HWMA control chart. For example, they started by comparing HWMA0.1 (HWMA control chart with λ = 0 .) with EWMA0.05 (EWMA control chart with λ = 0.05 ) for the zone of smaller shifts, just for the sake of establishing the superiority of EWMA in that particular zone. Then, for the zone of moderate shifts, they compared HWMA0.1 with EWMA0.1. Finally, for the zone of large shifts, where HWMA0.1 performed better than both EWMA0.05 and EWMA0.1, they gave the argument that HWMA should be compared with the Shewhart control chart for this zone. The sole justification for all of this seemed to deprive HWMA structure from its natural ability to outperform EWMA for some specific zones of shifts. Among the weighted moving average control charts, we believe that there is no single structure that can outperform all of the structures for all of the shift zones. Every control chart has its own superiority zone(s) and the same holds true for the HWMA chart.
To be fair, with both the EWMA and HWMA control charts, they should be compared with same values of smoothing parameters λ , i.e., where both charts are giving λ weight to the current sample and the remaining 1 λ weight is distributed to all of the previous samples. Here, EWMA and HWMA are different in how they distribute this ( 1 λ ) to previous samples. Having said this, we have calculated conditional expected delay (CED) [49] for zero and steady states at varying τ for different combinations of λ and δ . In doing so, we designed a Monte Carlo simulation study with 10 5 iterations in R software, which is briefly described in Figure 1. We fixed A R L 0 = 500 and derived the control limits coefficients L Z and L H given in (2) and (5) of the EWMA and HWMA charts, respectively (cf. Table 1). For the said A R L 0 , we calculated CED ( D τ ) for τ = 0 ,   1 ,   2 ,   for the HWMA and EWMA charts, by considering δ = 0.125, 0.250, 0.375, 0.50, 0.75, 1.00, 1.50, 2.00, 3.00, 4.00, 5.00, and 6.00 and λ (or ω denoted by Abbas 2018) = 0.03, 0.05, 0.10, 0.25, and 0.50. The resulting values of D τ were plotted against each value of τ in the form of CED curves at different values of λ and δ . Some selective graphical displays are provided in the form of figures (cf. Figure 2, Figure 3, Figure 4, Figure 5, Figure 6, Figure 7, Figure 8, Figure 9, Figure 10 and Figure 11).
For a small value of λ , i.e., 0.03 , it can be seen from Figure 2 and Figure 3 that the ARL of the HWMA0.03 chart takes some time to reach its steady state. These figures clearly indicate that before reaching its steady state, the CED curve of HWMA0.03 surpasses the respective EWMA0.03 curve, and then remains superior for the remaining region of τ . This is true for all δ ( 0.125   ,   6 ) . In most cases, this steady state was reached after τ = 500 , which has not been covered in most of the recent studies on HWMA, resulting in a misleading conclusion that EWMA is better than HWMA in terms of steady state ARL values.
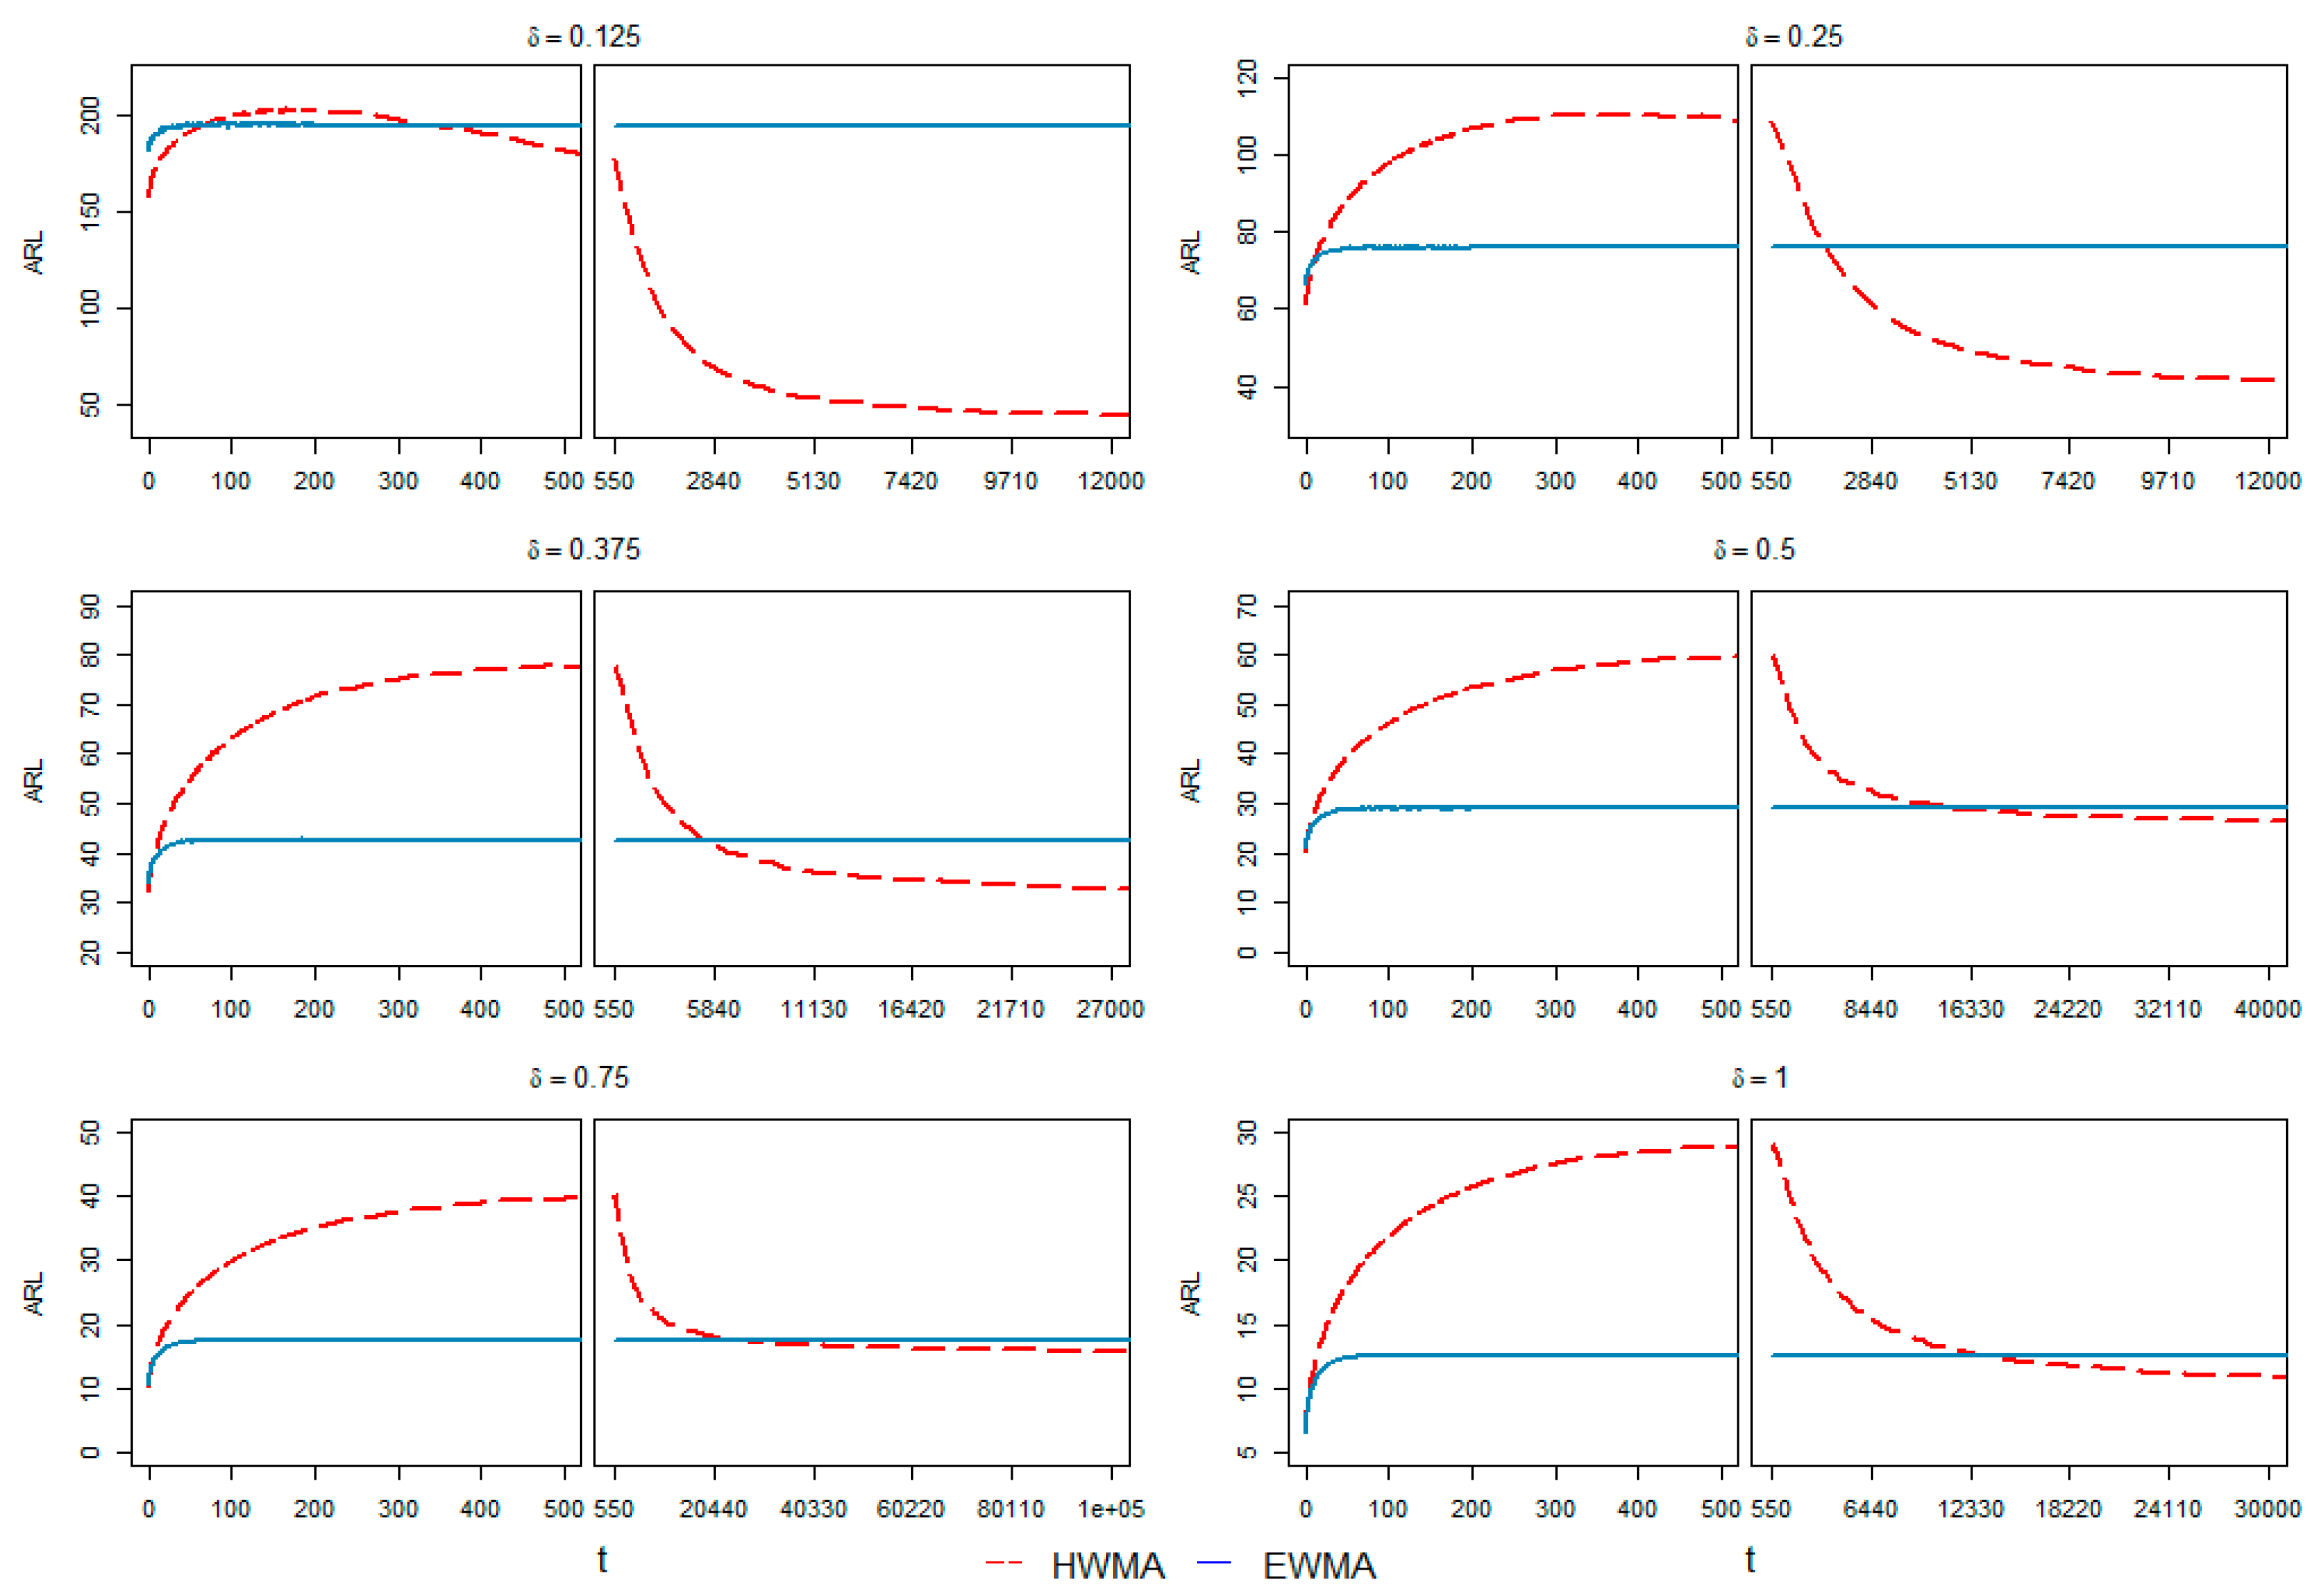
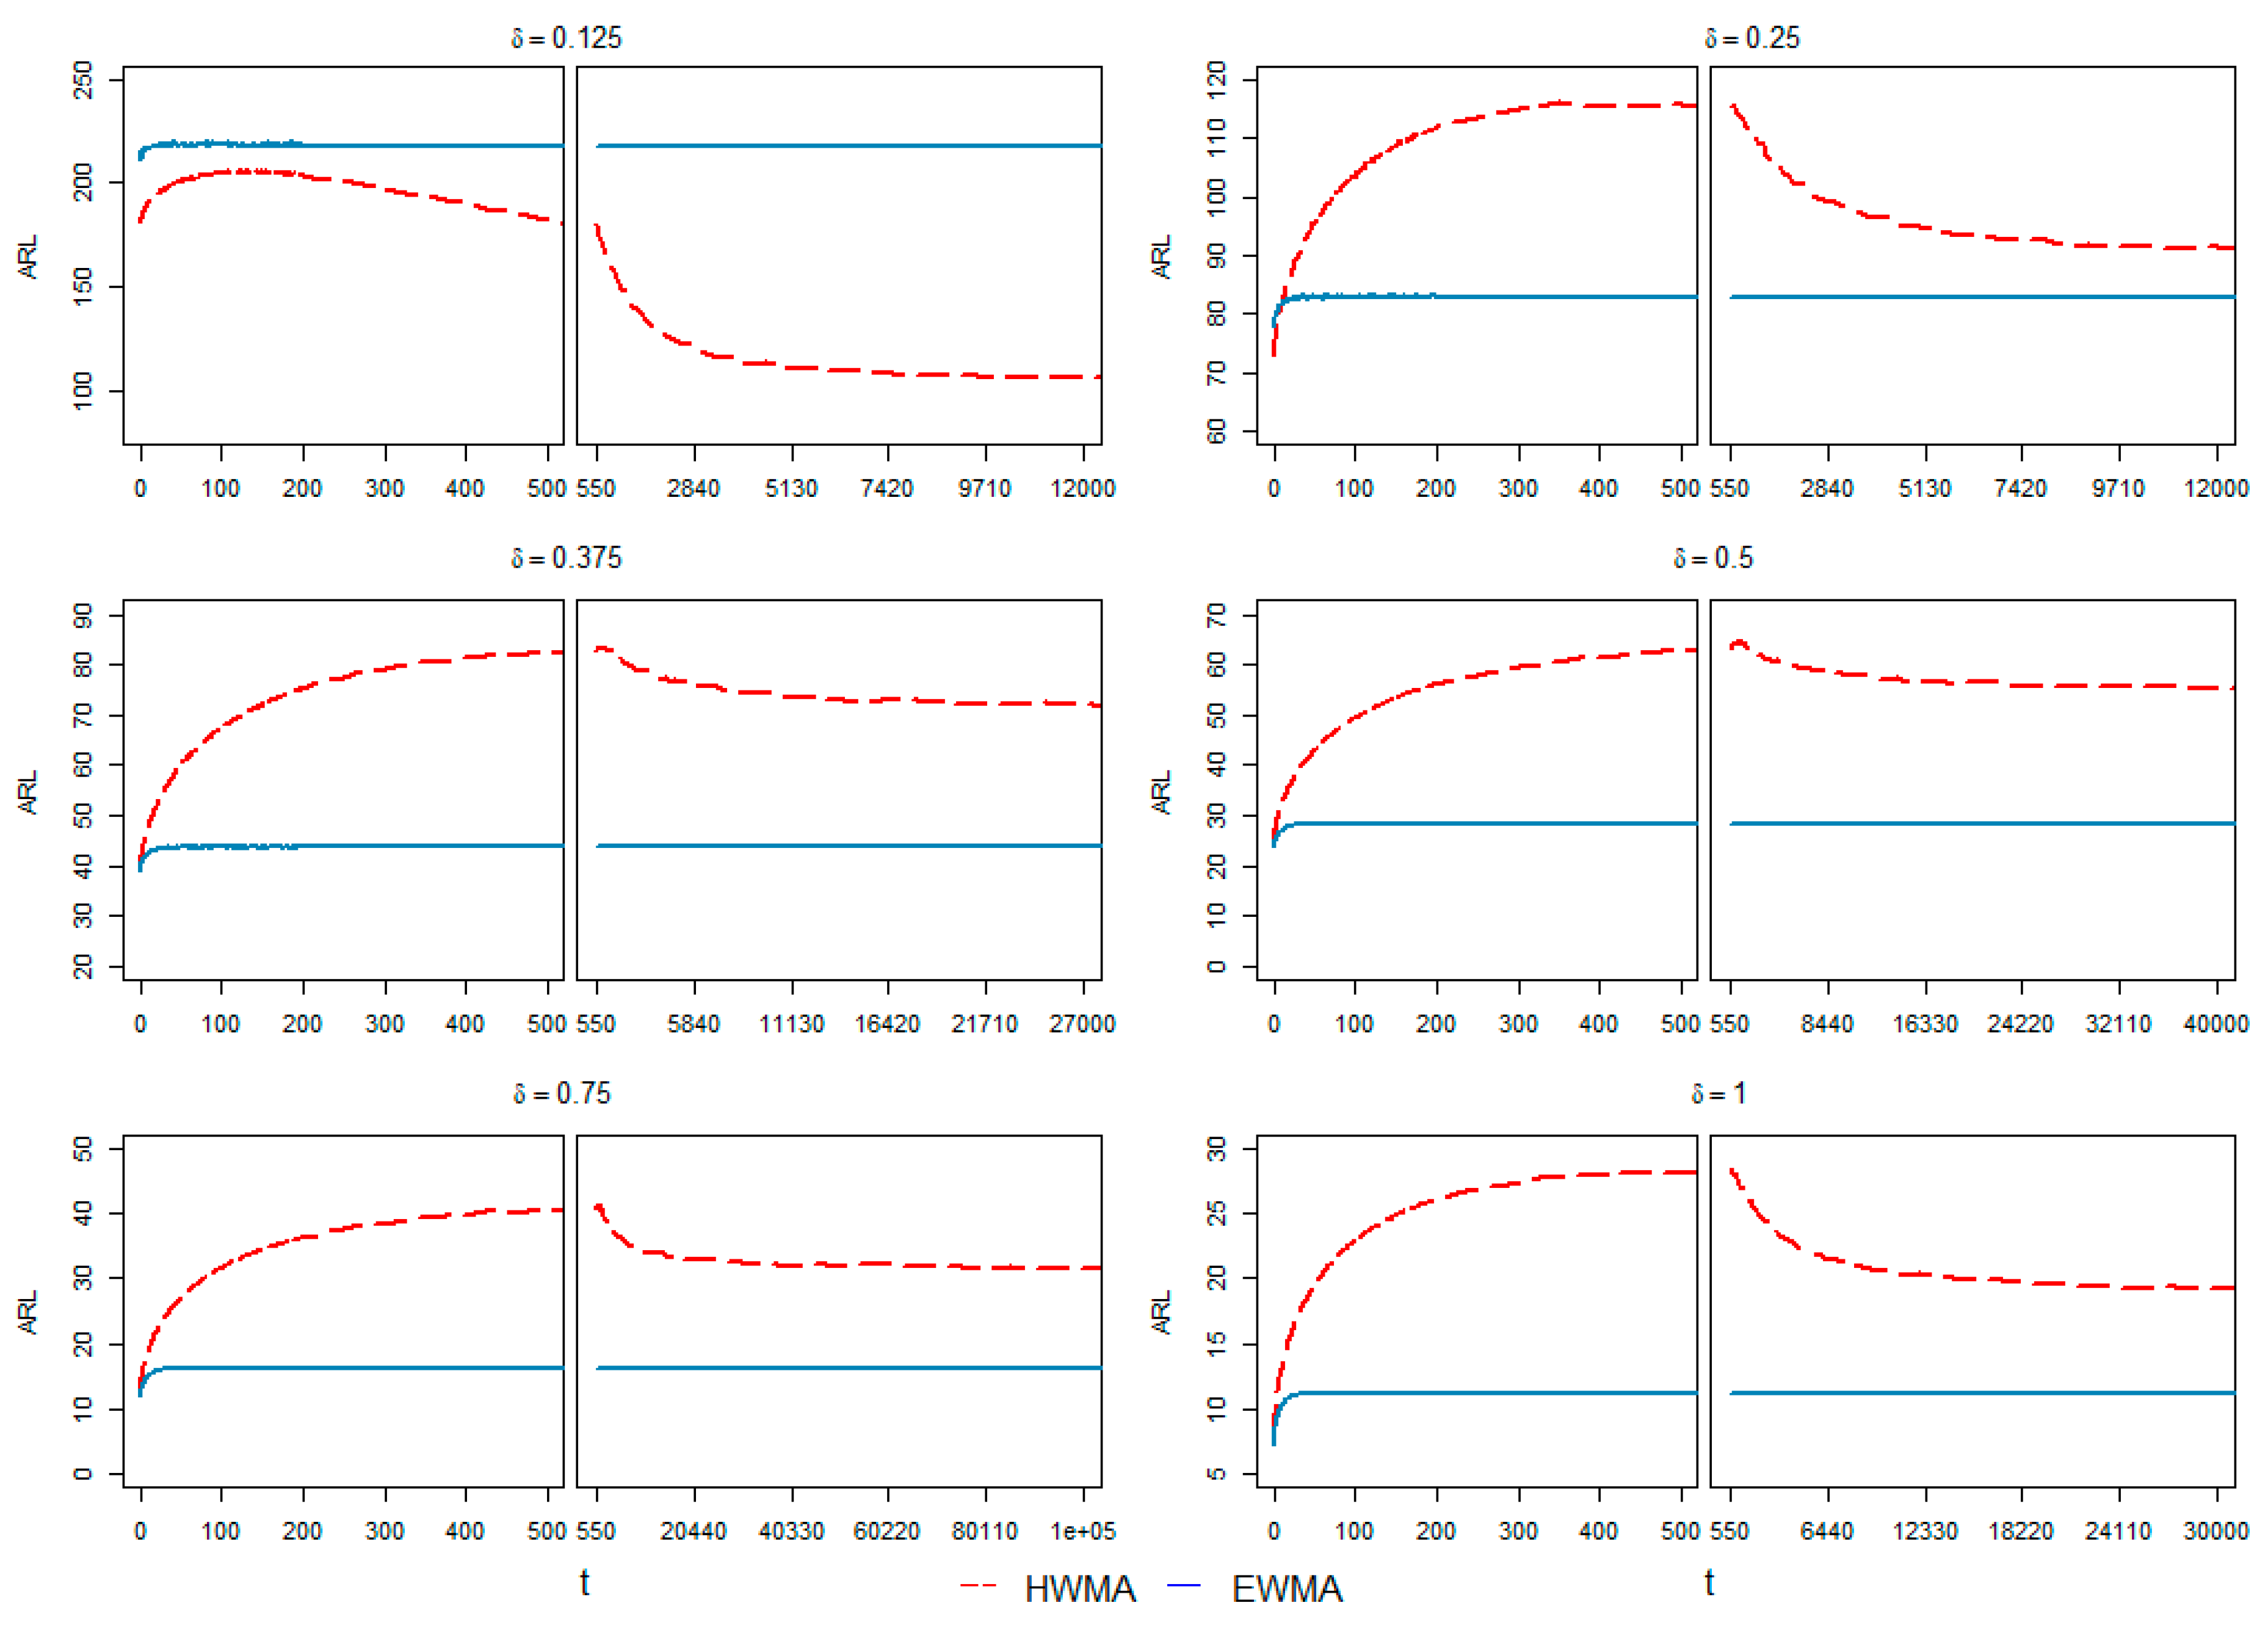
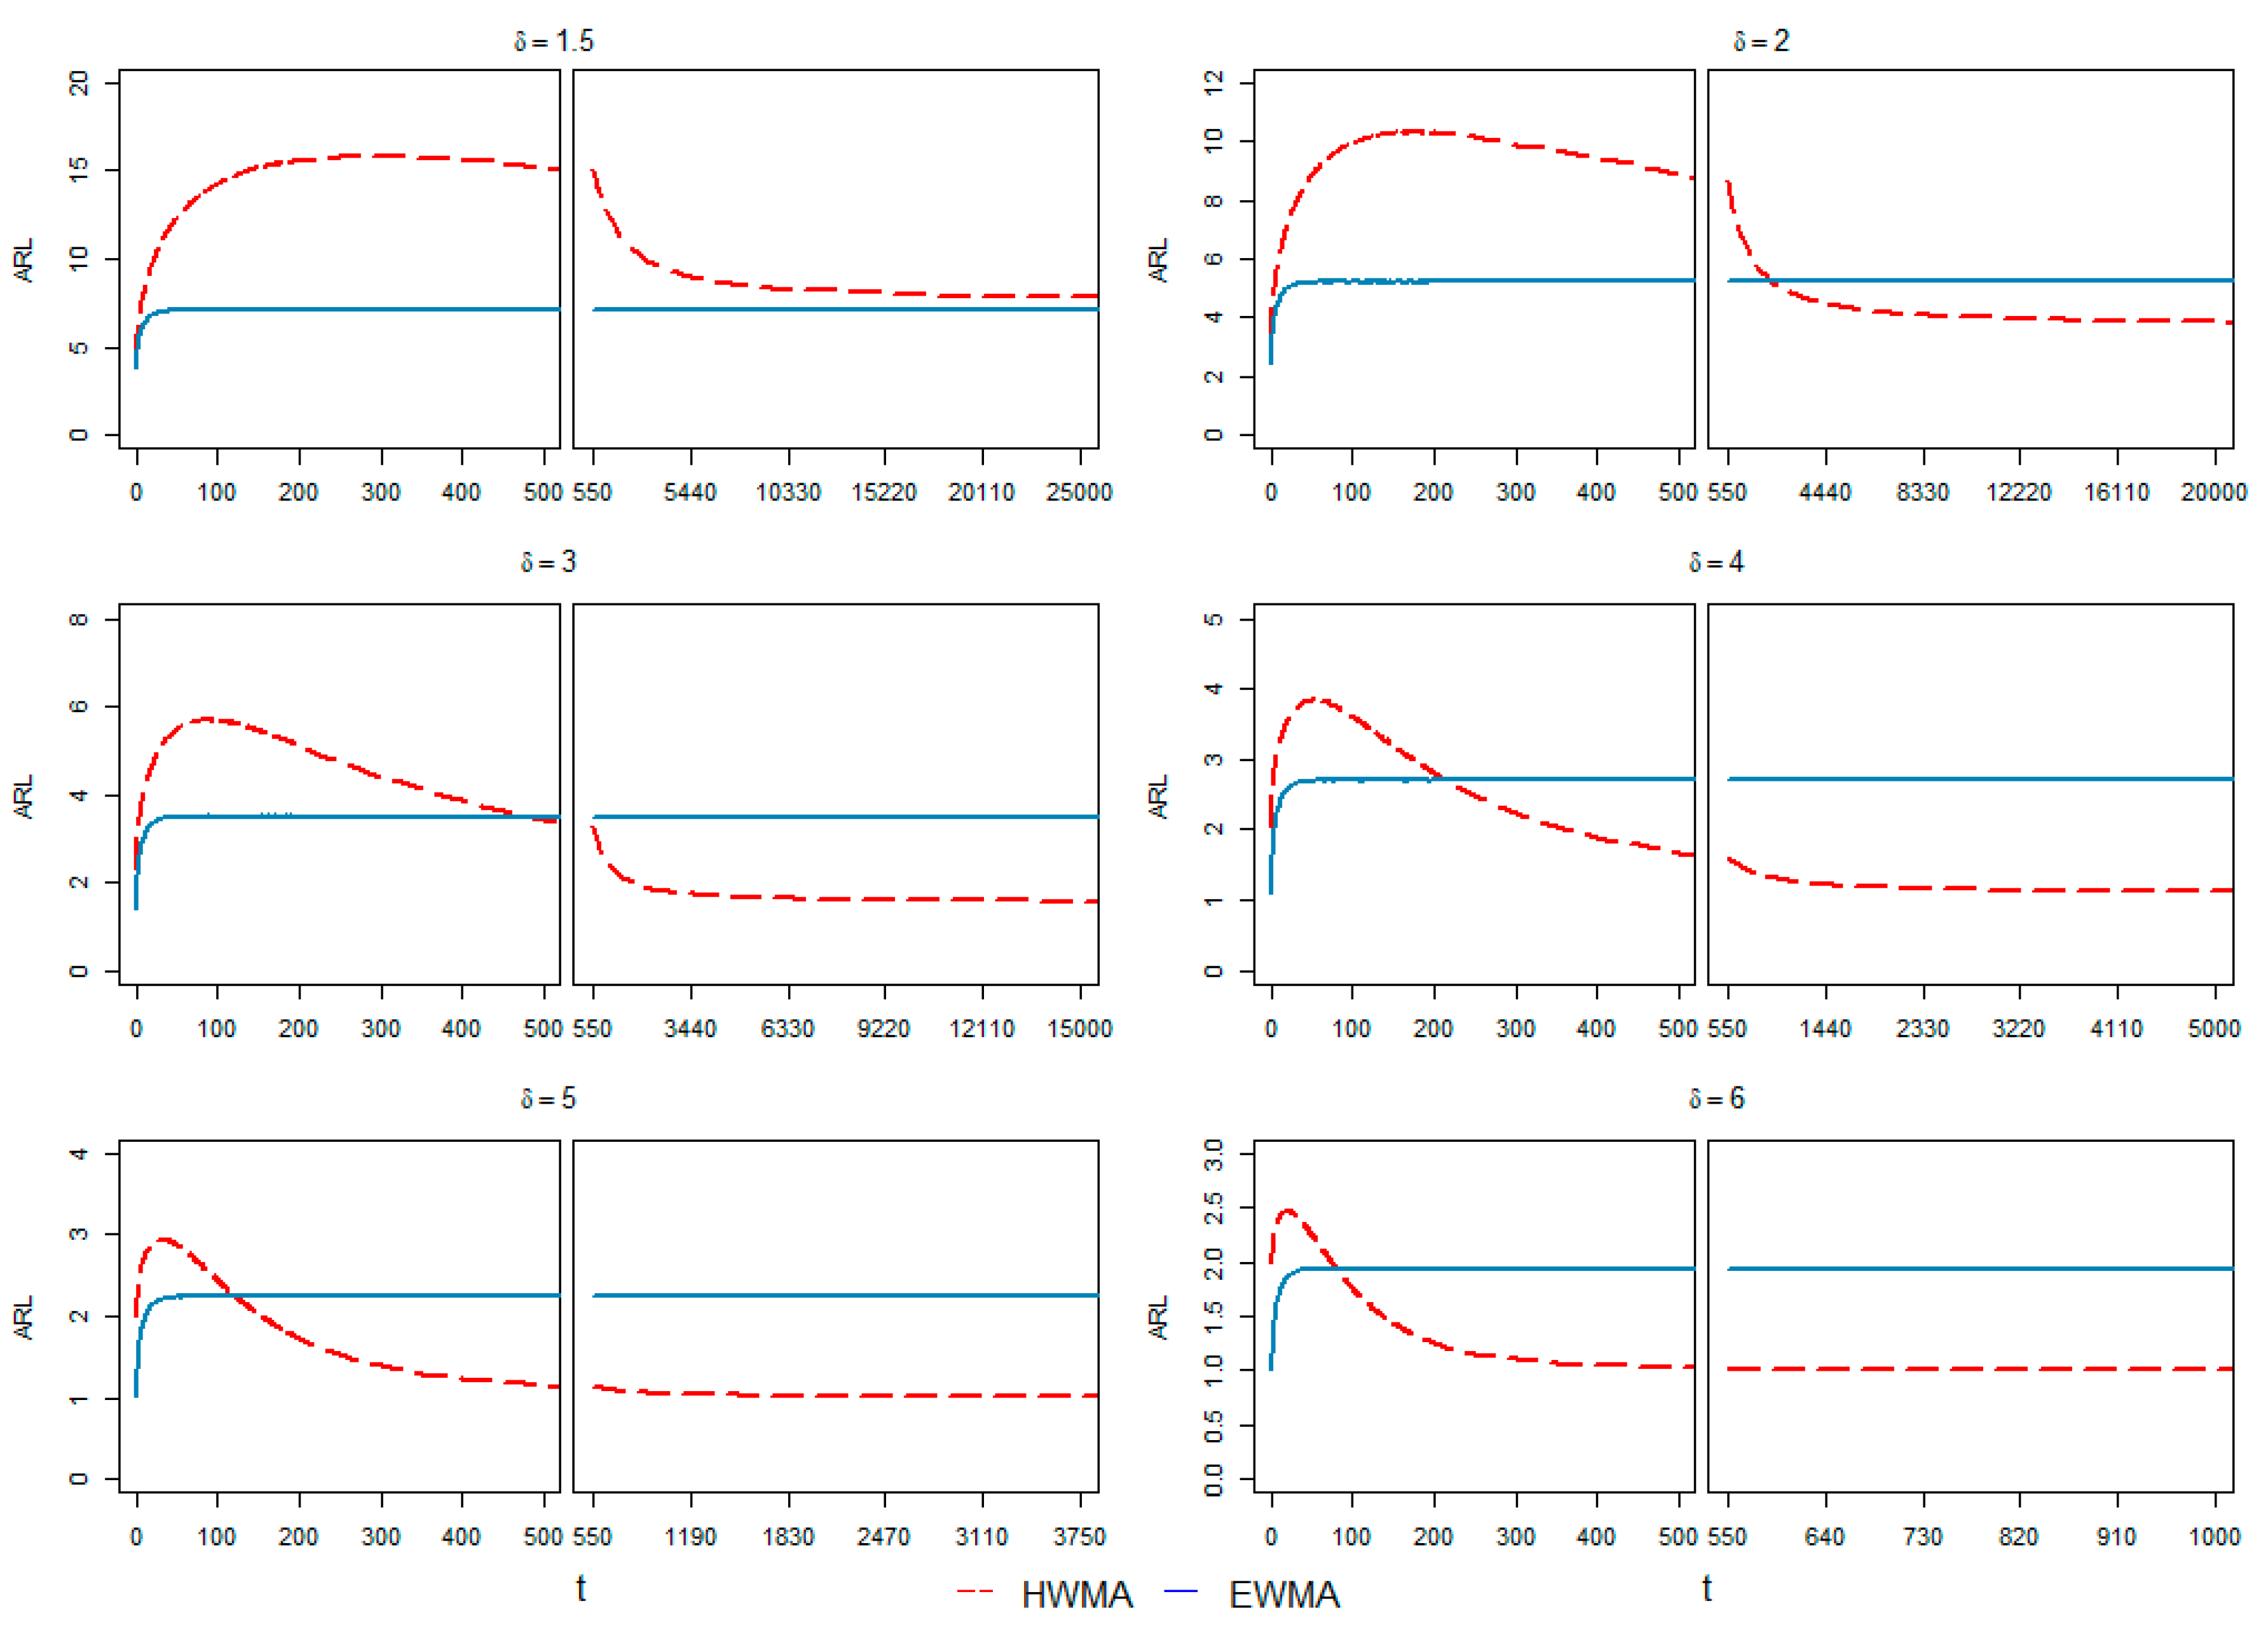
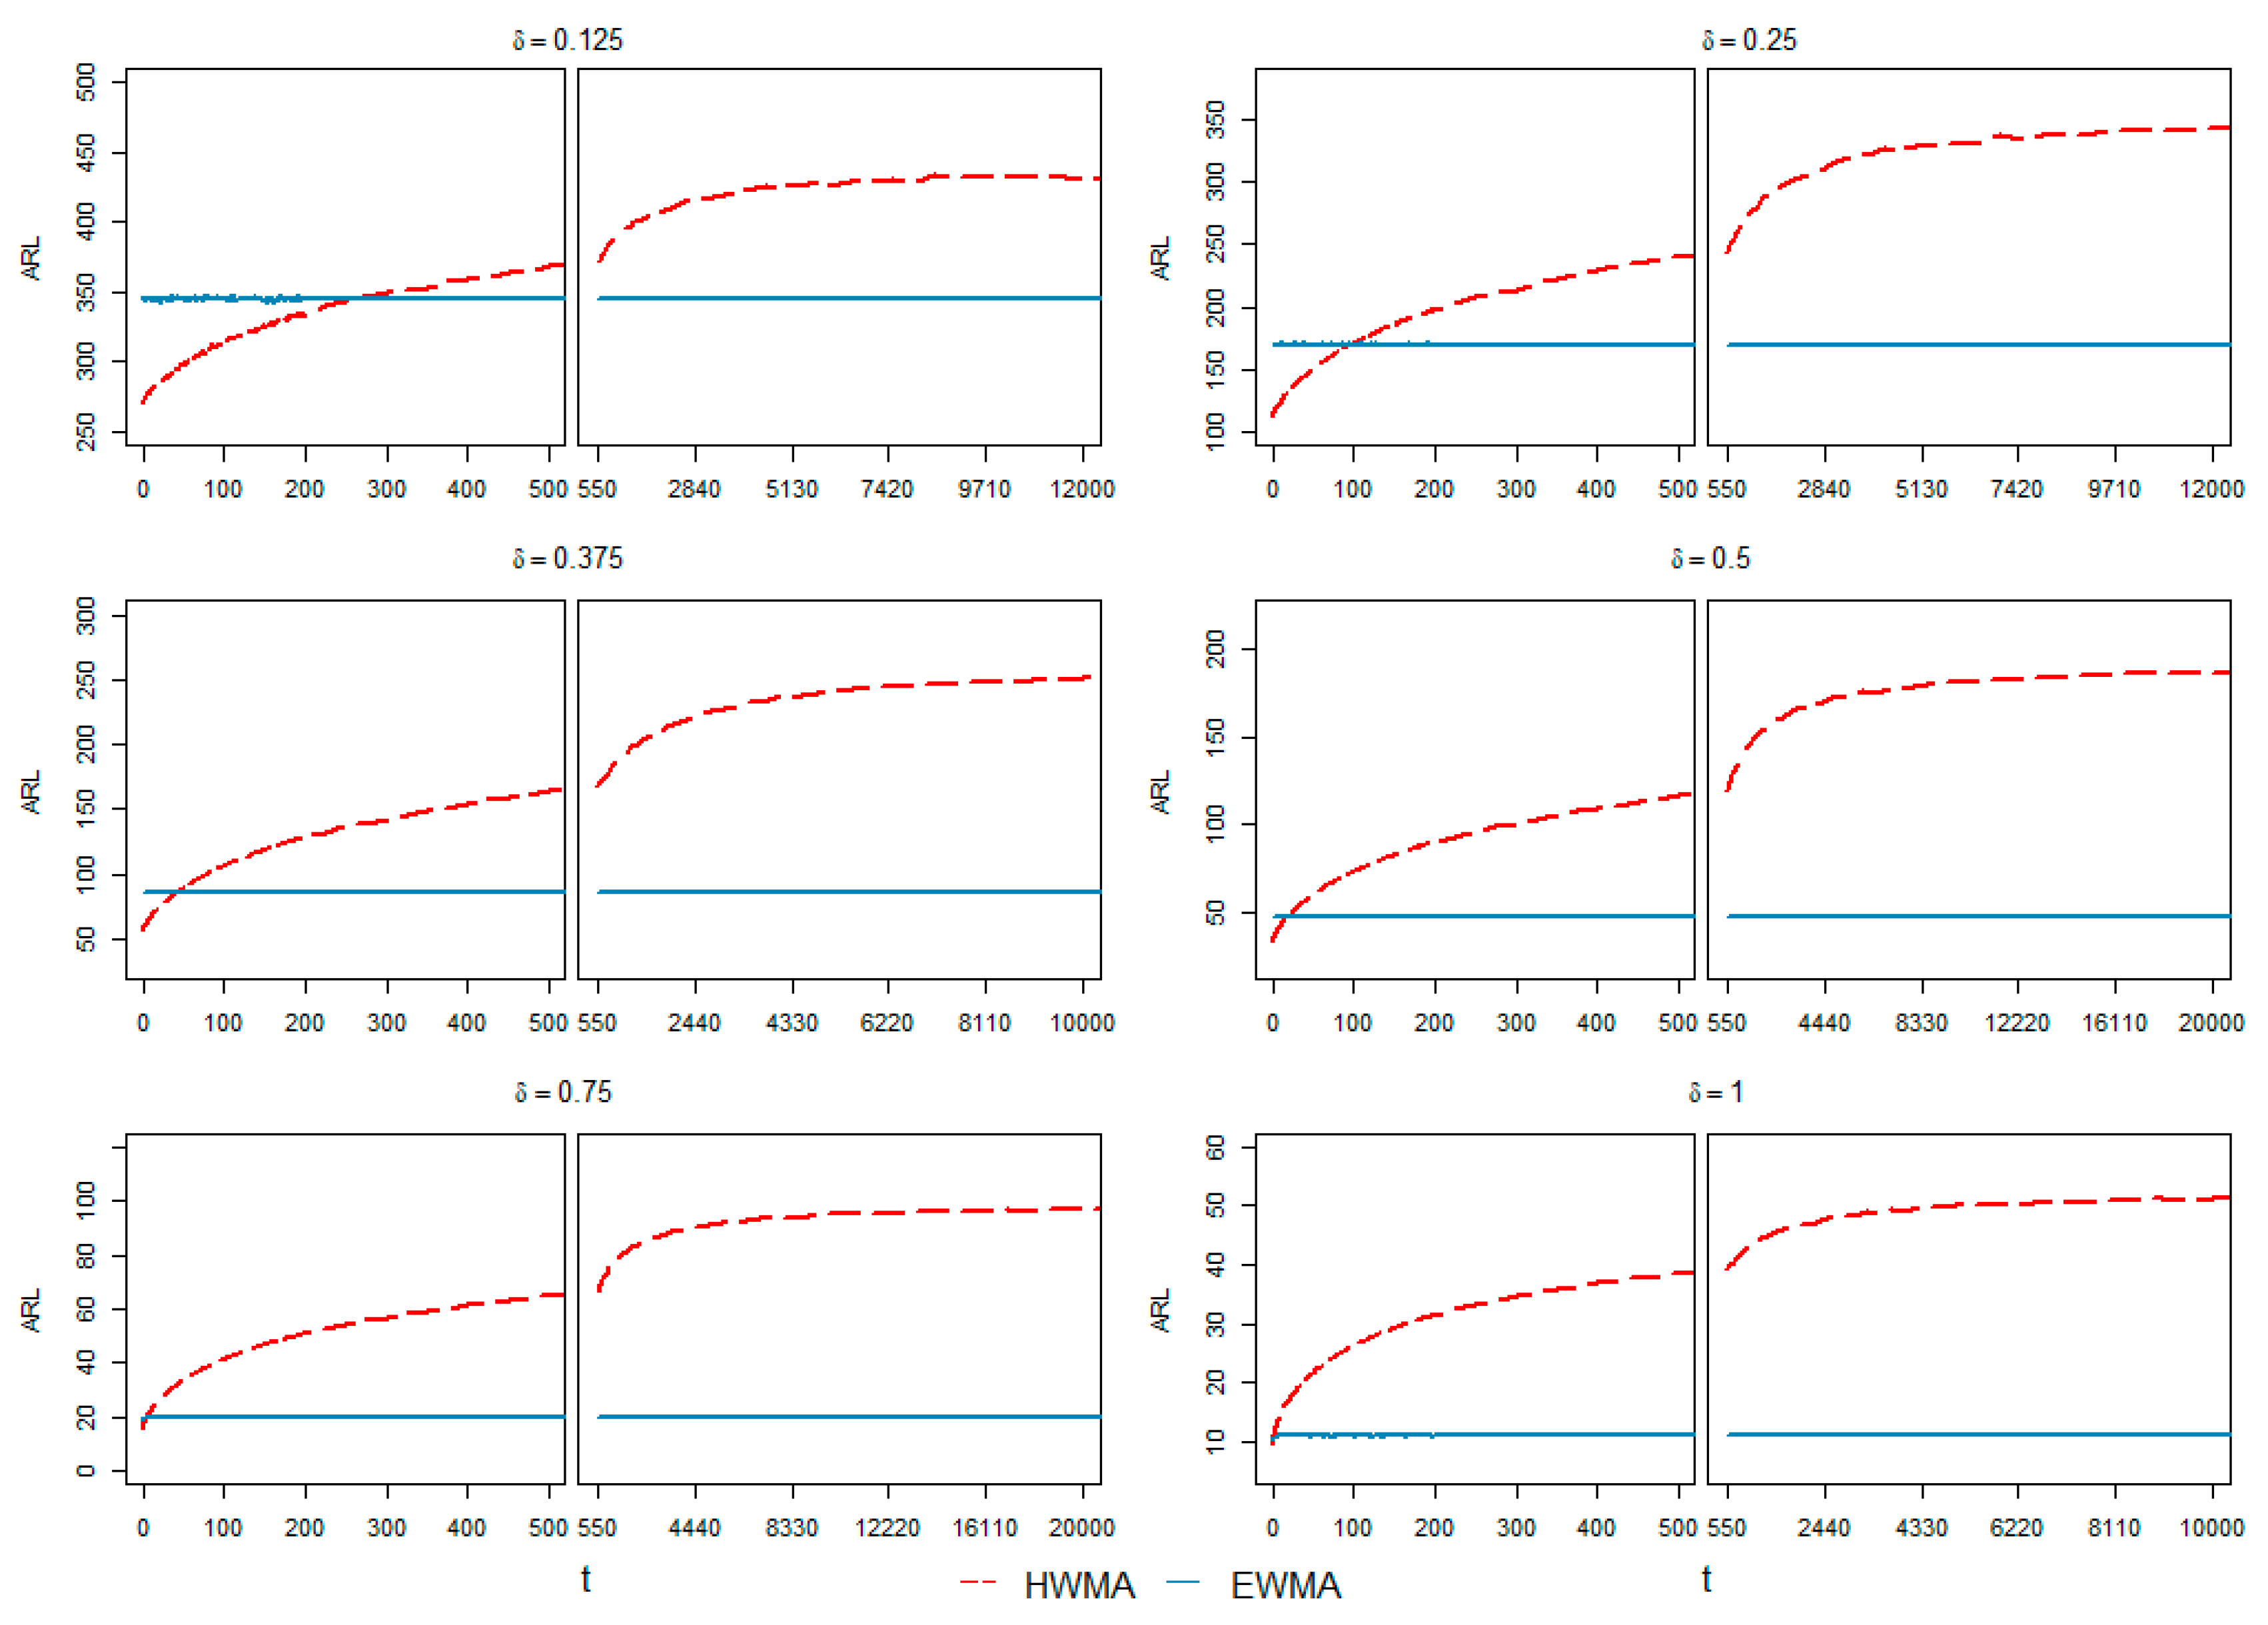
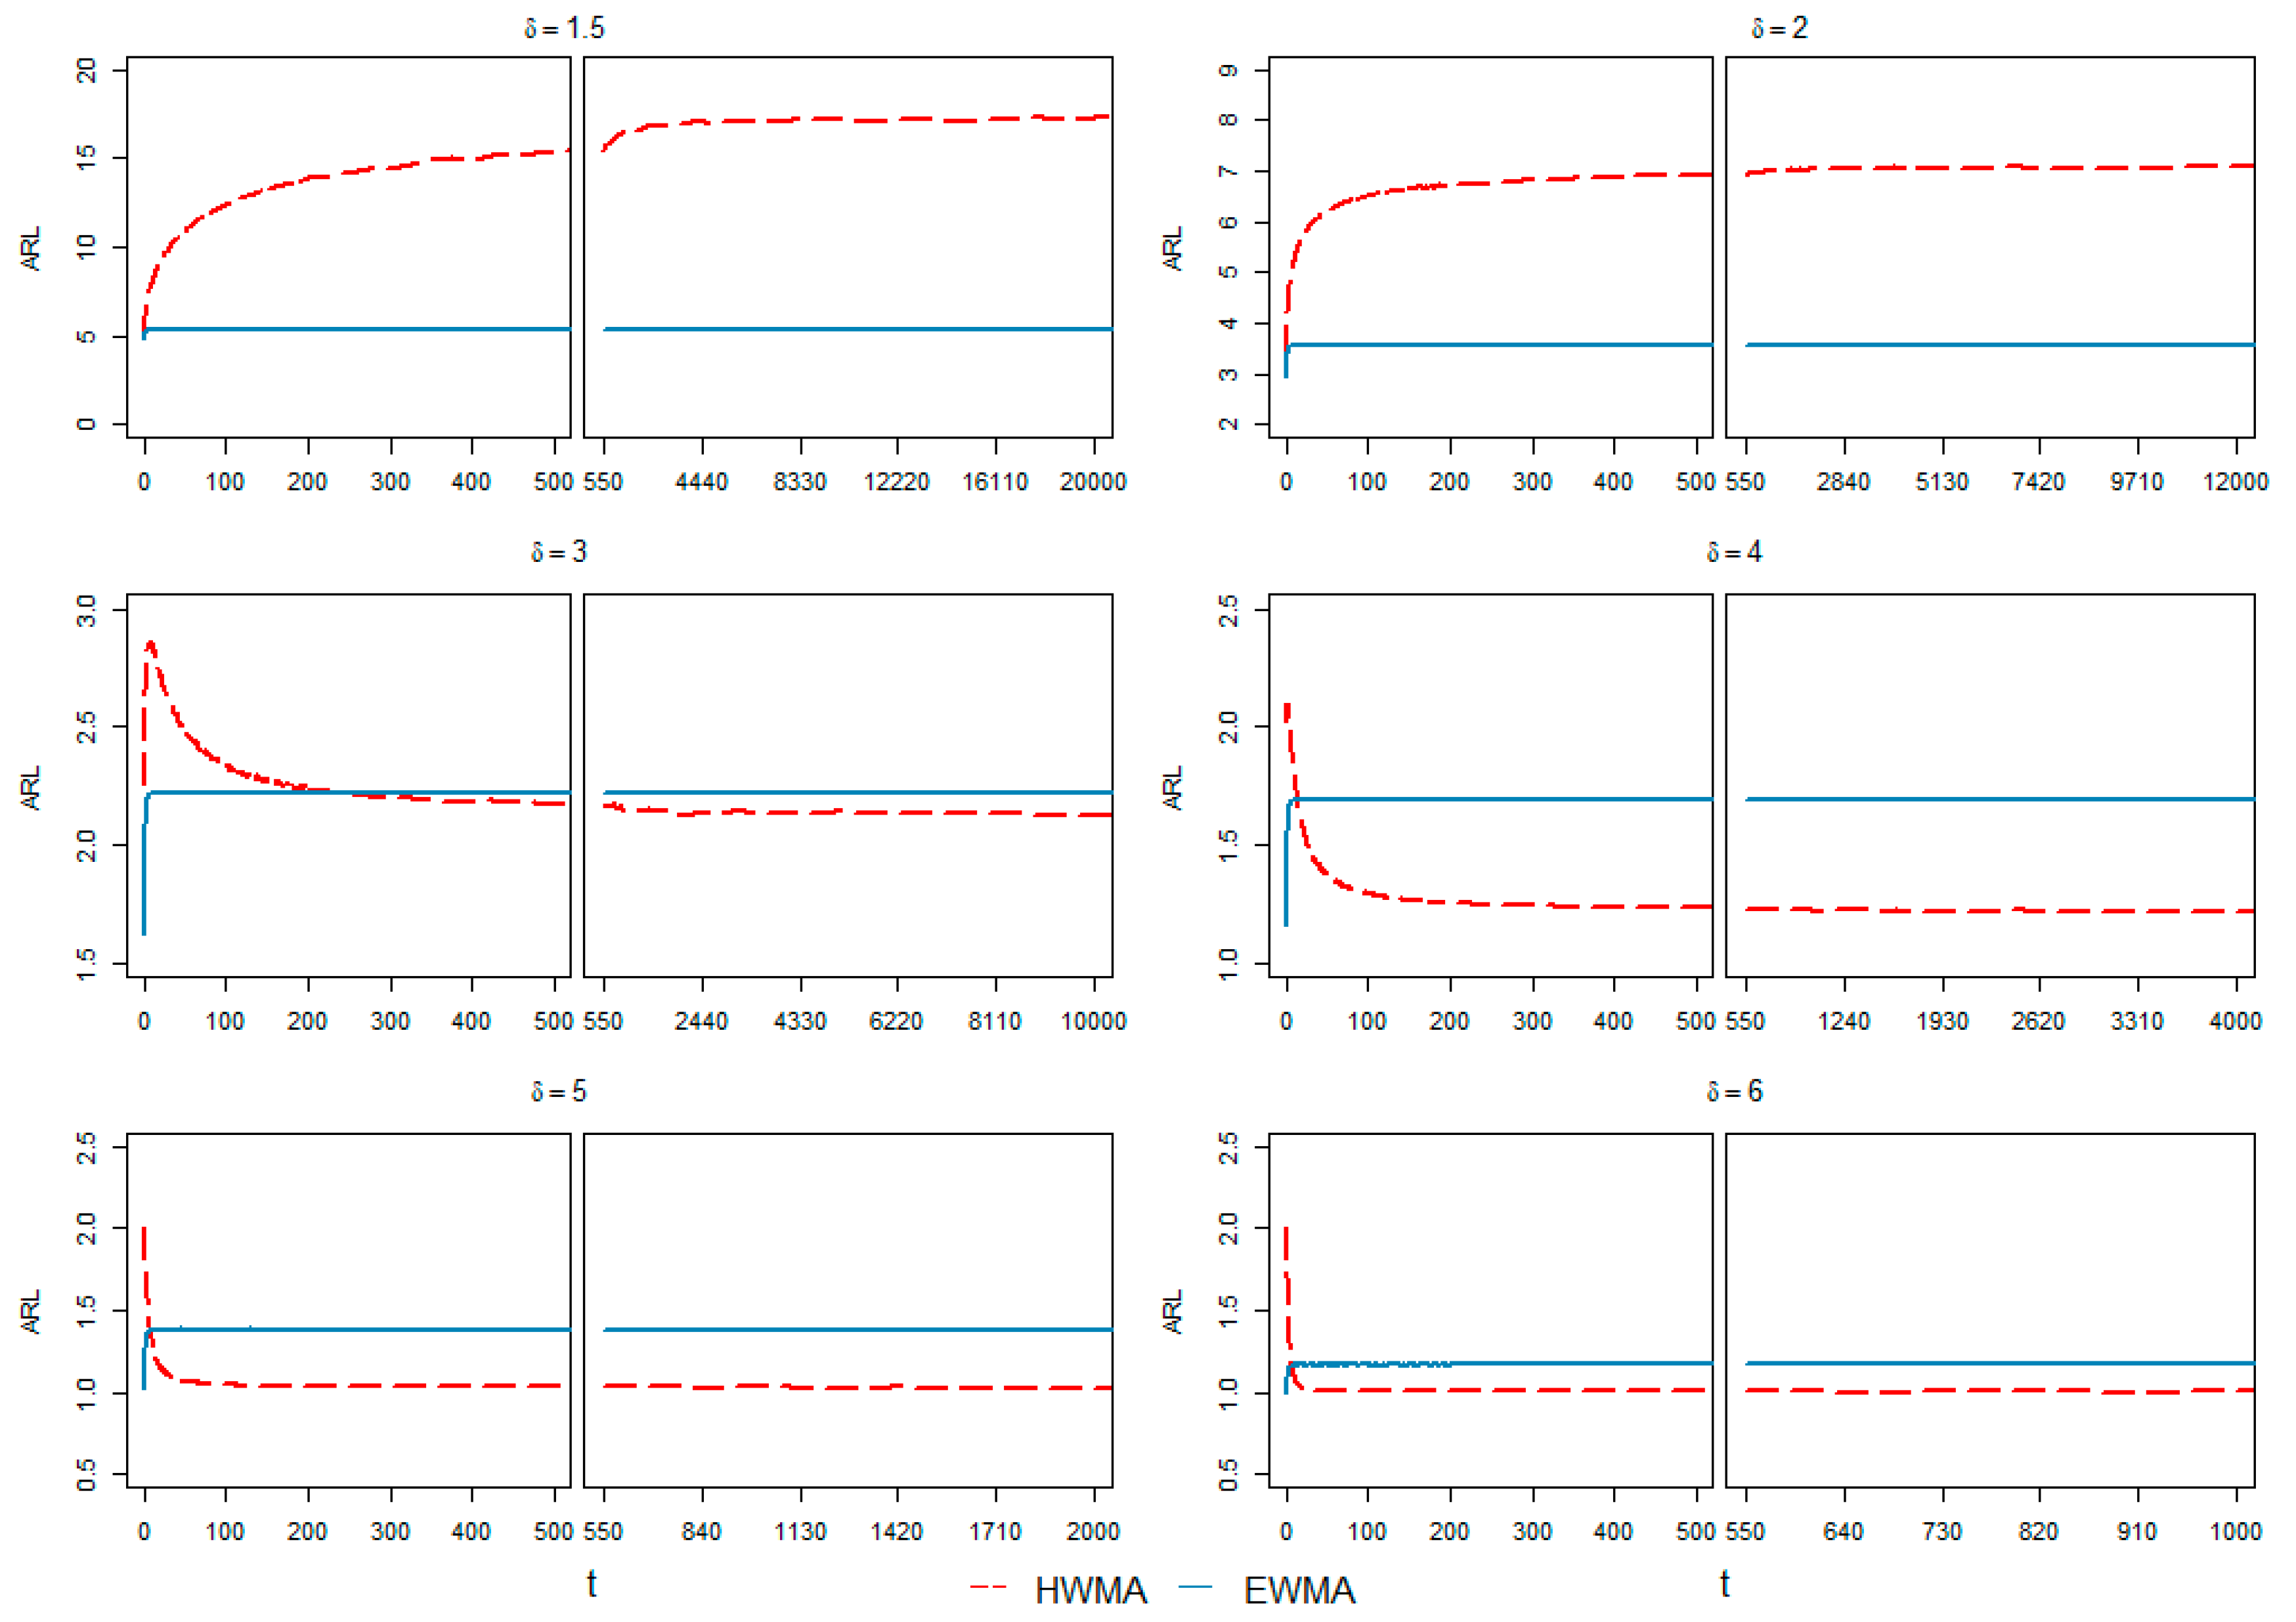
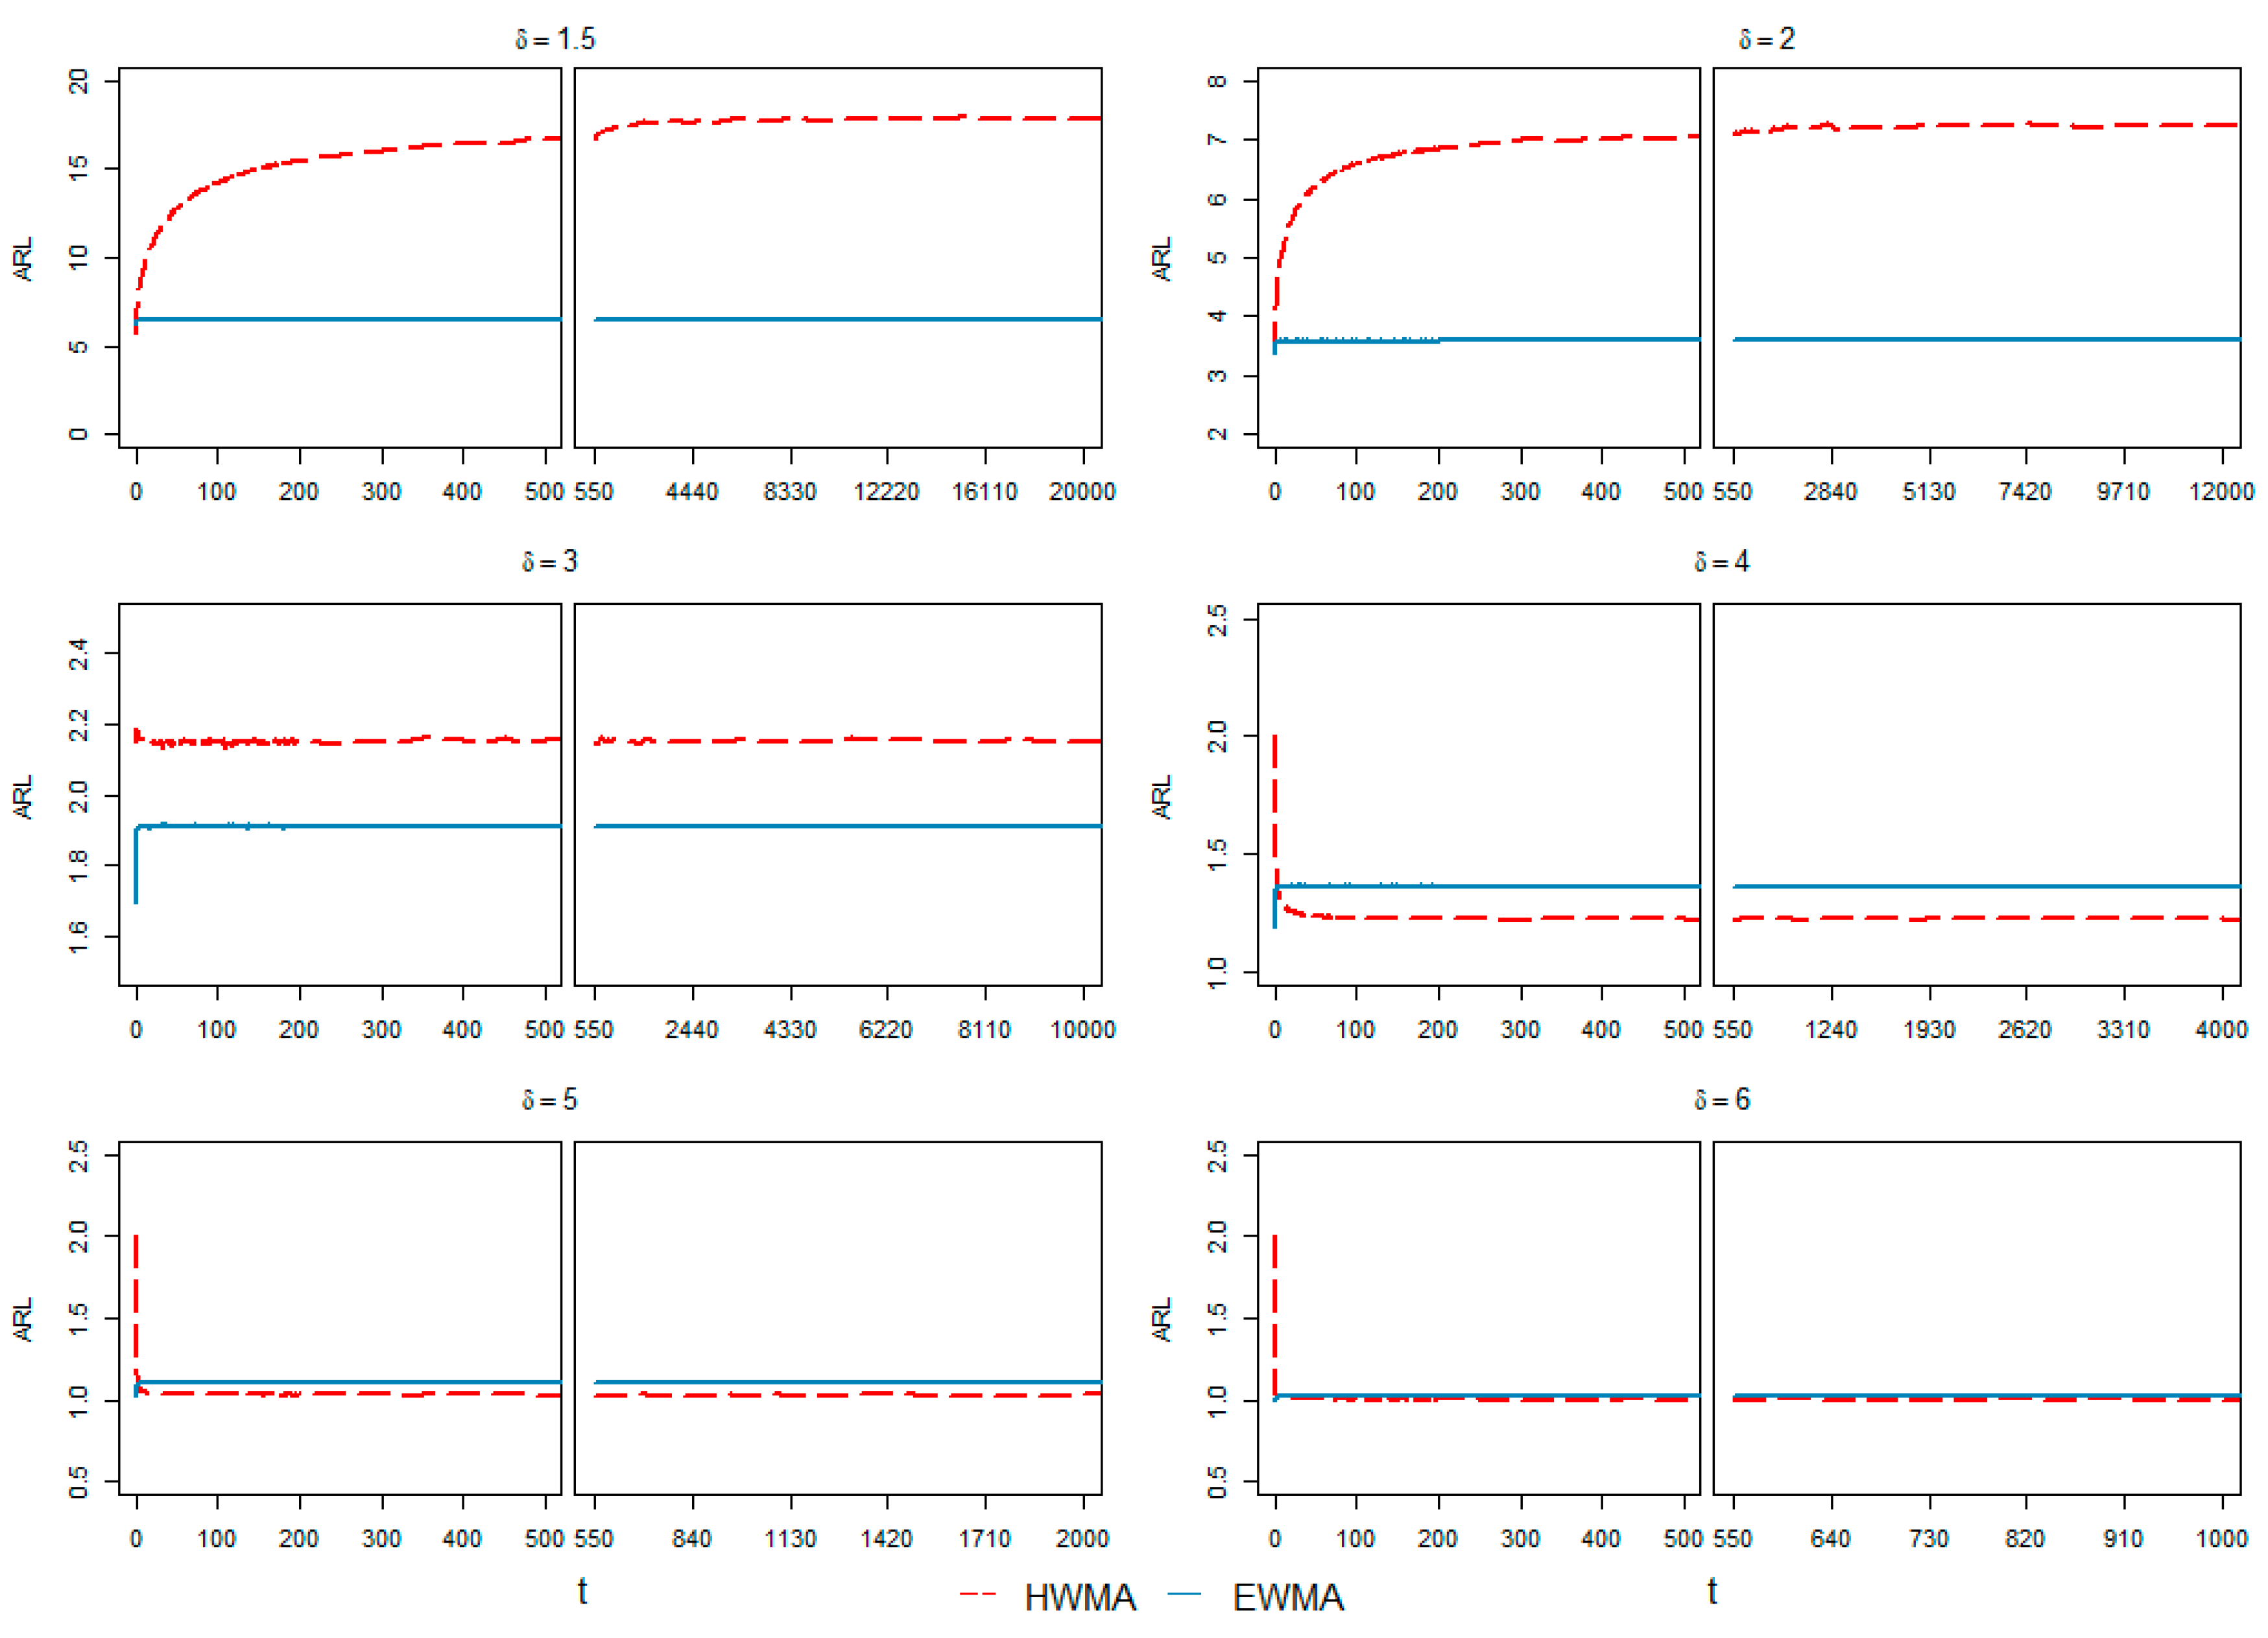
  • HWMA0.1 chart is better than EWMA0.1 for δ > 2 , whereas for δ 2 EWMA0.1 is proven to be superior.
  • HWMA0.25 chart is better than EWMA0.25 for δ > 2 , whereas for δ 2 EWMA0.25 is proven to be superior.
  • HWMA0.5 chart is better than EWMA0.5 for δ > 3 , whereas for δ 3 EWMA0.5 is proven to be superior.
Another important point relates to the weighting scheme associated with the HWMA statistic given in Equation (4). It is true that for a specific t , the weights given to each of the previous samples are equal. However, in the future with increasing values of t , the weights decrease as the observation becomes older. Mathematically, the weight given to a specific (say j t h ) sample in the calculation of any future (say t t h ) plotting statistic is denoted by f j ( t ) , and it is derived as follows:
H t = ω y ¯ t + ( 1 ω ) [ y ¯ t 1 t 1 + y ¯ t 2 t 1 + + y ¯ j t 1 + + y ¯ 1 t 1 ]
H t = ω y ¯ t + 1 ω t 1 y ¯ t 1 + 1 ω t 1 y ¯ t 2 + + 1 ω t 1 y ¯ j + + 1 ω t 1 y ¯ 1
H t = ω y ¯ t + 1 ω t 1 y ¯ t 1 + 1 ω t 1 y ¯ t 2 + + f j ( t ) y ¯ j + + 1 ω t 1 y ¯ 1
where f j ( t ) = ( 1 ω t 1 ) , and it can clearly be seen that f j ( t ) is inversely proportional to t , e.g., with HWMA0.1 at t = 21 , the first observation is has a weight of 1 0.1 21 1 = 0.045 , while at t = 26 , the same first observation weighs 0.036, and at t = 31 it weighs 0.03.
To explain this point further, the weighting curves of some selective sample numbers in the HWMA statistic are given in Figure 12.
Figure 12a contains the weight given to first sample in the calculation of the HWMA statistic ( H t )   t = 2 , 3 , , 25 . It can be seen further into the future, the weight given to the first sample decreases. Moreover, the weight decreases quickly and is closer to zero for larger values of λ . This decreasing pattern does not stop at t = 25 , which can be confirmed from Figure 12b, which contains the weight given to first sample in the calculation of the HWMA statistic ( H t )   t = 102 , 103 , , 200 . Similar weighting curves were made for the 20th sample in Figure 12c,d and 50th sample in Figure 12e,f, also proving that the weights decreased as the observation aged.

4. Summary and Conclusions

The HWMA control charting approach is used for efficient monitoring of small shifts in process parameter(s). Recently, Knoth et al. [42] highlighted a few issues regarding the HWMA chart by saying “HWMA chart loses its performance as compared to EWMA chart in steady-state”. In order to address these concerns, this study revisits the performance of the HWMA chart under zero and steady states for various shifts and smoothing parameters. A comprehensive comparative analysis of the run-length profiles is carried out among the two charts for several values of the design parameters. The results revealed that the HWMA chart is superior to the EWMA chart under a zero state for several regions of shifts, and is capable of retaining its superiority over EWMA under various delays in process shifts. More specifically, the steady-state performance of every moving average control chart depends on the choice of the design parameter. This study has identified the dominance cut-offs for HWMA and EWMA. We noticed that both EWMA and HWMA have their respective superiority regions depending on the choices of λ , δ , and τ . Moreover, the current study is limited to comparing the performance of EWMA and HWMA in terms of ARL values when the process experiences a shift, i.e., a sudden step-change in the process parameter(s). A similar comparison needs to be done when the process parameter(s) experiences a drift or a short momentary shift.

Author Contributions

Conceptualization, M.R. and N.A.; methodology, M.R., S.A. and N.A.; software, N.A. and T.M.; validation, N.A., T.M., S.A. and M.R.; formal analysis, T.M.; writing—original draft preparation, S.A., N.A., T.M. and M.R.; writing—review and editing, S.A., N.A., T.M. and M.R.; visualization, T.M.; supervision, M.R. and N.A.; funding acquisition, T.M. All authors have read and agreed to the published version of the manuscript.

Funding

This research is based upon work supported by King Fahd University of Petroleum and Minerals, and the author Tahir Mahmood at KFUPM acknowledge the support received under Grant no. SR211006.

Data Availability Statement

Data sharing not applicable to this article as no datasets were generated or analyzed during the current study.

Acknowledgments

We are very grateful to the reviewers for their comments and suggestions to improve the manuscript. Moreover, we are thankful to King Fahd University of Petroleum and Minerals for providing us with research facilities for conducting this research.

Conflicts of Interest

The authors declare no conflict of interest.

References

  1. Aslam, M.; Rao, G.S.; AL-Marshadi, A.H.; Ahmad, L.; Jun, C.-H. Control charts for monitoring process capability index using median absolute deviation for some popular distributions. Processes 2019, 7, 287. [Google Scholar] [CrossRef] [Green Version]
  2. Fan, S.-K.S.; Jen, C.-H.; Lee, J.-X. Profile monitoring for autocorrelated reflow processes with small samples. Processes 2019, 7, 104. [Google Scholar] [CrossRef] [Green Version]
  3. Roberts, S.W. Control Chart Tests Based on Geometric Moving Averages. Technometrics 1959, 1, 239–250. [Google Scholar] [CrossRef]
  4. Sweet, A.L. Control Charts Using Coupled Exponentially Weighted Moving Averages. IIE Trans. 1986, 18, 26–33. [Google Scholar] [CrossRef]
  5. Lucas, J.M.; Saccucci, M.S. Exponentially weighted moving average control schemes: Properties and enhancements. Technometrics 1990, 32, 1–12. [Google Scholar] [CrossRef]
  6. Hamilton, M.D.; Crowder, S.V. Average Run Lengths of EWMA Control Charts for Monitoring a Process Standard Deviation. J. Qual. Technol. 1992, 24, 44–50. [Google Scholar] [CrossRef]
  7. Gan, F.F. Joint Monitoring of Process Mean and Variance Using Exponentially Weighted Moving Average Control Charts. Technometrics 1995, 37, 446–453. [Google Scholar] [CrossRef]
  8. Acosta-Mejia, C.A.; Pignatiello, J.J.; Venkateshwara, R.B. A comparison of control charting procedures for monitoring process dispersion. IIE Trans. 1999, 31, 569–579. [Google Scholar] [CrossRef]
  9. Steiner, S. EWMA Control Charts with Time-Varying Control Limits and Fast Initial Response. J. Qual. Technol. 1999, 31, 75–86. [Google Scholar] [CrossRef]
  10. Reynolds, J.M.R.; Arnold, J.C. EWMA control charts with variable sample sizes and variable sampling intervals. IIE Trans. 2001, 33, 511–530. [Google Scholar] [CrossRef]
  11. Lee, S.H.; Park, J.H.; Jun, C.H. An exponentially weighted moving average chart controlling false discovery rate. J. Stat. Comput. Simul. 2014, 84, 1830–1840. [Google Scholar] [CrossRef]
  12. Abbas, N.; Riaz, M.; Does, R.J.M.M. Enhancing the performance of EWMA charts. Qual. Reliab. Eng. Int. 2011, 27, 821–833. [Google Scholar] [CrossRef] [Green Version]
  13. Patel, A.K.; Divecha, J. Modified exponentially weighted moving average (EWMA) control chart for an analytical process data. J. Chem. Eng. Mater. Sci. 2011, 2, 12–20. [Google Scholar]
  14. Abbas, N.; Riaz, M.; Does, R.J.M.M. An EWMA-type control chart for monitoring the process mean using auxiliary information. Commun. Stat.-Theory Methods 2014, 43, 3485–3498. [Google Scholar] [CrossRef] [Green Version]
  15. Abbasi, S.A.; Riaz, M.; Miller, A.; Ahmad, S.; Nazir, H.Z. EWMA Dispersion Control Charts for Normal and Non-normal Processes. Qual. Reliab. Eng. Int. 2015, 31, 1691–1709. [Google Scholar] [CrossRef]
  16. Lee, H.; Aslam, M.; Shakeel, Q.; Lee, W.; Jun, C.H. A control chart using an auxiliary variable and repetitive sampling for monitoring process mean. J. Stat. Comput. Simul. 2015, 85, 3289–3296. [Google Scholar] [CrossRef]
  17. Khan, N.; Aslam, M.; Jun, C.H. Design of a Control Chart Using a Modified EWMA Statistic. Qual. Reliab. Eng. Int. 2017, 33, 1095–1104. [Google Scholar] [CrossRef]
  18. Herdiani, E.T.; Fandrilla, G.; Sunusi, N. Modified Exponential Weighted Moving Average (EWMA) Control Chart on Autocorrelation Data. J. Phys. Conf. Ser. 2018, 979, 012097. [Google Scholar] [CrossRef]
  19. Hussain, S.; Song, L.; Ahmad, S.; Riaz, M. New Interquartile Range EWMA Control Charts with Applications in Continuous Stirred Tank Rector Process. Arab. J. Sci. Eng. 2019, 44, 2467–2485. [Google Scholar] [CrossRef]
  20. Hussain, S.; Song, L.; Ahmad, S.; Riaz, M. On auxiliary information based improved EWMA median control charts. Sci. Iran. 2018, 25, 954–982. [Google Scholar] [CrossRef] [Green Version]
  21. Abbasi, S.A.; Riaz, M.; Ahmad, S.; Sanusi, R.A.; Abid, M. New Efficient EWMA Variability Charts based on Auxiliary Information. Qual. Reliab. Eng. Int. 2020, 36, 2203–2224. [Google Scholar] [CrossRef]
  22. Hussain, S.; Song, L.; Ahmad, S.; Riaz, M. On a Class of Mixed EWMA-CUSUM Median Control Charts. Qual. Reliab. Eng. Int. 2020, 36, 910–946. [Google Scholar] [CrossRef]
  23. Aslam, M.; Bantan, R.A.; Khan, N. Design of S2N—NEWMA control chart for monitoring process having indeterminate production data. Processes 2019, 7, 742. [Google Scholar] [CrossRef] [Green Version]
  24. Hyder, M.; Mahmood, T.; Butt, M.M.; Raza, S.M.M.; Abbas, N. On the location-based memory type control charts under modified successive sampling scheme. Qual. Reliab. Eng. Int. 2022, 38, 2200–2217. [Google Scholar] [CrossRef]
  25. Abbas, N. Homogeneously weighted moving average control chart with an application in substrate manufacturing process. Comput. Ind. Eng. 2018, 120, 460–470. [Google Scholar] [CrossRef]
  26. Adegoke, N.A.; Abbasi, S.; Smith, A.N.H.; Anderson, M.J.; Pawley, M. A Multivariate Homogeneously Weighted Moving Average Control Chart. IEEE Access 2019, 7, 9586–9597. [Google Scholar] [CrossRef]
  27. Aslam, M.; Khan, M.; Anwar, S.M.; Zaman, B. A homogeneously weighted moving average control chart for monitoring time between events. Qual. Reliab. Eng. Int. 2022, 38, 1013–1044. [Google Scholar] [CrossRef]
  28. Iqbal, A.; Mahmood, T.; Ali, Z.; Riaz, M. On Enhanced GLM-Based Monitoring: An Application to Additive Manufacturing Process. Symmetry 2022, 14, 122. [Google Scholar] [CrossRef]
  29. Adegoke, N.A.; Smith, A.N.H.; Anderson, M.J.; Sanusi, R.A.; Pawley, M.D.M. Efficient Homogeneously Weighted Moving Average Chart for Monitoring Process Mean Using an Auxiliary Variable. IEEE Access 2019, 7, 94021–94032. [Google Scholar] [CrossRef]
  30. Adeoti, O.A.; Koleoso, S.O. A hybrid homogeneously weighted moving average control chart for process monitoring. Qual. Reliab. Eng. Int. 2020, 36, 2170–2186. [Google Scholar] [CrossRef]
  31. Alevizakos, V.; Chatterjee, K.; Koukouvinos, C. The extended homogeneously weighted moving average control chart. Qual. Reliab. Eng. Int. 2021, 37, 2134–2155. [Google Scholar] [CrossRef]
  32. Abid, M.; Shabbir, A.; Nazir, H.Z.; Sherwani, R.A.K.; Riaz, M. A double homogeneously weighted moving average control chart for monitoring of the process mean. Qual. Reliab. Eng. Int. 2020, 36, 1513–1527. [Google Scholar] [CrossRef]
  33. Raza, M.A.; Nawaz, T.; Han, D. On designing distribution-free homogeneously weighted moving average control charts. J. Test. Eval. 2019, 48, 3154–3171. [Google Scholar] [CrossRef]
  34. Riaz, M.; Abid, M.; Shabbir, A.; Nazir, H.Z.; Abbas, Z.; Abbasi, S.A. A non-parametric double homogeneously weighted moving average control chart under sign statistic. Qual. Reliab. Eng. Int. 2021, 37, 1544–1560. [Google Scholar] [CrossRef]
  35. Abid, M.; Mei, S.; Nazir, H.Z.; Riaz, M.; Hussain, S. A mixed HWMA-CUSUM mean chart with an application to manufacturing process. Qual. Reliab. Eng. Int. 2021, 37, 618–631. [Google Scholar] [CrossRef]
  36. Abid, M.; Mei, S.; Nazir, H.Z.; Riaz, M.; Hussain, S.; Abbas, Z. A mixed cumulative sum homogeneously weighted moving average control chart for monitoring process mean. Qual. Reliab. Eng. Int. 2021, 37, 1758–1771. [Google Scholar] [CrossRef]
  37. Thanwane, M.; Malela-Majika, J.C.; Castagliola, P.; Shongwe, S.C. The effect of measurement errors on the performance of the homogenously weighted moving average. Trans. Inst. Meas. Control 2020, 43, 728–745. [Google Scholar] [CrossRef]
  38. Thanwane, M.; Shongwe, S.C.; Malela-Majika, J.C.; Aslam, M. Parameter Estimation Effect of the Homogeneously Weighted Moving Average Chart to Monitor the Mean of Autocorrelated Observations with Measurement Errors. IEEE Access 2020, 8, 221352–221366. [Google Scholar] [CrossRef]
  39. Thanwane, M.; Abbasi, S.A.; Malela-Majika, J.C.; Aslam, M.; Shongwe, S.C. The use of fast initial response features on the homogeneously weighted moving average chart with estimated parameters under the effect of measurement errors. Qual. Reliab. Eng. Int. 2021, 37, 2568–2586. [Google Scholar] [CrossRef]
  40. Thanwane, M.; Malela-Majika, J.C.; Castagliola, P.; Shongwe, S.C. The effect of measurement errors on the performance of the homogenously weighted moving average X¯ monitoring scheme with estimated parameters. J. Stat. Comput. Simul. 2021, 91, 1306–1330. [Google Scholar] [CrossRef]
  41. Riaz, M.; Abbas, Z.; Nazir, H.Z.; Abid, M. On the Development of Triple Homogeneously Weighted Moving Average Control Chart. Symmetry 2021, 13, 360. [Google Scholar] [CrossRef]
  42. Knoth, S.; Tercero-Gómez, V.G.; Khakifirooz, M.; Woodall, W.H. The impracticality of homogeneously weighted moving average and progressive mean control chart approaches. Qual. Reliab. Eng. Int. 2021, 37, 3779–3794. [Google Scholar] [CrossRef]
  43. Abbas, N.; Zafar, R.F.; Riaz, M.; Hussain, Z. Progressive mean control chart for monitoring process location parameter. Qual. Reliab. Eng. Int. 2013, 29, 357–367. [Google Scholar] [CrossRef]
  44. Abbas, N.; Riaz, M. Progressive mean as a special case of exponentially weighted moving average: Discussion. Qual. Reliab. Eng. Int. 2022, 38, 2188–2197. [Google Scholar] [CrossRef]
  45. Mei, Y. Is average run length to false alarm always an informative criterion? Seq. Anal. 2008, 27, 354–376. [Google Scholar] [CrossRef] [Green Version]
  46. Montgomery, D.C. Introduction to Statistical Quality Control, 8th ed.; John Willey & Sons: New York, NY, USA, 2019. [Google Scholar]
  47. Alevizakos, V.; Chatterjee, K.; Koukouvinos, C. The triple moving average control chart. J. Comput. Appl. Math. 2021, 384, 113171. [Google Scholar] [CrossRef]
  48. Alevizakos, V.; Koukouvinos, C. A double progressive mean control chart for monitoring Poisson observations. J. Comput. Appl. Math. 2020, 373, 112232. [Google Scholar] [CrossRef]
  49. Kenett, R.S.; Pollak, M. On Assessing the Performance of Sequential Procedures for Detecting a Change. Qual. Reliab. Eng. Int. 2012, 28, 500–507. [Google Scholar] [CrossRef]
Figure 1. A procedural flow chart of the simulation study.
Processes 10 01129 g001
Figure 2. CED curves for the HWMA and EWMA charts under small to moderate shifts at λ = 0.03 with respect to time points ( t ) .
Processes 10 01129 g002
Figure 3. CED curves for the HWMA and EWMA charts under moderate to large shifts at λ = 0.03 with respect to time points ( t ) .
Processes 10 01129 g003
Figure 4. CED curves for the HWMA and EWMA charts under small to moderate shifts at λ = 0.05 with respect to time points ( t ) .
Processes 10 01129 g004
Figure 5. CED curves for the HWMA and EWMA charts under moderate to large shifts at λ = 0.05 with respect to time points ( t ) .
Processes 10 01129 g005
Figure 6. CED curves for the HWMA and EWMA charts under small to moderate shifts at λ = 0.1 with respect to time points ( t ) .
Processes 10 01129 g006
Figure 7. CED curves for the HWMA and EWMA charts under moderate to large shifts at λ = 0.1 with respect to time points ( t ) .
Processes 10 01129 g007
Figure 8. CED curves for the HWMA and EWMA charts under small to moderate shifts at λ = 0.25 with respect to time points ( t ) .
Processes 10 01129 g008
Figure 9. CED curves for the HWMA and EWMA charts under moderate to large shifts at λ = 0.25 with respect to time points ( t ) .
Processes 10 01129 g009
Figure 10. CED curves for the HWMA and EWMA charts under small to moderate shifts at λ = 0.5 with respect to time points ( t ) .
Processes 10 01129 g010
Figure 11. CED curves for the HWMA and EWMA charts under moderate to large shifts at λ = 0.5 with respect to time points ( t ) .
Processes 10 01129 g011
Figure 12. Weight assessment of HWMA with respect to time points ( t ) for (a,b) the first value under zero state and steady state performances, respectively; (c,d) the 20th value under zero state and steady state performances, respectively; (e,f) the 50th value under zero state and steady state performances, respectively.
Processes 10 01129 g011
Table 1. L Z and L H of EWMA and HWMA charts.
λ or ω L Z L H
0.032.4832.272
0.052.6392.608
0.102.8242.938
0.253.0013.075
Publisher’s Note: MDPI stays neutral with regard to jurisdictional claims in published maps and institutional affiliations.

