Article

Assessment of Deep and Shallow Geothermal Resources and Measurement of Waste Heat Potentials from Industrial Processes for Supplying Renewable Heat for Industry and Urban Quarters

1
Department for Sustainable Thermal Energy Systems, AIT Austrian Institute of Technology GmbH, 1210 Vienna, Austria
2
Hydrogeology and Geothermal Energy, Geological Survey of Austria, 1030 Vienna, Austria
3
Chair of Energy Network Technology, Montanuniversität Leoben, 8700 Leoben, Austria
*
Author to whom correspondence should be addressed.
Processes 2022, 10(6), 1125; https://doi.org/10.3390/pr10061125
Submission received: 9 April 2022 / Revised: 18 May 2022 / Accepted: 20 May 2022 / Published: 4 June 2022
(This article belongs to the Section Energy Systems)

Abstract

:
Deep geothermal resources for heat supply and waste heat potentials were assessed and measured for a high-temperature dairy plant. For the industrial waste heat, a borehole heat exchanger (BHE) seasonal storage was configured and simulated after an extensive investigation of shallow geothermal resources. We developed a concept for the subsequent use of the residual and waste heat from the plant in a low-temperature heating and cooling (LTHC) grid for the neighbouring former military camp “Martinek-Kaserne” with a future use as mixed-use urban quarter were investigated in two projects. The modelling of the deep geothermal resources showed that of the three potential reservoirs one is most feasible for geothermal heat supply with temperatures between 129 and 146 °C, which could be used with a high-temperature heat pump for process heat. The waste heat in all sub-processes of the dairy plant were measured over 18 months to identify the most suitable waste heat streams with regard to temperature and continuity. The results showed that 25 % of the waste heat from a sub-process of the plant (fresh products logistics) is sufficient to provide heat for the adjacent LTHC grid with a total energy demand of 3428 MWh per year. The simulation of the BHE field resulted in 96 BHE with 180 m depth for a dis-/charging capacity of 643.7 MWh and 20 decentral heat pumps in the buildings. The BHE field operates quite balanced with only 12.8 MWh of difference in the annual balance. The results of the feasibility study for deep and shallow geothermal resources, and the assessment of the industrial waste heat show that the whole cascade of high-temperature heat for industry to low-temperature heat for the LTHC grid could be realized at the investigated site.

1. Introduction

1.1. Decarbonisation of Industry with Geothermal Energy

Industrial energy use accounts for ca. 30% of the final energy use with process heat demand being the largest fraction of industrial energy use. In order to successfully tackle the decarbonisation of industry, geothermal energy will play a decisive role in this transformation process due to its versatile application possibilities—heating, cooling, power generation and heat storage. One further advantage is the possibility of a cascade use of the heat—high temperatures from deep geothermal resources for industry and use of te residual heat as well as waste heat from the industrial process for middle- to low-temperature heating and cooling grids for housing and commercial use, thus creating regional synergies and at the same time significantly boosting the economic efficiency of the system. One of the most significant levers to reduce greenhouse gas emissions in Austria is industry. Particularly in the light of the most recent political developments the industrial and community partners are now looking increasingly to decarbonize their processes and grids. Geothermal energy uses local resources, thus increasing substantially the independency of external oftentimes fossil energy sources for heating.

1.2. Low-Temperature Heating and Cooling Grids (LTHC)

Low temperature heating and cooling (LTHC) grids are innovative approaches to meet the heating and cooling demand especially in urban areas. District heating systems face a transition of decreasing grid temperatures alongside the transition towards an increase in renewable energy use up to 100% [1,2]. In Europe, the first LTHC grids were installed in Switzerland around 15 years ago. The topic of LTHC grids gains increasing attention particularly in urban areas, due to (I) the increasingly lower temperature demand of heating distribution systems in new buildings which often have a high building standard (passive house or similar); (II) energy efficiency measures in old buildings (thermal insulation, new windows etc.); and (III) the trend to decentralised heating and cooling grids with an increased share of renewables, supporting local or national climate and energy goals. The number of so-called local energy communities, especially in urban and sub-urban areas, where high-temperature district heating is not available or where the building and usage structure allows for low-temperature heating and cooling, is expected to increase substantially over the next years. In comparison to common district heating networks the flow direction is bidirectional. Hence, heat can be carried to and from the consumer, depending on the season and heating/cooling demand. The geothermal energy storage must balance the residuum of the actual energy demand of all users and should be designed with balanced annual heat load and discharge.

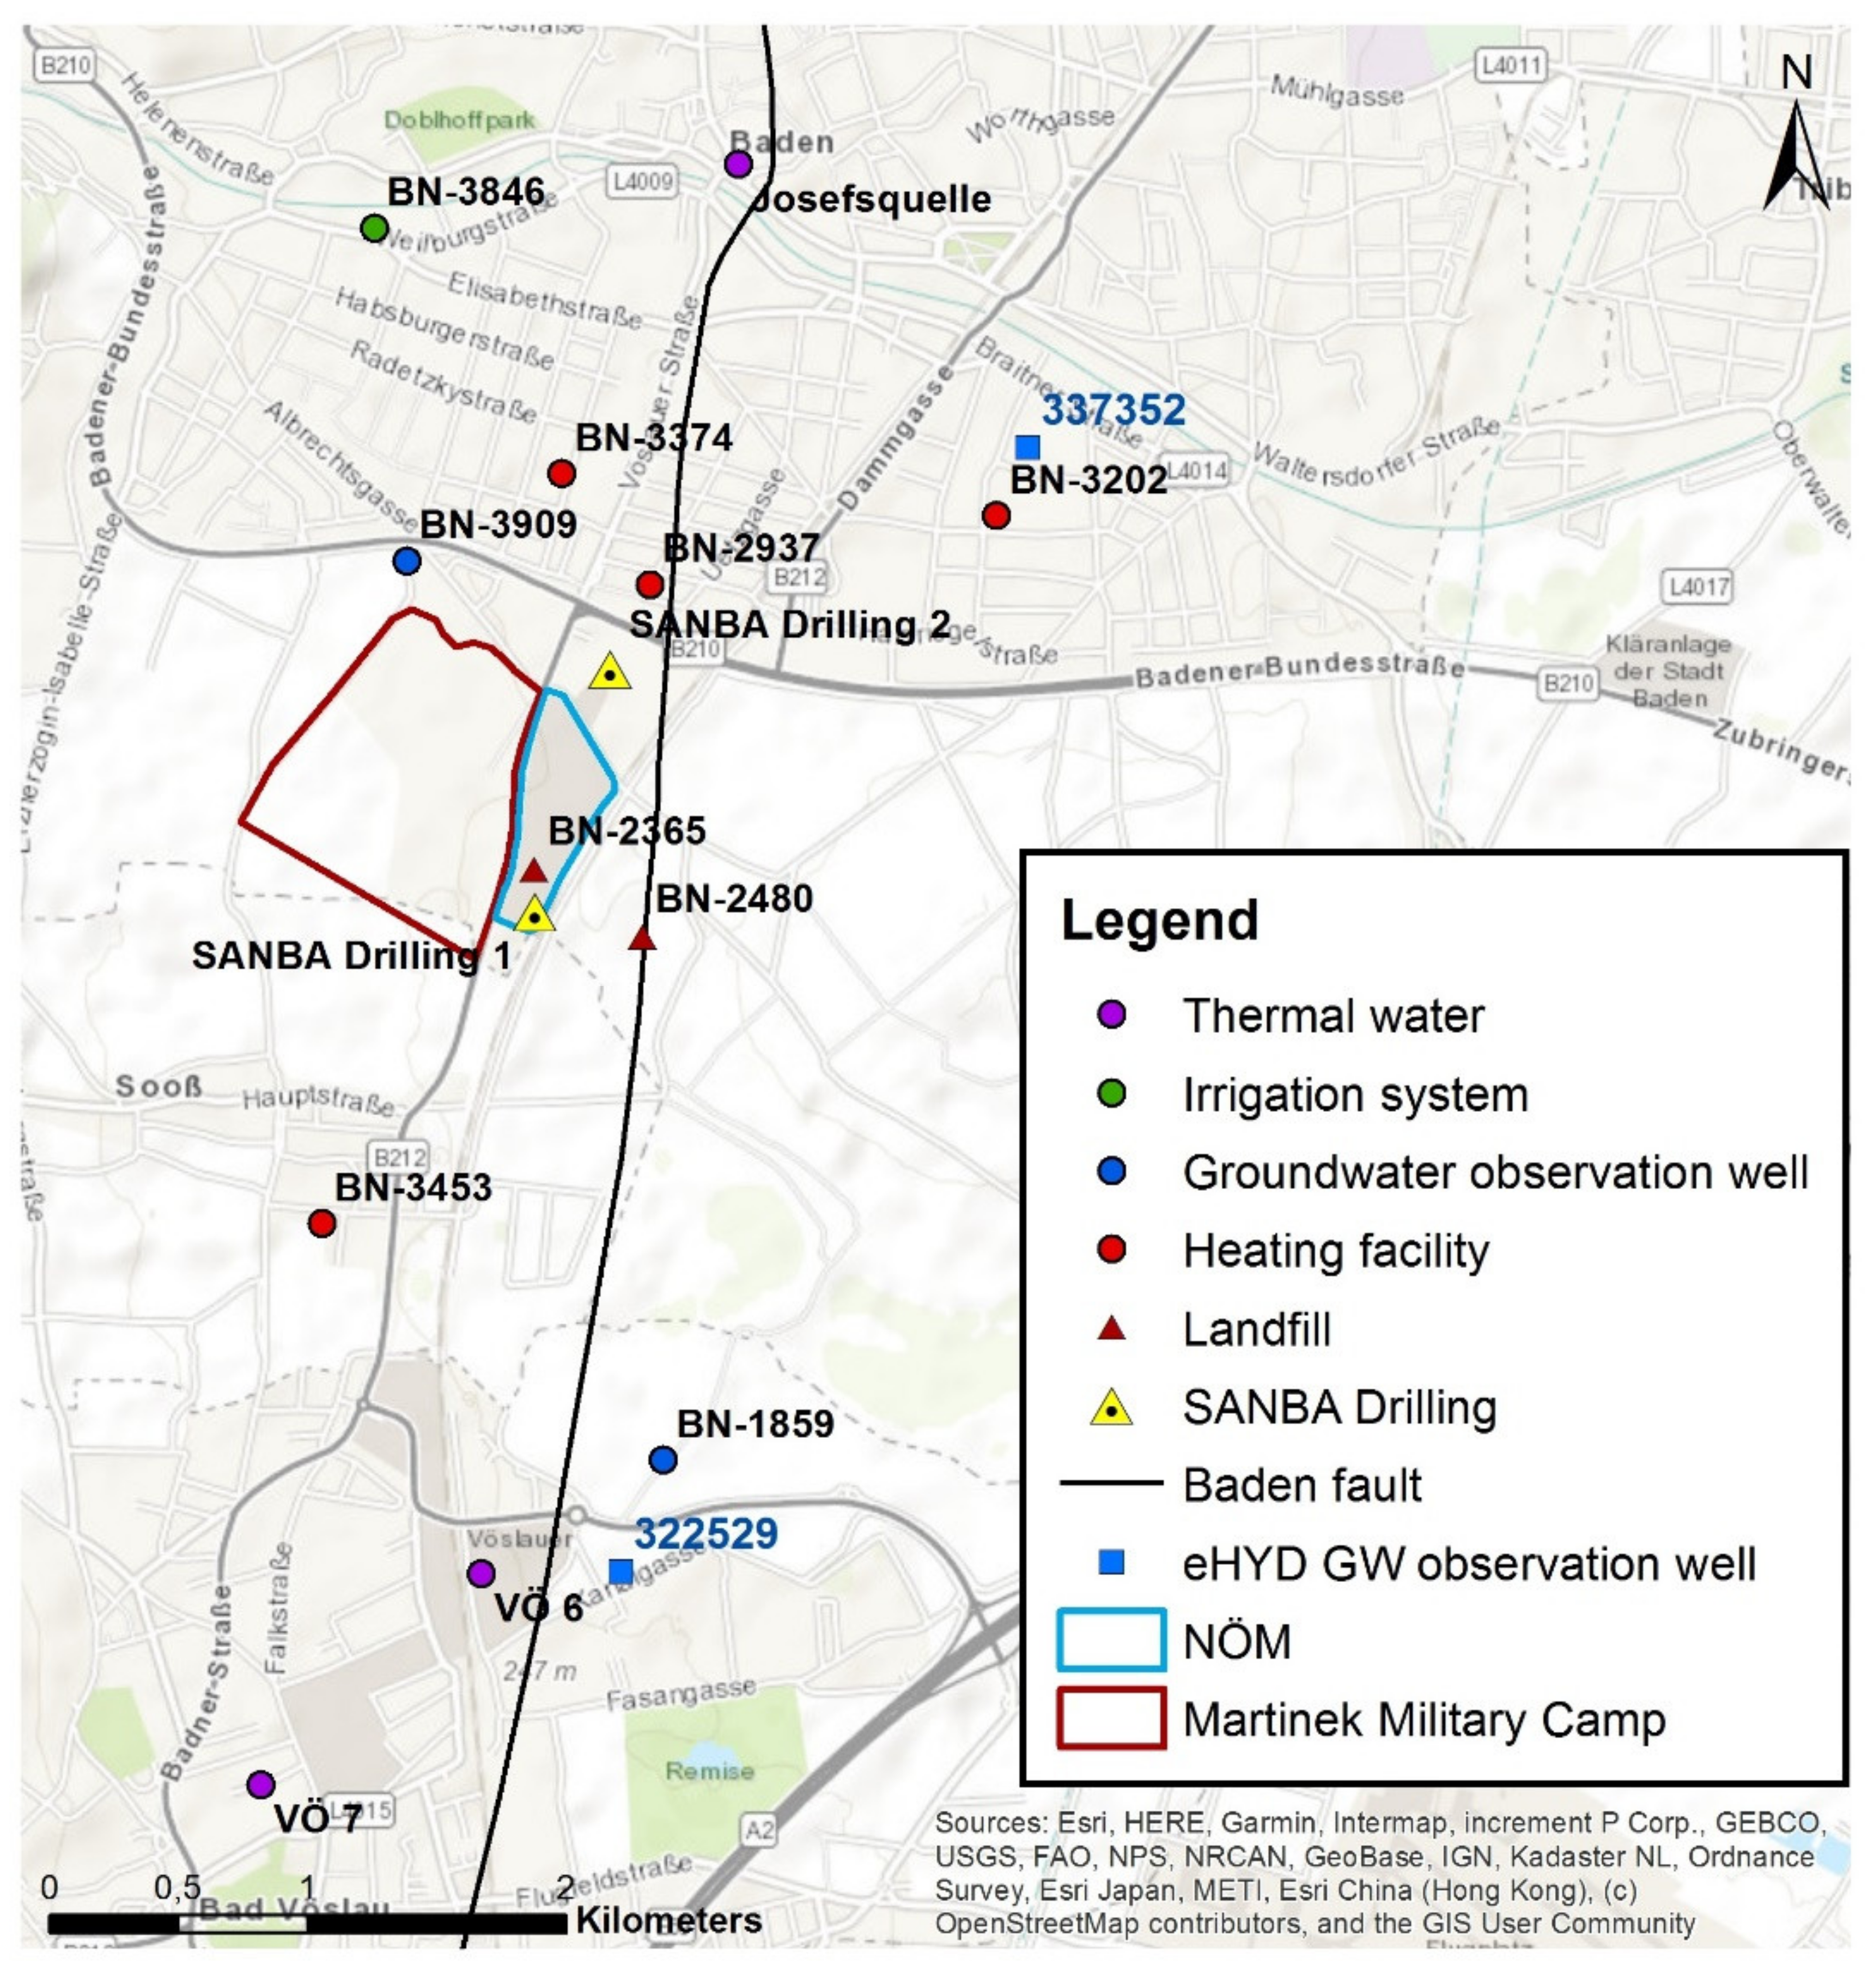
1.3. Investigated Sites

1.3.1. High-Temperature Use—NÖM Dairy Plant

The NÖM AG is one of Austria’s largest dairy plants with a 24/7-production with process temperatures of up to 180 °C. The temperature level of the steam consumers at the plant is between ca. 80 °C and 170 °C, with 90% of the heat required at a temperature above 139 °C. The heat is provided with fossil gas with a large share of internal re-use of the waste heat. In a former project, the possibilities of the transition of fossil fuels to geothermal energy was investigated. However, despite promising results, a deep geothermal drilling was not realized, since the levelized costs of heat were not competitive compared to fossil gas at that time.

1.3.2. Low-Temperature Use—Former Military Camp “Martinek-Kaserne”

Opposite the NÖM dairy plant, the former military camp “Martinek-Kaserne” is located (Figure 1). It was constructed during the war years 1938 to 1943 as antiaircraft defence base. After the Second World War, the camp was used by the Soviet Army and then by the Austrian Military until 2014, when the Military Camp was abandoned. The property owner is the Austrian Armed Forces with the Austrian Federal Ministry of Defence as superordinate institution.
The vast property with an area of 40 hectares with buildings protected by cultural heritage has been subject of several development plans over the years. Over the last years the main stakeholders, i.e., the Federal Ministry of Defence as property owner, the City of Baden, the Federal Monument Protection Agency, and the neighbouring municipality Sooß, which owns a small part of the “Martinek-Kaserne” property, have discussed several options for the future use of the area.
Over the past years after the abandonment, the “Martinek-Kaserne” has been subject to many development plans. The need for refurbishment of the buildings is given regardless of their future use. The refurbishment of the buildings so that they are suitable for a low-temperature heating and cooling distribution system is a new concept for the owner, the Federal Ministry of Defence. The Ministry itself carried out or ordered studies for a possible future use of the buildings. The subsequent work for the design of the LTHC grid was done in close coordination with the stakeholders. The design and simulation of the grid was carried out independently of the future use, whereas a future use of the “Martinek-Kaserne” again merely as a military camp is excluded after talks with the stakeholders. The user and therefore load profiles of the buildings were assumed as mixed, with housing, commercial and office buildings, education etc., whereas we can work with preliminary studies of architects and developers as a guideline for the development of the scenarios.

1.4. Scenarios for Geothermal Energy Use for the Investigated Sites

In a former project, the deep geothermal resources in the investigated area were assessed in detail from 2012—2014. However, despite promising reservoir (i.e., subsurface water and/or gas-containing porous rock layer) temperatures, a deep geothermal project was not realized, since neither the local energy provider, nor the city of Baden and the NÖM dairy plant wanted to invest in a deep geothermal drilling. Since the recent surge in energy prices and the resulting increasing willingness of industry to fully decarbonize their processes, the feasibility of geothermal energy for high-temperature processes is (re-)assessed in many plants. The provision of high temperatures from geothermal sources for high-temperature industry directly or with high-temperature heat pumps alone is a challenge and at the same time an opportunity to decarbonize important users of fossil fuels. It is often stated that the investment and operation of external waste heat utilization is not within the scope of the core business of manufacturing companies. Accordingly, the use of waste heat is given little personal attention and investments are made more in product-relevant processes than cost-reducing measures. Until recently, the prices of oil and gas were also too low for renewables to be competitive. Since industrial partners and communities are often fully immersed in their day-to-day-business, it is important to assist them in the decarbonization of their heating sources by assessing and investigating different pathways for fossil-free energy provision as well as waste heat potentials. In two projects, we have worked together with the local energy provider, the NÖM dairy plant and the Federal Ministry of Defence to assess the deep and shallow geothermal resources as well as the waste heat in the dairy plant to develop decarbonized high- to low temperature heat.
In this manuscript, we focus on the heat supply side, i.e., deep geothermal resources for the high-temperature dairy plant as well as waste heat from the different processes in the plant and shallow geothermal resources including the dimensioning of a borehole heat exchanger (BHE) field for seasonal geothermal storage. The heat sink side, i.e., the military camp will only be used in terms of energy demand. The dimensioning, configuration and simulation of the low-temperature heating and cooling grid as well as the decentral heat pumps is not part of this manuscript.

2. Materials and Methods

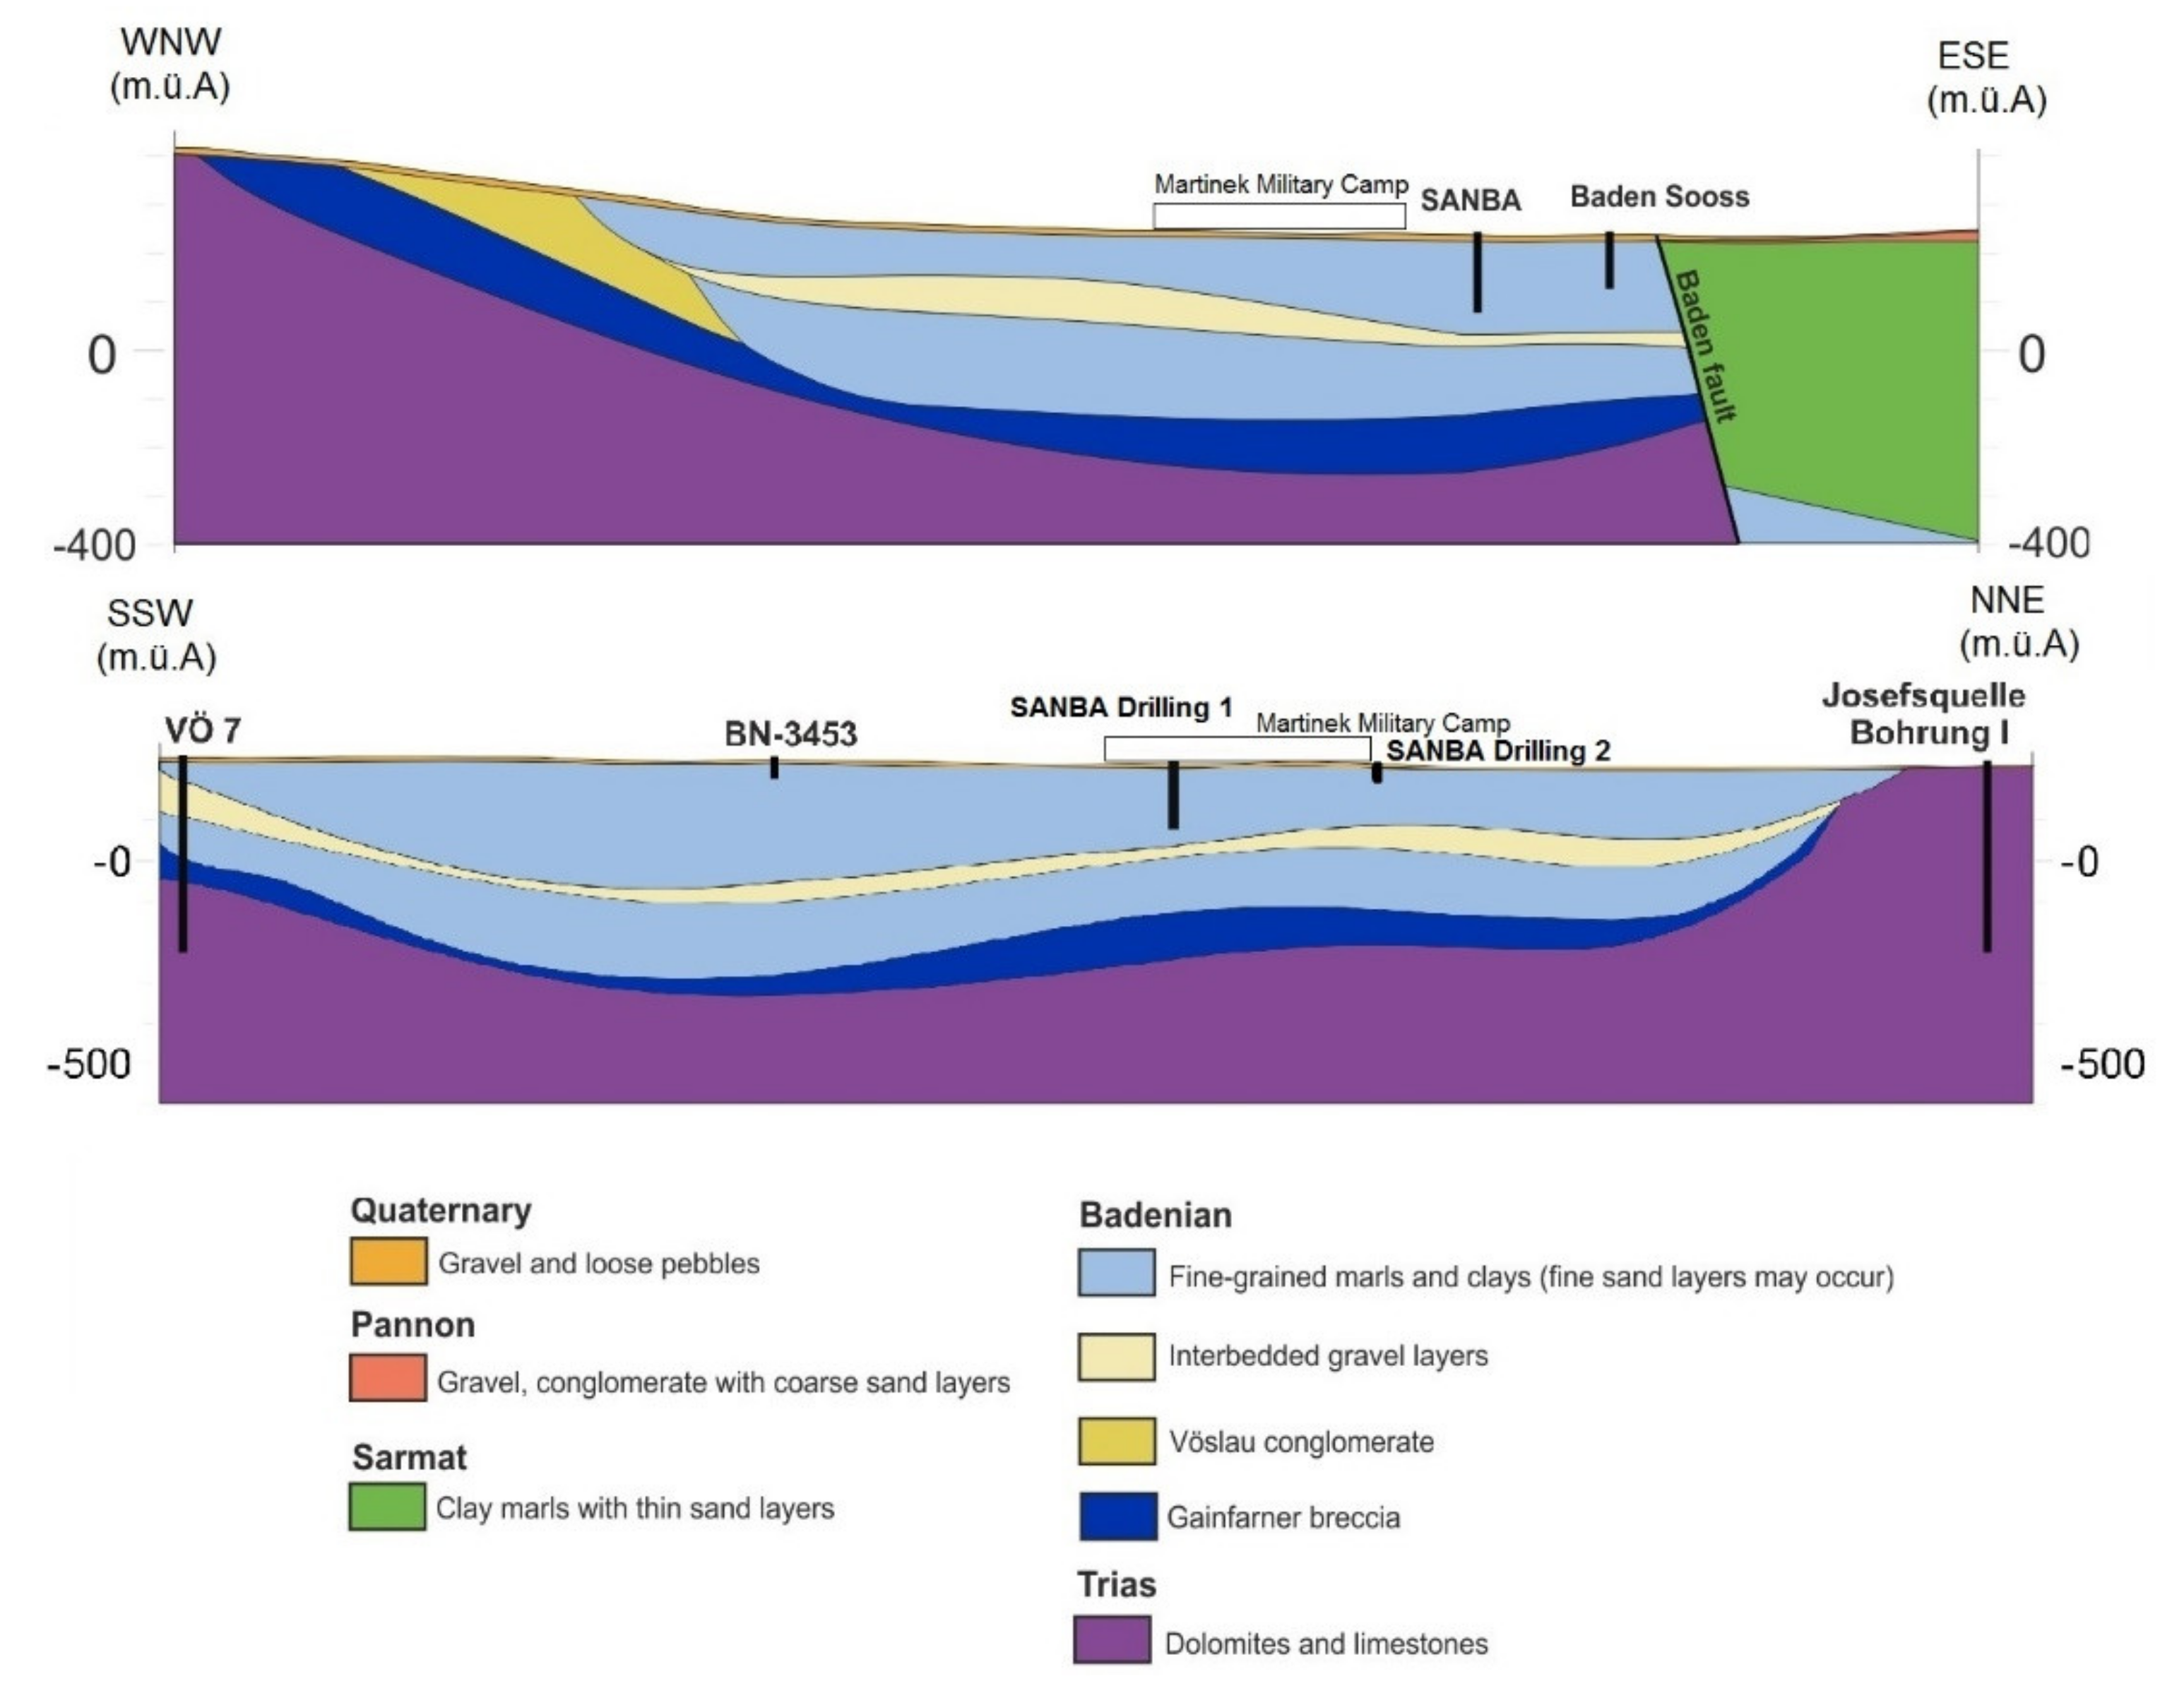
2.1. Hydrogeological and Geothermal Site Information

2.1.1. Deep Geothermal Resources

The NÖM dairy plant is located in Baden bei Wien and thus situated in the southern Vienna Basin near the eastern edge of the Alps. The rocks found on the surface in the Alps, consisting of Triassic dolomites and limestones, continue below the Vienna Basin and form important thermal water and hydrocarbon reservoirs. While the central and northern Vienna Basin is relatively well known due to the intensive exploration and use of hydrocarbons, the lack of hydrocarbons on the western edge of the southern Vienna Basin leads to a much less profound data situation. On the other hand, there is the fact that the potentially water-bearing geological layers of the Calcareous Alps in the vicinity of the Baden site are exposed on the surface and can therefore be well explored. In addition, data is available in Baden on the uses of the thermal water, some of which emerges naturally and some of which is collected in boreholes and wells. There are smaller spring protection areas for the thermal waters in Baden and Bad Vöslau. Baden has 15 thermal water sources like the ‘Josefsquelle’, which supply the facilities with sulfurous thermal water. The water in Bad Vöslau is used for mineral water bottling and health resorts and is among others supplied by the drilling sites VÖ 6 and VÖ 7 (Figure 2) [3,4].
For the assessment of the deep reservoirs, a uniform workflow was used to investigate the geogenic conditions. This consisted of the following work steps:
i.
Identification of suitable reservoirs
ii.
Evaluation of the geometry of potential reservoirs
iii.
Assessment of mountain temperature
iv.
Evaluation of the productivity of the deposit
v.
Assessment of water chemistry
vi.
Evaluation of the energy content and indication of the forecast uncertainties
ad i.: The generalized geological 3D model for the Baden site was created exclusively from published geological data. The depth of the reservoir affects the economics of geothermal use with regard to the drilling costs, whereas the thickness of the reservoir determines the productivity. The evaluation was carried out graphically using geographic information systems (ESRI ArcGIS). The location selection for the geothermal doublets was made in coordination with the involved energy provider. The prerequisite for the selection was the fulfilment of the minimum criteria by the local energy provider with regard to (Table 1):
  • Required temperature level of use
  • Required power range (required geothermal mass flow of the doublet)
  • Topographical situation: location of the user, location of restricted areas (protected areas).
The requirements were derived from the energy demand of the district heating grids of Baden and Bad Vöslau (10 MWth with 6000 h and 5 MWth with 8760 h) and the NÖM dairy plant (2.3 MWth with 8760 h)
ad iii.: The spatial assessment of the reservoir temperatures of the three potential reservoirs was carried out stationary using the software program COMSOL Multiphysics, taking into account the coupling of heat conduction and convection as a result of thermal water movement and served to determine the current state of the hydraulic and thermal conditions at the site before the geothermal application. The numerical model was—as far as possible—iteratively adapted to the existing measurement data. The temperature distribution for the space between the support points was calculated according to the specifications of the model calculations (boundary conditions and rock properties).

2.1.2. Shallow Geothermal Resources

The Martinek military camp is also located south of Baden and thus situated near the western border of the Southern Vienna Basin. The basin deposits are mainly characterized by marine and partly fluviatile sediments. These overlying fine-grained sediments act as impermeable barriers for the deeper thermal water. The sedimentation was accompanied by tectonic processes and led to tilting and erosion of the sediments. A series of fault systems can be found in the basin [5]. The main fault in our area of interest is the N-S striking Baden fault [3] (Figure 2).
Besides deeper thermal water reservoirs, the hydrogeological conditions are predominantly characterized by a shallow quaternary groundwater reservoir, in the top 10 to 20 m. All well systems recorded in the water register (irrigation system, groundwater observation well and heating facility) and the groundwater observation wells from the hydrographic service of Lower Austria (eHYD) only penetrate the shallow quaternary groundwater reservoir. The district authority of Baden provided all information about the facilities from the water register. Gravel and fine to medium sand layers act as the unconfined porous aquifer and underlying fine-grained sediments act as impermeable barriers in the area of interest [6]. Since our area of interest is located at the edge of this shallow quaternary groundwater reservoir, there are many local inhomogeneities and only moderate permeable conditions.
The use of geothermal energy is based on the heat exchanger principle by taking thermal energy from the subsurface and bringing it to the surface where this thermal capacity can be used for heating, and the other way around for cooling purposes. This can be implemented in a closed loop system by borehole heat exchangers with a circulation fluid as the heat transfer medium or in an open loop system where groundwater is used as the heat transfer medium.
In order to estimate the resources for generating and storing heat based on shallow geothermal methods (borehole heat exchangers and thermal groundwater use) the knowledge of the subsurface conditions up to the maximum depth of planned installations is required (in the project: 180 m). In that regard, subsurface characteristics like the lithological build-up, hydrogeological conditions and thermal properties are very important. For this purpose, all information available from literature and archives (lithological borehole profiles, hydrogeological cross sections and existing water permits in the closer vicinity of the site) were collected and two geoelectric (DC) resistivity profiles have been measured at the Martinek former military camp which focused on resolving the resistivity in depths up to 150 m. In addition, two exploratory drillings with a depth of 150 m (flush drilling) and 30 m (core drilling) were equipped at the site of the NÖM plant and an enhanced thermal response test (eTRT) was performed to gain knowledge of the thermal properties. All gathered information served as important input for building a 3D hydrogeological subsurface model using the geological modelling software SKUA-GOCAD. The borehole thermal energy storage (BTES) is a central element of the LTHC grid since it is used for load balance. Therefore, the model was fed into a process model based on the software program FEFLOW in order to validate the programmed geothermal module of the dynamic tool of the entire heating and cooling grid, and to determine the influence of the installations on the underground areas.

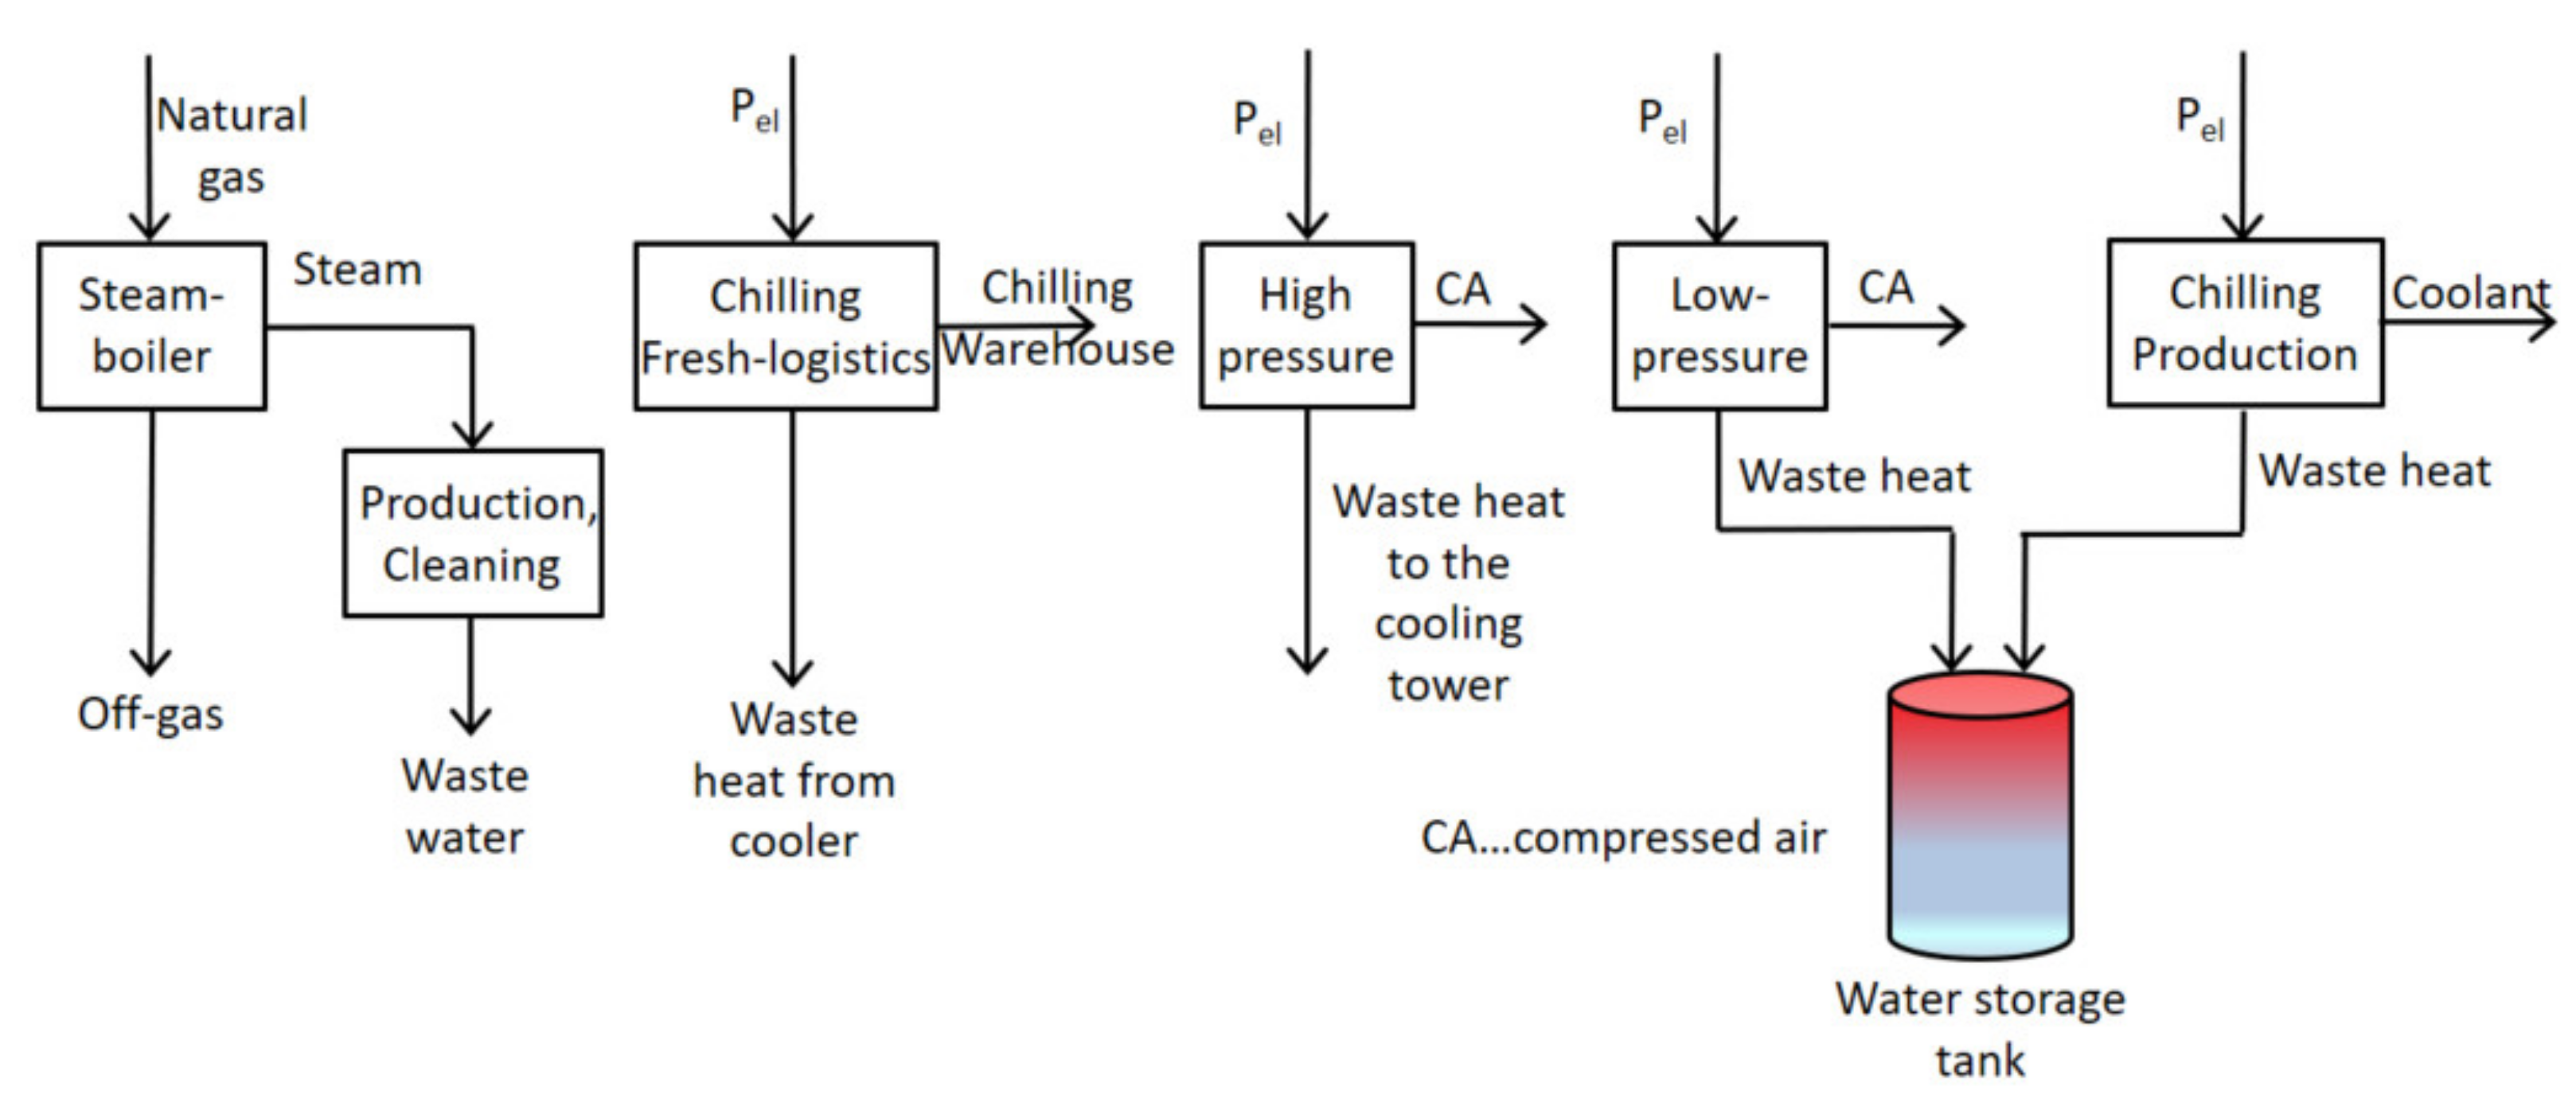
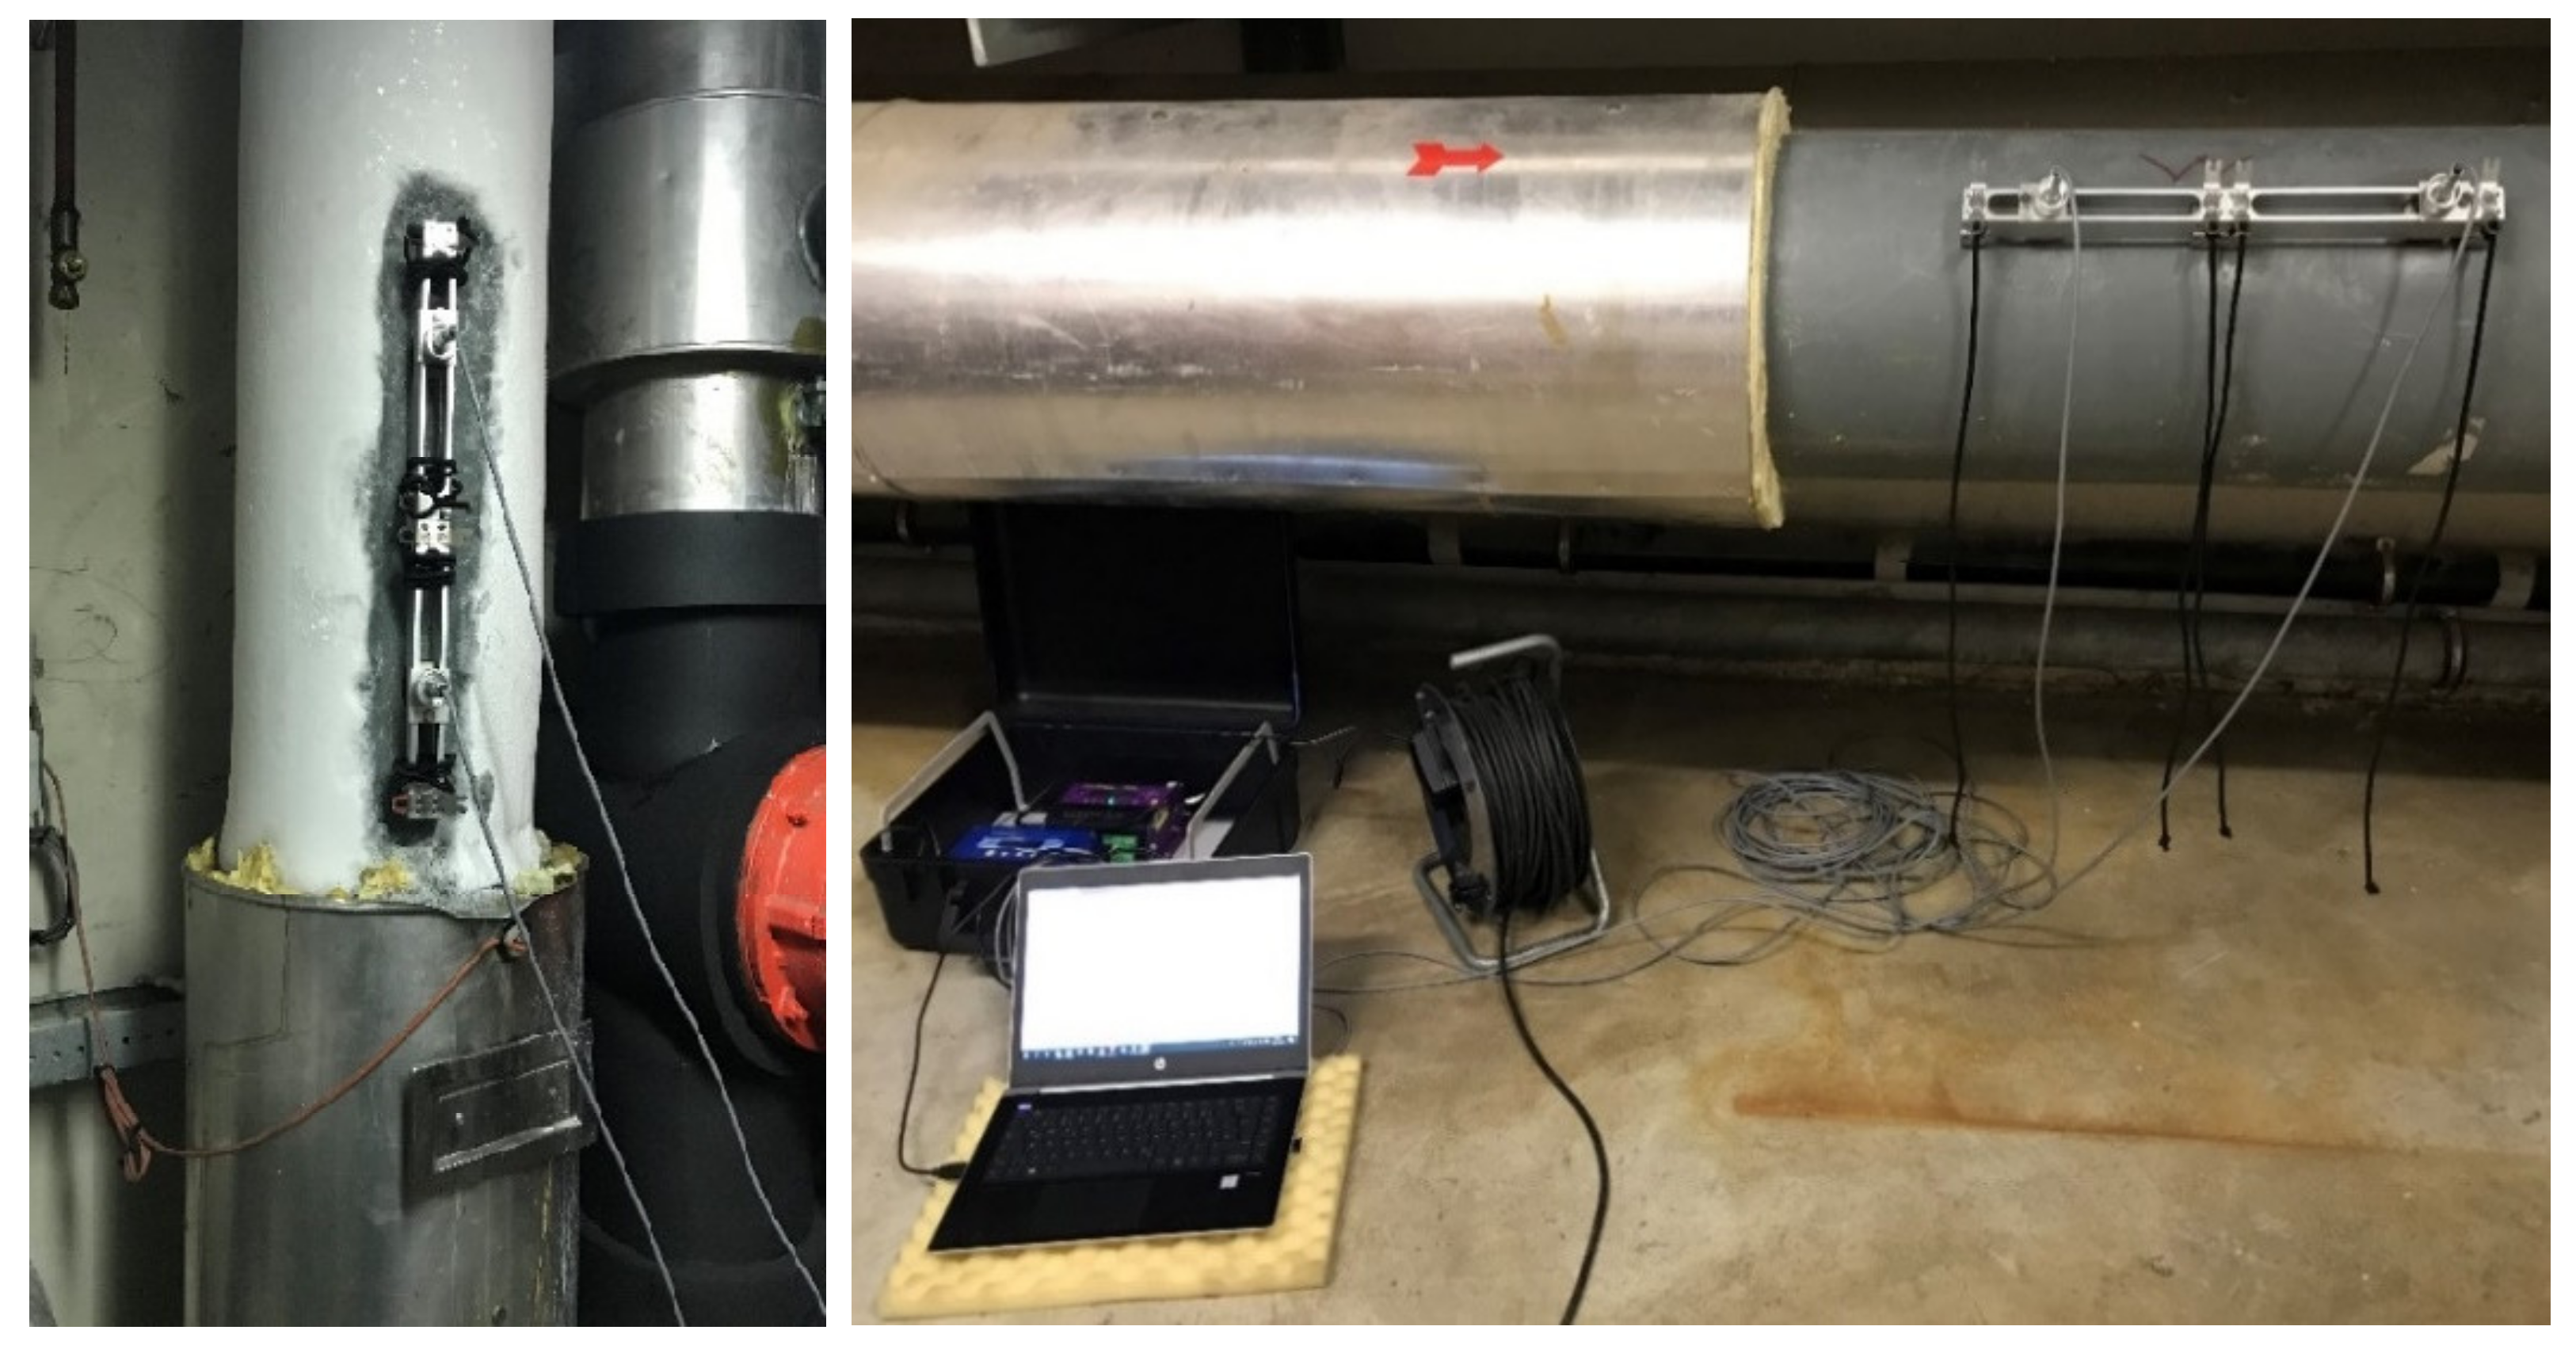
2.2. Energy Analysis of the Dairy NÖM

The determination of the waste heat potentials of the dairy NÖM forms an important basis for the dimensioning and simulation of the planned neighbouring LTHC grid and also for the assessment of efficiency measures within the plant. In order to determine the waste heat and energy efficiency potentials of a plant and to analyse the energy system, the data of the existing energy flows must be determined in a first step.
In the case of the examined dairy NÖM these are waste heat from the following areas (Figure 3):
  • Waste heat from the off-gas stream of the steam boiler plant
  • Wastewater from the various cleaning processes
  • Waste heat from cooling units
  • Waste heat from air compressors (high pressure)
  • Waste heat from heat storage tanks
ad (a) Off-Gas Stream of the Steam Boiler Plant
A redundant system with two water tube boiler units is used to generate process steam for production process. The main plant, a Bosch company boiler, has a thermal capacity of 9.5 MW and produces 14.5 t/h of steam. Two off-gas stream heat exchangers are installed to preheat the fresh and feed water. Approximately 60% of the steam used is returned from production to the boiler plant in the form of condensate. The rest is supplied with fresh water. The fresh water is preheated from about 12 °C to 85 °C. The Off-gas stream temperature of the Bosch boiler system (after the preheating heat exchanger) is about 64 °C and thus slightly above the condensation temperature of about 58 °C. The data of the gas consumption as well as the off-gas temperatures could be read out from the internal process control system.
ad (b) Wastewater from the Cleaning Processes
Wastewater is produced during the cleaning process of the plant and consists of chemical cleaning and rinsing, carried out by CIP (Cleaning in Place). The sequence of a CIP cleaning process is divided into several steps such as pre-rinsing, alkaline cleaning, rinsing, acid cleaning, rinsing and disinfection. This is a crucial energy consumer of a dairy. The thermal energy for cleaning is provided by steam.
ad (c) Waste Heat from the Recoolers of the Cooling System for Fresh Products Logistics (FRILO)
The temperature in the cooling system for the warehouse of fresh products logistics FRILO is kept constant at 3 °C to 4 °C. The cooling is supplied from four refrigeration plants via a collecting pipe to distribution substations, which in turn serve the air coolers located on the site, which is called the cold brine circuit. The waste heat generated by the four refrigeration plants is lead to table chillers on the roof of the building via a common collection pipe and is released into the environment. A part of the waste heat is decoupled via a heat exchanger shortly after the refrigeration units and is fed to the individual cooling units for defrosting. The defrosting of the cooling units is necessary to prevent freezing and thus to maintain the functionality.
Time-resolved data regarding the electrical power consumption of the refrigeration systems as well as temperature data of the flow and return pipes of the hot and cold brine circuits are available. In order to determine the heat output or heat quantity emitted, the volume flow had to be measured at the collector pipe of the warm brine circuit using ultrasonic measurement (Figure 4).
From the measurement series from November 2019 to January 2020, the ratio factor fQ,FRILO between heat output and electrical power input was determined. Using this power factor, a performance profile for the heat output as a percentage of the nominal cooling output of the units for the year 2019 was extrapolated. After this first series of measurements, the ultrasonic flowmeter continued to operate at the measuring point for several months in order to validate the first series of measurements. Furthermore, a more precise determination of the factor fQ,FRILO, the ratio between heat output and electrical power input at the chillers, should be carried out.
ad (d) Waste Heat from the Cooling Circuit of High-Pressure Compressed Air Generation
The waste heat from the low-pressure air compressors is already stored in the 75  °C heat storage tank. The low-pressure air system was therefore not considered further and the measurements were done for the high-pressure system.
Two Atlas Copco high-pressure compressors type AC Crepelle D46 and one LMF EcoPET high-pressure compressor are available for the compressed air high-pressure network. There is mainly one of the AC units in operation to provide the compressed air. The second AC unit serves as backup. The LMF compressor is switched on when there is an increased demand or is also used as a replacement for the AC system.
The high-pressure air compressors feed into the compressed air network at a pressure of 30 bar (g). The high-pressure air is required to inflate PET bottle blanks. In the course of an energy audit in 2015, measurements of the compressed air flow over a period of two weeks were carried out. Time-resolved data on the electrical power consumption of the high-pressure air systems was available for the year 2019.
The waste heat generated by the compressors is transported to table coolers and cooling towers on the roof of the dairy via a water-glycol-circuit. In order to obtain further flow rate and temperature data of the water-glycol-cooling circuit, which is key for our study, measurements were also made using clamp-on ultrasonic measuring equipment and temperature sensors (Figure 5).
In contrast to the Atlas Copco units, the flow measurements on the pipes of the water-glycol-circuit of the LMF-compressor did not yield any results, because signal errors occurred due to strong vibrations. For this reason, the flow rate of the LMF-compressor cooling circuit was determined from the characteristic curve in the nominal operating state of the uncontrolled pump. It was assumed that a pump was selected where the operating point is at the maximum efficiency.
For each of these three compressed air systems, three individual factors fCA were determined between the waste heat output HWasteHeat,i and the electrical energy consumed Eel,i:
f C A = i H W a s t e H e a t , i E e l , i = i m i   c p , i T i E e l , i
Using these factors, three individual heat load curves were formed from the available data on the electrical power consumed over a period of one year. Afterwards an overall waste heat load curve was formed by combining these three load curves.
ad (e) Waste Heat Potential from the Heat Recovery of the Stratified Storage Tank
The 75-degree water storage tank has potential for further heat extraction. The storage tank is fed with the waste heat from the low-pressure compressed air systems and chilling machines for cooling of production process. Additional use of the waste heat would be desirable, due to too small volume the waste heat occasionally has to be released via air coolers to ensure cooling of the compressed air and refrigeration units.
The stored heat is mainly used to heat the office buildings in winter. The heating system of the office buildings is supplied by a heat exchanger with a capacity that covers about 70 % of the maximum heating capacity for the office space. Since no measured data was available, the waste heat potential and the heat output profiles were determined indirectly. This involves generating a heating load profile with the data from the PVGIS database [7] using the heating degree days method. The available waste heat profile is then created from the difference between the output of the above-mentioned heat exchanger and the heating load profile created. The exergetic evaluation of the heat output is carried out with reference to the water temperature of the storage tank of 75 °C and the reference temperature of the anergy network in the individual seasons.

3. Results

3.1. Deep Geothermal Potential and Reservoir Assessment

The spatial evaluation of the forecast reservoir temperatures is based on the results of the numerical modelling. The results of the numerical model calculations represent the forecast of the rock temperature according to the expected value of the statistical evaluation. The 3D-geothermal model in combination with the requirements of the energy provider resulted in the identification of three different limestone/dolomite reservoirs -‘Dachsteinkalk’ (DK), ‘Hauptdolomit’ (HD) and ‘Wettersteindolomit’ (WD) (Figure 6).
For the location of the planned doublet, the following depth intervals (meters below ground) of the three potential thermal water reservoirs were derived from the geological 3D model. The distribution of the thickness was then derived from the depths of the modeled surface and base of the potential reservoirs.
  • Dachsteinkalk (DK): 3.091–4.011 m, thickness: 920 m
  • Hauptdolomit (HD): 4.011–4.663 m, thickness: 650 m
  • Wettersteindolomit: 4.843–5.548 m, thickness: 710 m
Taking into account regional geothermal conditions, temperature distributions were calculated using numerical model calculations, which are based on the geometry of the geological 3D model and attempted to take into account the influence of the cold water flow on the western edge of the model. Unfortunately, a profound calibration of this model was not possible due to the small number of measured values in the vicinity of the planned duplicate location. The temperature distribution along the modeled surface and base of the potential reservoirs was then exported from this model and processed in the form of temperature distribution maps for the spatial assessment of the doublet location.
According to the specifications for the numerical modelling, reservoir temperatures between 100 °C and a maximum of 170 °C are to be expected at the location of the planned doublet. According to the models, the temperature ranges for the three designated reservoirs at the location of the geothermal doublet are as follows:
  • Dachstein limestone (DK): 100 °C to 129 °C
  • Hauptdolomit (HD): 129 °C to 146 °C
  • Wettersteindolomit (WD): 151 °C to 172 °C.
On the basis of the previously carried out assessments, an overall assessment of the potentially water-bearing reservoirs at the selected location of the doublet can be derived. According to the critical parameters of reservoir depth (drilling costs), reservoir temperature and productivity, the main dolomite represents the primary target, as it satisfactorily fulfills all the requirements. The reservoirs of the overlying Dachstein limestone show poorer productivity and are already not sufficiently hot according to the expected scenario. The carbonates of the Wetterstein dolomite layers below the main dolomite have sufficient productivity and temperature levels but are more expensive to develop due to their depth. However, if the conditions in the main dolomite are insufficient, this reservoir could also be developed as an alternative “back-up” reservoir.

3.2. Hydrogeological 3D Model and Shallow Geothermal Potential

A detailed 3D subsurface model was built based on information gathered at the site. The entire drilling depths of both project drillings can be characterized by fine grained, clayey and silty, mainly dark grey sediments, which can be allocated to the marl succession of the Lower Badenian (“Baden Tegel”) of the Vienna Basin. These sediments may also contain partly interbedded gravel layers of different thickness, which were merged to one thick layer within the Baden Tegel in the 3D model (Figure 7), and presumably are a zone of increasing resistivity in depths between 80 and 100 m of the geoelectric (DC) resistivity profiles. In addition to the fine-grained material, the uppermost 10 m contain small and large fragments, which are probably carbonatic components belonging to the Quaternary. The N-S running Baden Fault displaces the Badenian sediments against Pannonian and Sarmatian depositions. All drilling sites, which are located on the west side of the fault, penetrate a series of Badenian sediments (Langhian, Middle Miocene) [8,9]. The Vöslau conglomerate belongs to facies of the basin margin with fluvial input and is composed of gravel and sand layers. Another facies of the basin margin with fluvial input is the Gainfarner breccia, which consists of dolomitic components and belongs to Lower Badenian. It can be found in VÖ 7 with a thickness of around 55 m [9]. The edge and basis of the basin consist of Triassic dolomites and limestones [10].
Furthermore, based on the information collected the shallow subsurface was assessed with regard to geothermal resources and limitations of the utilization of shallow geothermal methods (borehole heat exchangers and thermal groundwater use). Groundwater bodies, which are only expected in the uppermost 10 to 20 m, might not allow the use of open loop systems for generating heat due to local inhomogeneities and only moderate permeable conditions. No limitations are known for the installation of closed loop systems up to the planned depth of 150 m. Based on the analytical line source method a depth-averaged effective thermal conductivity of 1.77 W/(mK) was evaluated by the enhanced thermal response test. The mean underground temperature of the profile, which was measured before the test, is around 13.3 °C. Resources like the usable capacities (estimated value of 33 W/m) and energy available in place (estimated value of 93 kWh/m2a) for heating, cooling and seasonal storage of heat were estimated based on analytic calculations [9].
The 3D hydrogeological subsurface model was fed into a process model for simulating the borehole thermal energy storage (BTES). Numerical simulations were performed in order to validate the programmed geothermal module of the designed dynamic tool of the entire heating and cooling grid by using the already well-established software FEFLOW. Furthermore, a long-term simulation with a time period of 10 years was performed to determine the influence of the installations to the underground. The model was simplified with a depth of around 360 m, which comprises only the area of the Martinek military camp. The shallow quaternary groundwater body was not considered in the model due to local inhomogeneities, only moderate permeable conditions and low thicknesses. The BTES in the model consists of 96 borehole heat exchangers (double-U-tube, depth: 180 m) with a borehole distance of 4 m. In order to determine the thermal environmental impact simplified heat load capacities and massflow of the fluid into the BTES of the assumed load profiles were used as input data.
Figure 6 shows vertical sections of the subsurface model in the area of the BTES with temperature distribution in the tenth simulation year during the cooling (charging) period and during the heating (discharging) period. It can be seen that the thermal environmental impact is very limited locally. Moreover, comparing the different temperature curves which are obtained at various locations at the surface in the model when the BTES is charged and discharged, it is very clear that the thermal influence is spatially limited to a few meters and seasonal influences can be primarily observed (Figure 8). About 630 MWh/a are charged and discharged within the BTES in a yearly cycle. The BTES is not entirely balanced to zero. It is discharged more than it is charged by 12.8 MWh/a. Assessing the accumulated heat flows over the entire tenth simulation year, it can be observed that overall, there is a deviation of 12 MWh in the annual balance in the direct surrounding of the BTES, and around 13 MWh are lost at the surface.

3.3. Waste Heat Potentials at the NÖM Dairy Plant

3.3.1. Wastewater

The accumulating wastewater of the dairy comes from the wastewater streams from the CIP cleaning process of 4 lines. The measurement data and first calculations during the first analysis showed that only two lines provide sufficient water quantities. For this reason, only these lines are analysed and included in the results. The heat quantity of the wastewater was calculated with reference to a minimum cooling temperature of 25 °C. The exergetic evaluation was carried out with reference to the reference temperature of the anergy network at the different seasons.
The data of temperatures as well as flow rates could be read out from the internal process control system. The temperature curves of the wastewater flows from the CIP process were analysed over a period of more than 1.5 years, with the following Figure 9 showing one month as an example.
As seen in Figure 6, the temperatures are relatively constant, which is a consequence of the numerous, up to 200 daily rinsing processes. This is of great importance for the use of waste heat. It can also be seen that the temperature curve of wastewater stream 1 is at a significantly higher level, about 12 K higher than the wastewater temperature of wastewater stream 2.
Furthermore, the volume flow rates of both wastewater flows were evaluated over a period of 7 months. It was found that wastewater flow rate 1 is about five times as much as wastewater flow rate 2. It is also of importance here that the volume flows are relatively constant due to the numerous daily rinsing processes. Of particular interest here is the achievable waste heat recovery. The waste heat output is 5.3%, in relation to the total energy input and given as a percentage. The assumed cooling temperature is 25 °C. If the cooling temperature is lower, it is possible to recover more power. However, in this case, it is limited by the temperatures of the low-temperature heating and cooling grid and especially the limitation due to biological issues.
The averaged exergy factors of the wastewater for the different meteorological seasons, which describes the quality of the waste heat, are between 5.4% and 7.0% and also depend on the assumed seasonal temperatures of the anergy network. If the wastewater is cooled down below 25 °C, however, it must be taken into account that biological deposits can form in the wastewater pipes (biofouling). For this reason, the initially considered extraction of waste heat from wastewater was no longer pursued.

3.3.2. Off-Gas Stream of the Steam Boiler Plant

Cooling the flue gas down to 30 °C can result in condensation of about 80% of the water vapor. The waste heat potential of the off-gas condensation and sensible heat is 4% compared to the average input of gas and electricity. This would offer the possibility of preheating the combustion air for the gas burner, resulting in savings of natural gas. Thus, the heat could be used directly on site and transport, which leads to losses, would be eliminated. However, lack of space makes the installation of a combustion air preheating hardly possible.

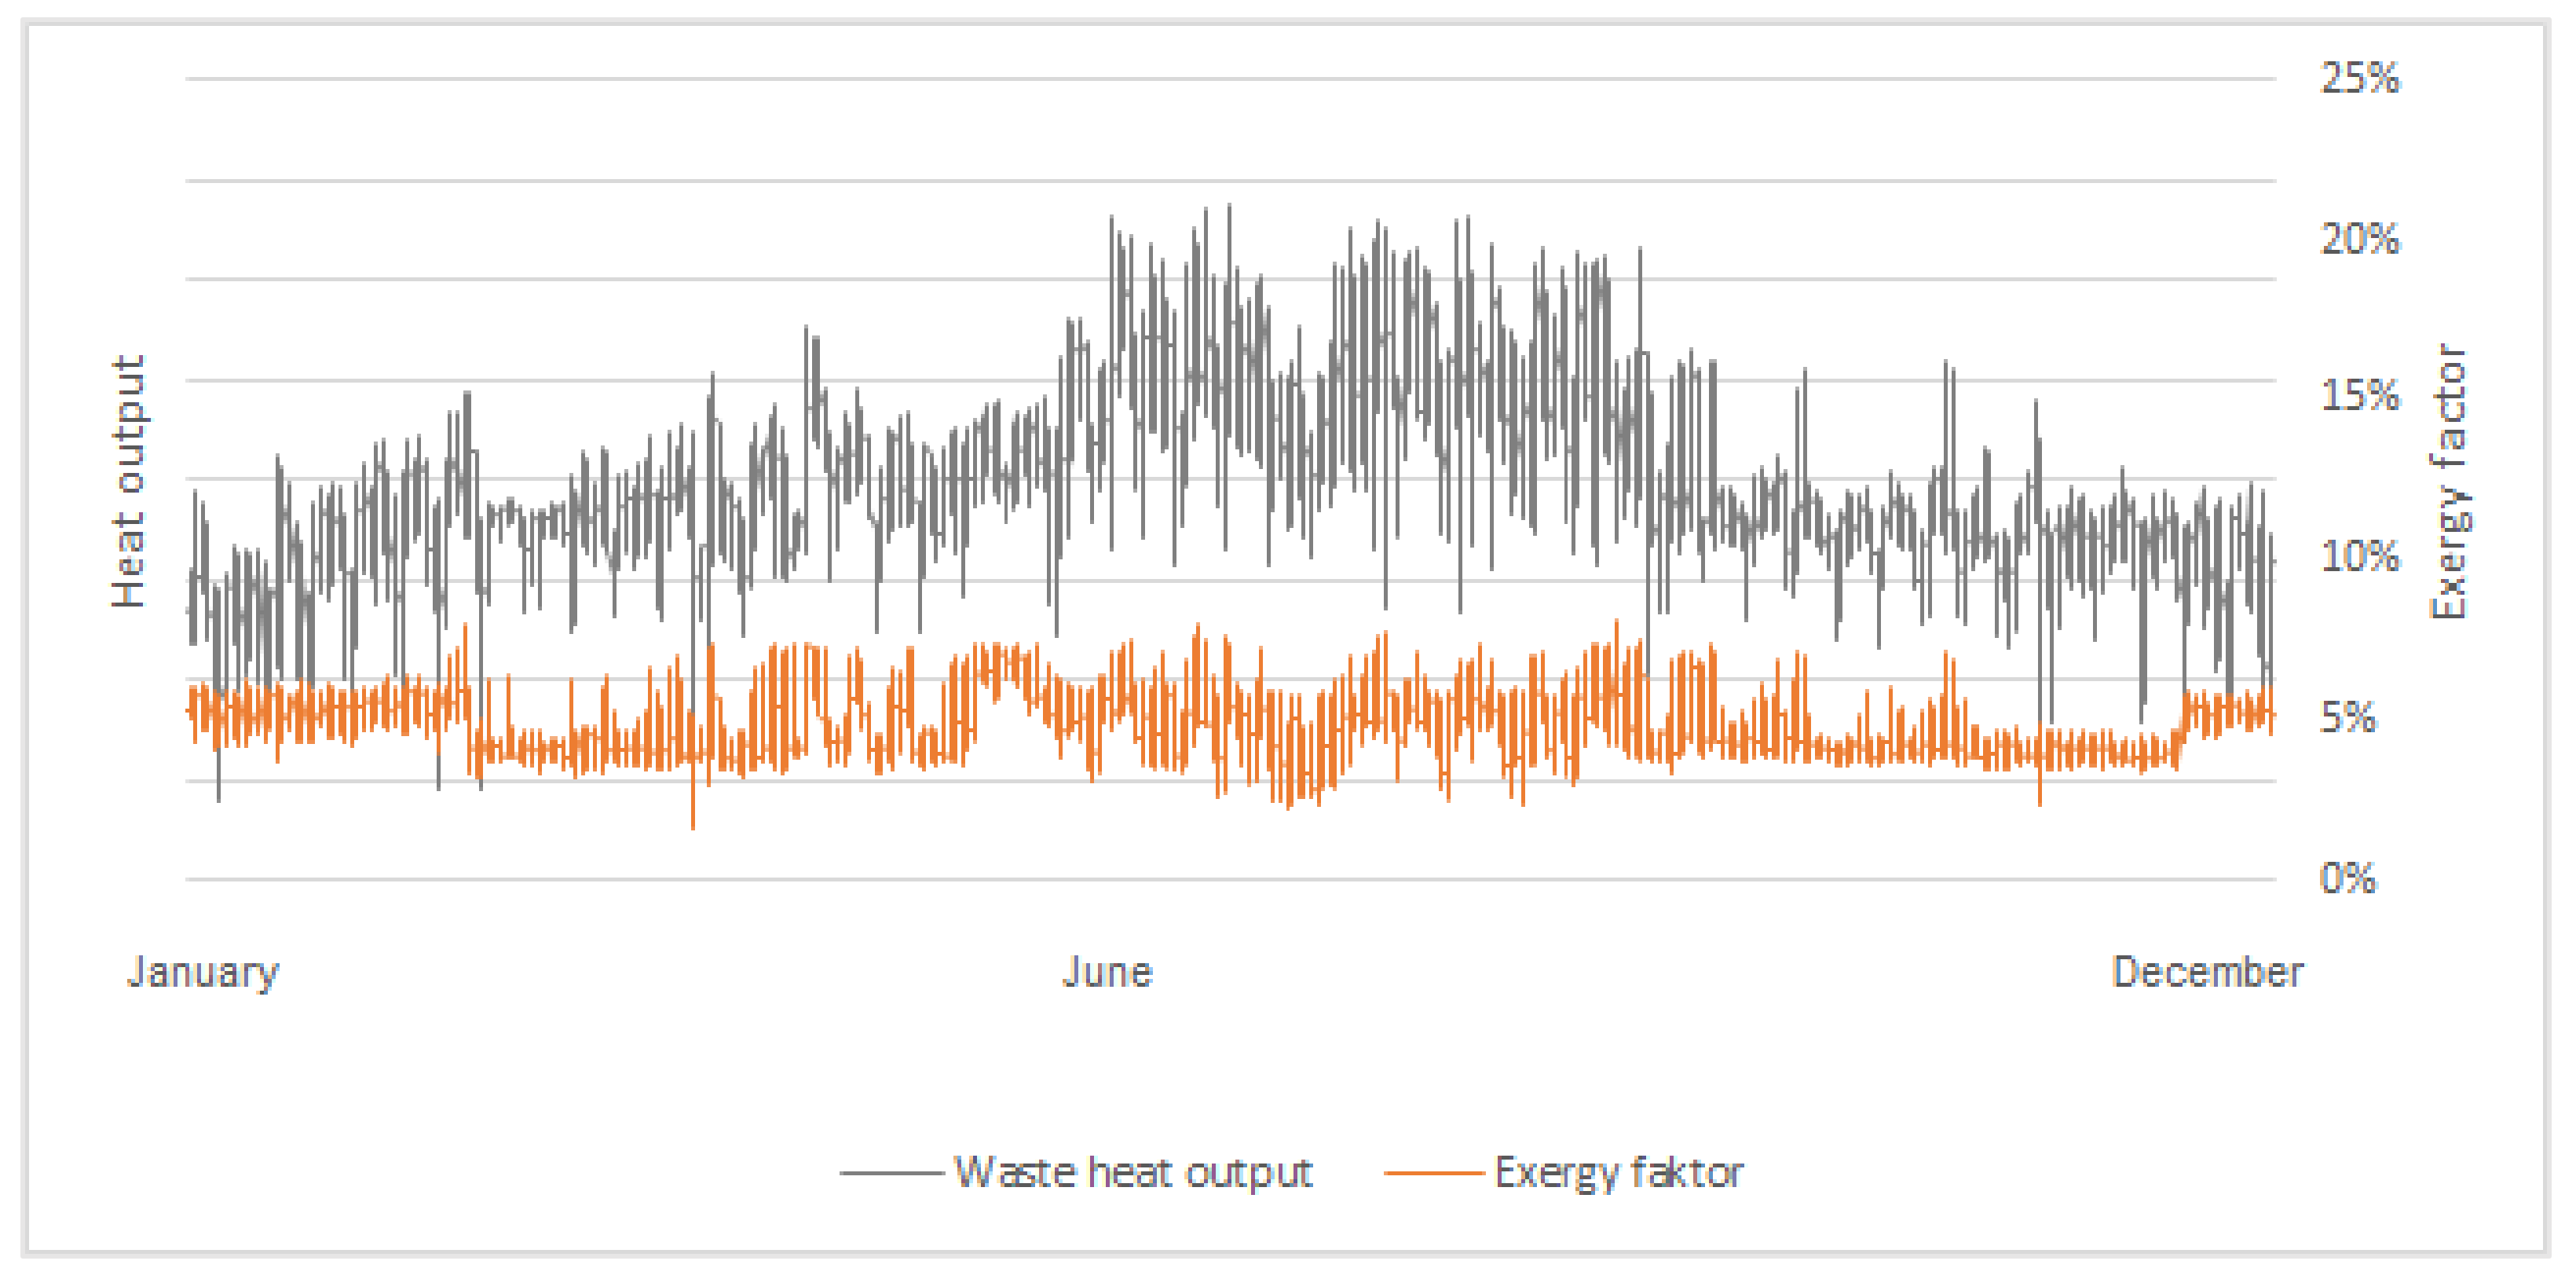
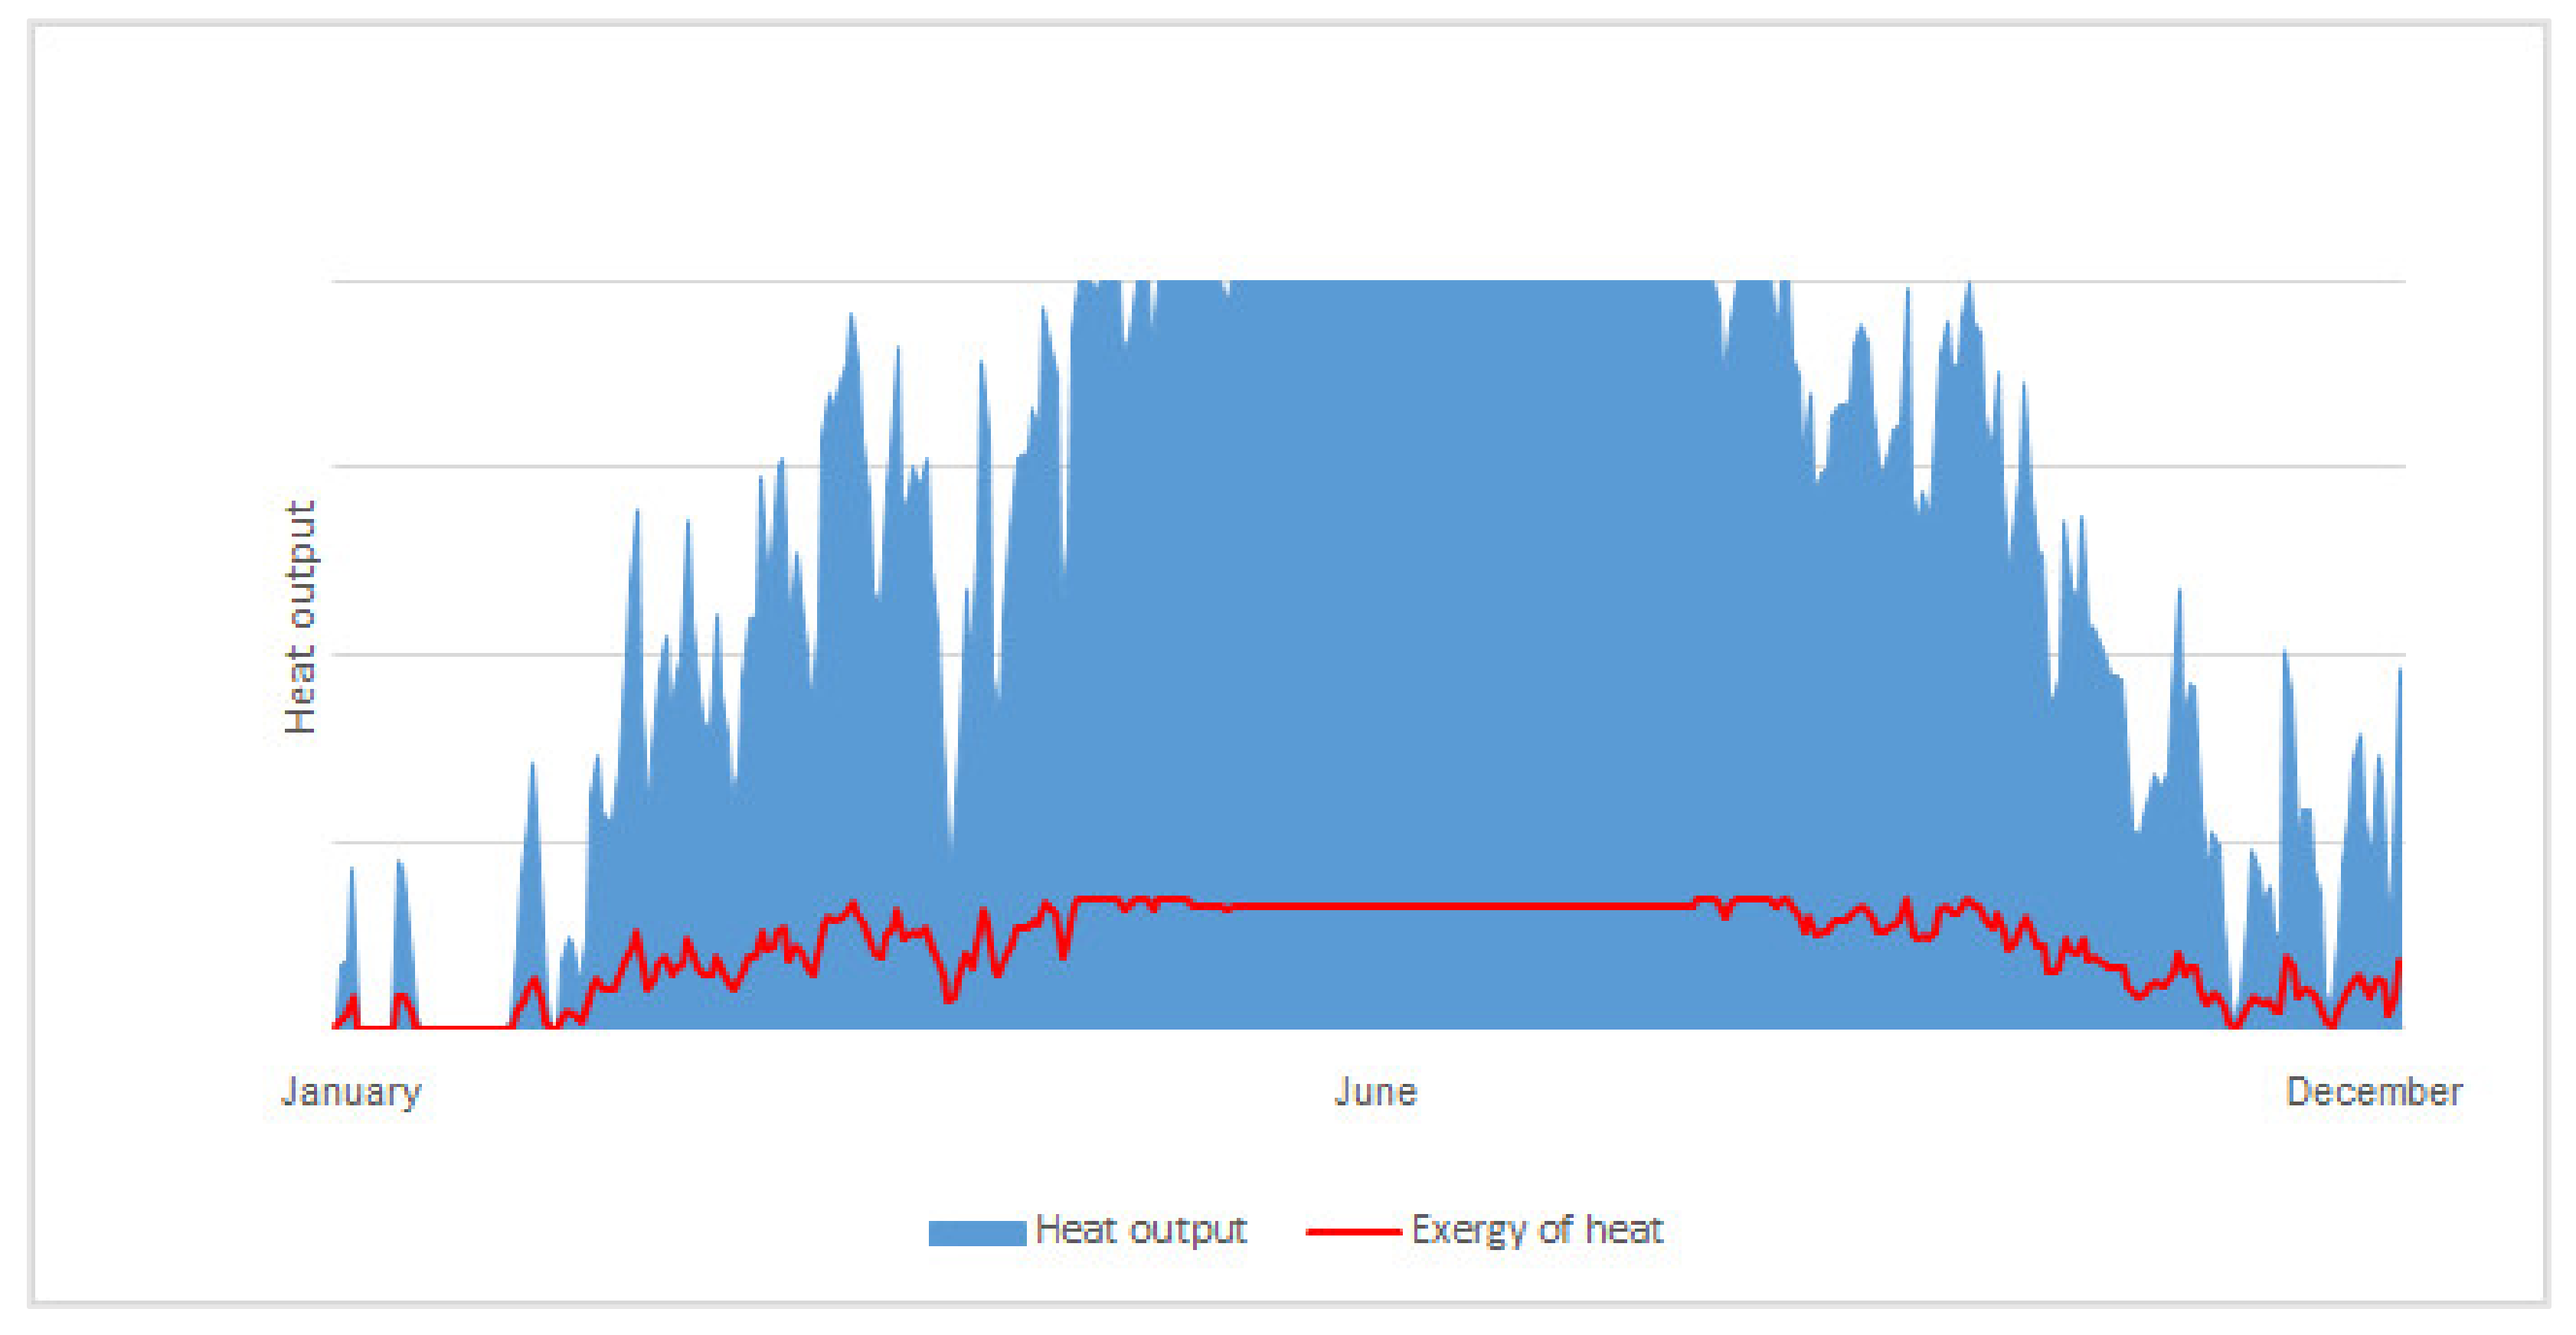
3.3.3. Waste Heat from the Drycoolers of the Cooling System for Fresh Products Logistics (FRILO)

The waste heat potential of the dry coolers is 7.3 % related to the average input of gas and electricity. Furthermore, the trend of the exergy factor of the waste heat for the year 2019 is shown, whereby the reference temperatures refer to the assumed seasonal temperatures of the anergy network (Figure 10).
The flow measurement was operated further until November 2020 and a higher ratio factor fQ,FRILO between heat output and electrical power input could be determined, which allows to expect an even greater amount of waste heat. The reason for this is probably the improved sealing of the refrigerated hall of the fresh product logistics, which reduces the influx of humid outside air and thus fewer defrosting processes.

3.3.4. Waste Heat Potential from the Heat Recovery of the Stratified Storage Tank

The storage tank is loaded with waste heat from the low-pressure compressed air systems and product chillers and mainly supplies the office buildings with heating energy in winter. The time-resolved trend of the freely available heat output and the exergetic share for the year 2017 are shown in Figure 11. This results in an average yearly waste heat of 1.1 % related to the average input of gas and electricity.
The plateau in Figure 11 is caused by the limited capacity of the existing heat exchanger for heat extraction from the heat storage tank, i.e., there is more heat in the storage than the technical infrastructure is able to extract. The profile of the exergy follows that of the available heating power. Due to the constant power of the heat exchanger, which is available during the summer months, the exergy is also kept at a constant level. The exergy factor, which describes the quality of the waste heat, however, remains more or less constant throughout the year due to the constant storage temperature.

3.3.5. Waste Heat from the Cooling Circuit of High-Pressure Compressed Air Generation

As mentioned before, the the waste heat is generated by the two Atlas Copco high-pressure compressors type AC Crepelle D46 and one LMF EcoPET high-pressure compressor. This results in an average waste heat output of 1.6 % in relation to the total energy input of the dairy. Immediately after the air is compressed, 53.2% of the energy is in the compressed air (pressure energy and heat). The remaining 46.8% of the energy leaves the compressor in the form of waste heat, and due to the present temperatures of 25 to 50 °C, this waste heat can be evaluated with a quality in the form of the exergetic factor of 6 to 11%. In relation to the total energy input of the dairy, 1.6% of the energy can be recovered here.

4. Discussion

4.1. Assessment of Deep Geothermal Potential

The overall assessment of suitable deep geothermal reservoirs with regard to fulfilling the requirements by the energy provider with regard to the temperature level (>125 °C) and the required output (>10 MWth) resulted in three possible reservoirs (Table 2).
According to the critical parameters of reservoir depth, temperature and productivity, the ‘Hauptdolomit’ reservoir represents the primary target, as it satisfactorily fulfils all the requirements. The reservoirs of the overlying Dachstein limestone show poorer productivity and are already not sufficiently hot according to the expected scenario. The carbonates of the Wetterstein layers below the main dolomite have sufficient productivity and temperature levels but are more expensive to develop due to their depth. However, if the conditions in the Hauptdolomit are insufficient, this reservoir could also be developed as an alternative “back-up” reservoir.
Since the first assessments of the deep geothermal resources for providing heat to the Baden district heating grid and the NÖM dairy plant, the technology of high-temperature heat pumps has evolved substantially. Modern high-temperature heat pumps can yield temperatures up to 160 °C and some prototypes even higher. This makes it increasingly interesting for the high-temperature industry for the decarbonization of their processes. The recent developments in gas and oil prices accelerates the willingness of the industry and communities to use renewable sources in their grids.

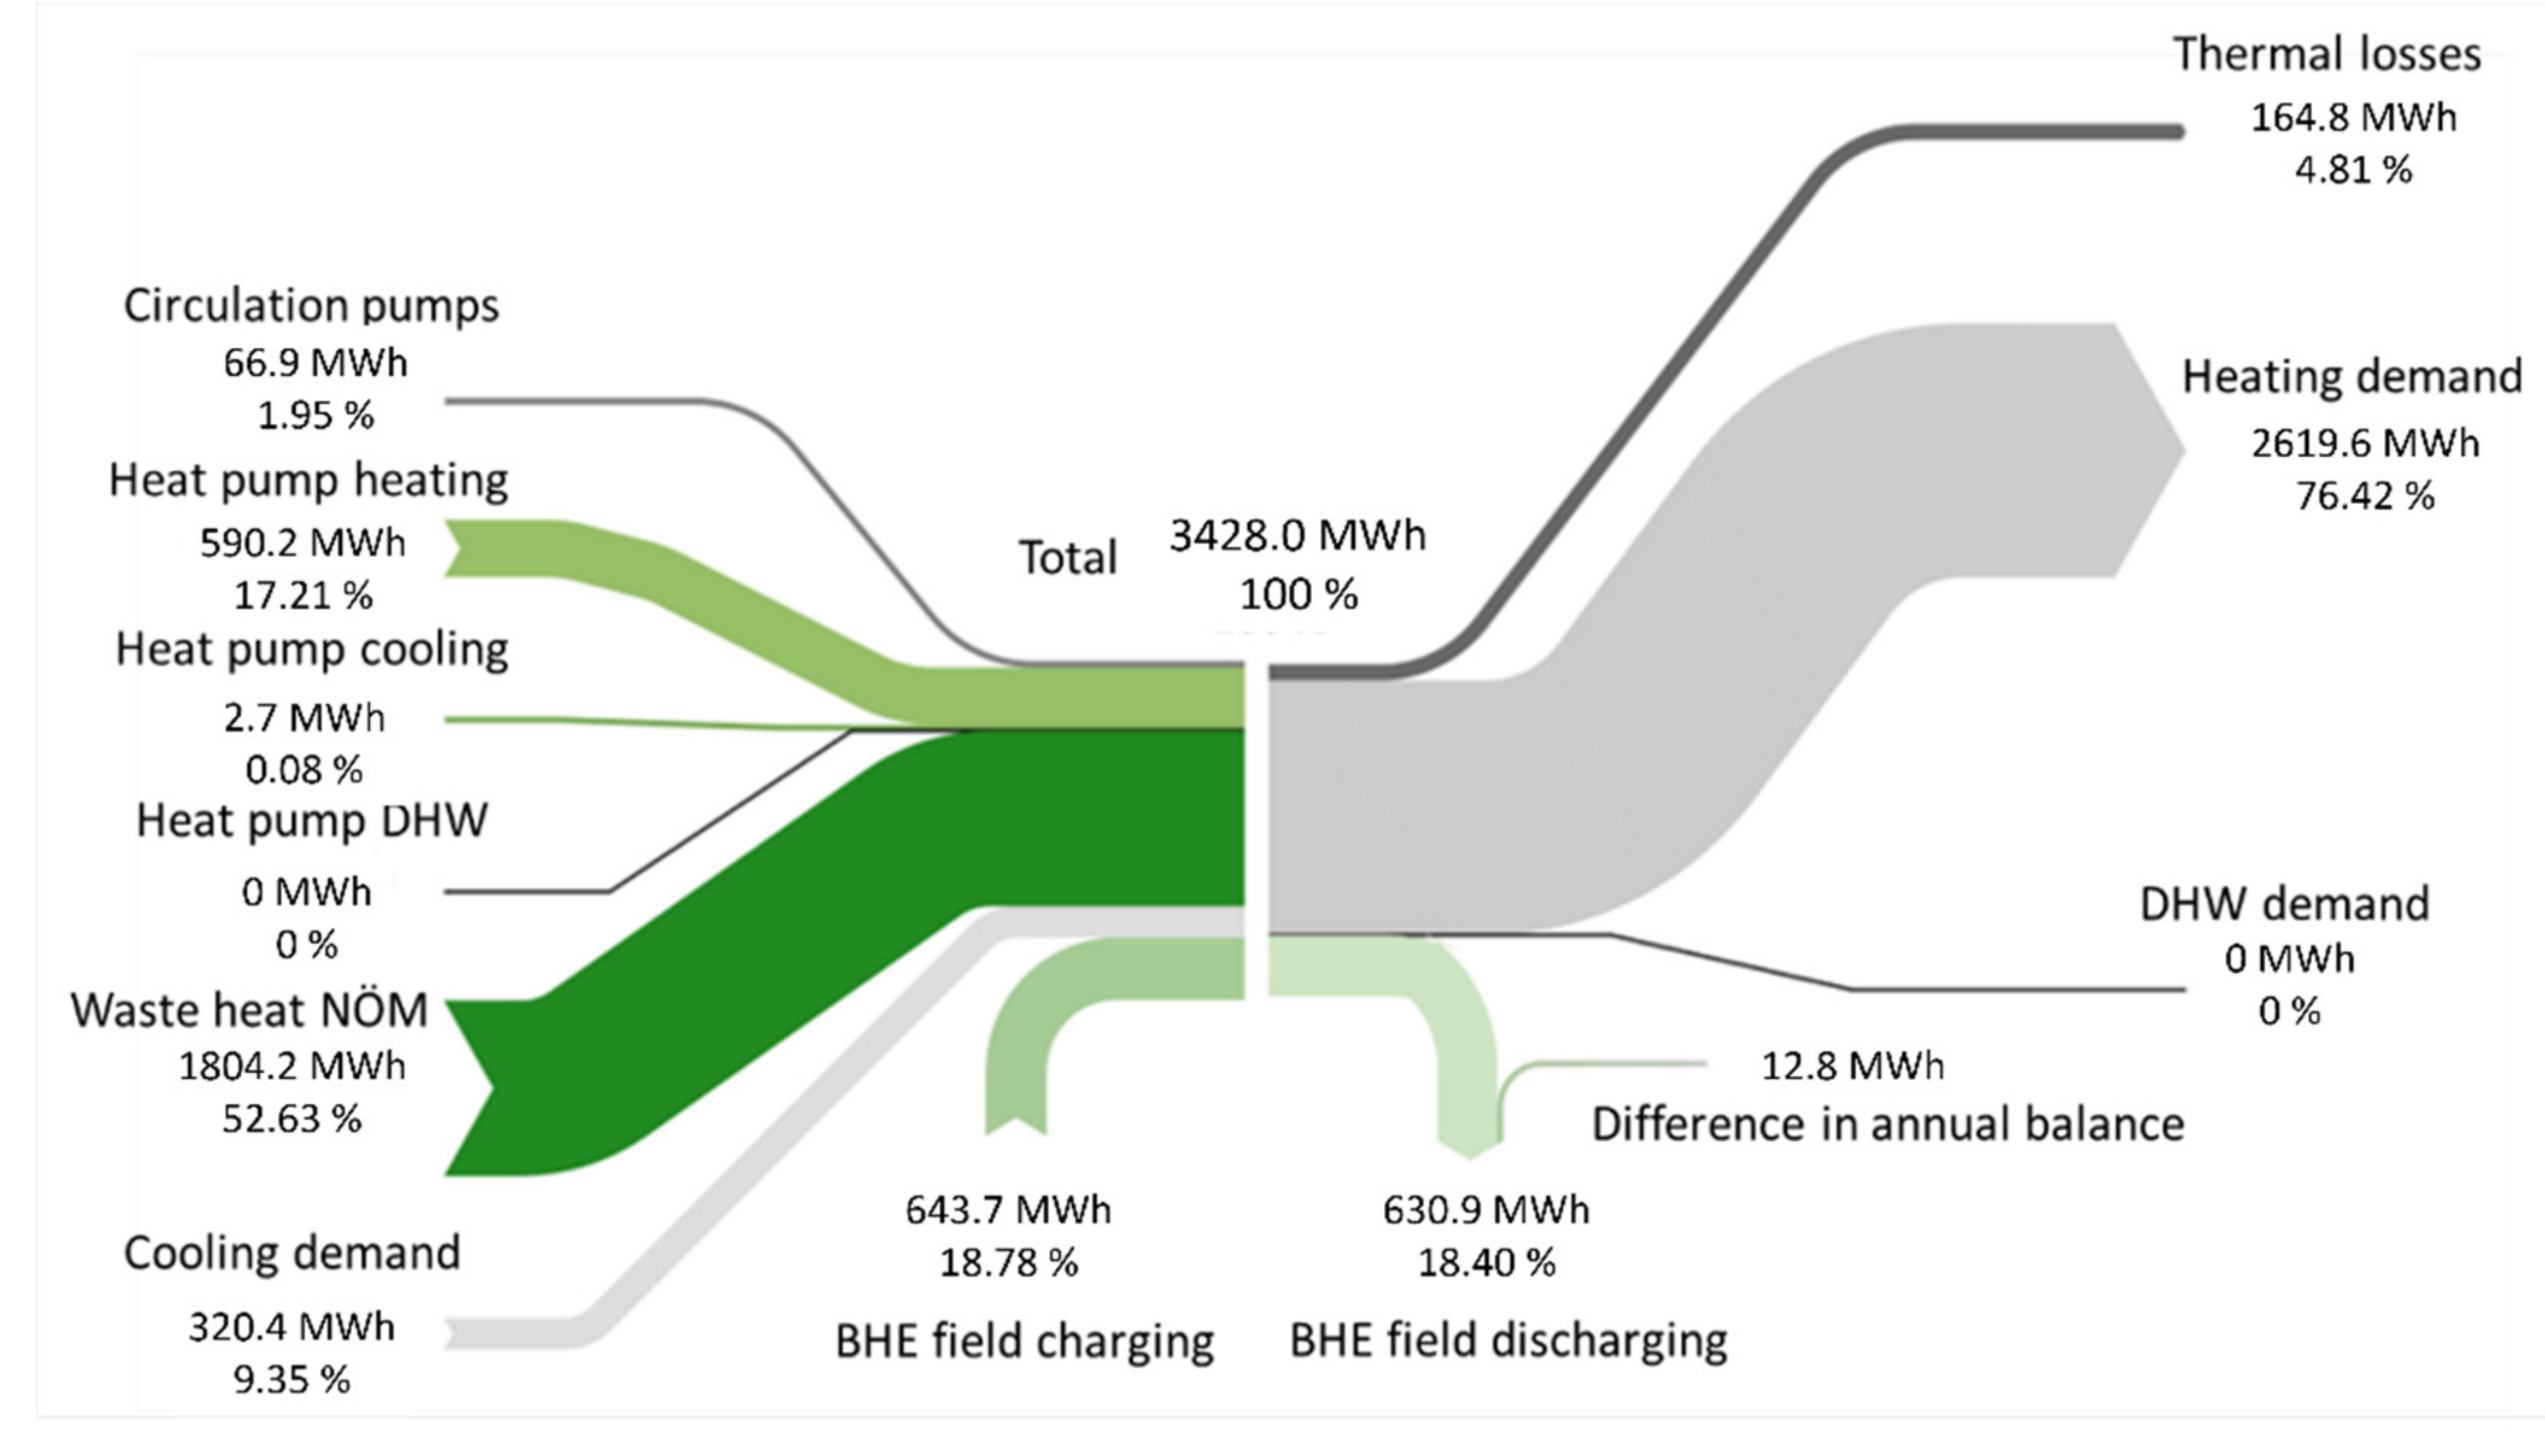
4.2. Dimensioning of the Borehole Heat Exchanger Field for Seasonal Thermal Storage

The assessment of the shallow geothermal resources showed favourable conditions for the installment of a BHE field for seasonal thermal storage in the LTHC grid. The Sankey-diagram in Figure 12 shows all energy flows from the heat sources to the heat sinks with the BHE field as storage.
The LTHC grid at the former military camp site with listed buildings has a total energy demand of 3428 MWh per year. The simulation of the BHE field resulted in 96 BHE (Double-U) with 180 m depth for a dis-/charging capacity of 643.7 MWh and 20 decentral heat pumps in the buildings. The BHE field operates quite balanced with only 12.8 MWh of difference in the annual balance. This difference can be minimized in real-life operation with the optimization of the control strategy in operation.

4.3. Waste Heat Potentials from the NÖM Dairy Plant

The analysis of the NÖM dairy has shown that about 19 % of the final energy used (gas and electricity) can be decoupled as low-temperature heat. This is much more than required to supply the LTHC grid. The exact breakdown of the individual plants with temperature range and exergetic share in the respective waste heat flow can be seen in Table 3.
Eventually, this waste heat source was selected to supply the LTHC grid conceptually in the project because both a constant, sufficient supply of energy and a relatively short connection to the LTHC grid are possible.

5. Conclusions

Our results have shown that at the Baden location the whole cascade from deep geothermal for the Baden district heating grid and the NÖM dairy plant and waste heat from NÖM’s processes as residual heat for the LTHC grid in the neighbouring former military plant with geothermal shallow geothermal storage can be realized. With the involvement of the relevant stakeholders, we wish for the realization of—in the best case—the whole geothermal cycle for the site. Two central prerequisites for the realization are the commitment of the local energy provider and/or investors for the deep geothermal drilling and the refurbishment and re-development of the listed “Martinek-Kaserne” buildings.

Author Contributions

Conceptualization, E.H.; funding acquisition, E.H.; investigation, E.H., A.H. and G.G.; methodology, E.H., V.T., A.H. and G.G.; project administration, E.H.; supervision, E.H.; writing—original draft, E.H.; writing—review & editing, V.T., A.H. and G.G. All authors have read and agreed to the published version of the manuscript.

Funding

This research was funded by Austrian Research Promotion Agency (FFG), grant numbers 83867 (Project GeoHeat.at) and 868655 (Project SANBA).

Institutional Review Board Statement

Not applicable.

Informed Consent Statement

Not applicable.

Data Availability Statement

Data are published in the final reports of the projects. Project GeoHeat.at: https://energieforschung.at/wp-content/uploads/sites/11/2020/12/Publizierbarer-Endbericht-GeoHeat.pdf (accessed on 18 May 2022). Project SANBA: final report will be published in May/June 2022.

Acknowledgments

The authors wish to thank our project colleagues from TU Vienna for providing us with the Sankey-diagram. Furthermore, we wish to thank Robin Friedrich from AIT with the help of finishing this manuscript.

Conflicts of Interest

The authors declare no conflict of interest. The funders had no role in the design of the study; in the collection, analyses, or interpretation of data; in the writing of the manuscript, or in the decision to publish the results.

References

  1. Lund, H.; Werner, S.; Wiltshire, R.; Svendsen, S.; Thorsen, J.E.; Hvelplund, F.; Mathieses, B.V. 4th Generation District Heating (4 GDH): Integrating smart thermal grids into future sustainable energy systems. Energy 2014, 68, 1–11. [Google Scholar] [CrossRef]
  2. Lund, R.; Østergaard, D.S.; Yang, X.; Mathiesen, B.V. Comparison of Low-temperature District Heating Concepts in a Long-Term Energy System Perspective. Int. J. Sustain. Energy Plan. Manag. 2017, 12, 5–18. [Google Scholar]
  3. Rögl, F.; Ćorić, S.; Harzhauser, M.; Jimenez-Morenos, G.; Kroh, A.; Schultz, O.; Wessely, G.; Zorn, I. The Middle Miocene Badenian stratotype at Baden-Sooss (Lower Austria). Geol. Carpathica 2008, 59, 367–374. [Google Scholar]
  4. Elster, D.; Goldbrunner, J.; Wessely, G.; Niederbacher, P.; Schubert, G.; Berka, R.; Philippitsch, R.; Hörhan, T. Erläuterungen zur geologischen Themenkarte Thermalwasser in Österreich 1:500.000; Geologische Bundesanstalt: Wien, Austria, 2016; 296p. [Google Scholar]
  5. Wessely, G. Geologie der Österreichischen Bundesländer: Niederösterreich; Geologische Bundesanstalt: Wien, Austria, 2006; 416p. [Google Scholar]
  6. BMLFUW; Abteilung IV/3 Nationale und Internationale Wasserwirtschaft. Erhebung der Wassergüte in Österreich gemäß Gewässerzustandsüberwachungsverordnung (GZÜV) BGBl. I Nr. 479/2006; Ämter der Landesregierungen: Wien, Austria, 2006. [Google Scholar]
  7. PVGIS Photovoltaic Geographical Information System. Available online: https://joint-research-centre.ec.europa.eu/pvgis-photovoltaic-geographical-information-system_en#AT (accessed on 8 April 2022).
  8. Wagreich, M.; Pervesler, P.; Kathun, M.; Wimmer-Frey, I.; Scholger, R. Probing the underground at the Badenian type locality: Geology and sedimentology of the Baden-Sooss section (Middle Miocene, Vienna Basin, Austria). Geol. Carpathica 2008, 59, 375–394. [Google Scholar]
  9. Wessely, G.; Ćorić, S.; Rögl, F.; Draxler, I.; Zorn, I. Geologie und Paläontologie von Bad Vöslau (Niederösterreich). Jb. Geol. 2007, 147, 419–448. [Google Scholar]
  10. Gegenhuber, N. Interpretation der Faziellen und Hydrogeologischen Verhältnisse des Raumes Baden/Bad Vöslau Aufgrund von Bohrlochmessungen und Seismischen Profilen. Magisterarbeit; Montanuniversität Leoben: Leoben, Austria, 2007. [Google Scholar]
Figure 1. Satellite view of the “Martinek Kaserne” and the NÖM dairy plant (adapted from Google Earth).
Processes 10 01125 g001
Figure 2. Locations of water facilities (irrigation system, groundwater observation well and heating facility) and landfills recorded in the water register, groundwater observation wells from the hydrographic service of Lower Austria (eHYD), drilling sites ‘Josefsquelle’, VÖ 6 and VÖ 7, and locations of the project drillings (SANBA Drilling 1 and 2) at the site of the NÖM plant.
Processes 10 01125 g002
Figure 3. Overview of the identified waste heat potentials—from left to right: (a) Off-gas stream of the steam boiler plant, (b) wastewater from the cleaning processes, (c) waste heat from fresh products logistics, (d) waste heat from high pressure compressed air, (e) waste heat from water storage tanks.
Processes 10 01125 g003
Figure 4. Ultrasonic flow measurement at the cold brine line (left) and the warm brine line (right).
Processes 10 01125 g004
Figure 5. Measurements on the HDD systems: Atlas Copco (left)—LMF (right).
Processes 10 01125 g005
Figure 6. The result of the 3D-modelling of the complex geologic situation in the Baden area. The identified possible drilling site is shown with the position and depth of the three potential reservoirs—Dachsteinkalk (DK), Hauptdolomit (HD) and Wettersteindolomit (WD).
Processes 10 01125 g006
Figure 7. Cross section 1 (above) and 2 (below) of the elaborated hydrogeological 3D model.
Processes 10 01125 g007
Figure 8. Vertical sections of the subsurface model in the area of the BTES in the tenth simulation year are shown above at two different times: During the cooling (charging) period (top left) and during the heating (discharging) period (top right). Temperature curves at various locations in the model when the BTES is charged and discharged are shown (below).
Processes 10 01125 g008
Figure 9. Temperature curves of the two waste water streams from the CIP processes from two different production lines over a period of one month. The fluctuations come from the up to 200 daily rinsing processes. The dotted lines show the linear trend of the two temperature curves.
Processes 10 01125 g009
Figure 10. Trend of heat output and exergy factor of fresh products logistics FRILO for the year 2019. The higher temperature in summer must be generated by the chillers so that heat can also be dissipated into the ambient air during the warmer season. The exergy factor describes the quality of the waste heat.
Processes 10 01125 g010
Figure 11. Illustration of the available heating power from the storage tank and its exergetic part. The time-resolved power curve is formed from the difference between the maximum power of the heat exchanger for heat decoupling from the storage tank and the heating demand of the offices, i.e., there is more heat in the storage than the existing technical infrastructure is able to extract. The exergy describes the quality of the waste heat.
Processes 10 01125 g011
Figure 12. Sankey-diagram with energy flows from heating sources to heating sinks with the simulated BHE field as seasonal thermal storage (BTES) (with friendly permission from our project partners from TU Vienna).
Processes 10 01125 g012
Table 1. Requirements for the potential reservoir from the local energy provider.
Temperature [°C]Mass Flow [l/s]
Min. temperature in reservoir125–135-
Min. temperature at wellhead125-
Reinjection temperature65-
Required mass flow-57
Table 2. Summary of assessment of potential thermal water reservoirs for the Baden location.
Reservoir Depth Below Surface [m] Prospected Temperatures [°C] Estimated Probability
of Success
Dachsteinkalk3.091–4.011 100 °C–129 °C 30%
Hauptdolomit 4.011–4.663 129 °C–146 °C 60%
Wetterstein Dolomit 4.843–5.548 151 °C–172 °C 70%
Table 3. Low temperature waste heat compared to energy input (gas and electricity), detailed results broken down by process.
PlantLow Temperature Waste Heat
Compared to Energy Input [%]
Temperature Level [°C]Exergy Share of Waste Heat [%]
Cooling system product logistics7.323–403–8
High pressure air generation1.625–506–11
Steam boiler4.060–7013–17
Heat recovery storage tank1.170–7516–19
Wastewater (reference 25 °C)5.327–345–7
Total19.4
Publisher’s Note: MDPI stays neutral with regard to jurisdictional claims in published maps and institutional affiliations.

