Article

Study of a Hydrophilic Healing-Promoting Porcine Acellular Dermal Matrix

1
Key Laboratory of Leather Chemistry and Engineer of Ministry of Education, Sichuan University, Chengdu 610065, China
2
National Engineering Research Center of Clean Technology in Leather Industry, Sichuan University, Chengdu 610065, China
*
Authors to whom correspondence should be addressed.
Processes 2022, 10(5), 916; https://doi.org/10.3390/pr10050916
Submission received: 10 April 2022 / Revised: 2 May 2022 / Accepted: 4 May 2022 / Published: 6 May 2022

Abstract

:
Sodium hyaluronate (SH) is recognized as the strongest natural humectant, since it contains a large number of hydroxyl and carboxyl groups in its structure, and can absorb 1000 times its own weight of water. The porcine acellular dermal matrix (pADM) has been widely used in biological materials for its biological activities, such as promoting cell proliferation and promoting wound healing. Enhancing the hydrophilic and moisturizing properties of the pADM is expected to further improve its ability to promote wound healing. However, there are no strong chemical bonds between SH and pADM. Therefore, SH was oxidized by sodium periodate in this study, and was further used to cross-link it with pADM. The microstructure, hydrophilicity, moisture retention, degradation and cytotoxicity of pADM cross-linked with different oxidation degrees of oxidized sodium hyaluronate (OSH) were studied. The results show that OSH-pADM maintained the secondary structure of natural collagen, as well as the good microporous structure of native pADM after cross-linking. With increasing oxidation degree, the surface hydrophilicity and moisture retention capacities of OSH-pADM increased; among them, OSH-pADM cross-linked with 40% oxidation degree of OSH was found to have the strongest moisture retention capacity. The hygroscopic kinetics at 93% RH were conformed to the second-order hygroscopic kinetics equation, indicating that the hygroscopic process was controlled by chemical factors. The degradation resistance of OSH-pADM also increased with increasing oxidation degree, and the cytotoxicity of OSH-pADM was acceptable. The in vivo full-thickness wound healing experiments showed that OSH-pADM had an obvious ability to promote wound healing. It can be speculated that OSH-pADM, with its good hydrophilic and moisturizing properties, physicochemical properties and biocompatibility, has great potential for facilitating wound repair.

1. Introduction

It is necessary to use a wound dressing to protect the wound surface from secondary damage caused by external bacteria and mechanical stress, and to promote rapid wound healing. A study by Winter et al. demonstrated that wound healing can progress 50% faster in a moist environment than under dry conditions; at the same time, faster healing can alleviate the patient’s pain and reduce the patient’s medical expenses [1]. Therefore, the hydrophilic properties and moisturizing ability of the wound dressing are particularly important. pADM is obtained by removing the epidermis and intradermal immunogenic cellular components from the dermal tissue of pigs, using a series of physical, chemical and biological methods, and retaining extracellular matrix components and structures such as collagen. This kind of collagen material with a three-dimensional structure is currently one of the research hotspots in the fields of tissue repair and biomedical materials. As pADM has good biocompatibility, relatively good mechanical properties, and no rejection reaction, it is often used for treating burn (scalded) wounds, skin donor wounds, etc., to promote wound healing [2,3,4]. pADM is mainly composed of collagen, and contains hydrophilic groups such as carboxyl, amino and hydroxyl groups. However, compared with hydrogel dressings, its hydrophilicity and moisturizing ability are still insufficient. Conventional cross-linking modifications can effectively improve the mechanical properties, physical and mechanical capabilities, and resistance to degradation of the pADM matrix [2,5]; however, the modifications will block the active polar groups in pADM, often resulting in a decrease in hydrophilicity.
Hyaluronic acid (HA) is a linear polymeric acid mucopolysaccharide, which is composed of D-glucuronic acid (GlcA) and N-acetylglucosamine (GlcNAc), alternately linked by disaccharide units. SH is the sodium salt of HA, which is water-soluble and more stable than HA. Similarly to HA, SH contains a large number of hydroxyl and carboxyl groups in its structure, and can absorb up to 1000 times its own weight of water [6,7,8]. In aqueous solution, the molecular chain of SH presents an expansion random line cluster structure, and intertwines with each other to form a continuous three-dimensional network structure. Water molecules are fixed in the network formed by SH molecules via hydrogen bonds, making the water less easy to lose. SH has a special moisturizing effect, and is currently recognized as the most powerful natural moisturizing agent with water retention ability [9,10]. In addition, its moisturizing performance is positively correlated with its concentration and molecular weight. As a result of its excellent properties, SH has been widely used in biomedical materials such as wound dressings, hemostatic hydrogels and cosmetic materials, which can rapidly absorb blood and wound exudate, promote wound healing, and reduce excessive fibrosis and scar generation [11,12,13,14,15,16,17].
It can be seen from the above that if SH is used to modify pADM, the hydrophilicity and moisturizing performance of the pADM scaffold may be improved. However, directly impregnating pADM with SH to adsorb SH on the surface of the pADM can improve the hydrophilicity of pADM over the short term; however, due to the lack of effective chemical binding between SH and the pADM, it results in loss of SH easily, and the moisture retention of pADM will not last long. Finding a means to produce effective chemical combinations between pADM and SH is the key to improving the long-lasting moisture retention of pADM. Therefore, based on our previous research on pADM cross-linked by dialdehyde polysaccharide of different types [18], it is proposed to use sodium iodate to oxidize SH and generate aldehyde groups with reactive activity, resulting in the formation of strong covalent binding between SH and pADM, in order to possibly graft SH onto pADMs. Cross-linking can greatly improve the physicochemical properties of the pADM, and the introduction of hydrophilic groups can directly improve the hydrophilicity of the scaffold; when combined with the other advantages of both, it is expected that we can obtain pADM scaffolds with excellent hydrophilic and moisturizing properties.
At present, there are few studies focused on the hydrophilic and moisturizing abilities of modified pADMs. In this study, O-dihydroxyl in SH was oxidized into aldehyde groups by the oxidation of sodium periodate to obtain oxidized SH (OSH). The aldehyde groups produced can cross-link with the active amino groups on the pADM, so that SH with excellent moisturizing properties can be grafted onto pADMs, and a large number of hydrophilic groups, such as hydroxyl and carboxyl groups, can be introduced. Subsequently, the physicochemical properties, hydrophilic and moisturizing abilities, and biocompatibility of OSH cross-linked pADM scaffolds with different oxidation degrees were investigated in this study. The in vivo repair of full-thickness skin defects was verified in order to obtain a pADM wound dressing with good hydrophilic and moisturizing properties.

2. Experiments and Methods

2.1. Materials

Porcine acellular dermal matrix (pADM) (biochemical grade) was exclusively provided by the Jiangyin Benshine Biological Technology Co., Ltd. (Jiangyin, China), according to the authorization of our corresponding patent (ZL200410022506.9). Sodium hyaluronate (Pharmacopoeia) was purchased from Beijing Baiaolaibo Technology Co., Ltd. (Beijing, China). Unless otherwise noted, all chemicals and reagents were purchased from Sigma-Aldrich (St. Louis, MO, USA).

2.2. pADM Treatment

Firstly, 2 g of SH was accurately weighed and dissolved in 100 mL deionized water in a conical flask. After SH was completely dissolved, sodium iodate was added according to mole ratios of 10%, 20%, 40% and 60%. SH was oxidized at 4 °C for 48 h under dark conditions to prepare oxidized SH (OSH), and the reaction was terminated by adding 5 g of ethylene glycol. After dialysis, the SH was freeze-dried to obtain oxidized sodium hyaluronate (OSH) with different degrees of oxidation, which were recorded as OSH10%, OSH20%, OSH40% and OSH60%. Subsequently, 1 g of pADM was immersed into the Na2CO3-NaHCO3 buffer solution at pH 9.4; OSH10%, OSH20%, OSH40%, and OSH60% with 5% mass of pADM were added. After reacting for 16 h at 37 °C, excess OSH solution was drained away, and the OSH-pADM was washed thoroughly using ultrapure water three times, each time for 30 min at 37 °C. OSH-pADM was obtained by freeze-drying, and the preparations were denoted as 10%-OSH-pADM, 20%-OSH-pADM, 40%-OSH-pADM and 60%-OSH-pADM.

2.3. FTIR Spectra Measurements

Secondary structure analysis of OSH-pADM was performed on an FTIR spectrophotometer (SpectrumOne, PerkinElmer, Inc., Waltham, MA, USA) by scanning the compressed blend flake of KBr and samples at a ratio of approximately 1:100 (mg/mg). All spectra were collected by transmission mode at an interval of 4 cm−1 and recorded 32 times in a wavelength range of 4000–400 cm−1. The measurements were carried out at room temperature and at a humidity of around 65%.

2.4. Scanning Electron Microscopy (SEM)

The morphology of the different amounts of OSH-pADM was observed using a scanning electron microscope (SEM, Hitachi S3000N, Hitachi, Ltd., Tokyo, Japan). All samples were sputter coated with gold and imaged at an accelerating voltage of 5 kV.

2.5. X-ray Diffraction Analysis (XRD)

Crystalline structure analysis was conducted using an X’Pert X-ray diffractometer (Philips, Holland, The Netherlands) with Cu Ka-radiation. The radiation wavelength used was 0.154 nm, the 2θ range was 5~50 °C, and the scanning speed was 2 °C/min.

2.6. Differential Scanning Calorimetry (DSC)

DSC analysis was conducted using a Netzsch DSC 200 PC to characterize the thermal stability of the scaffolds. Briefly, 3~5 mg of pADM scaffolding were loaded into a DSC aluminum pan, while an empty aluminum pan was used as a reference. The samples were then scanned over a temperature range from 20 to 150 °C in nitrogen, at a heating rate of 5 K/min. The flow rate of N2 was 60 mL/min.

2.7. Thermogravimetric Analysis (TG)

Approximately 3~5 mg of pADM scaffolding were pressed into a cylindrical holder, and TG analysis was performed on a thermal analyzer (Netzsch TG 209, Selb, Germany) from 50 to 700 °C at a heating rate of 20 K/min. All measurements in the instrument were conducted under an atmosphere of nitrogen.

2.8. In Vitro Enzymatic Degradation

In order to characterize the degradation properties of the material, dry pADM scaffolds were cut into quarter-sized pieces, weighed (denoted as W1), then soaked in collagenase type I/phosphate-buffered saline (PBS) solution (5 U/mL). Finally, 3 mL of collagenase/PBS solution were added to each 1 mg of the matrix sample for 5 days at 37 °C. The collagenase/PBS solution was changed every two days. In order to measure the degradation rate, samples were removed from the collagenase/PBS solution at days 1, 3 and 5, then rinsed with PBS followed by distilled water. The samples were lyophilized and weighed (denoted W2). The degradation rate was calculated using the following formula:
Degradation rate (%) = (W1 − W2)/W1 × 100

2.9. Hydrophilicity Test

The hydrophilicity test was carried out by measuring the moisture rate, the water absorption rate, the capillary water absorption rate and the water contact angle of the samples.
The moisture content, water absorption and capillary water absorption were measured with reference to the method of Chen [5].
Moisture   rate   ( % ) = W 1 W 0 W 0 × 100
Water   absorption   rate   ( % ) = W 1 W 2 W 0 × 100
Capillary   water   absorption   rate   ( % ) = W 2 W 3 W 3 × 100
Among them, W0 is the initial weight, W1 is the weight after moisture absorption, W2 is the weight after swelling, and W3 is the weight after drying.
Each test was conducted on five samples and their averages were calculated.
The surface water contact angles (WCA) of the samples were measured with a goniometer (data physics OCA-H200, Stuttgart, Germany) at room temperature. Briefly, 20 μL per drop of distilled water was carefully deposited onto the surfaces of the samples; angles were measured on five different regions of each surface and averaged.

2.10. Method for Determination of Hygroscopic Kinetics

The dryer containing saturated Na2SO4 aqueous solution (Rh93%) was placed in a constant temperature environment of 20 °C, and a certain amount of dry OSH-pADM samples were accurately weighed and placed in the dryer. The sample was accurately weighed every 2 h. According to the quality difference of the samples at different time points, the sample water absorption (q) was calculated. The water content after 48 h was taken as the equilibrium water content (qe).

2.11. In Vitro Evaluation

The cytocompatibility of the samples was evaluated in vitro using L929 fibroblasts. In brief, the samples were cut into 40 mm × 70 mm rectangles and sealed before 60 Co-irradiation sterilization. Then, the scaffolds were soaked in 9.3 mL of cell culture medium for 24 h to obtain the extracts. The volume of the extracts was calculated based on the area of the scaffolds (6 cm2/mL, according to ISO 10993-12:2012). The cell proliferation in the sample extracts was assessed using an MTT assay, according to our previous research [19]. L929 fibroblasts in logarithmic growth phase were then added to 96-well plates at a cell concentration of 1 × 10⁴ cells/well. The amount added to each well is 100 μL. After 4 h, 100 μL of the extract was added to the 96-well plate, 100 μL of complete medium was added to the control group, and six parallel tests were performed on each sample. After culturing in a CO2 incubator at 37 °C for 1, 3, and 5 days, 20 µL of MTT solution was added to each well. After co-cultivation at 37 °C for 4 h, the upper medium was aspirated, and 200 µL of dimethyl sulfoxide was added to each well. Finally, after the blue metazine crystals were dissolved evenly, the optical density (OD) of each well sample at 492 nm was measured with a microplate reader.

2.12. In Vivo Evaluation

40%-OSH-pADM scaffolds were selected through the previous evaluation and cut into circular samples, each with a radius of 10 mm, and sterilized with 60Co irradiation before use. Sprague-Dawley rats, weighing 300–350 g, were anesthetized by intraperitoneal injection of 10% chloral hydrate (300 mg/kg). Under aseptic conditions, a full-thickness skin excision wound with a radius of about 10 mm was created on both sides of the dorsal surface of each of the rats (two injuries/rat). A scaffold was implanted into the right injured side of each rat, while the contralateral side was used as a blank control. Each wound was covered with sterile gauze, and an interrupted suture was performed. The animals were sacrificed at 1, 2 or 3 weeks after surgery. The injured and surrounding tissues were removed from the animals for histopathological analysis. The specimens were fixed in 10% buffered formalin, dehydrated through a gradient of ethanol concentrations then cleared with xylene. Paraffin-embedded tissue samples were sectioned to a thickness of 5 μm. Hematoxylin and eosin (H&E) staining was used for histological observation, and immunohistological staining was used to test for the expression of basic fibroblast growth factor (bFGF), vascular endothelial growth factor (VEGF) and platelet-derived growth factor (PDGF), according to standard protocols. In addition, all experimental animals were handled according to the guidelines formulated by the National Institutes of Health on human use and care of laboratory animals. All procedures performed on animals were first approved by the Animal Care and Use Committee of Sichuan University.

3. Results and Discussion

3.1. FT-IR Analysis

The main component of pADM is type I collagen. Natural type I collagen has a special triple helix structure, and the characteristic absorption band of collagen will change correspondingly before and after the interaction between collagen molecules and other molecule compounds. At present, studies on these characteristic bands mainly focus on amide A, I, II and III band, and the absorption band of proline and hydroxyproline, which can be observed from the characteristic amide absorption peaks of FT-IR spectra, as shown in Figure 1. The absorption peak of the amide I band of collagen at about 1650 cm−1 is mainly caused by the C=O stretching vibration within the collagen molecule. At about 1545 cm−1, collagen amide II had an absorption peak, mainly caused by N-H bending and C-N stretching vibration. Moreover, the amide III at 1235 cm−1 is contributed by the stretching vibration of C-N and the bending vibration of N-H in plane, and wagging vibration from CH2 groups in the glycine backbone and proline side-chains [20]. Meanwhile, the bands at 1080 cm−1 are caused by the stretching vibration of C-O, C-O-C and the frame vibration of rings in OSH. By comparing the spectra of pADM and OSH-pADM cross-linked with different oxidation degrees of OSH, it was found that the characteristic peaks of amide I, II and III were not changed obviously, before and after cross-linking; this indicated that the characteristic absorption peaks of collagen were not changed. After cross-linking, a new peak at 1080 cm−1 became increasingly obvious with the increase in oxidation degree, indicating that OSH was grafted onto OSH-pADM. OSH could be grafted onto the scaffold, since SH contains aldehyde groups with reactive activity after oxidation, and these aldehyde groups can react with the amino groups on pADM in Schiff’s base. Specifically, after SH was oxidized by sodium periodate, the C-C bonds in the cis-diol structure were oxidized and broken, thereby generating two aldehyde groups, and the generated aldehyde groups generated Schiff base reactions with the active amino groups in pADM. These reactions could occur between or within collagen molecules, as shown in Figure 2 and Figure 3. Among them, the higher the degree of oxidation of OSH, the more aldehyde groups were generated, which could better react with the active amino groups in the pADM, and the cross-linking effect became stronger.

3.2. SEM Observation

pADM is an extracellular matrix with appropriate pore size, porosity and a unique three-dimensional structure, which can provide a good microenvironment for cell growth. Therefore, when used in wound repair, pADM has biological properties, such as inducing vascularization and promoting cell growth and proliferation. As shown in Figure 3, OSH-pADM with different cross-linking effects all had typical pore structures. After OSH cross-linking, the pore size of pADM tended to increase. Studies have proven that good pore size and porosity can be conducive to tissue repair [21], and that the micropore structure in the material can serve as a fast channel for the endogenous growth of fibroblasts [22,23,24]. The larger the pore size and porosity are, the permeability of the material will change accordingly; good permeability is also conducive to the migration and proliferation of cells. Therefore, it can be predicted that OSH-pADM after cross-linking may be suitable for cell growth and proliferation.

3.3. XRD Analysis

X-ray diffraction can quantitatively determine the spacing between molecular chains in collagen molecules, the proportion of amorphous forms in the molecule, and the distance of repeating structural units in the molecular chain along the triple helix axis. As shown in Figure 4, the XRD spectra of pADM and OSH-PADM have three main peaks. The first peak is the diffraction peak generated in the crystal region, which can be used to represent the transverse distance between collagen molecular chains. The 2θ value of the first peak of the cross-linked scaffold increased, indicating that the interchain distance of collagen molecules in the OSH-pADM became shorter [25]. In addition, the 2θ value of OSH-PADM increased with increasing oxidation degree, indicating that with the increase in oxidation degree, the intermolecular distance of collagen in pADM became shorter, and the cross-linking effect became more obvious. The second peak represents diffuse scattering caused by many structural layers in collagen fiber. It can be seen that, after cross-linking, the width of the peak becomes wider, indicating that the internal amorphous composition of the collagen in pADM changed, which is a result of the introduction of OSH that affects the regularity of the molecule. The third peak reflects the axial period corresponding to a rotation height of the collagen helix, which corresponds to a typical triple helix structure. The third peak did not change significantly before and after cross-linking, indicating that the triple helix structure of collagen was not damaged by the cross-linking effects of OSH.

3.4. Thermodynamic Stability

Theoretically, the cross-linking effect should directly affect the thermodynamic stability of collagen. Specifically, it can be characterized by DSC and TG analysis.
It can be seen from the TG curves and primary differential curves, corresponding to Figure 5 and Figure 6, that each curve contains three stages. With a rise in temperature, the quality of materials decreases to a certain extent. Within the range of 50~150 °C, the degree of reduction was not significant, which is caused by the evaporation of water between collagen fibers, and the breaking of hydrogen bonds in collagen during the process of heating. In the range of 200~500 °C, as the temperature was further increased, the material weight dropped sharply when it reached 350 °C, indicating that the structure of collagen and the skeleton of polypeptide chains were damaged. The temperature at the time of the fastest weight change was at the peak value of the primary differential curve, representing the thermal decomposition temperature of the scaffold. In the range of 500~700 °C, the weight loss of the samples attenuated. In Figure 6, the thermal decomposition temperature of the OSH-pADM was slightly higher than that of the pADM. The reason for this is because OSH contains aldehyde groups with reactive activity, which could produce effective cross-linking reactions with the collagen of the pADM, and improve its thermal stability. Therefore, the thermal stability of cross-linked pADM was improved.
According to DSC curves of OSH-pADM cross-linked with different oxidation degrees of OSH, it can be seen that pADM and OSH-pADM have similar thermodynamic behaviors, as shown in Figure 7. In the process of temperatures rising from 20 °C to 150 °C, the natural structure of collagen in the scaffolds began to loosen, and became loose with the increase in temperature. Hydrogen bonds and some weak bonds in collagen began to break; as the temperature continued to rise, the triple helix structure of collagen began to be destroyed, changing from its triple helix structure into irregular curls, and finally into three α peptide chains. At this time, the temperature corresponded to the thermal denaturation temperature (Td) of the material, namely the peak of the DSC curve. The Td of pADM is 86 °C, which is lower than that of OSH-pADM. Moreover, the Td of OSH-pADM increased with the increase in oxidation degree, and the Td of OD60%-OSH-pADM reached as high as 96 °C. This was a result of the covalent reaction between the aldehyde groups of OSH, and the amino groups in collagen to generate stable new bonds; this improved the thermal stability of the matrix and enabled it to maintain the triple helix structure of collagen to a certain extent at higher temperatures. Macroscopically, it showed that the Td of the cross-linked scaffolds increased; with the increase inf OSH oxidation, the number of active aldehyde groups available for reaction increased, which made the cross-linking effect better. Therefore, the thermal stability of pADM cross-linked by OSH with high oxidation degree improved more. Higher thermal denaturation temperatures can endow the matrix with excellent stability, and make it have even better application potential.

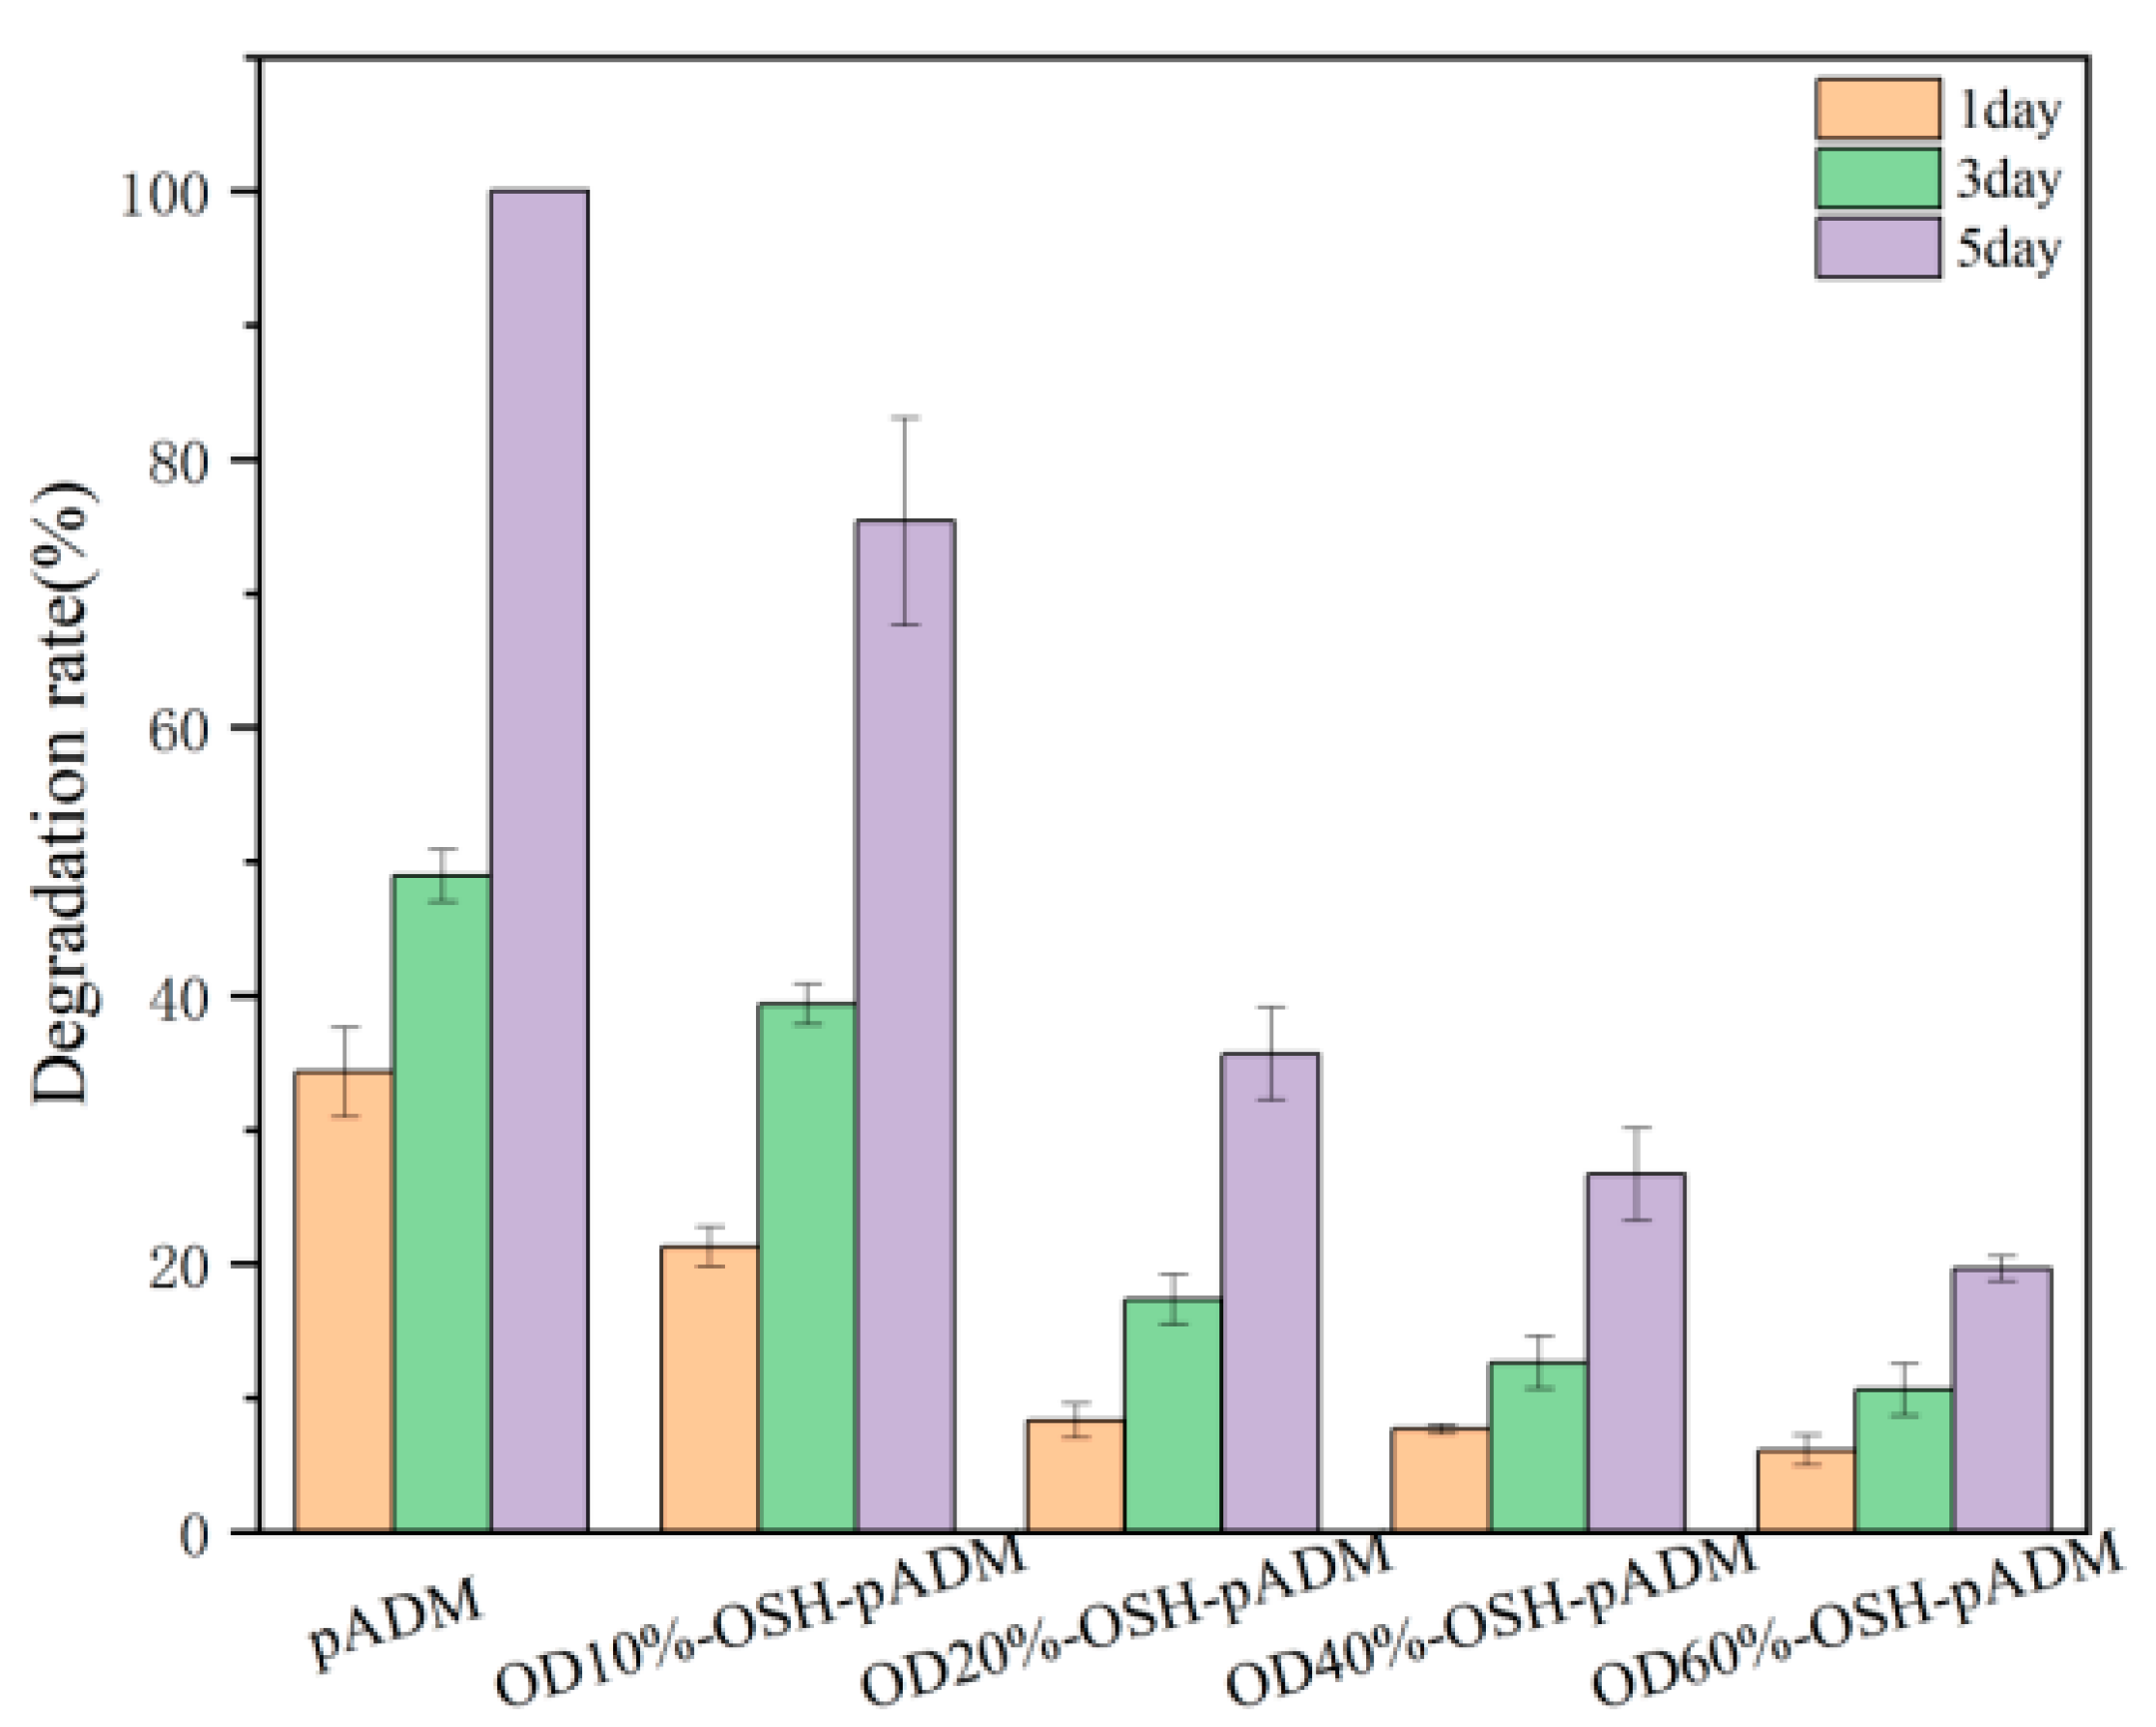
3.5. Degradation Properties

It is known that type I collagen is the main component of pADM materials. Type I collagenase can specifically act on peptide bonds in collagen. Collagenase breaks gly-isoleu bonds at 772–773 sites on the α1 (I) chain, and breaks the Gly-leu bond at the same site on the α2 (I) chain; thus, the triple helix structure of collagen is split into two fragments [26]. As can be seen from Figure 8, pADM was completely degraded at 5 d, while OSH-PADM was only partially degraded in the same time. With the increase in oxidation degree of OSH used in OSH-pADM, the degradation amount of the corresponding scaffold decreased, among which OD60%-OSH-pADM had the lowest degradation amount at only 19.4%. The reason for this is because the cross-linking of OSH and pADM produced new covalent bonds, which could effectively reduce the interaction between collagenase and the α chain of collagen. In addition, the higher the oxidation degree of OSH means that there were more active aldehyde groups which could form more cross-linking bonds within and between collagen molecules and chains, resulting in a stronger cross-linking effect; hence, the structure of collagen became more stable, and had better resistance to enzymatic degradation, which is consistent with the improvement in thermal stability of the OSH-pADM samples. In addition, according to the previous XRD results, cross-linking reduced the interchain spacing of collagen molecules, and such structural changes also could hinder the action of enzymes to a certain extent. In conclusion, OSH cross-linked with pADM could greatly improve the resistance of the scaffold to enzymatic degradation; the higher the oxidation degree of OSH, the stronger the cross-linking effect.

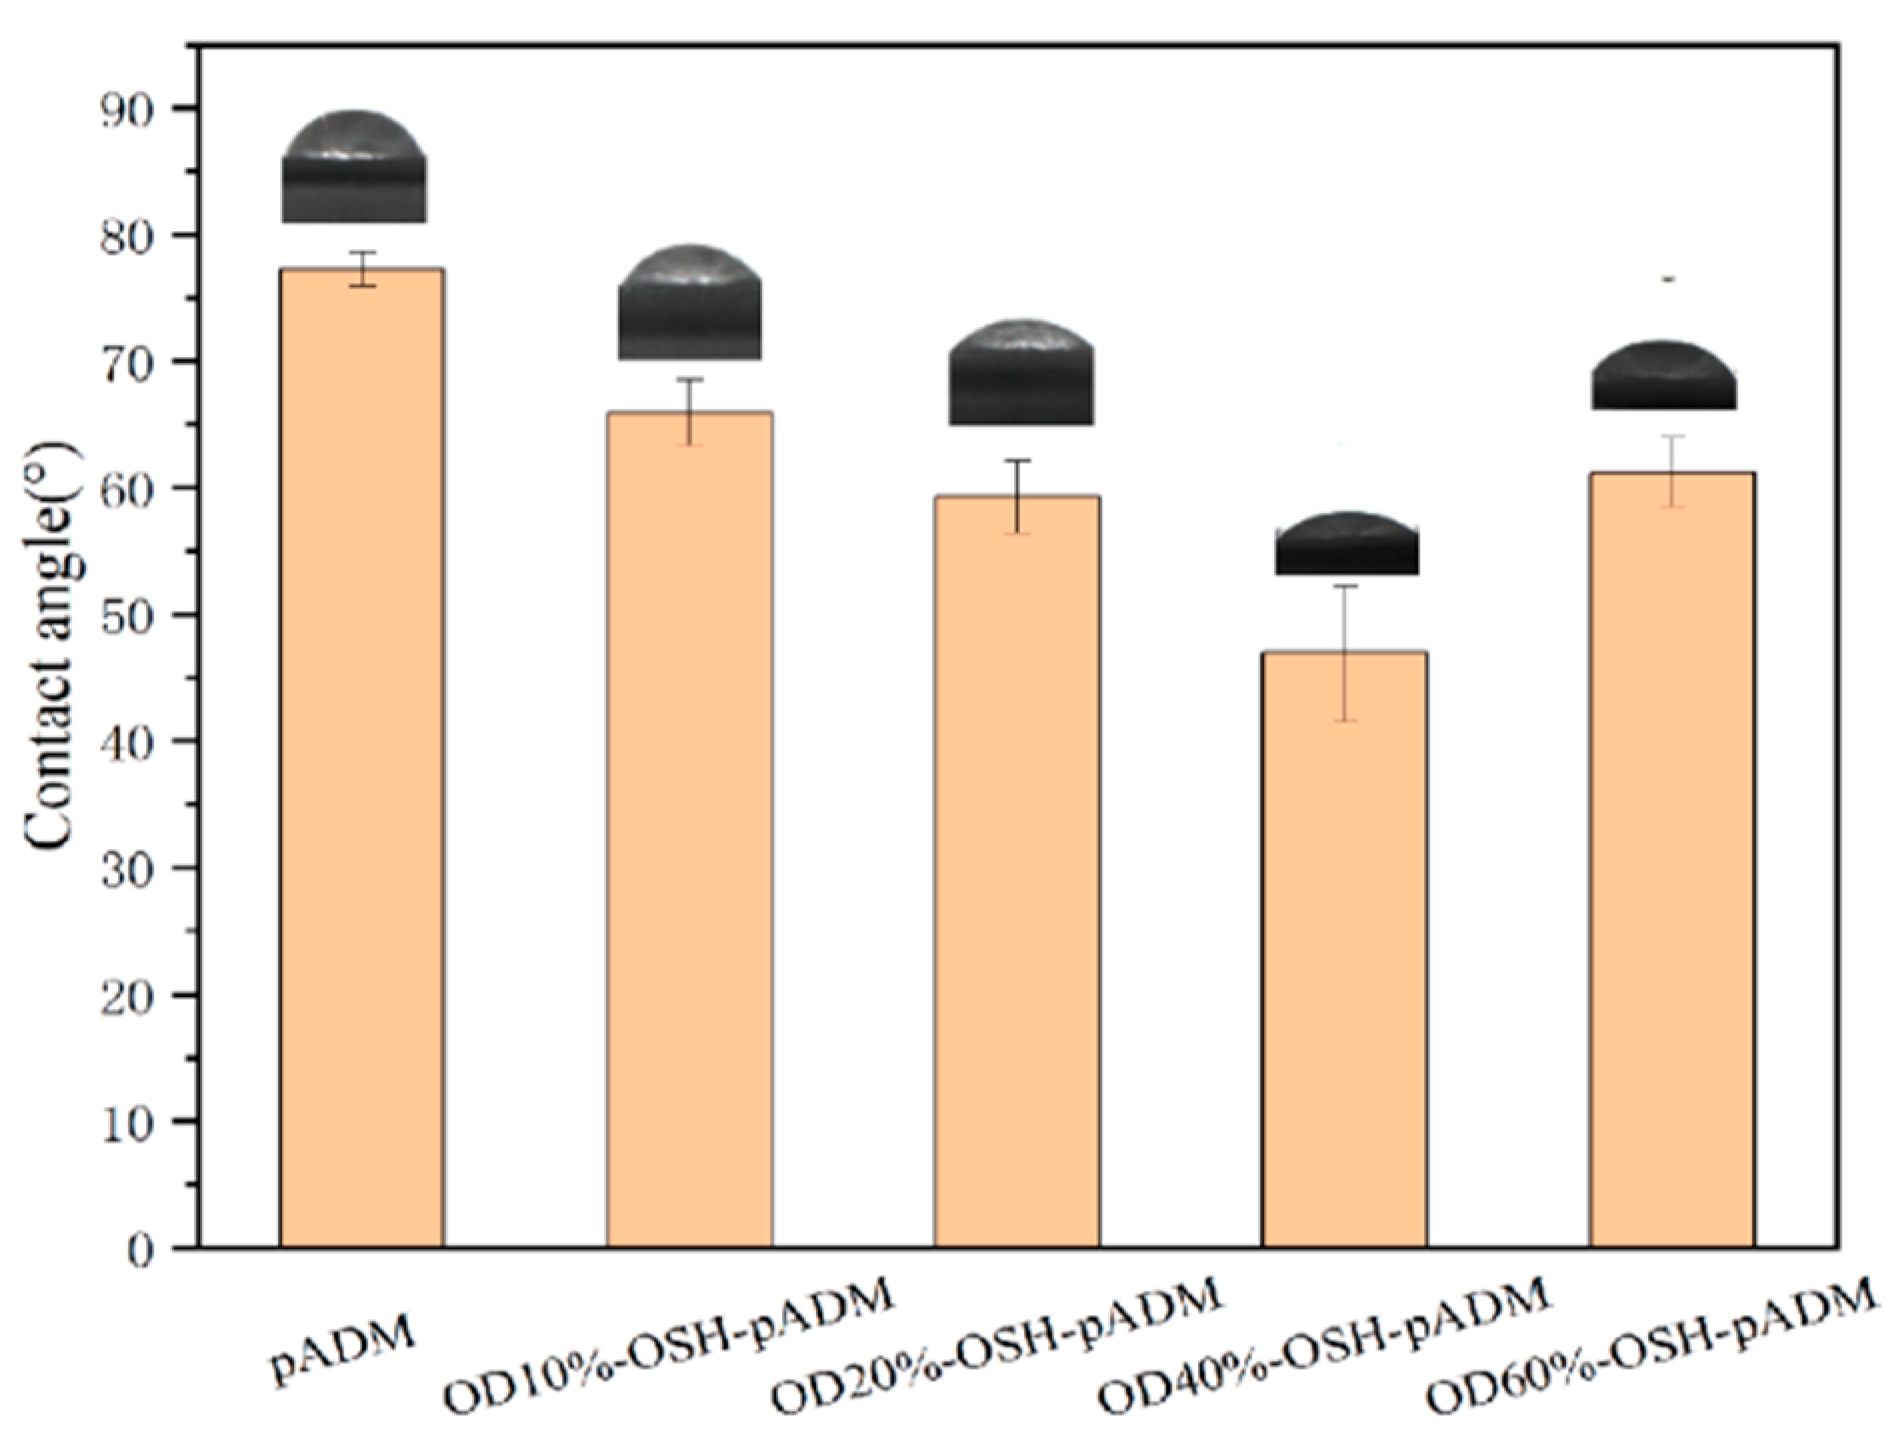
3.6. Hydrophilicity Analysis

Contact angle is an important parameter to characterize the hydrophilicity of a material surface. As shown in Figure 9, the comparison between pADM and OSH-PADM shows that the contact angles of OSH-pADM were all smaller than those of pADM, and the contact angles of OSH-pADM surfaces basically showed a downward trend with the increase in oxidation degree. The reason for this is because OSH is rich in hydroxyl and carboxyl groups, which could increase the number of hydrophilic groups on the surface of pADM after being introduced into pADM. With an increase in oxidation degree of OSH, the more active aldehyde groups of OSH, the greater the possibility of reaction with pADM. Therefore, the more that OSH grafted onto pADM, the more the surface hydrophilic ability became stronger. When the oxidation degree of OSH is 40%, the contact angle of OSH pADM is the smallest, at less than 50°, and the surface hydrophilic ability is the strongest. The contact angle of OD60%-OSH-pADM is higher than that of OD40%-OSH-pADM, which may be caused by the higher oxidation degree at the expense of some of the polar groups, and also may fracture some OSH molecules; this reduced the molecular weight of OSH and affected its hydrophilicity to a certain extent. Even so, the contact angle of OD60%-OSH-pADM is still 10 °smaller than that of native pADM.
As shown in Figure 10, the moisture rate, water absorption rate and capillary water absorption rate of the cross-linked matrix all increased compared with native pADM. The reason for this is because OSH could covalently cross-link with pADM, and thus could be grafted onto the collagen of OSH-pADM. The introduced OSH could contribute good moisture absorption and water retention abilities to the matrix. Furthermore, with the increase in the oxidation degrees of OSH, the moisture rate and water absorption rate of the samples cross-linked with different oxidation degrees of OSH increased initially and then decreased, similarly with the results of the contact angles. OSH-pADM exhibited optimal moisture retention at an oxidation degree of 40%. The contact angle of OSH-pADM with a high oxidation degree (60%) was found to be lower than that of OD40%-OSH-pADM. The reason for this is because hyaluronic acid is a polymer chain with a long chain. The “box” structure of its unit is one of the key factors that ensures its hydrophilicity and moisture retention characteristics [8]. According to the reaction principle, after SH was oxidized to OSH, part of dihydroxyl groups were oxidized into aldehyde groups, which would result in the fracture of SH chains, and thereby destroy the “box” structure of the unit. The higher the oxidation degree, the more serious the damage to the unit, and the moisture absorption and water retention abilities may decrease. Therefore, an appropriate oxidation degree may not only increase the cross-linking effect to improve the thermodynamic and structural stability, but it may also contribute to improving the moisture absorption and water retention abilities of OSH-pADM.

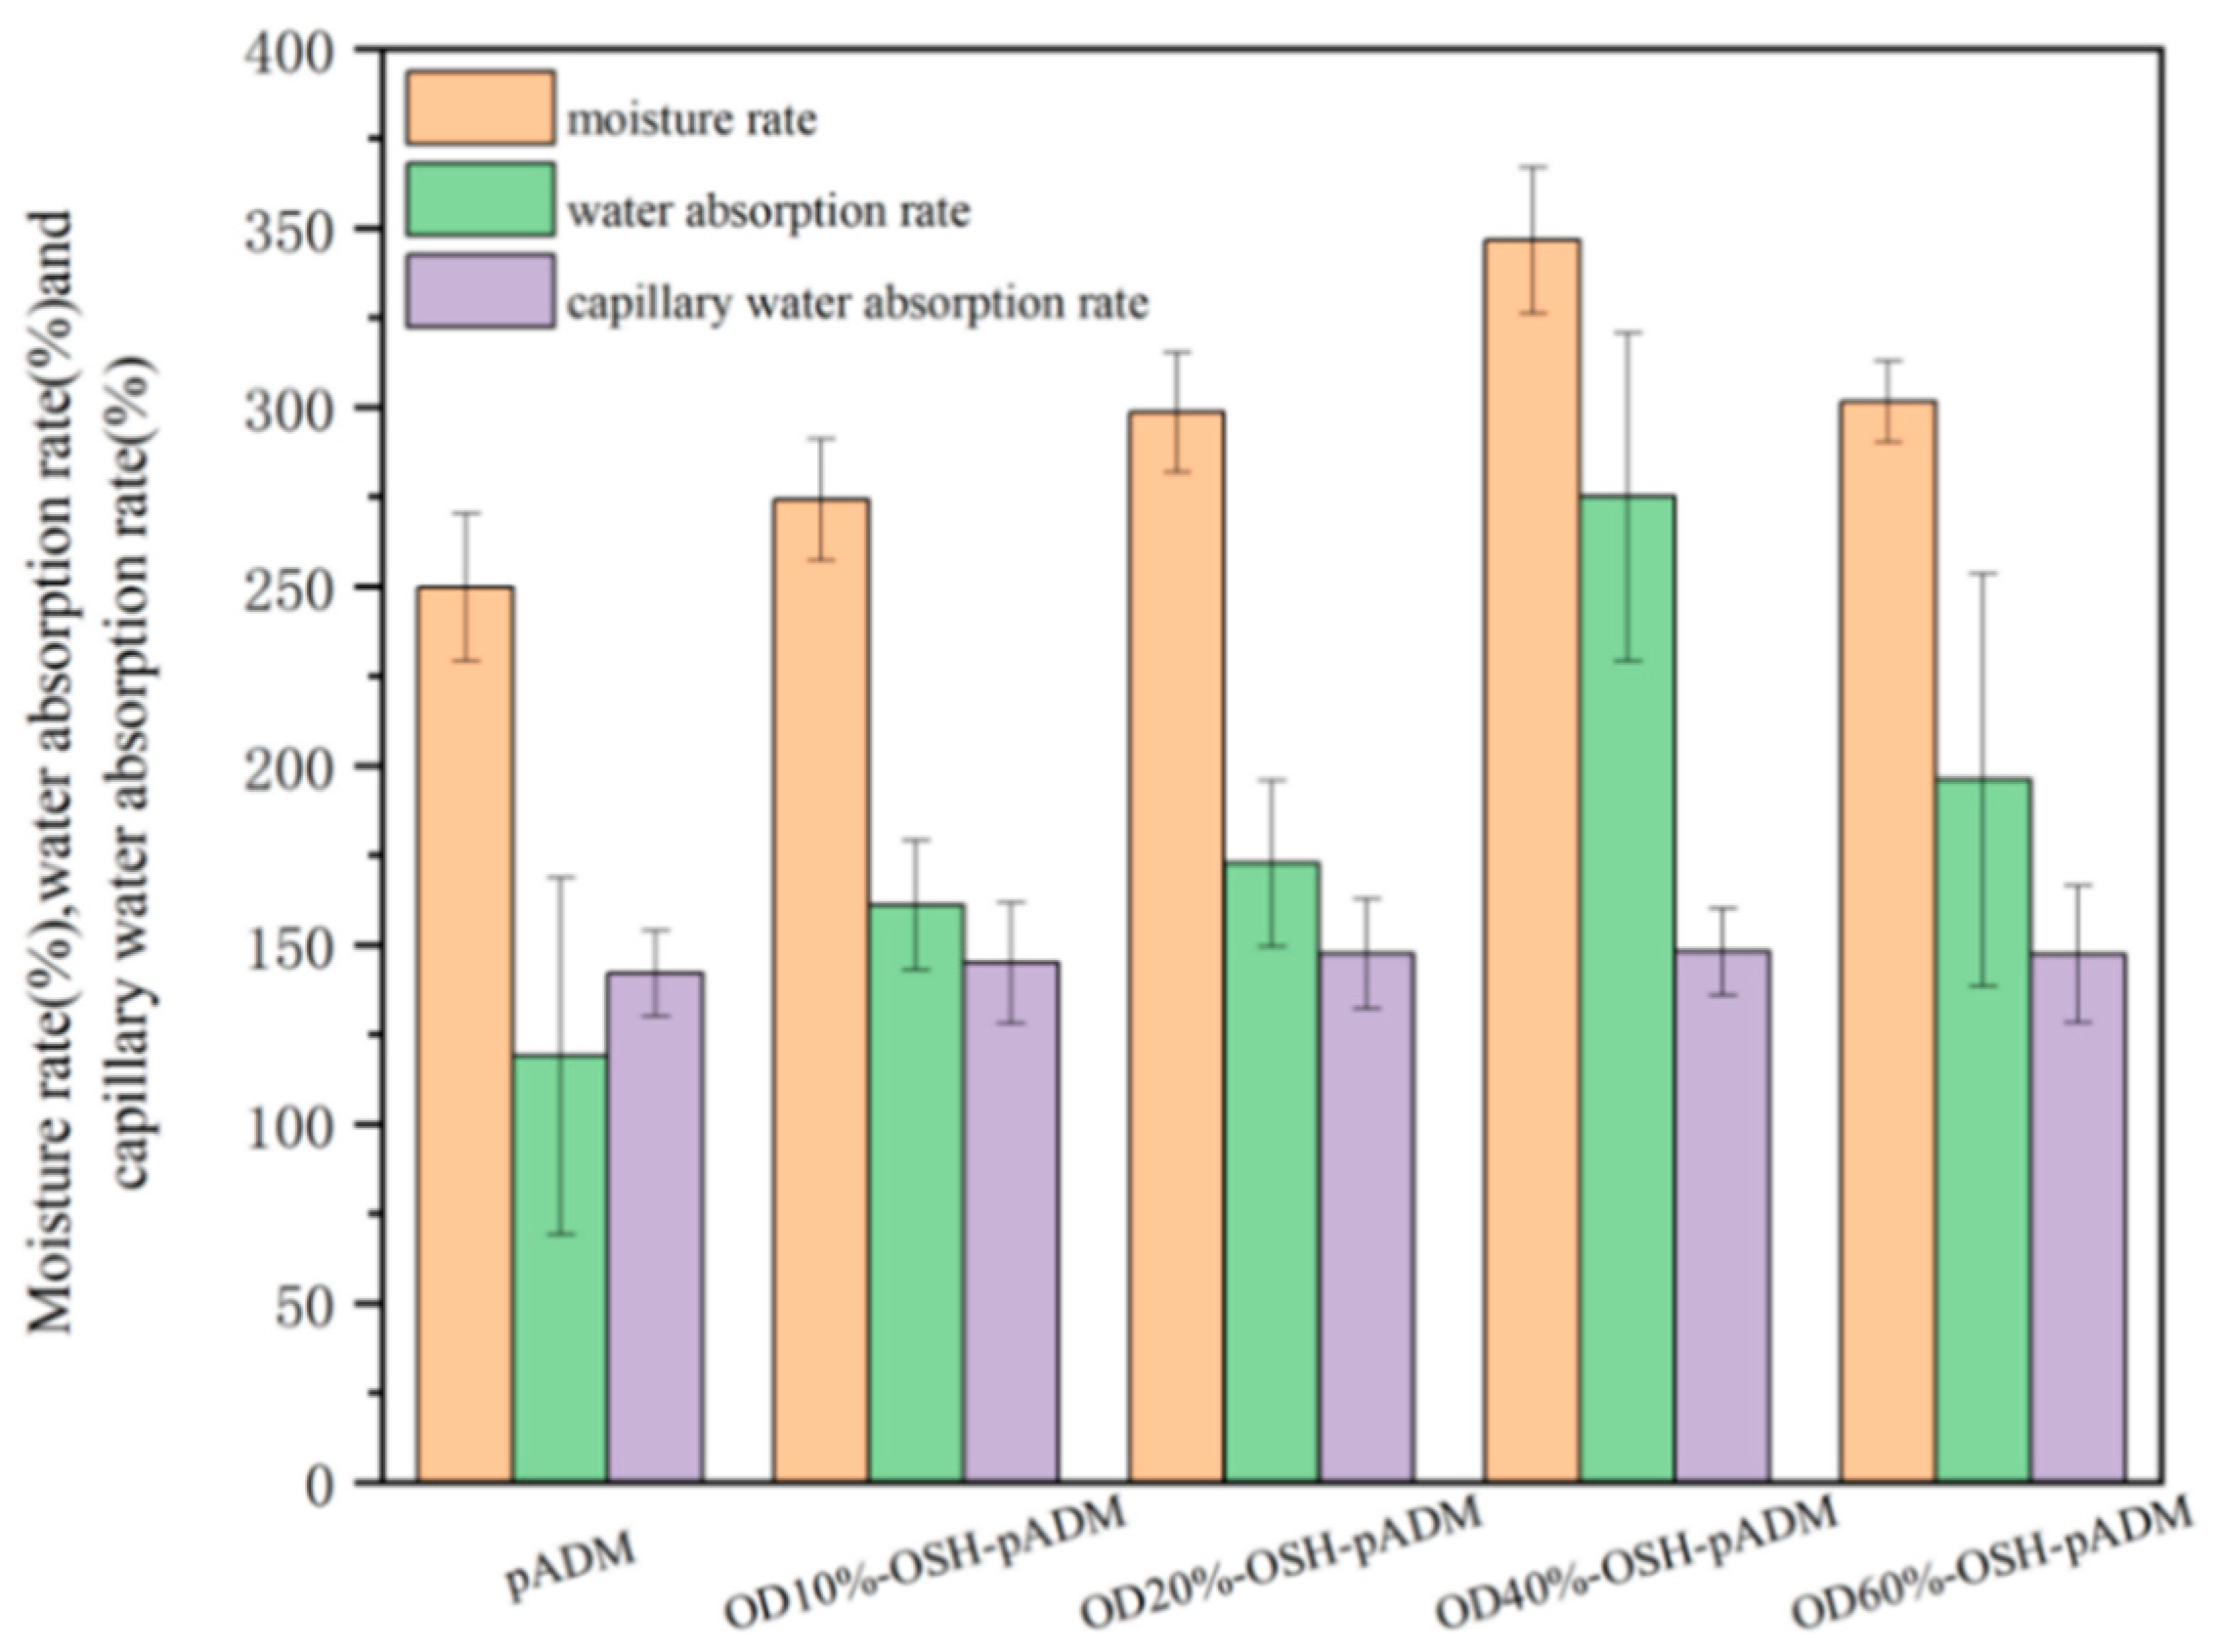
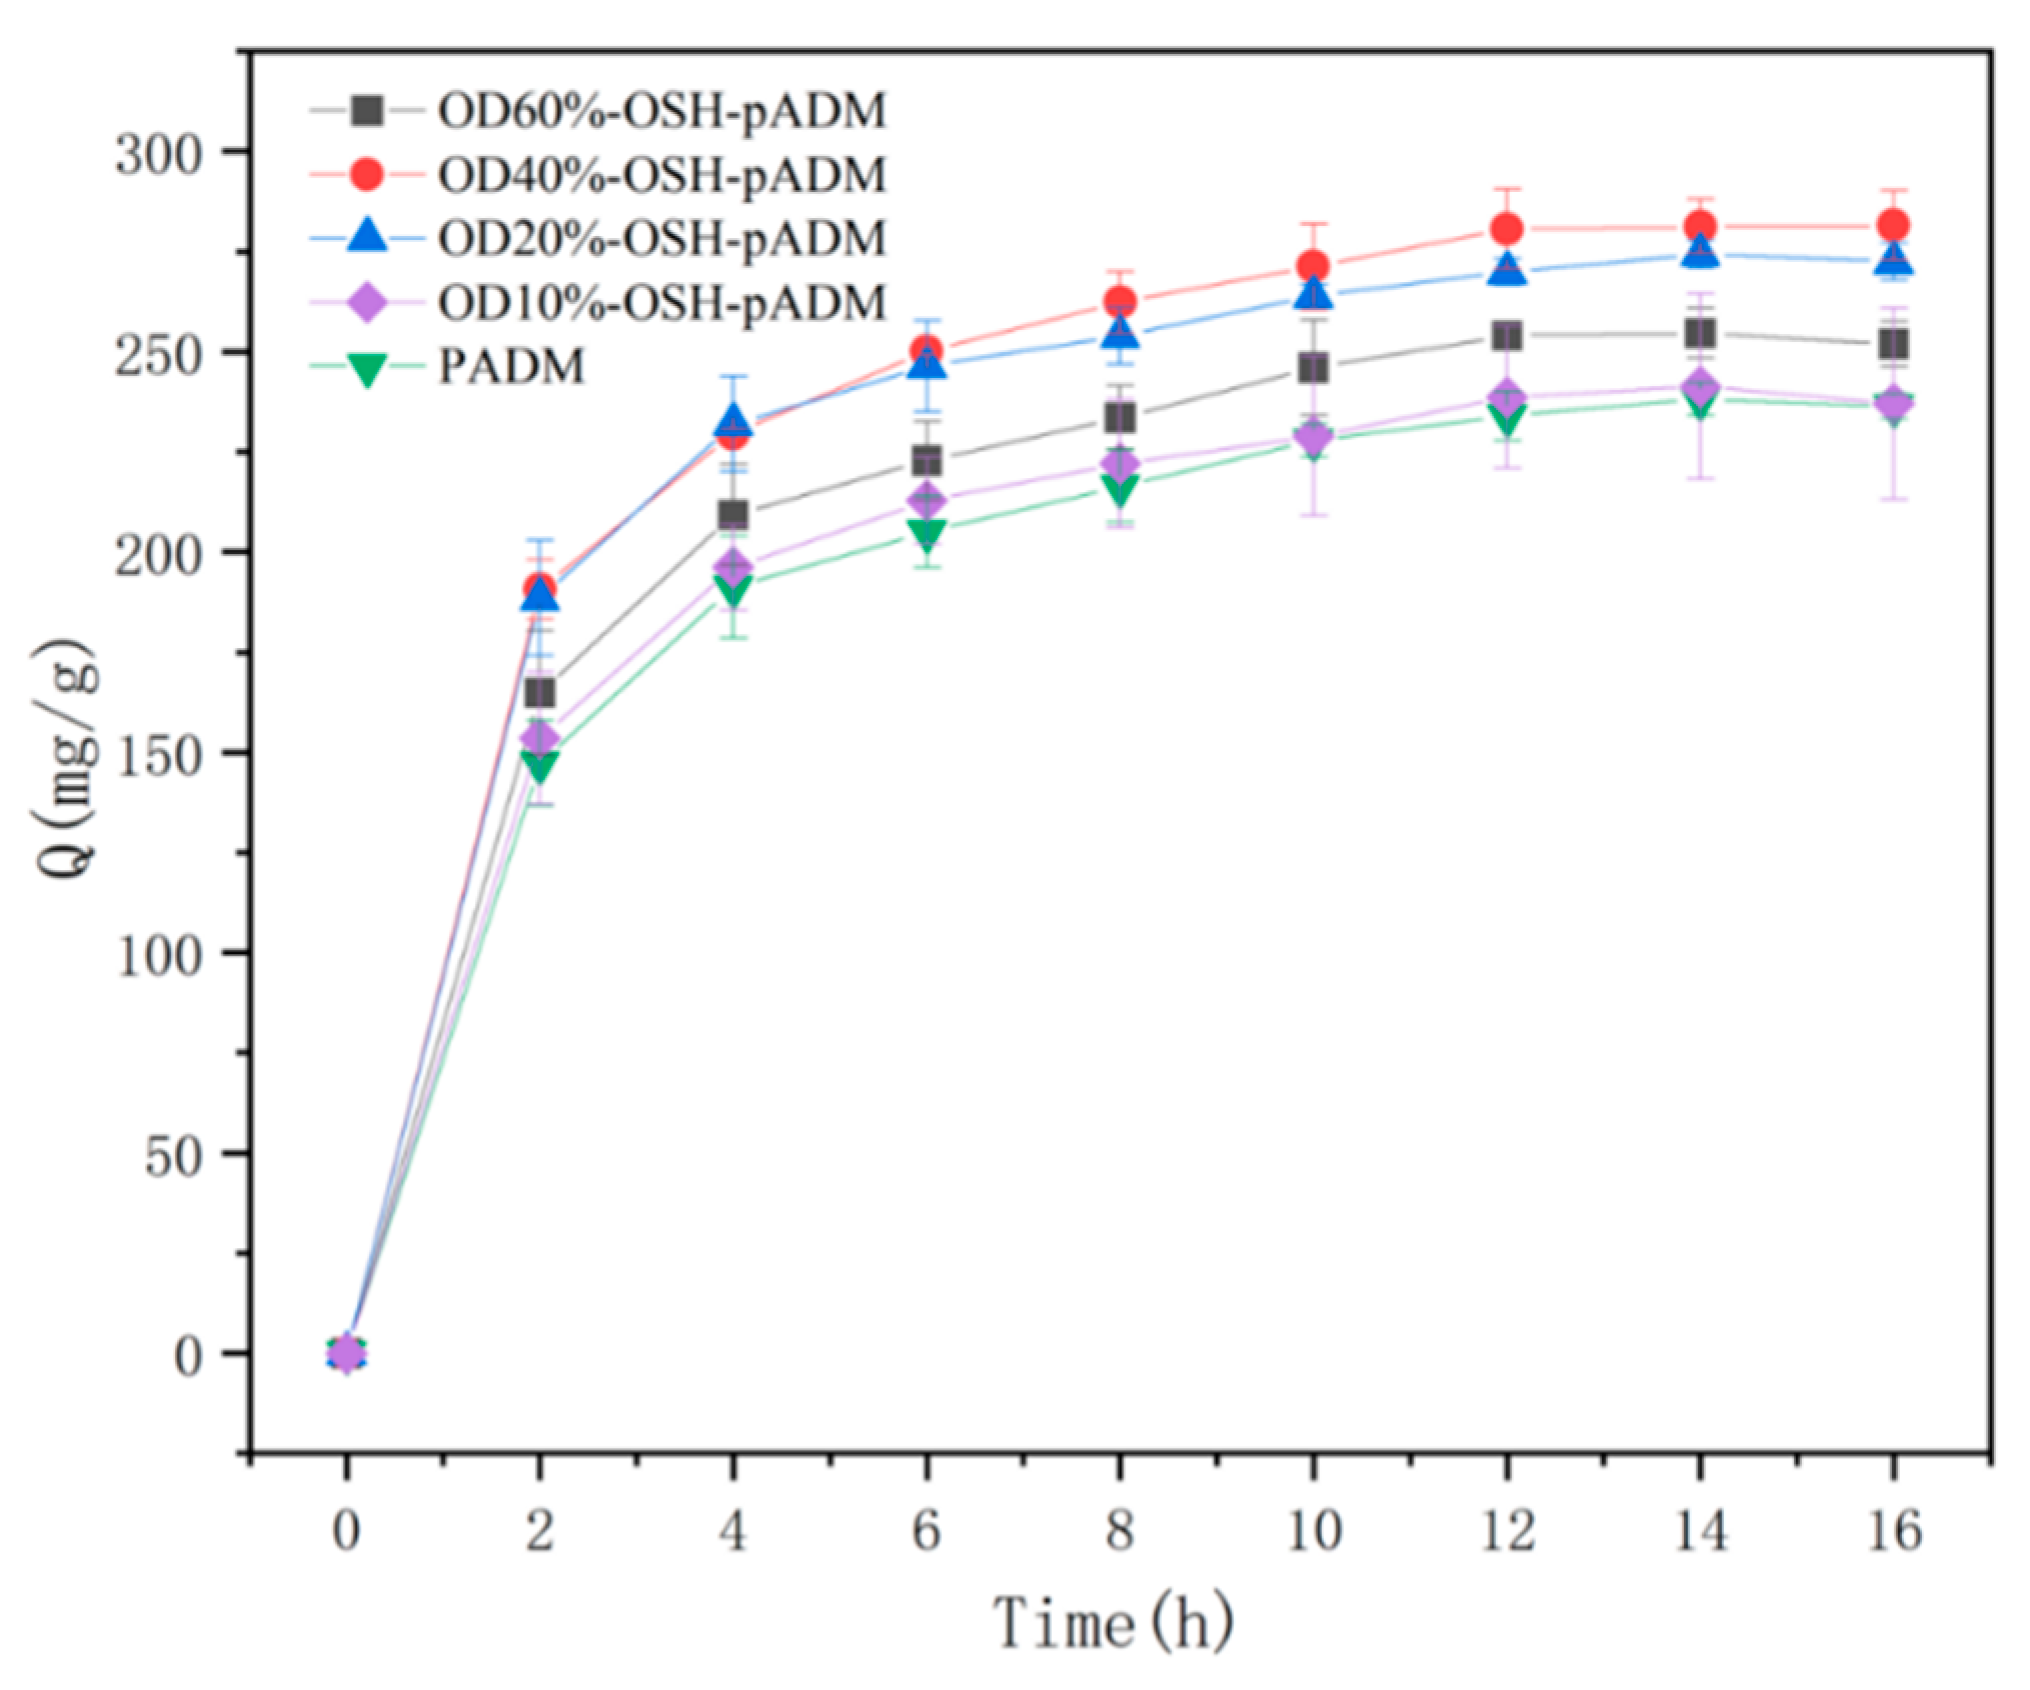
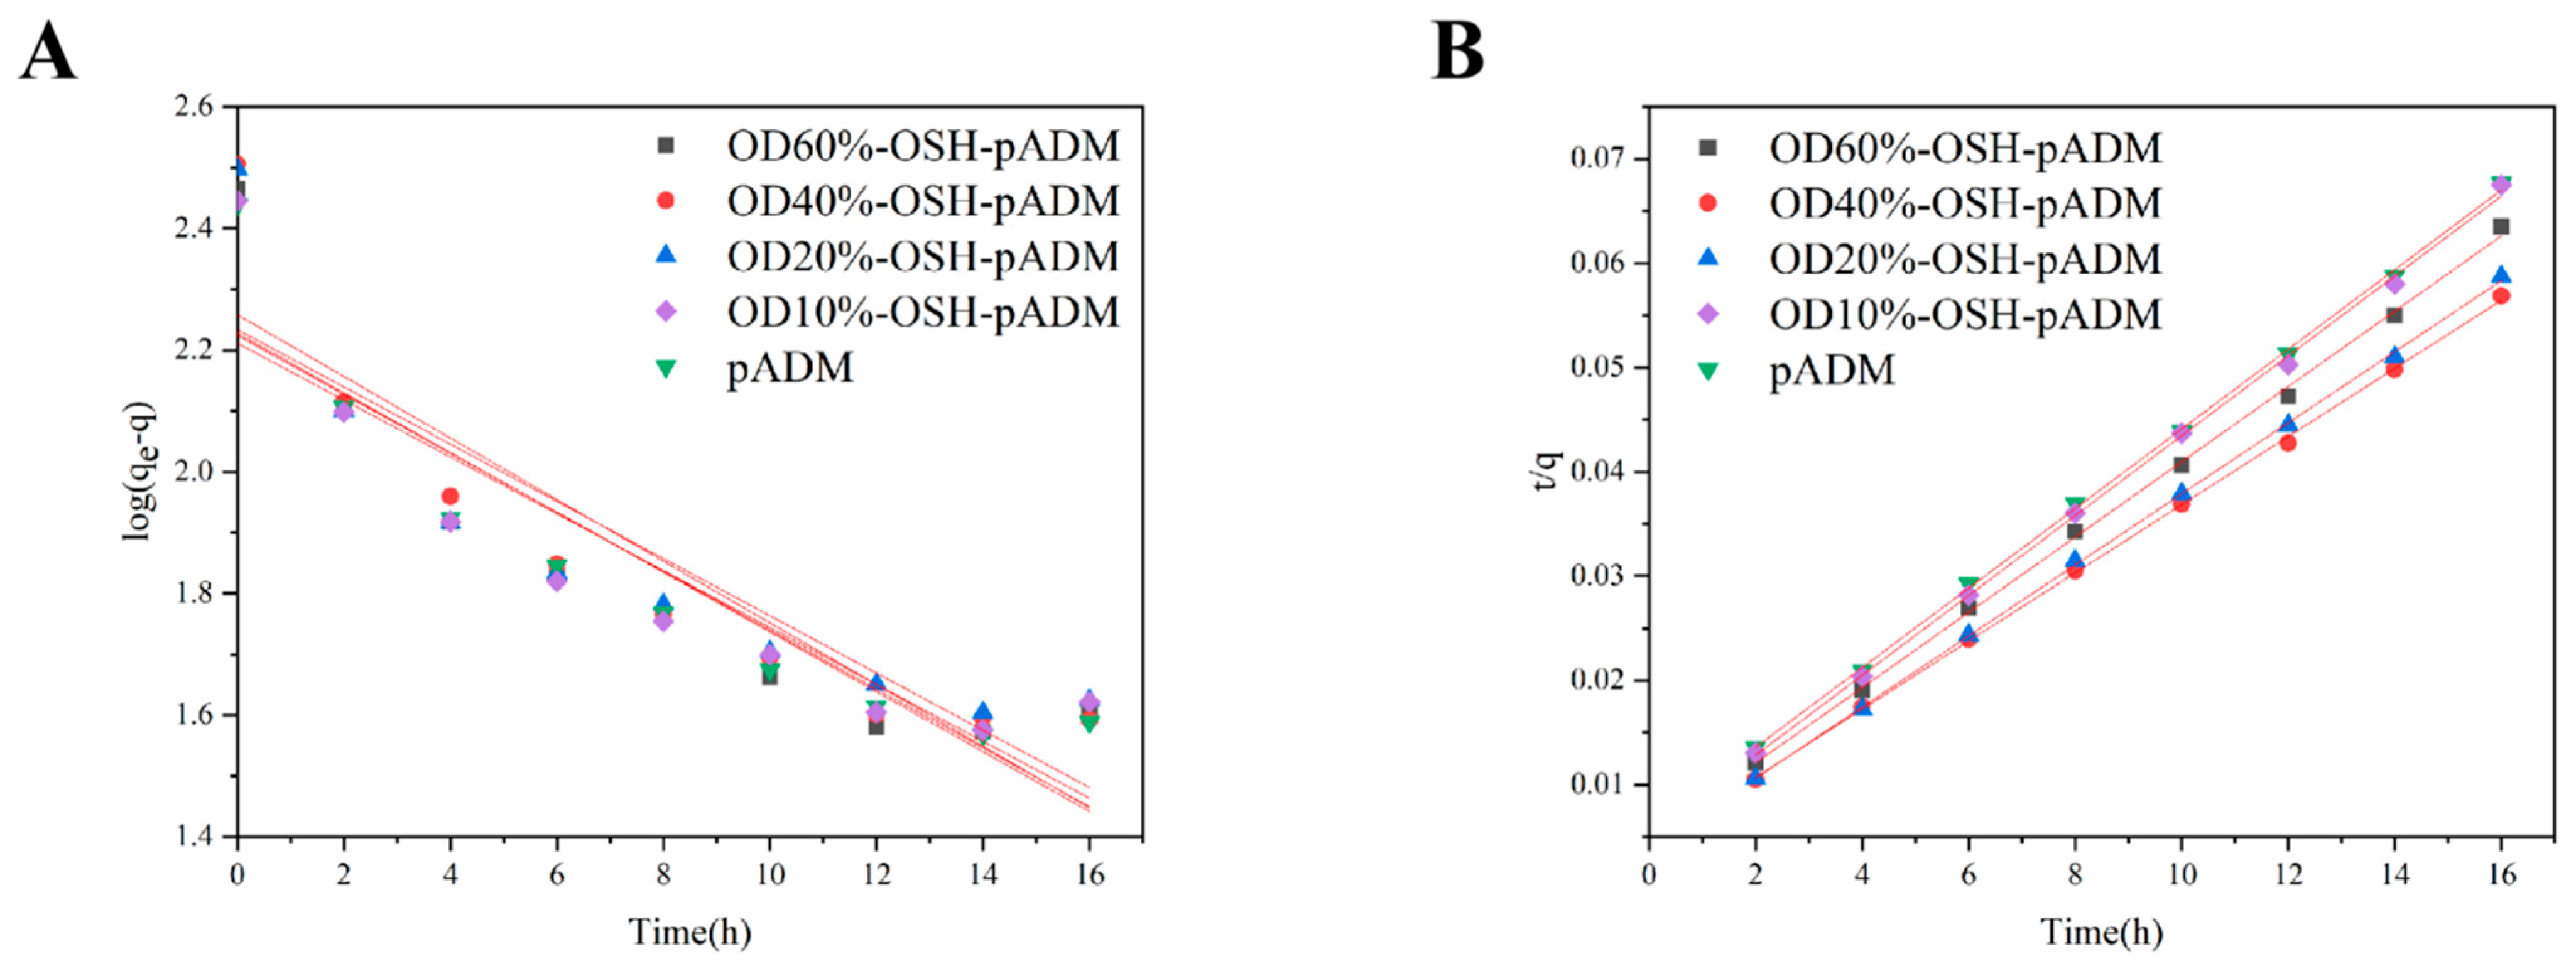
3.7. Hygroscopic Dynamics Analysis

Figure 11 shows the variation curves of samples’ water content within 16 h when the RH was 93%. During the whole hygroscopicity process, the hygroscopicity increased the fastest in the first 4 h, then gradually slowed down and basically reached equilibrium at 12 h. The hygroscopic capacity of all OSH-pADM samples was higher than that of pADM. In addition, with increasing oxidation degree of OSH, the total hygroscopicity of OSH-pADM at hygroscopicity equilibrium initially increased, and then decreased. Among them, the hygroscopicity of OSH-pADM was the highest, and that of OD10%-OSH-pADM was the lowest at equilibrium. Both of these results were greater than the hygroscopicity of pADM. This change trend was consistent with the results of the hydrophilicity test above. Next, in order to better understand the hygroscopic kinetic process of OSH-pADM, the first-order adsorption kinetic equation was first used to fit the whole hygroscopic experimental process. Lagengren’s first-order adsorption kinetics equation is as follows:
log   ( q e q ) = logq e k 1 2.303 t
where, qe and q are the adsorption capacities (mg/g) at adsorption equilibrium and time t, respectively, and k1 is the primary rate constant (min−1) [27]. As shown in Figure 12A, the linear relation between t and log(qe − q) was not satisfied. The values of each parameter obtained through the fitting curve in the figure are listed in Table 1. From Table 1, it can be found that the correlation coefficient was low, and the calculated qe value differed greatly from the actual one. Therefore, the first-order adsorption kinetics equation was judged to be unreasonable. Then, the second-order adsorption kinetics equation was used to fit the whole hygroscopic experiment process. The equation of second-order adsorption kinetics is as follows:
t q = 1 k 2 q e 2 + t q e
where k2 is the primary rate constant (g/mg·min−1) [28]. As shown in Figure 12B, t/q had a linear relationship with t. The values of each parameter obtained through the fitting curve of the second-order adsorption kinetics equation in the figure are listed in Table 2. From Table 2, it can be found that the correlation coefficient is as high as 0.99, and the calculated qe value was not much different from the actual value. It is reasonable to fit the hygroscopic process with the second-order adsorption kinetics model. The hygroscopic process conformed to the second-order kinetics of adsorption, indicating that the hygroscopic process of the material was not single molecular layer adsorption, but multilayer adsorption of multiple water molecules in the same active group [28].
The increase in hygroscopicity indicates that the introduction of OSH may increase the hydrophilic groups in pADM materials so that the number of hydrogen bonds between the scaffolds and water increases, and the number of adsorbed water molecules also increases.
As we already know, the better the hydrophilic scaffolds, the significantly better the performance for moisture, which causes the material to be maintained for a longer time in the wet state. When used as wound dressing, it is beneficial to maintain a moist state on the wound surface. According to the healing theory of Winter, a moist state can avoid dry scab formation, and this is conducive to the reproduction and growth of cells, so as to promote wound healing [1,29,30].

3.8. In Vitro Evaluation

For biomaterials, good biocompatibility is always necessary; cytotoxicity of the material is one of the important factors. Figure 13 shows the relative cell proliferation rate of L929 fibroblasts after culturing with OSH-pADM extract. From the results shown in the figure, the relative cell proliferation rates of all sample groups were greater than 80%, indicating that the potential cytotoxicity of the materials is very small. OSH-pADM scaffolds have good biocompatibility and meet the requirements for in vitro use of biomaterials. Among them, compared with OSH-pADM, the relative cell proliferation rate of the pADM group was higher than those of the OSH-pADM groups. This may be because pADM is composed of collagen and has excellent biocompatibility, while OSH-pADM may have some remaining unreacted aldehyde groups; these residual aldehyde groups may be toxic to cells, which resulted in a decrease in the relative cell proliferation rate. Nevertheless, the biocompatibility of OSH-pADM was found to be acceptable, and can meet application requirements [19].

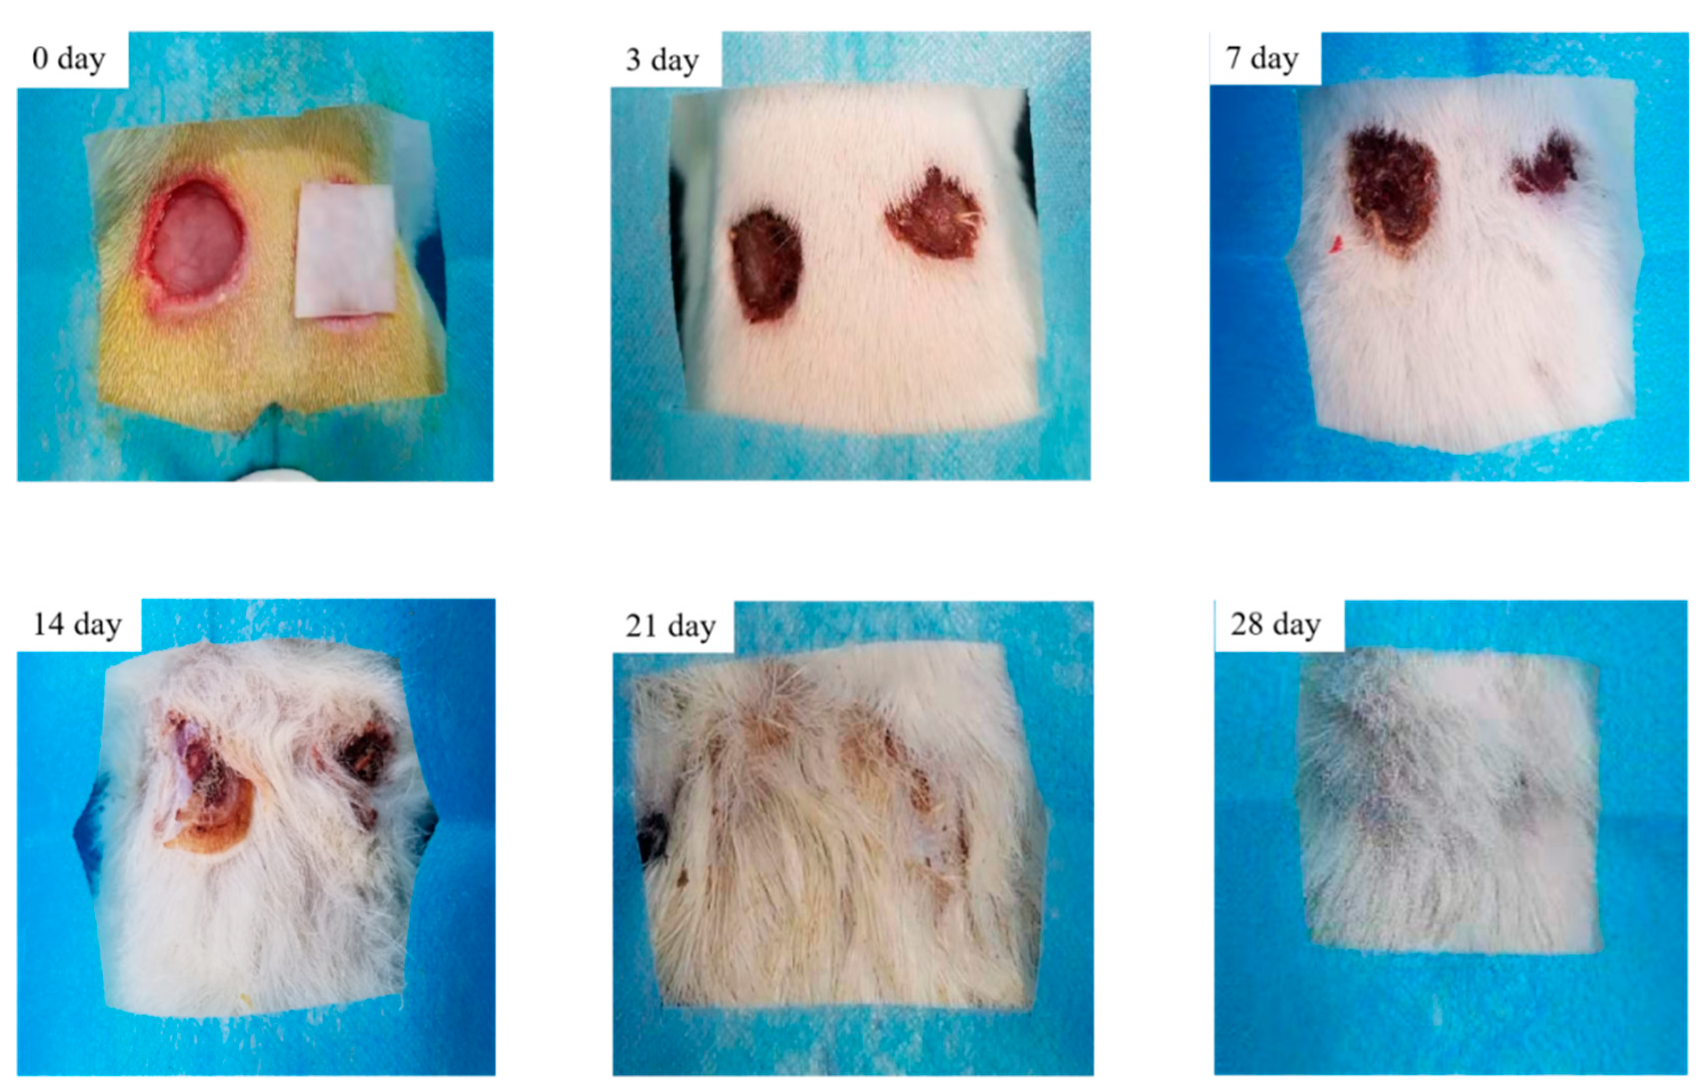
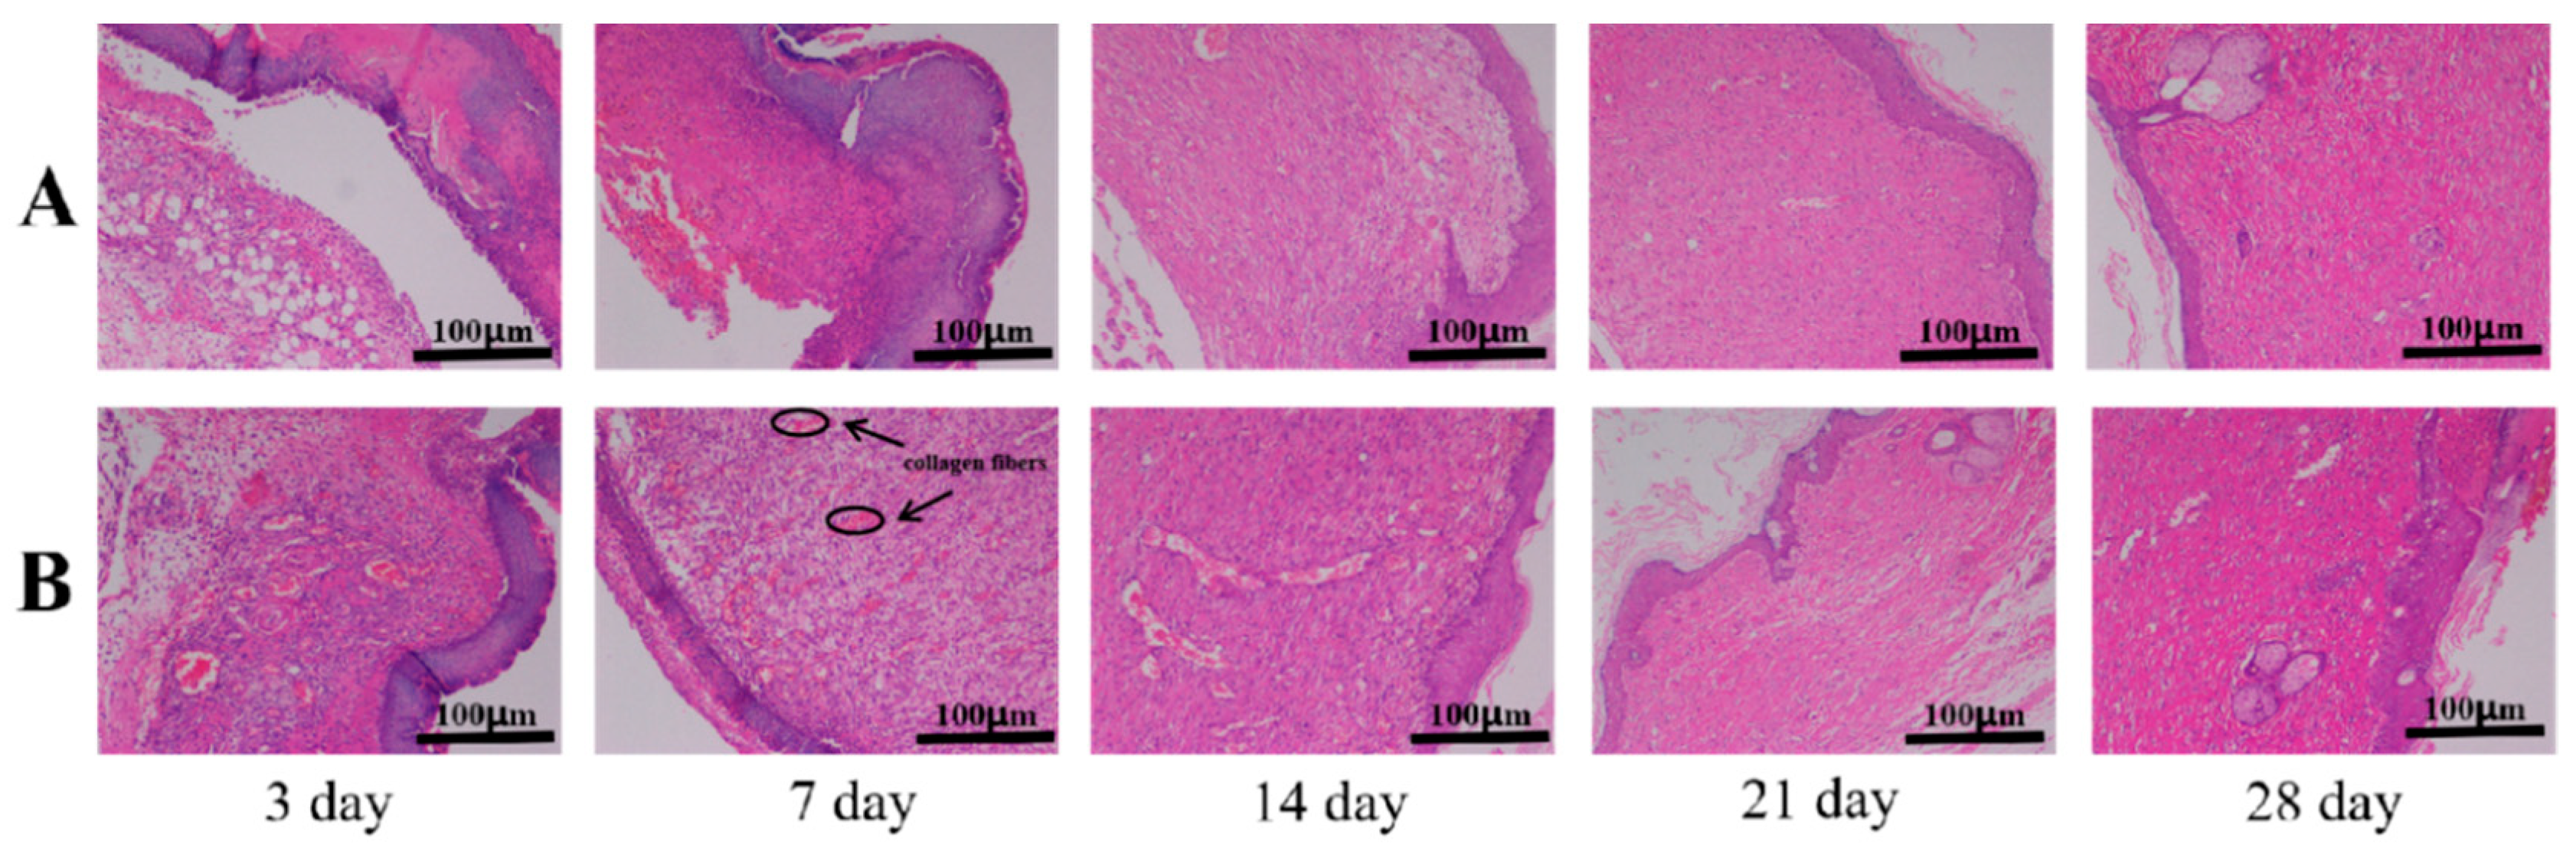
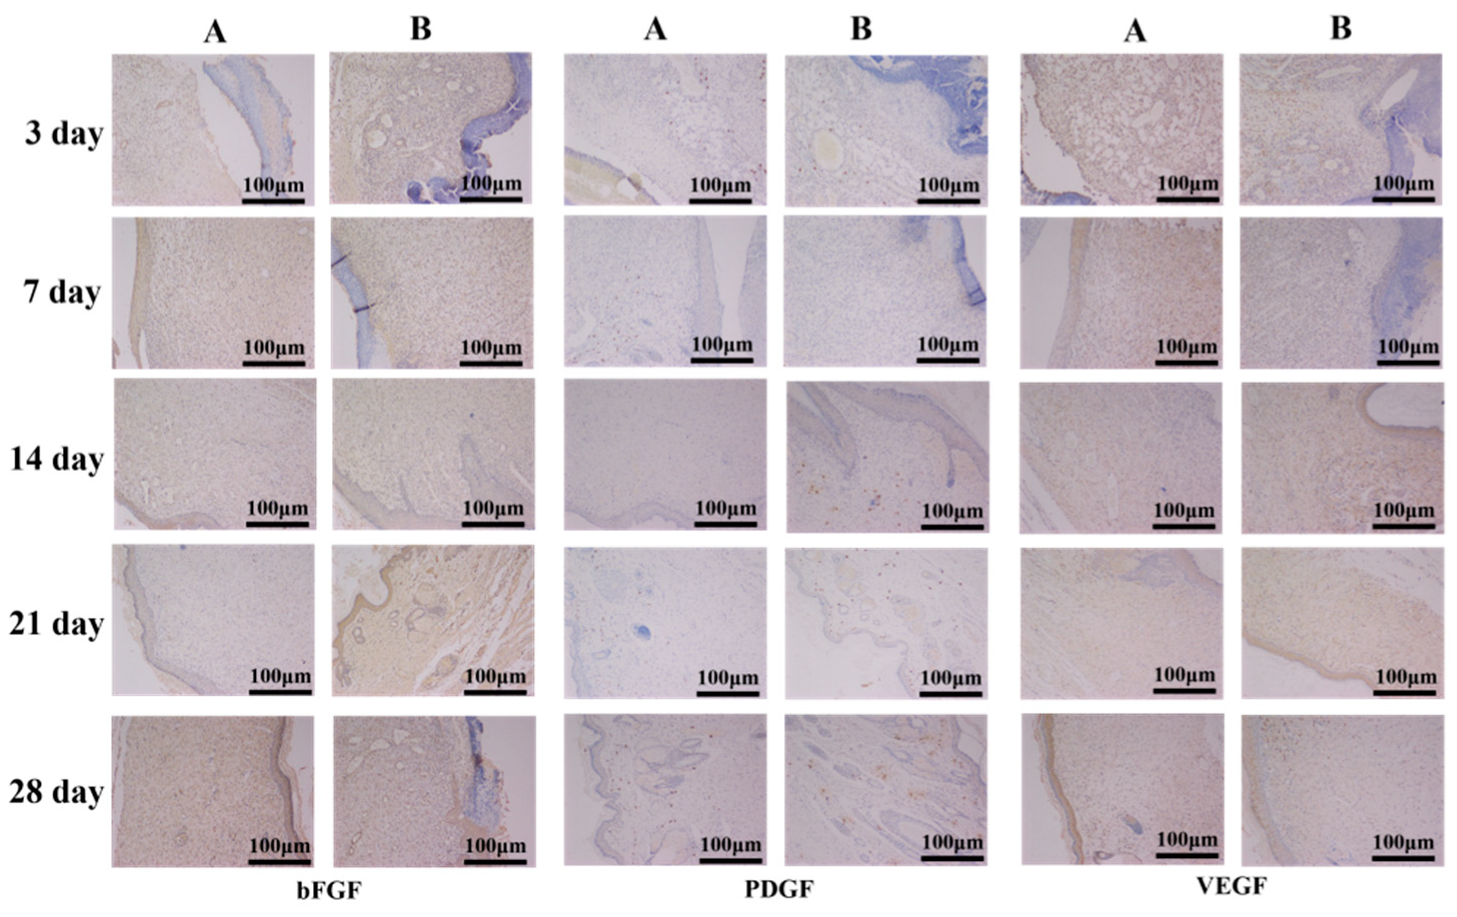
3.9. In Vivo Evaluation

Figure 14 shows the healing of full-thickness skin wounds of rats repaired by OSH-pADM on different days, with the control group on the left and the experimental group of OSH-pADM samples on the right. On day 3, there were blood scabs at the wound sites for both the experimental group and the blank group, and there was no pus, blood or exudate in the wounds. The wound contraction areas in the experimental group decreased, and the recovery was significantly faster than that in the blank group. On the 7th day, the wound contractions in both the experimental group and the blank group decreased, with the wound contractions of the experimental group becoming half of their original size. On day 21, the blood scabs for the experimental group were almost completely removed, while the blank group still showed blood scabs. At 28 days, the wounds of the experimental group and the blank group had healed, with the scars of the sample group being smaller; most of the hair had grown back normally.
H&E staining can be used to observe the collagen fibers and inflammatory cells. As shown in Figure 15, on day 7, inflammatory cells in the blank group were significantly more numerous than those in the experimental group, and collagen fibers in the experimental group were significantly more numerous than those in the blank group. With increasing healing time, the collagen fibers in the experimental group became thicker than those in the blank group.
Immunohistochemistry is a highly specific and sensitive biological histological detection technique, which can detect the function of biomaterials on the basis of morphological study. In the process of wound recovery, a variety of growth factors are involved that jointly promote wound healing [16,31]. Figure 16 illustrates the immunohistochemical staining of the wound area, including basic fibroblast growth factor (bFGF) and vascular endothelial growth factor (VEGF), which can induce microvascular generated in the process of wound repair; and platelet derived growth factor (PDGF), which can promote the growth of granulation tissue and fibroblast proliferation [32,33]. Observing the expression of various growth factors at different times can better understand the wound healing process. On the 3rd and 7th days, bFGF and VEGF factors in the experimental group were significantly more present than in those in the blank group, and the range was wider, indicating that capillary formation in the experimental group was taking place at a faster rate than that in the blank group during the first 7 days. On days 3 and 7, PDGF in the experimental group and the blank group were almost the same, but on day 14, PDGF in the experimental group was greater than that in the blank group.
Based on the results of Figure 14, Figure 15 and Figure 16, it can be concluded that OSH-pADM promotes wound healing. At the early stage of wound healing, OSH-pADM accelerates the expressions of bFGF and VEGF. The hydrophilicity of OSH-pADM helped to maintain the wound in a moist environment and promote the development of capillaries in the wound. In the middle stage of wound healing, the moisturizing properties of OSH-PADM contributed to promote the proliferation of fibroblasts and granulation tissue growth, thereby accelerating the formation of new epidermis and dermis.

4. Conclusions

OSH was prepared from SH by selective oxidation of sodium periodate; after that, OSH was used to cross-link with pADM to obtain OSH-pADM with specific and good moisturizing properties. With the increase in oxidation degree of OSH, the thermal and structural stabilities of OSH-pADM became stronger. The hydrophilic property and moisture retention capacity increased initially, and then decreased with increasing oxidation degree, with 40% OD-OSH-pADM being the best. The cytotoxicity of OSH-pADM met the requirements of biomaterials in vitro, and the scaffold had a good ability to promote wound healing. OSH-pADM is expected to be widely used in scald wound recovery, wound healing and skin donor wound applications.

Author Contributions

Conceptualization, Z.D.; methodology, Z.D.; software, Z.D and Y.C.; supervision, N.D.; writing—original draft, Z.D.; writing—review & editing, Y.C. and N.D. All authors have read and agreed to the published version of the manuscript.

Funding

This research was supported by the National Natural Science Foundation of China, No. 32101081; the Fundamental Research Funds for the Central Universities, No. 20826041E4156; and the Opening Project of Key Laboratory of Leather Chemistry and Engineering, (Sichuan University), Ministry of Education, No. SCU2021D005.

Institutional Review Board Statement

The animal study protocol was approved by the Ethics Committee of Experimental Animal Ethics Committee of West China Hospital, Sichuan University (protocol code 20211074A and 11 March 2022 of approval) for studies involving animals.

Conflicts of Interest

The authors declare no conflict of interest.

References

  1. Winter, G.D. Formation of Scab and Rate of Epithelization of Superficial Wounds in Skin of Young Domestic Pig. Nature 1962, 193, 293–294. [Google Scholar] [CrossRef] [PubMed]
  2. Cihat, S.E.; Sarah, H. Comparison of porcine and human acellular dermal matrix outcomes in wound healing: A deep dive into the evidence. Arch. Plast. Surg.-APS 2021, 48, 433. [Google Scholar]
  3. Javier, A.; Ana, S.; Cinthia, R.; Manuel, A.J. Clinical and Histological Differences between Guided Tissue Regeneration with Acellular Dermal Matrix of Porcine Origin and Autologous Connective Tissue: An Animal Study. Materials 2021, 14, 272. [Google Scholar]
  4. Dadlani, S. Porcine Acellular Dermal Matrix: An Alternative to Connective Tissue Graft—A Narrative Review. Int. J. Dent. 2021. [Google Scholar]
  5. Yi, N.C.; Nian, H.D.; Wei, H.D.; Xin, H.L.; Liang, L.C. A novel antibacterial acellular porcine dermal matrix cross-linked with oxidized chitosan oligosaccharide and modified by in situ synthesis of silver nanoparticles for wound healing applications. Mater. Sci. Eng. C-Biomimetic. Supramol. Syst. 2019, 94, 1020–1036. [Google Scholar]
  6. Selyanin; Mikhail, A.; Boykov; Petr, Y.; Khabarov; Vladimir, N. Hyaluronic Acid: Preparation, PROPERTIES, application in Biology and Medicine; Wiley: Hoboken, NJ, USA, 2015. [Google Scholar]
  7. Rautiola, R. Hyaluronic Acid: History, Uses and Health Effects; Nova Science: New York, NY, USA, 2020. [Google Scholar]
  8. Gall, Y. Hyaluronic acid: Structure, metabolism and implication in cicatrisation. Ann. Dermatol. Vener. 2010, 137, S30–S39. [Google Scholar] [CrossRef]
  9. Cui, Y.; Yan, H.L.; Duan, Q. The Research Progress in Hyaluronic Acid. J. Chang. Univ. Sci. Technol. 2011, 34, 101–106. [Google Scholar]
  10. Juncan, A.M.; Moisa, D.G.; Santini, A.; Morgovan, C.; Rus, L.L.; Vonica-Tincu, A.L.; Loghin, F. Advantages of Hyaluronic Acid and Its Combination with Other Bioactive Ingredients in Cosmeceuticals. Molecules 2021, 26, 4429. [Google Scholar] [CrossRef]
  11. Alina, S.; Magdalena, G.; Katarzyna, M.; Jacek, P. Hyaluronic Acid as a Component of Natural Polymer Blends for Biomedical Applications: A Review. Molecules 2020, 25, 4035. [Google Scholar]
  12. Galarza, S.; Crosby, A.J.; Pak, C.; Peyton, S.R. Control of Astrocyte Quiescence and Activation in a Synthetic Brain Hydrogel. Adv. Healthc. Mater. 2020, 9, e1901419. [Google Scholar] [CrossRef] [Green Version]
  13. Jin, G.L.; Feng, W.; Kun, Z.; Zi, K.H.; Dan, Z.; Xiao, L.; Yon, G.F.; Ping, Y.; An, S.Z.; Nan, H. Controlling Molecular Weight of Hyaluronic Acid Conjugated on Amine-rich Surface: Toward Better Multifunctional Biomaterials for Cardiovascular Implants. ACS Appl. Mater. Interfaces 2017, 9, 30343–30358. [Google Scholar]
  14. Murugan, P.; Subramaniam, S. Chitosan/Hyaluronic acid/Alginate and an assorted polymers loaded with honey, plant, and marine compounds for progressive wound healing—Know-how. Int. J. Biol. Macromol. 2021, 186, 656–685. [Google Scholar]
  15. Shang, Z.L.; Min, J.P.; Ting, T.W.; Hong, J.Y.; Shao, J.G.; Yong, Z.T.; Xin, L.; Ying, S.Z.; Wei, L.X.; Pu, X. Self-healing hyaluronic acid hydrogels based on dynamic Schiff base linkages as biomaterials. Carbohyd. Polym. 2020, 250, 116922. [Google Scholar]
  16. Hanh, L.; Hai, L.V.; Hoang, N.T.; Hanh, D.T.H.; Hai, L.M.; Nam, N.V. In vitro biodegradation behavior of biodegradable hydroxyapatite coated AZ31 alloy treated at various pH values. J. Appl. Biomater. Funct. Mater. 2021, 19, 228080002110100. [Google Scholar] [CrossRef] [PubMed]
  17. Graca, M.F.P.; Miguel, S.P.; Cabral, C.S.D.; Correia, I.J. Hyaluronic acid-Based wound dressings: A review. Carbohydr. Polym. 2020, 241, 116364. [Google Scholar] [CrossRef] [PubMed]
  18. Chen, Y.N.; Nan, N.H.; Wang, L.; He, C. Study on procine acellular dermal matrix crosslinked by isomaltooligosaccharide dialdehyde. J. Funct. Mater. 2016, 47, 5195–5200. [Google Scholar]
  19. Part 5: Tests for in vitro cytotoxicity. In Biological Evaluation of Medical Devices. Available online: https://www.iso.org/obp/ui/#iso:std:iso:10993:-5:ed-3:v1:en (accessed on 3 May 2022).
  20. Ramachandran, G.N. Infrared Spectrum and Structure of Collagen. J. Chem. Phys. 1955, 23, 600–601. [Google Scholar] [CrossRef]
  21. Pruitt, B.A.; Levine, N.S. Characteristics and Uses of Biologic Dressings and Skin Substitutes. Arch. Surg.-Chic. 1984, 119, 312–322. [Google Scholar] [CrossRef]
  22. Ghorbani, F.; Li, D.; Ni, S.; Zhou, Y.; Yu, B. 3D printing of acellular scaffolds for bone defect regeneration: A review. Mater. Today Commun. 2020, 22, 10979. [Google Scholar] [CrossRef]
  23. Reyhaneh, Z.; Jhamak, N.; Ghassem, A. Preparation, characterization, and silanization of 3D microporous PDMS structure with properly sized pores for endothelial cell culture. Biotechnol. Appl. Biochem. 2016, 63, 190–199. [Google Scholar]
  24. Whang, K.; Thomas, C.H.; Healy, K.E.; Nuber, G. A Novel Method To Fabricate Bioabsorbable Scaffolds. Polymer 1995, 36, 837–842. [Google Scholar] [CrossRef]
  25. Bear, R.S. X-ray, diffraction studies on protein fibers I The large fiber-axis period of collagen. J. Am. Chem. Soc. 1944, 66, 1297–1305. [Google Scholar] [CrossRef]
  26. Sai, P.; Babu, M. Collagen based dressings—A review. Burns 2000, 26, 54–62. [Google Scholar] [CrossRef]
  27. Ho, Y.S.; McKay, G. The sorption of lead(II) ions on peat. Water Res. 1999, 33, 578–584. [Google Scholar] [CrossRef]
  28. Ho, Y.S.; McKay, G. Pseudo-second order model for sorption processes. Process Biochem. 1999, 34, 451–465. [Google Scholar] [CrossRef]
  29. Luan, X.R.; Li, W.H.; Lou, F.L. Applied analysis of humanized nursing combined with wet healing therapy to prevent bedsore. Eur. Rev. Med. Pharmacol. Sci. 2016, 20, 4162–4166. [Google Scholar]
  30. Zhi, M.N.; Jia, C.S.; Shi, L.Q. Application of Easy Wet Healing Therapy for Chronic Noninfectious Wounds in Limbs. Int. J. Biol. Macromol. 2020, 21, 87–91. [Google Scholar]
  31. Shamsuria, O.; Fadilah, A.S.; Asiah, A.B.; Rodiah, M.R.; Suzina, A.H.; Samsudin, A.R. In vitro cytotoxicity evaluation of biomaterials on human osteoblast cells CRL-1543; hydroxyapatite, natural coral and polyhydroxybutarate. J. Medical. Malaysia. 2004, 59 (Suppl. SB), 174–175. [Google Scholar]
  32. Wu, S.; Wu, X.Q.; Zhu, W.; Cai, W.J.; Schaper, J.; Schaper, W. Immunohistochemical study of the growth factors, aFGF, bFGF, PDGF-AB, VEGF-A and its receptor (Flk-1) during arteriogenesis. Mol. Cell Biochem. 2010, 343, 223–229. [Google Scholar] [CrossRef]
  33. Kuroyanagi, Y.; Kubo, K.; Matsui, H.; Kim, H.J.; Numari, S.; Mabuchi, Y.; Kagawa, S. Establishment of banking system for allogeneic cultured dermal substitute. Artif. Organs 2004, 28, 13–21. [Google Scholar] [CrossRef]
Figure 1. FTIR spectra of OSH-pADM cross-linked with different oxidations of OSH.
Processes 10 00916 g001
Figure 2. Schematic diagram of the cross-linking reaction between pADM and OSH.
Processes 10 00916 g002
Figure 3. SEM images of OSH-pADM cross-linked with different oxidations of OSH (500×) (A) Padm, (B) OD10%-OSH-pADM, (C) OD20%-OSH-pADM, (D) OD40%-OSH-pADM, (E) OD60%-OSH-pADM.
Processes 10 00916 g003
Figure 4. XRD spectra of OSH-pADM cross-linked with different oxidations of OSH.
Processes 10 00916 g004
Figure 5. TG curves of OSH-pADM cross-linked with different oxidations of OSH.
Processes 10 00916 g005
Figure 6. dTG curves of OSH-pADM cross-linked with different oxidations of OSH.
Processes 10 00916 g006
Figure 7. DSC patterns of OSH-pADM cross-linked with different oxidations of OSH.
Processes 10 00916 g007
Figure 8. Resistance to degradation of OSH-pADM cross-linked with different oxidations of OSH.
Processes 10 00916 g008
Figure 9. Water contact angles of OSH-pADM cross-linked with different oxidations of OSH.
Processes 10 00916 g009
Figure 10. The moisture rate, water absorption rate and capillary water absorption rate of OSH-pADM cross-linked with different oxidations of OSH.
Processes 10 00916 g010
Figure 11. Variation curves of water content of OSH-pADM cross-linked with different oxidations of OSH from 0 to 16 h (RH93%).
Processes 10 00916 g011
Figure 12. Fitting curves of OSH-pADM hygroscopic processes ((A) first-order adsorption equation; (B) second-order adsorption equation fitting).
Processes 10 00916 g012
Figure 13. Proliferation of L929 fibroblasts cultured in the extracts of OSH-pADM cross-linked with different oxidations of OSH.
Processes 10 00916 g013
Figure 14. Images demonstrating the healing patterns of wounds over time.
Processes 10 00916 g014
Figure 15. H&E staining diagrams of full-thickness wound sections ((A) blank group, (B) experimental group). Chromatin and ribosomes are purplish blue, cytoplasm and extracellular matrix are red.
Processes 10 00916 g015
Figure 16. bFGF, PDGF and VEGF immunohistochemical analysis of full-thickness wound sections ((A) blank group, (B) experimental group).
Processes 10 00916 g016
Table 1. Parameters of fitting curves of the first-order adsorption equation for OSH-pADM.
qe/expk1qe/calR2
pADM275.110.1131162.740.8551
OD10%-OSH-pADM278.900.1166167.530.8201
OD20%-OSH-pADM314.550.1083171.240.8004
OD40%-OSH-pADM320.600.1115181.180.8366
OD60%-OSH-pADM292.010.1070169.030.8294
Table 2. Parameters of fitting curves of the second-order adsorption equation for OSH-pADM.
qe/expk2qe/calR2
pADM275.110.0028261.090.9993
OD10%-OSH-pADM278.900.0024261.780.9989
OD20%-OSH-pADM314.550.0035293.250.9996
OD40%-OSH-pADM320.600.0254305.810.9996
OD60%-OSH-pADM292.010.0026277.010.9988
Publisher’s Note: MDPI stays neutral with regard to jurisdictional claims in published maps and institutional affiliations.

