Abstract
China’s LNG import volume in 2021 reached 121.356 million tons, which makes China the largest importer in the world. The ambient air vaporizer (AAV) for LNG vaporization is an ideal selection for minimizing the average monetary value of terminals and maximizing operating efficiency. However, the heat and mass transfer performance of real multi-component LNG is not the same as that of the pure component in AAV; what is more, deep cryogenic and multi-component characteristics of LNG could lead to the deterioration of heat-transfer performance, which may cause catastrophic consequences. Thus, this difficulty should be concerning and solved in its operation. Based on the law of conservation of energy and mass, a heat and mass transfer model was established that can calculate the coupled heat transfer from the LNG to the air-side of the AAV along its own length. Empirical correlations are proposed to predict some basic properties of the frost layer at the outside of the tube, where the internal fluid is seen as a pure component and a multi-component. The numerical results show that the root–mean–square error (RMS) of the frost thickness is 0.749 mm, and the RMS of the outlet fluid temperature is 2.06 K and 2.21 K in summer and winter, respectively. That is in good agreement with the experimental data in the previous literature. The results show that the length of the finned tube in the AAV affected by pure was increased by 42.5%; therefore, we recommend shortening the finned tube on the basis of safety to save costs. Compared to the pure components reference experiments, when the content of multi-component in five regions was 78.48–96.91%, it is found that the different varieties of thermodynamic dryness degree x within the two types of components is the key point for the distinct mechanisms of the heat transfer characteristics of the AAV. Additionally, compared to changing the design pressure and flow rate, it is found that varying the flow rate has a much greater impact on the heat and mass transfer performance of the AAV than changing its pressure. The calculation of the coupled heat and mass transfer of the AAV can provide a theoretical basis for subsequent engineering designs.
1. Introduction
With corresponding energy conservation and emission reduction policies, natural gas has become more popular in the macrocosm. It is critical to choose the best regasification facilities because it has a huge impact on revenue over the entire operating period in the LNG system. The regasification facilities can be classified into several types according to the heat sources: open rack vaporizer (ORV) [1], ambient air vaporizer (AAV) [2,3], submerged combustion vaporizer (SCV) [4], and intermediate fluid vaporizer (IFV) [5,6]. These vaporizers have different characteristics, which means we can select the best one according to our needs and economic requirement when considering climatic conditions. One of the promising alternatives is the AAV where the heat resource stems from ambient air that needs no money. Neither will it make any cold contamination, such as the ORV killing marine life, nor will it produce industrial exhaust gas or the SCV contaminate ambient air. Thus, this kind of small-scale regasification application based on ambient air as the heat source is widely used in China nowadays.
The schematic diagram of the finned tube in the AAV is shown in Figure 1, where the inlet temperature of LNG is 111.15 K, which is far less than the ambient air temperature. The deep cryogenic fluid can require substantial energy to balance the heat conversation, so that the finned tube adds several fins to balance the heat flux. During the operation time, the relatively lower temperature surface of the finned tube could generate a water vapor density difference between the surface itself and far-field of the ambient air. The same consequences from the lower to upper part of the finned tube with LNG’s temperature increasing can also be generated. The water vapor condenses on the cold surface when the surface temperature is below 273.15 K. One particular concern of the AAV involves frost layer is appearing on the surface like a thermal resistance that hinders heat transfers from external to internal fluid, which makes the outlet temperature of LNG decrease. It will lead to engineering accidents when the outlet fluid temperature can dissatisfy the export requirement.
Figure 1.
Schematic diagram of the AAV.
Some scholars have focused on the microscopic performance and development mechanism of frost under the normal cryogenic surface without considering the influence of the LNG phase changing on the opposite side. Hayashi [7] observed the microstructure of frost crystal according to experimental ways and defined the three stages of frost growth. Na [8,9,10] considered the nucleation process of frost formation in which the ambient air at the cold surface should be supersaturated. Iragorry [11] and Dang [12] summarized Hayashi’s research and drew a different conclusion: the frost formation has been divided into four steps, which is different from Hayashi’s theory. He has made a more detailed classification of the early time in frost formation. Cui [13] followed Hayashi’s theory and conducted a CFD numerical simulation that found the growth of frost crystals is relatively faster in the initial period, and frost formation in the initial period is mainly influenced by the thickness of frost. Kandula [14,15] considered that the air velocity has a low impact on frost formation but has a significant impact on frost density. Wu [16] considered that the decreased Gibbs free energy is equal to the driving force of the phase transition of water into frost. Other scholars have paid more attention to the effect of the macroscopic physical properties of the frost layer on the performance of the heat exchanger. Some of them treated the frost growth process as a one-dimensional procedure, and the increase of frost density was equaled to water vapor weight diffusing into the frost layer where it was calculated by using empirical correlations [17,18,19,20,21]. Jones [22] proposed a detailed porous media model that considered the parameters of the ambient air for the heat exchanger when it was in frost conditions. Kim [23] developed a frost mechanism according to the thermal network analysis (TNA) technique. Liu [24] considered the finite difference method to replace the original average frost values to predict the coupled heat transfer between the fin and the ambient air. Lee [25] proposed a new volumetric mass transfer rate equation to predicate a highly porous frost layer formed by desublimation and showed the average mass transfer rate as a function of time. Jacobi [26] imposed physically realistic boundary conditions and allowed the calculation of the water vapor density gradient at the frost–air interface in the model to replace previous saturation and supersaturation models.
It can be concluded that previous researchers have rarely focused on AAV, which is based on cryogenic conditions [14,27]. Furthermore, for the single component and multi-component, the difference between the two kinds of cryogenic working fluids for external frost and overall heat transfer of AAV during regasification has not been mentioned [28,29]. Additionally, the overall heat-transfer performance in AAV should be critically focused on because the operating time of itself is closely related to it. The heat and mass transfer performance of the frost formation models for the deeply cryogenic surface is different from all of the above.
The key work of this paper is to establish a coupled heat and mass transfer model of LNG containing different components from different regions in AAV. A mathematical model of heat and mass transfer outside the AAV has been established by energy and mass conservation, and a mathematical model of the whole coupled heat transfer has been developed by combing the LNG multi-component phase change according to energy conservation inside the AAV as well. The physical parameters of the frost layer have been brought in to close the equation. Through setting different calculation times, relative humidities of ambient air, operating pressures and flow rates, the heat transfer differences of different components in distinct regions, such as temperature, heat transfer coefficient, frost layer thickness, etc., at the corresponding location were calculated and analyzed when the AAV was in operation. Thereby, the regasification performance difference of AAV under the single-component and multi-component fluid working medium has been obtained, and the reasons for the regasification difference have been found. Thus, the AAV can be designed and manufactured more accurately on the basis of safety.
In this paper, Section 2 illustrates the whole process of the establishment of the mathematical model. Section 3 firstly validates the frost thickness outside and fluid temperature inside from the AAV and then analyzes the simulated heat or mass transfer performance results dated from different operation conditions. Section 4 was the overall conclusion of the previous sections.
2. Mathematical Model of AAV
This paper establishes the regasification process of an AAV based on the law of conservation of energy and mass and the theory of heat and mass transfer. Before modeling, on the one hand, the physical process is expected to be accurately described; on the other hand, the calculation requirements are needed to be reduced as much as possible. For this reason, it is very necessary to make some simplifications without losing the calculation requirements.
The AAV is heated by sensible heat from the surrounding ambient air and latent heat from the desublimation of water vapor. The heat transfer process is pretty complex, so some assumptions are needed to simplify the model: (a) Heat and mass transfer processes are one-dimensional at the frost layer. This is because the frost layer only grows along the vertical direction on the micro-element of the AAV, and the mutual influence between themselves is neglected. (b) The frosting process is quasi-steady. If the frosting process is a transient procedure, the parameters of the frost layer can change nonlinearly with time. This is not only unhelpful to the engineering problem but also increases the complexity of the solution. (c) Parameters of the frost are regarded as the mean value under the development of time. This hypothesis is simply corresponding to assumption b. The selected way of calculation with a quasi-steady process allows the parameters of the frost layer to vary only with the temperature of the frost layer. (d) Parameters of the atmosphere will be regarded as constant. (e) The time of the water molecule’s phase transition in air is neglected. In this way, it can be concluded that the water molecules change into the frost crystals directly, and all the heat released in this process is used to warm the AAV rather than being released into the air.
2.1. External Heat and Mass Transfer Process of AAV
There are two types of criteria for frost formation on the finned tube when the AAV is in operation. One is that water vapor changes directly from gas to the solid phase. The other is that water vapor transfers from the gas phase to the liquid phase and then to the solid phase. Using the micro-element method, the finned tube of the AAV is divided into numerous micro-element segments along the length of the tube, and one of the micro-element segments is intercepted for analysis. Based on the law of energy and mass conservation, the heat released per unit area of the frost that can consist of sensible and latent heat is equal to the amount of heat penetrated per area of the finned tube [30].
where is the thermal conductivity of the frost layer, ; is the temperature, K; is the comprehensive convective heat transfer coefficient at the air-side, ; is mass flux of the water vapor through the frost surface, ; is the latent heat of sublimation of water vapor, ; and is the thickness of the frost layer, m.
The latent heat of sublimation of water vapor is a function of the temperature of the frost layer [31].
The storage capacity of water molecules on a cold surface is equal to the difference between the water vapor concentration of the far-field air and the surface of the finned tube multiplied by the interface mass transfer coefficient [32]. Based on the previous assumptions, the frost layer can be regarded as a one-dimensional average medium. So according to the theorem of mass transfer, the accumulation of frost crystals per unit area is equal to the product of the frost layer thickness and the frost layer density.
where is the mass of vapor through the frost surface per unit area, ; is the time, s; is the interfacial mass transfer coefficient, . and are represent water density between the far-field and surface, ; is the density of frost layer [7], .
Other parameters need to be introduced to close the equation and obtain a satisfactory solution. The mass transfer outside AAV is calculated by heat and mass analogy [33]. Additionally, both water density of far-field and surface are, respectively, expressed as follows.
where is the convective heat transfer coefficient, ; is the relative humidity of the air; is the density of ambient air, ; is specific heat of ambient air at constant pressure; is lewis number; and are, respectively, the saturation pressures of water vapor at far-field and frost surface, ; is the universal gas constant of the water vapor, ; and is the supersaturation degree.
The frost layer is regarded as a porous medium composed of air and ice crystals that can be expressed as follows [34].
where and are the minimum and maximum thermal conductivities of the frost layer, ; and and are empirical correlations taken from ref. [34] and ref. [7], respectively. The range of Equation (11) includes wall temperatures that apply for . Equation (12) applies to wall temperatures in the range of 248.15 K to 273.15 K. Additionally, also derives from Hayashi, so its range is the same as that of Equation (12). is the thermal conductivity of ice, and is the thermal conductivity of ambient air, .
The overall convective heat transfer coefficient can be calculated as
where is the overall convective heat transfer coefficient, ; is the efficiency of the finned tube; is the finned coefficient; and is the heat transfer coefficient at frost condition [35], .
where and are, respectively, heat transfer coefficients of natural convection and radiation, ; is radiation emission rate; is Boltzmann factor, ; , and are, respectively, the dimensionless constants of the ambient air.
2.2. Internal Heat Transfer Process of AAV
The fluid is in saturated condition with the temperature not changing, as single-component fluid leaves from the single-phase to the two-phase. The liquid component decreases and the vapor component increases until the fluid enters the superheated. However, it is pretty different from the actual fluid because LNG is a kind of multi-component fluid. When the temperature of LNG reaches the bubble point, some of the light components first escape from the liquid phase to the vapor phase. With the increase of LNG temperature and thermodynamic dryness degree, part of the heavy components occurs in the same process. With the continuous increase of both of them, the increasing rate of light component ratio is more degraded than that of heavy component in the two-phase until the total fluid temperature reaches the dew point and enters the vapor phase.
According to the phase transition process of actual LNG fluid, it can be separated into three to predict the internal fluid heat-transfer performance. Firstly, it is named as the pure liquid phase before LNG reaches the bubble point. Second, between the bubble point and dew point, it is named the mixed phase. Finally, after the LNG temperature is greater than the dew point, it is named the pure-vapor phase. Typical hydrodynamics theory can solve the pure phase while how to predict the heat-transfer performance of the multi-component fluid in the mixed phase accurately is still a tough problem. This paper predicted the mixed phase according to the correlation from refs. [36,37], which was adopted to calculate the average heat transfer coefficient. If , then ; elseif , then ; elseif , then .
where the is the mixing speed, ; is the mass flow rate, ; x is the thermodynamic dryness degree; and are, respectively, the density of liquid phase and vapor phase; is the bubble characteristic size constant, ; is the surface tension, ; is the heat flux, ; is the system pressure, ; is the latent heat, ; is the thermal diffusivity, ; is the thermal conductivity of the finned tube; , and are, respectively, the dimensionless constants of the LNG.
2.3. Framework
Considering the heat transfer of a single-finned tube, the influence of adjacent finned tubes on each other can be ignored. The temperature of ambient air and LNG were, respectively, 293.15 K and 111.15 K, and relative humidity was 50%. The LNG was composed of methane (90.68%), ethane (7.06%) and propane (2.26%). The capacity of AAV was 2000 , in which the operating pressure was 0.6 MPa. It had 10 tubes, and each tube had 48 m that could be added to 12 fins. The inner diameter of finned tube, , was 28 mm and outer, , was 32 mm. Each thickness of the fin was 4 mm, and the height was 80 mm. The coupled heat transfer from the air-side to LNG was performed in Visual Studio 2013 through Fortran, where the physical properties of LNG and NG was called by the REFPROP software. Figure 2 illustrates the flow chart of the calculation program for AAV.
Figure 2.
Flow chart of the calculation program for AAV.
3. Results and Discussions
3.1. Model Validation
Based on the presented model of coupled heat and mass transfer from the air-side to the LNG side, the coupled dynamic heat-transfer performance of AAV is presented. When the AAV was in operation, the process of heat and mass outside the tube from the bottom to the top was accompanied by the heat transfer of LNG’s phase change inside the finned tube.
As Figure 3 illustrates, along the flowing direction of deep cryogenic fluid in the finned tube, a measuring point is arranged at the position of the finned tube per 300 mm, with a total of four measuring points. The thickness of frost layer increased with time, but the growth rate decreased with time. It can be ascertained that the predicted results agreed well with the observational data in which the root–mean–square error was 0.749 mm, where the experimental results are presented in ref. [38].
Figure 3.
Comparison of predicted frost thickness and experimental results.
Keeping other conditions unchanged, we set the environmental conditions to be summer and winter. For summer, was 294 K, and the relative humidity φ was 0.7. For winter, was 267 K, and the relative humidity φ was 0.5. Figure 4 shows the comparison of predicted and the experimental data. It can be seen that the outlet temperature decreases with the increase of operating time. The test results are in good agreement with the experimental results. The root–mean–square errors in summer and winter were 2.06 K and 2.21 K, respectively. There is a key point that is worth noting: that the magnitudes were different in summer and winter. This is because of the greater influence of the quadratic of temperature on the radiation heat exchange coefficient. Furthermore, the extremely low ambient air temperature in winter causes the blocking effect of the frost crystal porous medium to be stronger. As a consequence, the predicted temperature at the outlet in summer was lower than the detection data, while in winter it was higher than the detection data. The experimental results are presented in ref. [39].
Figure 4.
Comparison of predicted Tout and experimental results.
3.2. Analysis of Single-Component and Multi-Component Heat Transfer Characteristics
3.2.1. Analysis of Heat Transfer Characteristics in Two Components
The process of heat transfer of LNG in a finned tube from bottom to top is affected by the phase change of water vapor on the surface of the finned tube as well. It is required that the temperature of outlet fluid is not less than that of the ambient 10 K to reach the export condition. , and represent the pure liquid phase; , and represent the mixed phase; and , and represent the pure-vapor phase. Except for pure , the rest curves are based on multi-component conditions. As can be seen from Figure 5, on the one hand, the total length of three phases in the no-frost condition is 13.7 m, which is less than 24.69 m of the multi-component fluid in the frost condition from the perspective of changing outside conditions of the finned tube. Thus, the thermal resistance of the frost layer deteriorates heat-transfer performance. On the other hand, the total length of three phases with multi-component fluid in AAV is 24.69 m, which is less than 42.93 m of a single component from the perspective of the changing internal fluid type variation. It can be detected that the mechanism of regasification is different between the two types of fluid. Moreover, the internal fluid temperature development in the mixed phase is different between the single-component and the multi-component type. The most different key point is that LNG rises from the bubble point ( = 140.75 K) to dew point ( = 196.15 K) in the mixed phase, but the pure could only keep a saturation temperature ( = 138.73 K) until the thermodynamic dryness degree was greater than 1.0. It can also be seen from six groups of data that the temperature of the multi-component fluid performed a parallel movement along the direction of AAV as time increased.
Figure 5.
Variation of LNG fluid temperature at different operation times.
The surface temperature of the finned tube can best reflect the effect of coupling heat-transfer performance both inside and outside the finned tube. The influence of frost on the finned tube can still be reflected in Figure 6, where the cold surface temperature under the no-frost condition is higher than the frost condition at the same position in three phases. However, there is a slight difference in the surface temperature, which presents an obvious small, sudden drop when the LNG enters the mixed phase. This is because the mechanism of the heat transfer in an internal fluid is distinct between pure liquid phase and the mixed phase.
Figure 6.
Variation of finned tube surface temperature at different operation times.
It can be seen very intuitively about the coupled heat and mass transfer on the growth of frost layer thickness from Figure 7. No matter how long the AAV was operated, the thickness of the frost layer gradually decreased from bottom to top, but it did not decline linearly. The minimum inlet led to the lowest at the same location, and inlet fluid was located at the bottom of the vertical position where the upper moisture containing ambient air would be precipitated. Therefore, the thickness of frost at the inlet location has the greatest value. The thickness declines linearly along the tube from 0 m to 4.2 m, but there is a remarkable variation at 4.2 m. This is because the fluid in the tube entered the mixed phase and developed a larger heat-transfer performance than in the previous section. The frost layer outside the finned tube caused by the multi-component fluid can be detected as an obvious linearly decreasing trend when the length of itself was between 4.2 m to 20 m. However, it was maintained at 8.5 mm at 4.2 m to 24.69 m when the internal fluid was pure . This is the same as the trend of both the internal fluid temperature and the thermal resistance changing with time.
Figure 7.
Variation of frost thickness along with the direction of the tube at different operation times.
One of the direct effects of increasing frost deposition on the finned tube is that the thermal resistance changes correspondingly. Figure 8 shows the variation of thermal resistance along with the direction of the tube at different operation times. It can be detected that the thermal resistance of the frost layer keeps the same movement under the development of the frost layer no matter how the internal fluid is a single component or a multi-component. Thermal resistance deteriorates heat transfer with increasing operation time, and its maximum value occurs at the inlet is 0.78 in multi-component fluid during 24 h operation. At the same time, the pure liquid phase and mixed phase moved forward, and the pure-vapor phase moved backward a distance of 0.47 m. The continuous operation of AAV will inevitably increase the thermal resistance to make the outlet fluid temperature fail to meet the requirement. Therefore, once is lower than the required standard for export, it must be shut down and defrosted periodically.
Figure 8.
Variation of thermal resistance along with the direction of the tube at different operation times.
The comprehensive convective heat transfer of the air-side has a different performance. As illustrated in Figure 9, under the no-frost condition is 1.58 times the frost condition at the inlet location, but it drops up to only 5.5 at the outlet. Whatever internal fluid is multi-component or single-component, the peak point of does not appear in the mixed phase but appears in the pure-vapor phase. This is because the thermal resistance of an extremely thick of frost layer not only is regarded as an insulation wall, which hinders the heat transfer between the internal and external of the frost layer. A thinner layer of frost will increase the energy transform area and promote heat-transfer performance. As a result, there is a peak point in the pure-vapor phase. Another point that needs to be cautioned is that it has a small drop when the liquid is transformed from the pure liquid phase to the mixed phase. This is because the fluid in the AAV enters the mixed phase from the pure liquid phase where the mechanism of heat transfer in the internal tube changed from subcool boiling to forced convection heat transfer through liquid film. This phenomenon can be seen in Figure 5, Figure 6, Figure 7, Figure 8 and Figure 9.
Figure 9.
Variation of comprehensive heat transfer coefficient of the air-side at different operation times.
LNG phase changing can be affected by the energy transfer conservation of finned tube in the internal and external. Frost deposited on the finned tube affected the surface heat-transfer performance and then influenced the distribution of the temperature of the finned tube, and finally, it obstructed the temperature of the internal fluid. As Figure 10 illustrates, in the critical point of the mixed phase, it can be seen that the multi-component fluid under the no-frost condition can obviously reach up to 19,668 in the mixed phase, which is higher than 7000 of the same composition and section under the frost condition. By comparing under the two types of fluid in the mixed phase, the multi-component liquid had a significant rise from (3000–7000) and then held a stable value while the single-component liquid always held 7000 in the whole mixed phase. It can be analyzed that there is a different heat transfer mechanism between real LNG and pure fluid when LNG is vaporizing. Because the gradually increasing allows the light component to firstly escape from the mixture fluid for the first time, the proportion of components in the pure liquid phase then begins to change. Along with the increasing x and , the light component will escape from LNG accompanied by the heavier component as well. As x and continued increasing, the vaporizing rate of light component was greater than that of the heavier component until the whole fluid is vaporized and enters the pure-vapor phase. It is the reason why the complex heat transfer coefficient changed sharply in the mixed phase as well. At the same zone as pure fluid, the single component has one fixed saturation temperature that keeps stable when the thermodynamic dryness degree changes from 0 to 1.0.
Figure 10.
Variation of convective heat transfer coefficient of internal fluid at different operation times.
The overall convective heat transfer coefficient is one of the comprehensive standards for evaluating the heat-transfer performance of the AAV. On the one hand, the extreme phase change of the LNG inside the tube has a heavy impact on the overall heat transfer; on the other hand, it is also affected by the number and area of fins. As Figure 11 shows, in the pure liquid phase, under the no-frost condition can reach up to 115.71 , which is 3.5 times of 33.1 of frost condition under multi-component fluid, and 2.7 times of 43.5 of frost condition under single-component fluid. can reach up to 155.6 at the end of the mixed phase. While in frost condition, it decreases to 143.3 under the multi-component fluid and 119 under the single component. Compared with the no-frost condition, the frost deposition on the finned tube caused by the multi-component increased the designed length of the finned tube in AAV by 44.5%. Compared with the two types of fluid under frost conditions, the designed length of the finned in AAV was caused by the pure , which increased it up to 42.5%. Therefore, it can be concluded that the frost layer has a serious impact on the deterioration of its heat-transfer performance, and the designed length of the AAV can be shorter under the real LNG when the AAV is in operation.
Figure 11.
Variation of overall convective heat transfer coefficient at different operation times.
3.2.2. Analysis of Heat Transfer Characteristics in Multiple Components
The above working condition compares the differences between pure methane and multi-component LNG at different operating times. The main reason for these two differences is due to the different phase change mechanisms in AAV. In order to study the different reasons, more comparisons between components were carried out. By introducing 5 LNG components from different regions and simplifying them, only the main components are retained for calculation. The main components of the five regions are shown in Figure 12, in which the data sources come from ref. [40].
Figure 12.
LNG components in different regions.
By setting to 288.15 K and the relative humidity to 0.56 for a one-hour simulation, it can be seen that the and positions of the multi-component LNG have not changed significantly from Figure 13, but it has a trend to shift to the right in the position where the LNG reaches the qualified export temperature. When the average increasing rate of methane content was 4.61% in the regions, the average deviation rate of the to the right was 2.46%, which shows that the heat transfer effect caused by changing the content of methane is very small for AAV, so the change of the content of methane in LNG has very limited effects on the operation of itself. Moreover, as the methane composition gradually rises, the temperature at the mixed phase zone in the finned tube does not rise first, but the more methane is in the composition, the more the phase change lags behind.
Figure 13.
Variation of TL along with length in different regions.
We have already compared the temperature changes based on the multi-component and single component, only focusing on what caused the differences in the heat transfer mechanism of single component and multi-component inside the finned tube. For this reason, the thermodynamic dryness x in the tube was calculated. As shown in Figure 14 and Figure 15, the x can reflect the heat transfer characteristics of the LNG inside the finned tube. We compared the x of five components from different regions with that of methane, ethane and propane under the same working conditions. It was found that the slope of the pure component (0.085) was significantly lower than that under the multi-component condition (0.042) in the pure liquid phase and the mixed phase. The thermodynamic dryness degree of LNG varied with the composition when the dryness exceeded 1.0, which may be due to the different sequence of phase changes when the dryness reaches 1.0 within the multi-component. In the case of pure components, the heavier on the molar molecular weight is, the lower it is to the initial x, and the molar molecular weight of methane and ethane can exceed 1.0 with the length of the tube, while propane has completely failed to meet the export requirements.
Figure 14.
Variation of x along with length in different regions.
Figure 15.
Variation of x along with length at different pure fluids.
So, will changing other parameters of multi-component LNG will have any effect on the overall heat transfer of the finned tube? For example, change the flow rate and pressure of the AAV. As shown in Figure 16, it can be seen that with the increase in the flow rate, inside the finned tube has the same obvious trend of “translation” to the left under the same composition. As time increased, the , and of the AAV was significantly shifted to the right. This is because the increase in the flow rate led to the increase of the LNG flow through the cross-sectional area of the finned tube per unit time, which subsequently requires more heat to vaporize LNG.
Figure 16.
Variation of TL along with length at different flow rates.
However, the fixed physical geometry obviously cannot meet its heat transfer requirements, and it can only lag the heat transfer with the flow rate. It can be seen from Figure 16 that for every 0.01 increase in the design of the flow rate, the average deviation of the position was 14.3%, the average deviation of the position was 14.1%, and the average deviation of the was 14.5%. Correspondingly, the change of the pure liquid phase and the pure-vapor phase of the AAV was not affected by the design pressure, and the obvious “translation” trend occurred only in the mixed phase. When the acceleration of the design pressure increase was 0.1 MPa, it can be concluded from Figure 17 that the average deviation of the AAV to reach the is 4.87%. This is much smaller than the influence on the position where the AAV meets the outlet temperature when the flow rate is changed.
Figure 17.
Variation of TL along with length at different pressures.
We collected the temperature at the outlet of the AAV under different flow rates. As Figure 18 illustrates, it is found that when the flow rate increasing rate was 0.01 , the average drop in was 2.99 K. Additionally, after the flow rate reached 0.0901 , the AAV had not reached the after the one-hour operation. It shows that the AAV with a fixed geometric size has a certain limit value in the flow rate. When the flow rate exceeds a certain limit, the gasification is incomplete and does not meet its operational requirements. However, the situation is different when the pressure is changed. It can be seen from Figure 18 that when the acceleration value of the pressure increase was 0.1 MPa, the average rate of drop of the AAV was only 0.125 K. By comparing both situations, we can conclude that the influence of increasing the flow rate on the is significantly greater than that of increasing the design pressure inside the AAV.
Figure 18.
Variation of Tout along with length at different flow rates and pressures.
With changing the design pressure or flow rate value, there is another parameter that should be paid attention to, which is , an important parameter for the heat-transfer performance of the AAV. As shown in Figure 19 and Figure 20, no matter how large the flow rate or operation is, the at the inlet of the AAV is a fixed value for 33.3 .
Figure 19.
Variation of Kx along with length at different flow rates.
Figure 20.
Variation of Kx along with length at different pressures.
Different from the LNG temperature, the peak heat transfer coefficient of the AAV will increase as the flow rate increases. With an average increase of 498.27 in flow rate, the peak heat transfer coefficient increased by 4.17 on average, and the average relative position lagged by 4.2 m. This is because the increase in the flow rate leads to a greater demand for heat transfer per unit area. Although there is a “translation” performance in the tube length, it is still inevitable and will still reach the maximum value at a certain position. Correspondingly, when the acceleration of the design pressure increase was 0.1 MPa, the average peak heat transfer coefficient increased by 0.71 , and the average relative position lagged by 1.2 m. It can be seen that changing in the peak value and position of the total heat transfer coefficient caused by the varying in the flow rate was greater than the influence of the pressure on it.
4. Conclusions
The secure regasification of LNG is the core issue concerned by regasification plants. Frosting on AAV, which is caused by multi-component cryogenic LNG, could lead to deteriorating heat-transfer performance. This paper established a heat and mass transfer model that could calculate the coupled heat transfer between LNG and ambient air along the length of the AAV. The model accounted for overall heat transfer under frost deposition on the surface with internal fluid phase changing, which was validated with experimental data from previous literature, and a good agreement was obtained as well. The conclusions are as follows:
- (1)
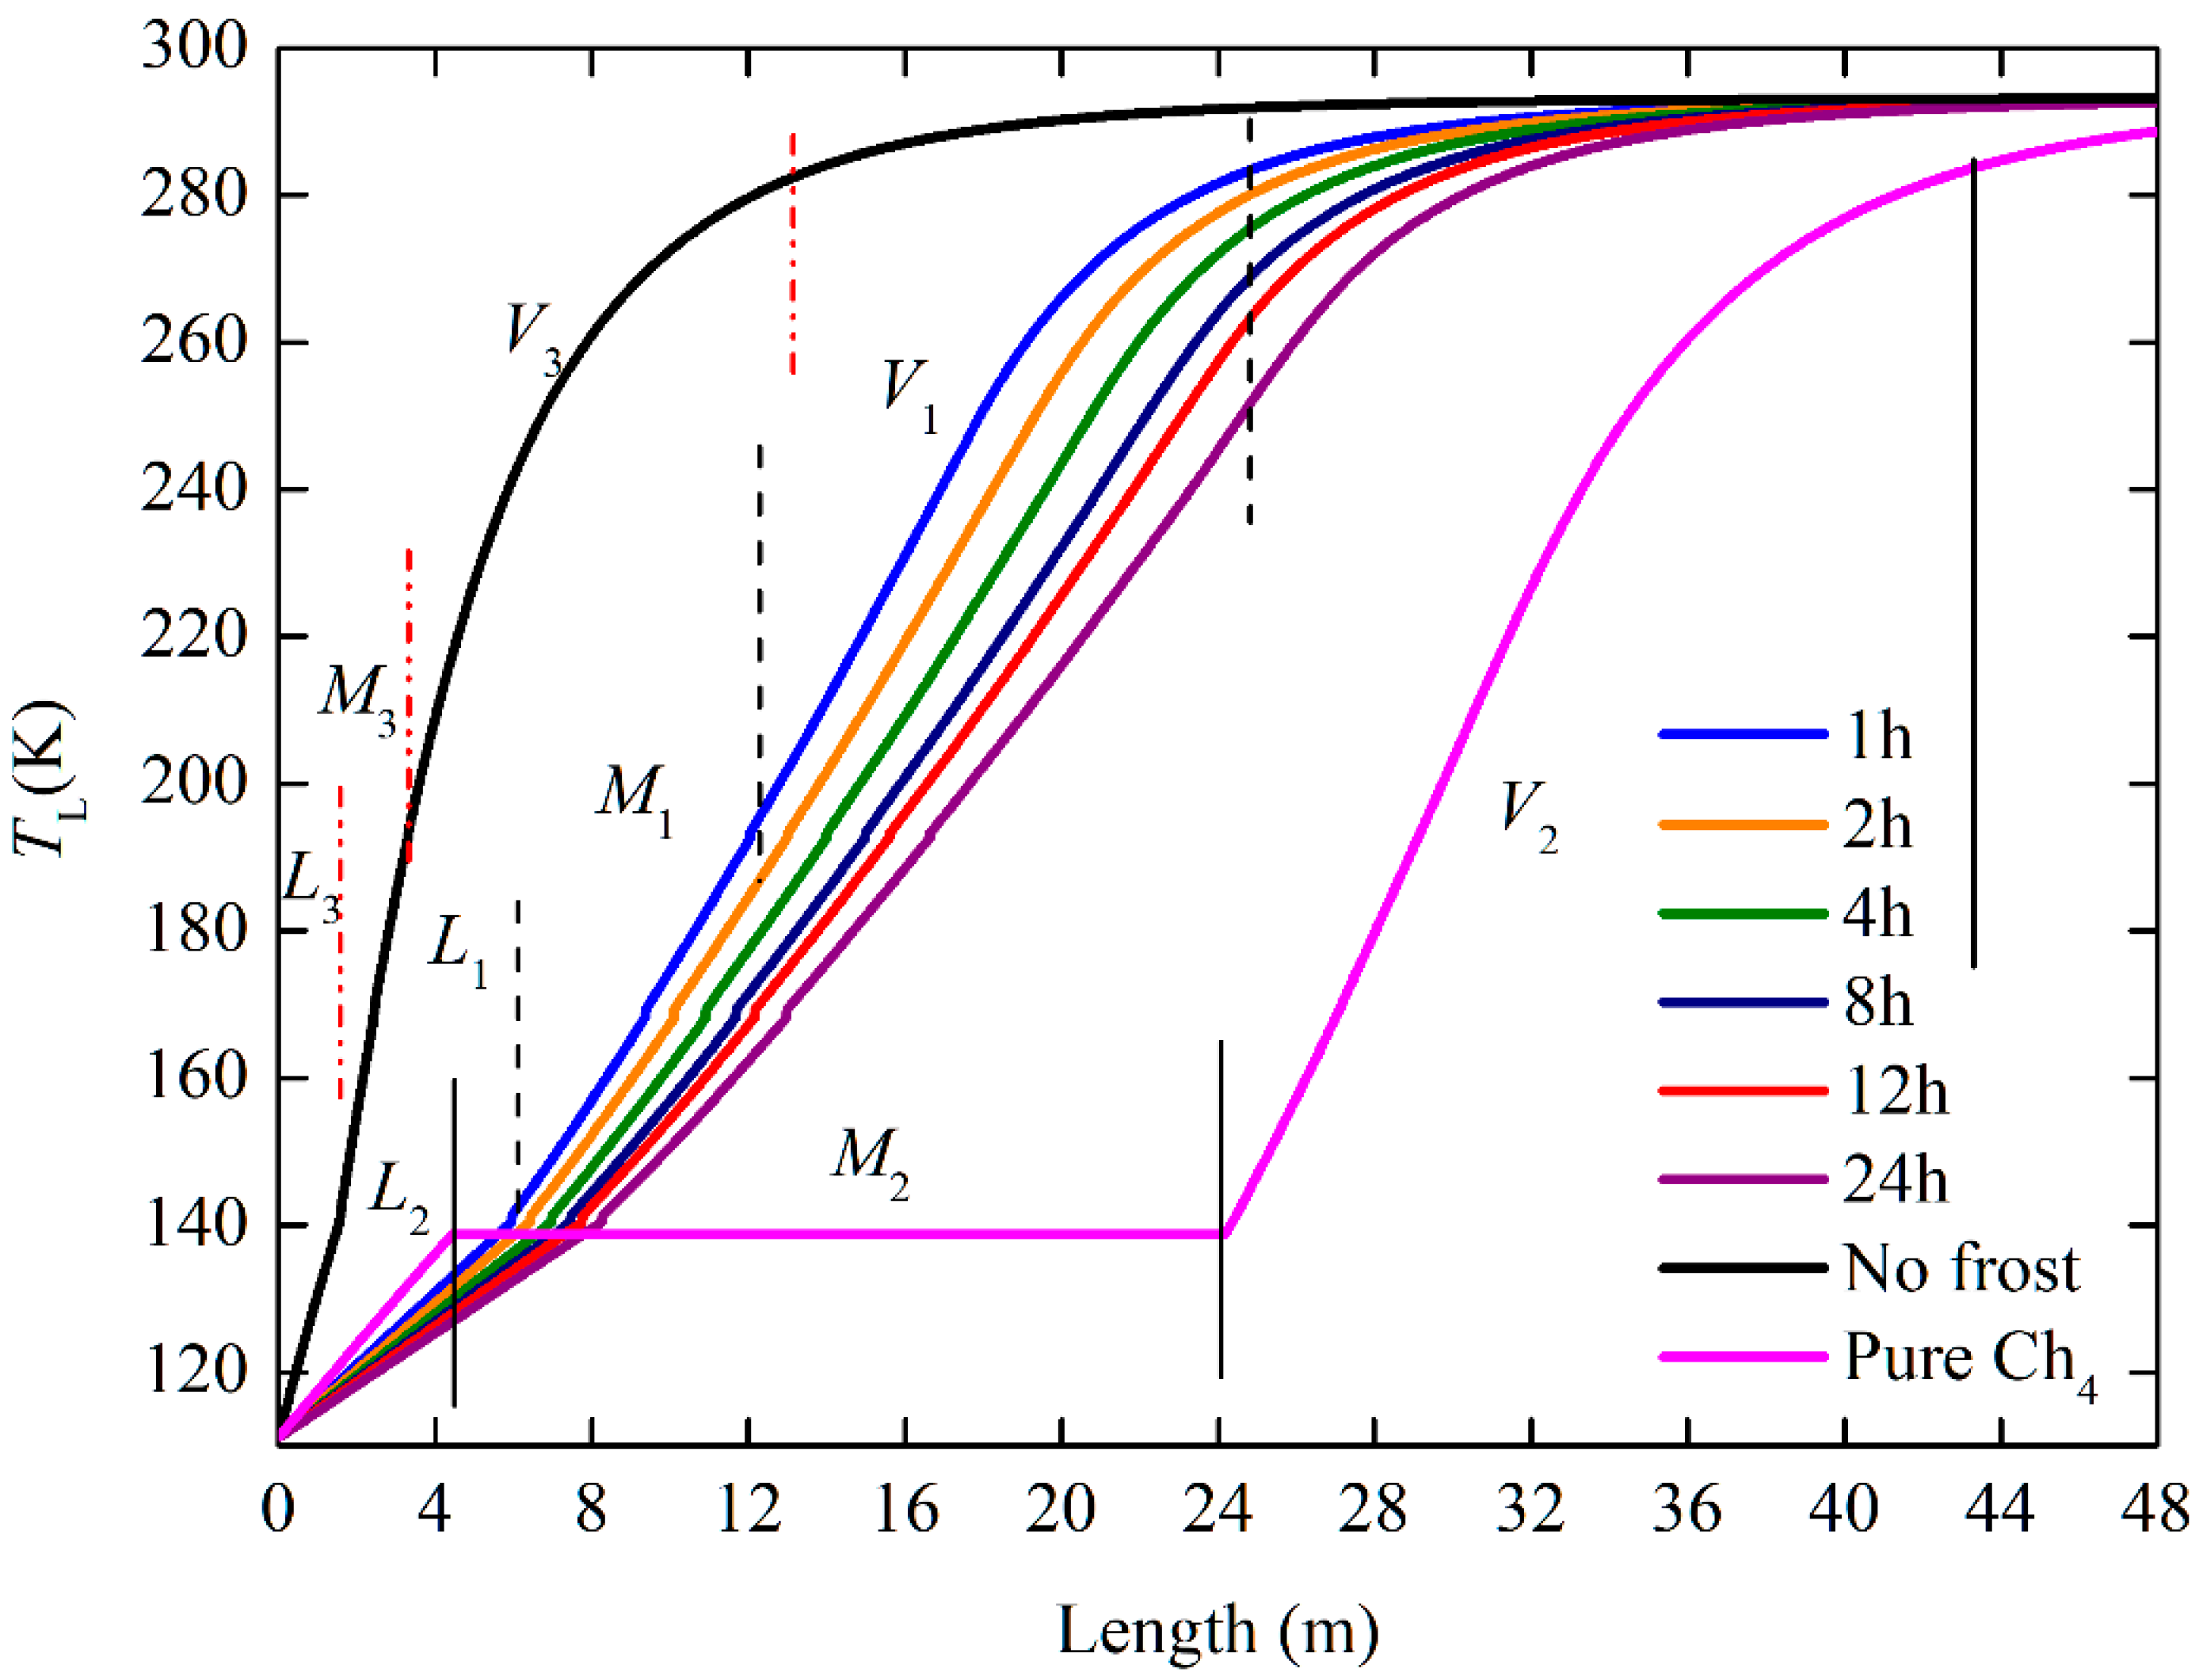
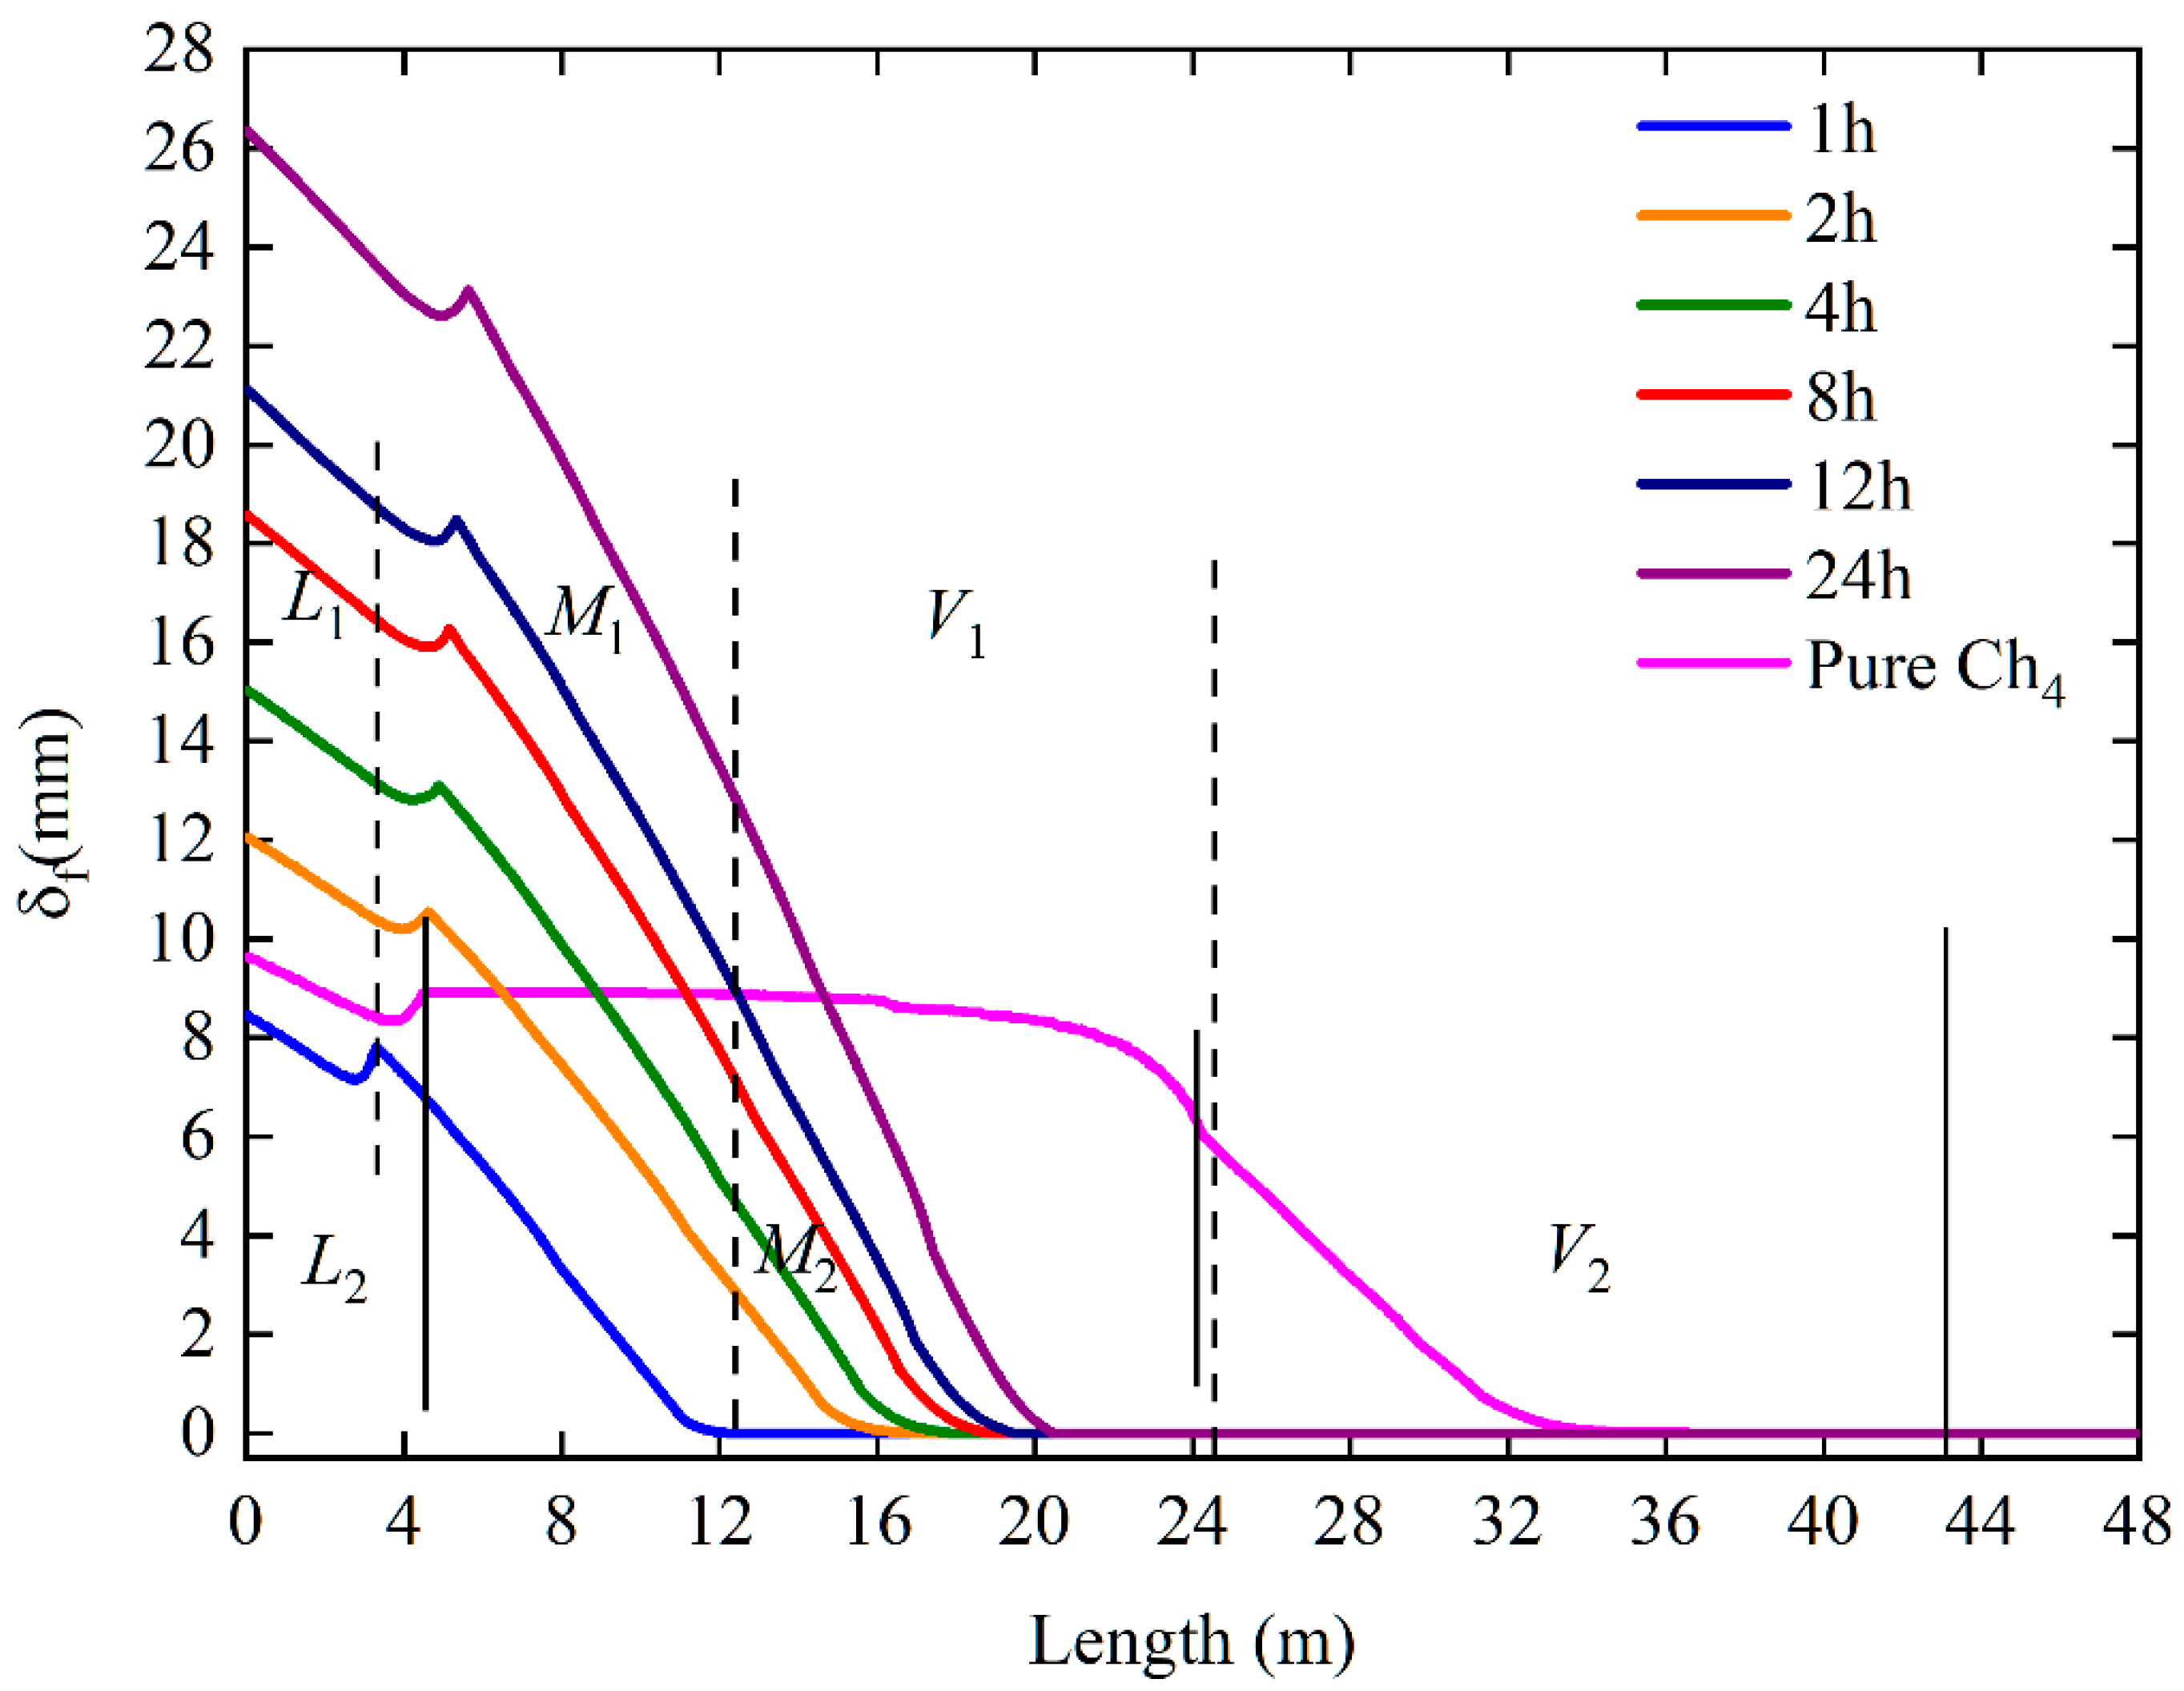
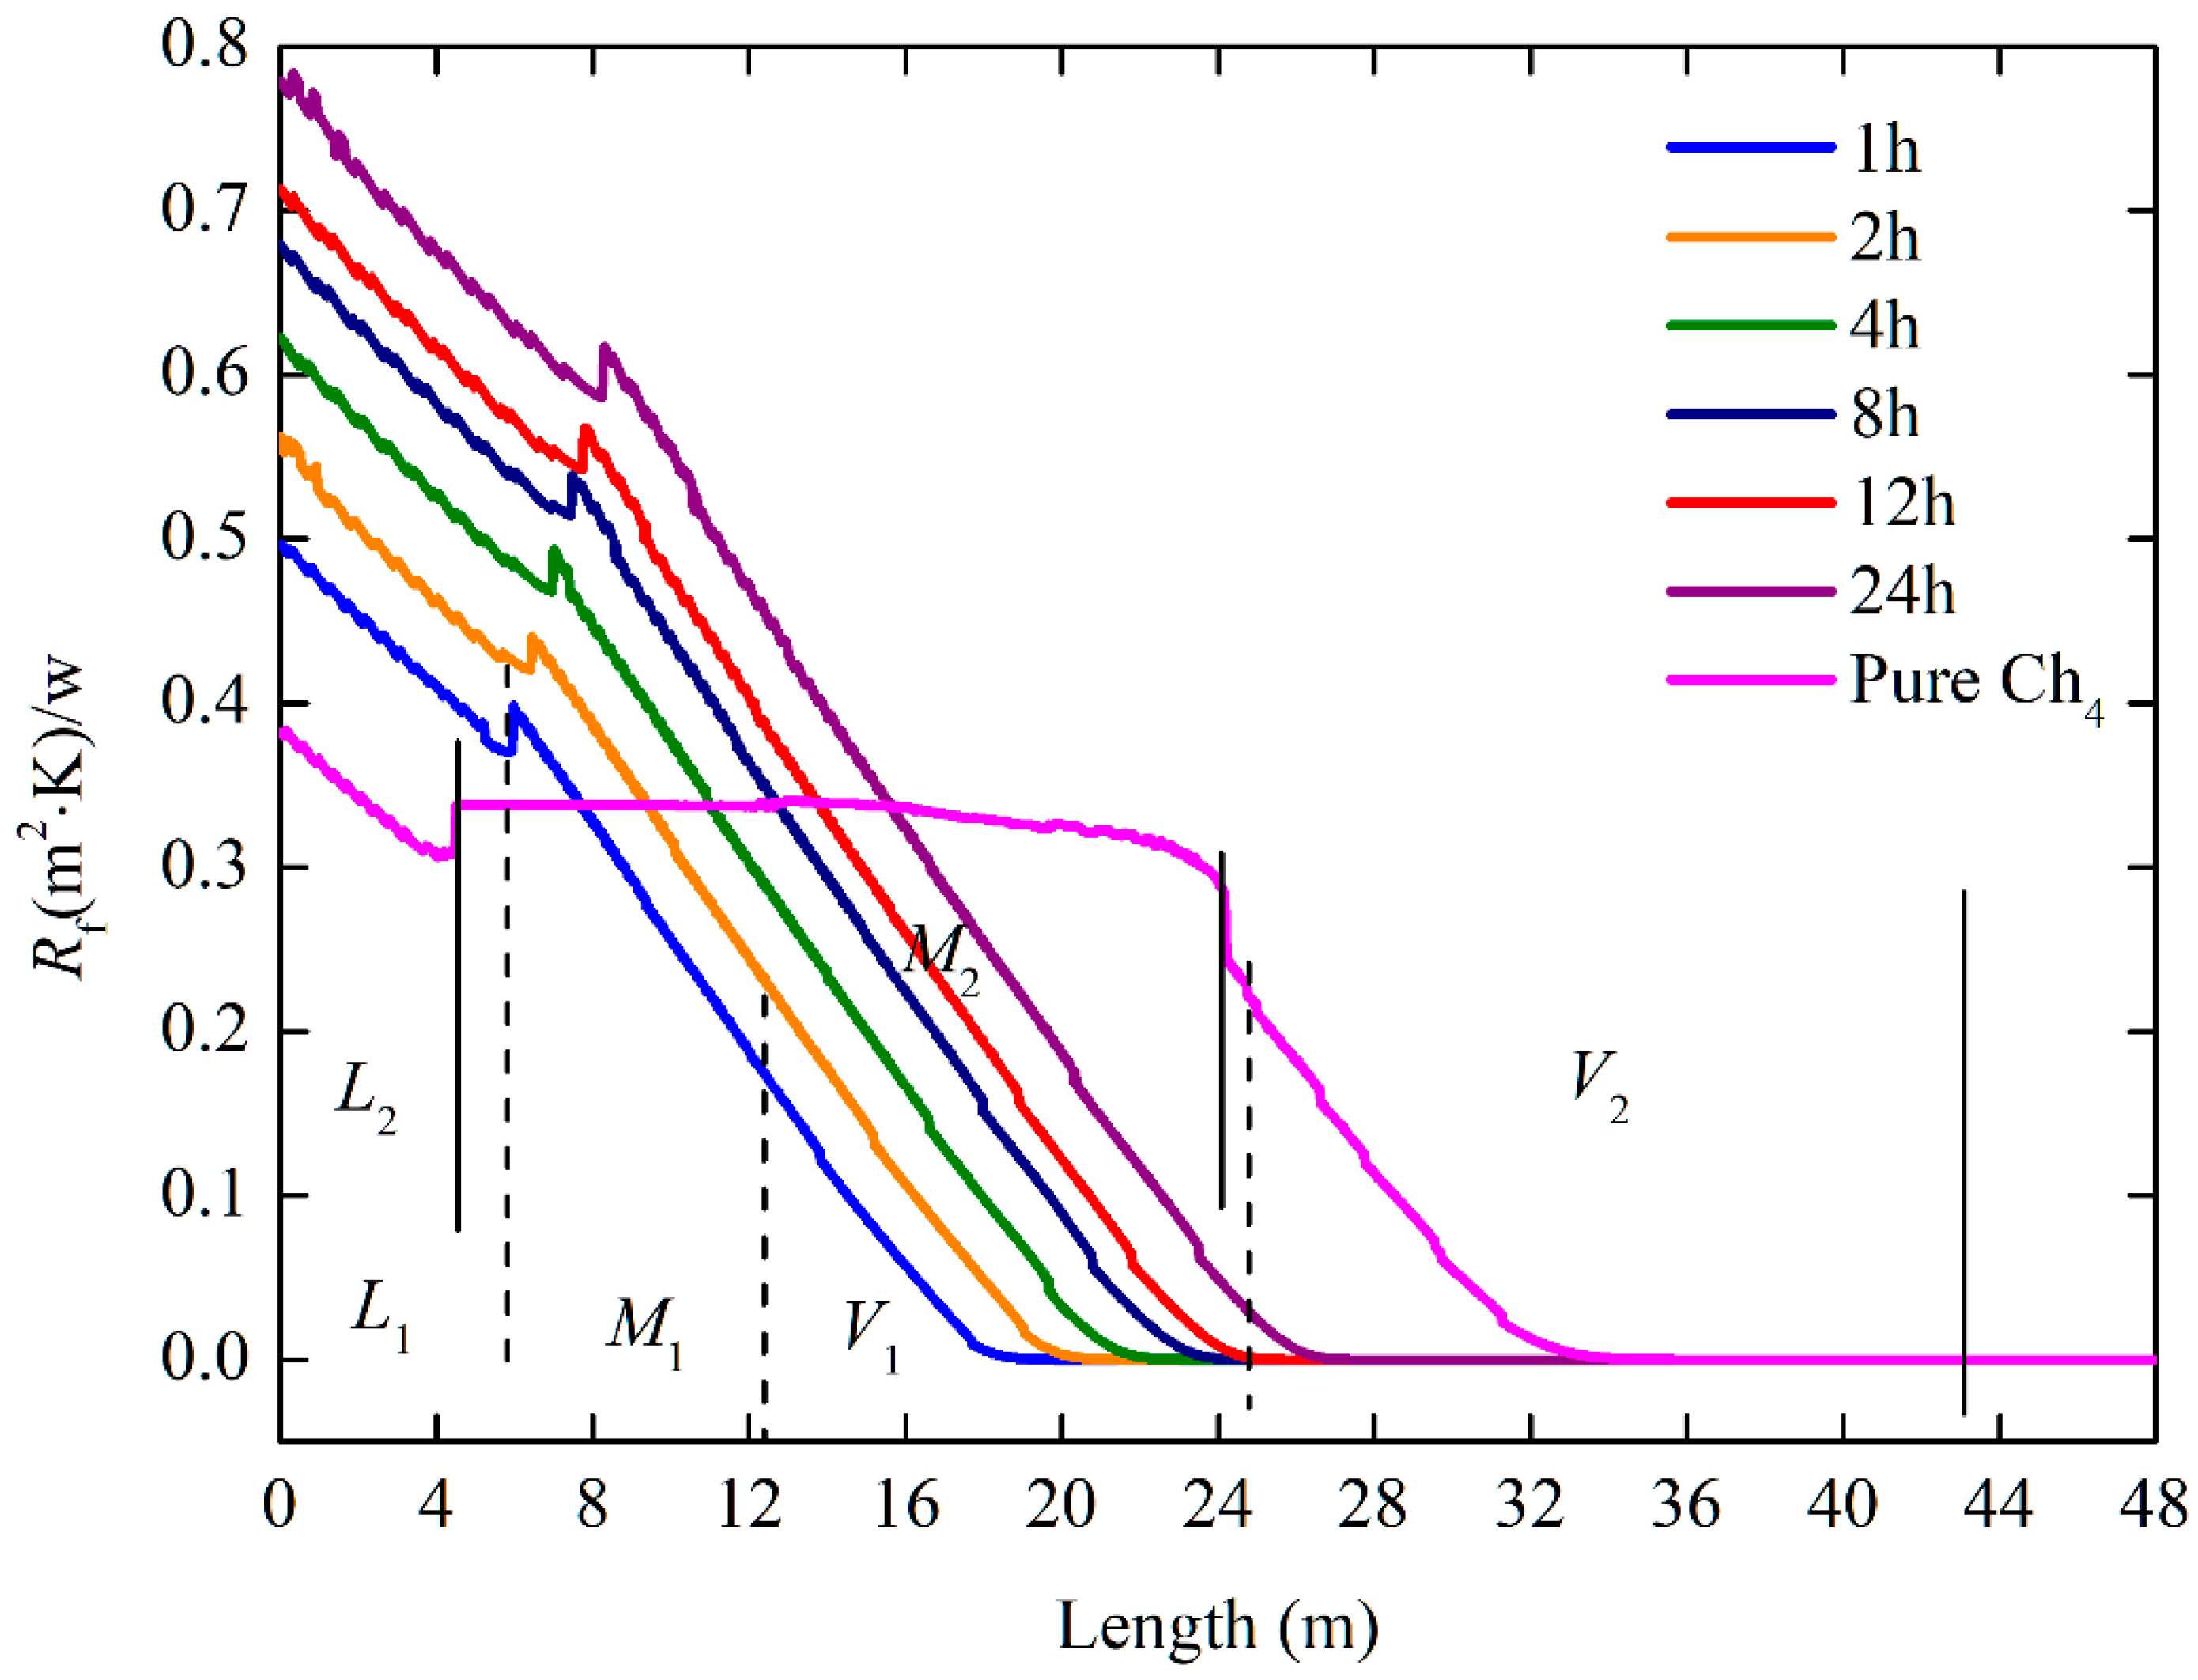
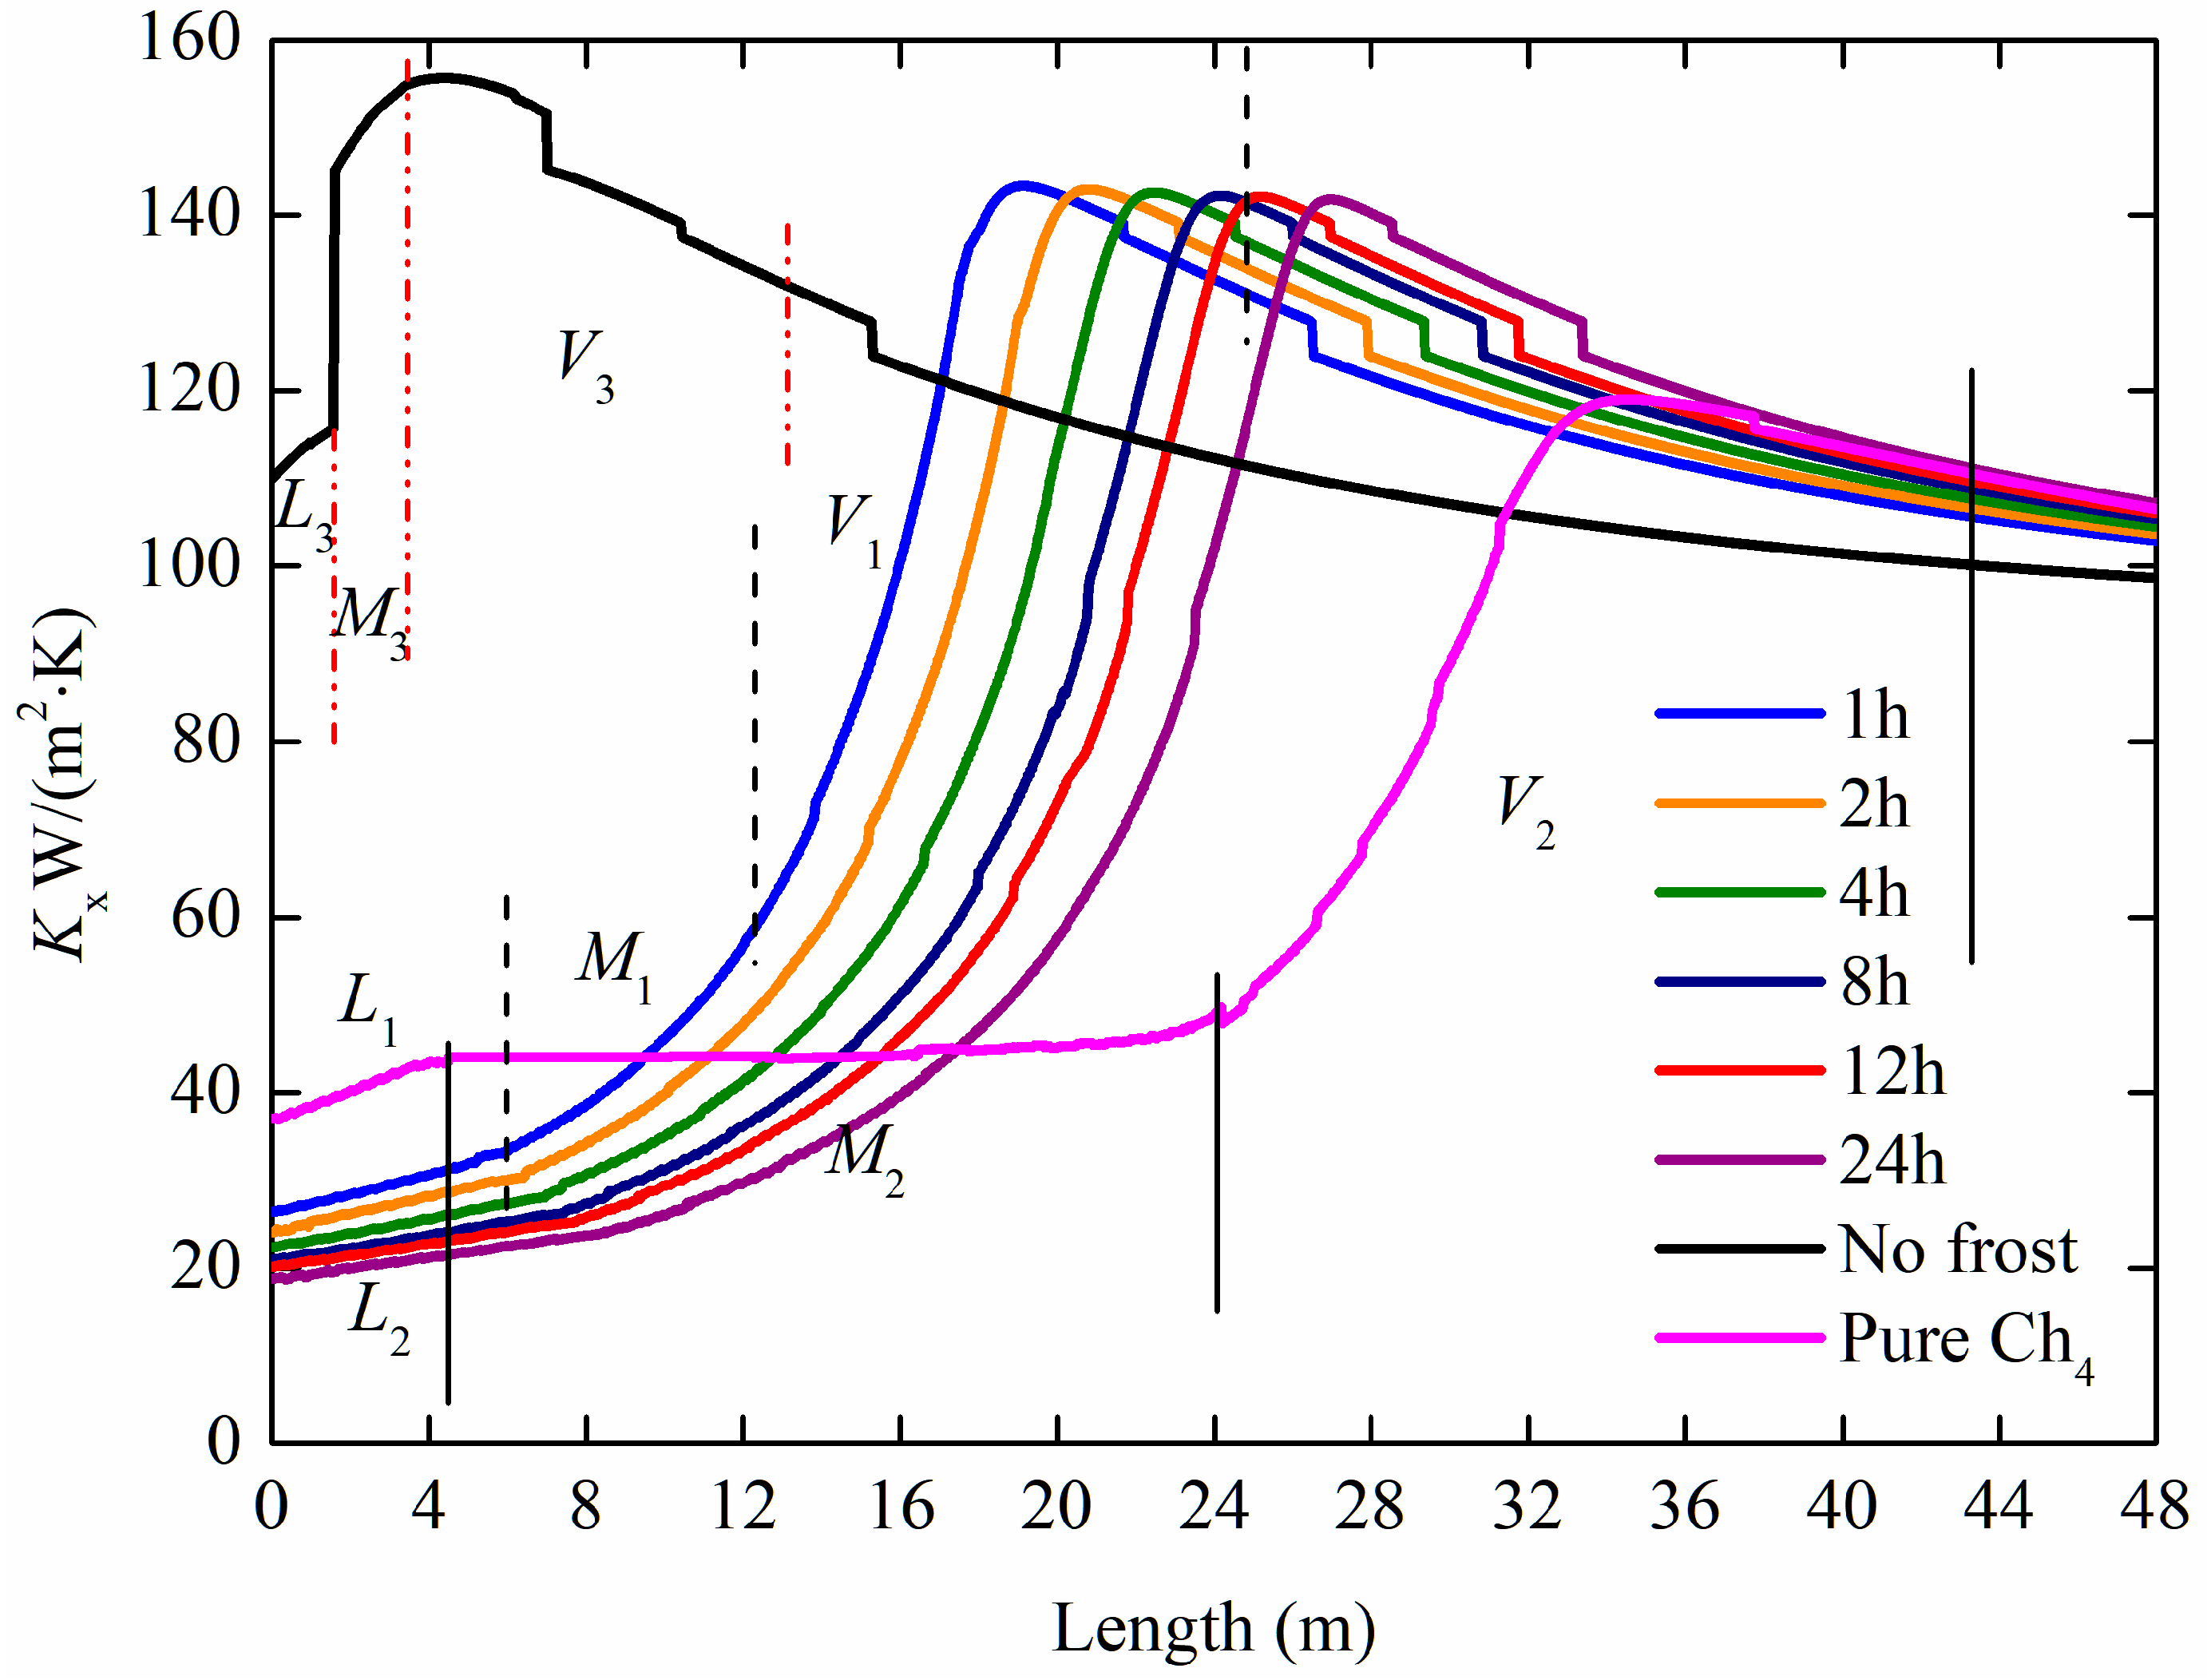
- The whole length of the three phases caused by multi-component LNG was 42.4% of the pure due to the difference in fluid composition in AAV when it was in operation, which has an obvious difference in the mixed phase. The distinction can be reflected in the fluid and surface temperature, the thickness of the frost layer, etc. It can also be proved from the change curve of the convective heat transfer coefficient of the internal fluid.
- (2)
- From the study of methane content in multicomponent fluids, it can be admitted that the difference in heat transfer mechanism is mainly because the thermodynamic dryness degree x is different when it is in a phase change. It was found that the slope of the pure component in the pure liquid phase and the mixed phase was half that of the multi-component in the same zone.
- (3)
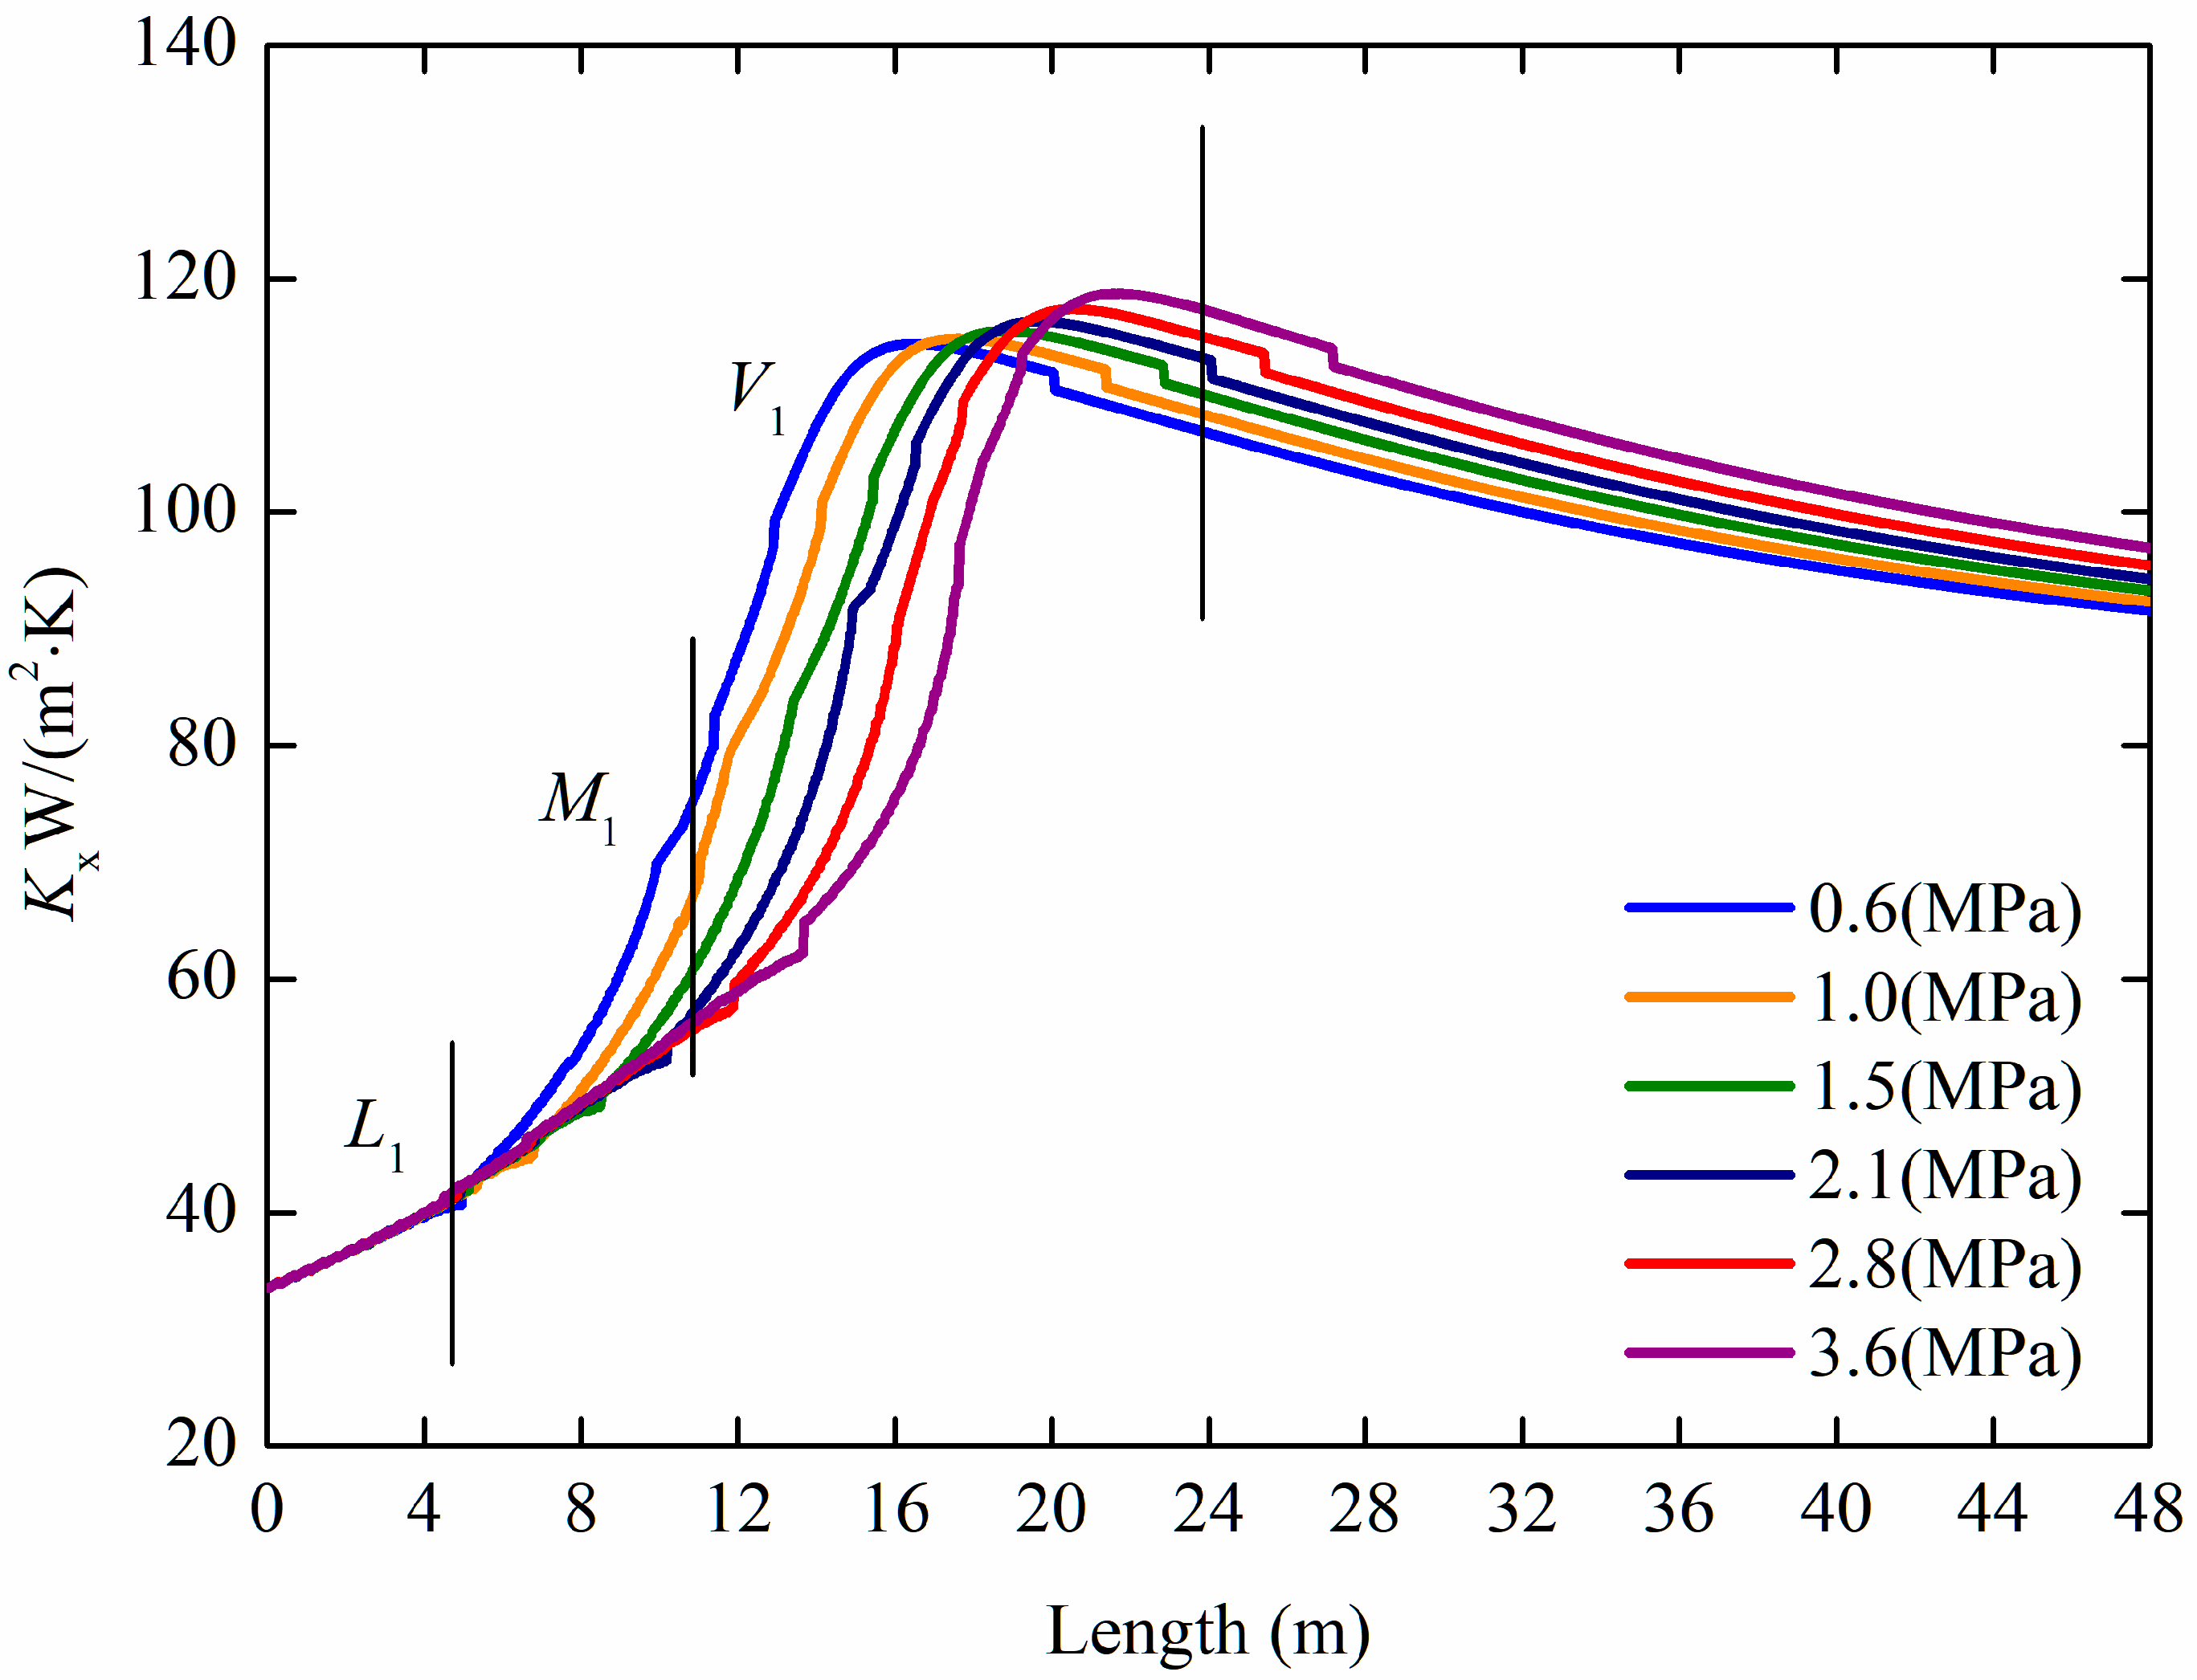
- It was further found that the influence of operating pressure on the , and is greater than that of the design flow rate. When the acceleration of the design pressure increase was 0.1 MPa and the average deviation rate of the was 4.87%, the average rate of drop of the AAV was only 0.125 K, the average peak heat transfer coefficient increased by 0.71 , and the average relative position lagged 1.2 m. However, for every 0.01 increase in the design the flow rate, the average deviation of the was 14.5%, the average drop in was 2.99 K, the peak heat transfer coefficient increased by 4.17 on average, and the average relative position lagged 4.2 m.
This paper analyzed the process of heat transfer deterioration of finned tubes due to the cryogenic LNG phase-change, heat-absorption characteristics of LNG during AAV operation. However, the shape of the fin and the temperature difference from the root to the top itself probably affected the accuracy of the calculation result. In response to this defect, the height of the finned tube should have been changed, and the finned temperature should have been calculated in detail in order to conduct a better study on the operation process of the AAV and provide a better theoretical basis for further research.
Author Contributions
Conceptualization: J.W.; Formal analysis, J.W. and K.W.; Investigation, J.W.; Methodology, J.W.; Validation, J.W.; Project administration, C.L.; Software, J.W.; Supervision, C.L. and W.J.; Writing—original draft preparation, J.W.; Writing—review and editing, J.W. and K.W. All authors have read and agreed to the published version of the manuscript.
Funding
This research received no external funding.
Institutional Review Board Statement
Not applicable.
Informed Consent Statement
Not applicable.
Data Availability Statement
Not applicable.
Conflicts of Interest
The authors declare no conflict of interest.
Nomenclature
| Characteristic length, | |
| Specific heat of air at constant pressure, | |
| Radiation emission rate | |
| Heat transfer coefficient, | |
| Interfacial mass transfer coefficient, () | |
| Length, | |
| Lewis number | |
| Latent heat of sublimation of water vapor, | |
| Mass of vapor through the frost surface per unit area, | |
| Mass flow rate per unit area, | |
| Mass flux of the water vapor through the frost surface, | |
| Nusselt number | |
| Prandtl number | |
| Saturation pressure of water vapor at far-field, | |
| Saturation pressure of water vapor at frost surface, | |
| q | Heat flux, |
| Rayleigh number | |
| Universal gas constant of the water vapor, | |
| s | Supersaturation degree |
| T | Temperature, |
| x | Thermodynamic dryness degree |
| Greek symbol | |
| Density, | |
| The thickness of the frost, | |
| Relative humidity of the air | |
| Thermal conductivity, | |
| Strengthening factor | |
| The frost porosity | |
| The minimum thermal conductivity of the frost layer, | |
| The maximum thermal conductivity of the frost layer, | |
| Boltzmann factor, | |
| Surface tension | |
| Time, | |
| Subscripts | |
| a | Air |
| c | Convective heat transfer |
| f | Frost |
| ice | Ice |
| L | Liquid phase |
| N | Vapor phase |
| r | Radiation heat transfer |
| re | Requirement temperature of working fluids |
| v,a | Water vapor of the far-field |
| v,f | Water vapor of the frost surface |
| w | Tube wall |
| out | Output temperature |
References
- Cheng, H.; Ju, Y.; Fu, Y. Experimental and simulation investigation on heat transfer characteristics of supercritical nitrogen in a new rib tube of open rack vaporizer. Int. J. Refrig. 2019, 111, 103–112. [Google Scholar] [CrossRef]
- Liu, S.; Jiao, W.; Ren, L.; Tian, X. Thermal resistance analysis of cryogenic frosting and its effect on performance of LNG ambient air vaporizer. Renew. Energy 2019, 149, 917–927. [Google Scholar] [CrossRef]
- Lisowski, F.; Lisowski, E. Influence of longitudinal fin tubes arrangement in lng ambient air vaporizers on the wind load. Energies 2022, 15, 405. [Google Scholar] [CrossRef]
- Ruan, B.; Lin, W. Experimental study on heat transfer in a model of submerged combustion vaporizer. Appl. Therm. Eng. 2021, 201, 117744. [Google Scholar] [CrossRef]
- Wang, B.; Wang, W.; Qi, C.; Kuang, Y.; Xu, J. Simulation of performance of intermediate fluid vaporizer under wide operation conditions. Front. Energy 2020, 14, 452–462. [Google Scholar] [CrossRef]
- Li, S.; Ju, Y. Review of the LNG intermediate fluid vaporizer and its heat transfer characteristics. Front. Energy 2021, 1–16. [Google Scholar] [CrossRef]
- Hayashi, Y.; Aoki, A.; Adachi, S.; Hori, K. Study of frost properties correlating with frost formation types. J. Heat Transf. 1977, 99, 239–245. [Google Scholar] [CrossRef]
- Na, B.; Webb, R.L. A fundamental understanding of factors affecting frost nucleation. Int. J. Heat Mass Transf. 2003, 46, 3797–3808. [Google Scholar] [CrossRef]
- Na, B.; Webb, R.L. New model for frost growth rate. Int. J. Heat Mass Transf. 2004, 47, 925–936. [Google Scholar] [CrossRef]
- Na, B.; Webb, R.L.; Na, B.; Webb, R.L. Mass transfer on and within a frost layer. Int. J. Heat Mass Transf. 2004, 47, 899–911. [Google Scholar] [CrossRef]
- Iragorry, J.; Tao, Y.-X.; Jia, S. Review article: A critical review of properties and models for frost formation analysis. HVAC&R Res. 2004, 10, 393–420. [Google Scholar] [CrossRef]
- Song, M.; Dang, C. Review on the measurement and calculation of frost characteristics. Int. J. Heat Mass Transf. 2018, 124, 586–614. [Google Scholar] [CrossRef]
- Cui, J.; Li, W.; Liu, Y.; Jiang, Z. A new time- and space-dependent model for predicting frost formation. Appl. Therm. Eng. 2011, 31, 447–457. [Google Scholar] [CrossRef]
- Kandula, M. Frost growth and densification in laminar flow over flat surfaces. Int. J. Heat Mass Transf. 2011, 54, 3719–3731. [Google Scholar] [CrossRef]
- Kandula, M. Frost growth and densification on a flat surface in laminar flow with variable humidity. Int. Commun. Heat Mass Transf. 2012, 39, 1030–1034. [Google Scholar] [CrossRef] [Green Version]
- Wu, X.; Chu, F.; Ma, Q. Frosting model based on phase change driving force. Int. J. Heat Mass Transf. 2017, 110, 760–767. [Google Scholar] [CrossRef]
- Schneider, H. Equation of the growth rate of frost forming on cooled surfaces. Int. J. Heat Mass Transf. 1978, 21, 1019–1024. [Google Scholar] [CrossRef]
- Lee, K.-S.; Kim, W.-S.; Lee, T.-H. A one-dimensional model for frost formation on a cold flat surface. Int. J. Heat Mass Transf. 1997, 40, 4359–4365. [Google Scholar] [CrossRef]
- Lee, Y.; Ro, S. Analysis of the frost growth on a flat plate by simple models of saturation and supersaturation. Exp. Therm. Fluid Sci. 2005, 29, 685–696. [Google Scholar] [CrossRef]
- Hermes, C.J.; Piucco, R.O.; Barbosa, J.R.; Melo, C. A study of frost growth and densification on flat surfaces. Exp. Therm. Fluid Sci. 2009, 33, 371–379. [Google Scholar] [CrossRef]
- Hermes, C.J. An analytical solution to the problem of frost growth and densification on flat surfaces. Int. J. Heat Mass Transf. 2012, 55, 7346–7351. [Google Scholar] [CrossRef]
- Jones, B.W.; Parker, J.D. Frost formation with varying environmental parameters. J. Heat Transf. 1975, 97, 255–259. [Google Scholar] [CrossRef]
- Kim, S.; Lee, S.Y. Quick estimation of frost growth on cold fins through thermal network analysis. Int. J. Refrig. 2014, 47, 153–163. [Google Scholar] [CrossRef]
- Liu, Z.; Zhu, H.; Wang, H. Study on transient distributed model of frost on heat pump evaporator. J. Asian Arch. Build. Eng. 2005, 4, 265–270. [Google Scholar] [CrossRef] [Green Version]
- Lee, J.; Kim, J.; Kim, D.R.; Lee, K.-S. Modeling of frost layer growth considering frost porosity. Int. J. Heat Mass Transf. 2018, 126, 980–988. [Google Scholar] [CrossRef]
- El Cheikh, A.; Jacobi, A. A mathematical model for frost growth and densification on flat surfaces. Int. J. Heat Mass Transf. 2014, 77, 604–611. [Google Scholar] [CrossRef]
- Leoni, A.; Mondot, M.; Durier, F.; Revellin, R.; Haberschill, P. Frost formation and development on flat plate: Experimental investigation and comparison to predictive methods. Exp. Therm. Fluid Sci. 2017, 88, 220–233. [Google Scholar] [CrossRef]
- Kuang, Y.; Yi, C.; Wang, W. Numerical simulation of frosting behavior and its effect on a direct-contact ambient air vaporizer. J. Nat. Gas Sci. Eng. 2015, 27, 55–63. [Google Scholar] [CrossRef]
- Li, X.; Wei, W.; Wang, R.; Shi, Y. Numerical and experimental investigation of heat transfer on heating surface during subcooled boiling flow of liquid nitrogen. Int. J. Heat Mass Transf. 2009, 52, 1510–1516. [Google Scholar] [CrossRef]
- Guyun, Z. Heat and Mass Transfer in Engineering; Aviation Industry Press: Beijing, China, 1989; p. 603. [Google Scholar]
- Castillo, J.E.; Huang, Y.; Pan, Z.; Weibel, J.A. Quantifying the pathways of latent heat dissipation during droplet freezing on cooled substrates. Int. J. Heat Mass Transf. 2020, 164, 120608. [Google Scholar] [CrossRef]
- Bergman, T.L.; Bergman, T.L.; Incropera, F.P.; Dewitt, D.P.; Lavine, A.S. Fundamentals of Heat and Mass Transfer; John Wiley & Sons: Hoboken, NJ, USA, 2011. [Google Scholar]
- Chilton, T.H.; Colburn, A.P. Mass transfer (absorption) coefficients prediction from data on heat transfer and fluid friction. Ind. Eng. Chem. 1934, 26, 1183–1187. [Google Scholar] [CrossRef]
- Auracher, H. Heat transfer in frost and snow. In Der Waermetransport bei Frost und Schnee; Toronto, ON, Canada, 1978; pp. 25–30. Available online: https://www.ihtcdigitallibrary.com/conferences/2d9b67ad1b92ab15,7082010052da3d73,1b7afe206152d81d.html (accessed on 29 March 2022).
- Zhang, X. Heat Transfer; China Construction Industry Press: Beijing, China, 2001; p. 322. [Google Scholar]
- Klimenko, V. A generalized correlation for two-phase forced flow heat transfer. Int. J. Heat Mass Transf. 1988, 31, 541–552. [Google Scholar] [CrossRef]
- Klimenko, V. A generalized correlation for two-phase forced flow heat transfer—Second assessment. Int. J. Heat Mass Transf. 1990, 33, 2073–2088. [Google Scholar] [CrossRef]
- Wang, M.; Chen, S.; Yao, S.; Jin, S.; Yang, J.; Liu, D.; Li, J.; Mao, H. Experimental study on heat transfer characteristics of air-heating cryogenics finned-tube vaporizer under frosting conditions. Cryogenics 2017, 3, 55–69. [Google Scholar] [CrossRef]
- Liu, S.; Jiao, W.; Ren, L.; Wang, H.; Zhang, P. Dynamic heat transfer analysis of liquefied natural gas ambient air vaporizer under frost conditions. Appl. Therm. Eng. 2017, 110, 999–1006. [Google Scholar] [CrossRef]
- Dauger, J.-M. The LNG Industry GIIGNL Annual Report for 2018; International Group of Liquefied Natural Gas Importers: Neuilly-sur-Seine, France, 2018. [Google Scholar]
Publisher’s Note: MDPI stays neutral with regard to jurisdictional claims in published maps and institutional affiliations. |
© 2022 by the authors. Licensee MDPI, Basel, Switzerland. This article is an open access article distributed under the terms and conditions of the Creative Commons Attribution (CC BY) license (https://creativecommons.org/licenses/by/4.0/).