
A Lean Manufacturing Progress Model and Implementation for SMEs in the Metal Products Industry


Abstract
:1. Introduction
2. Literature Review
2.1. Lean Manufacturing
2.2. Value Stream Mapping (VSM)
2.3. Continuous Process Improvement
3. Research and Methodology
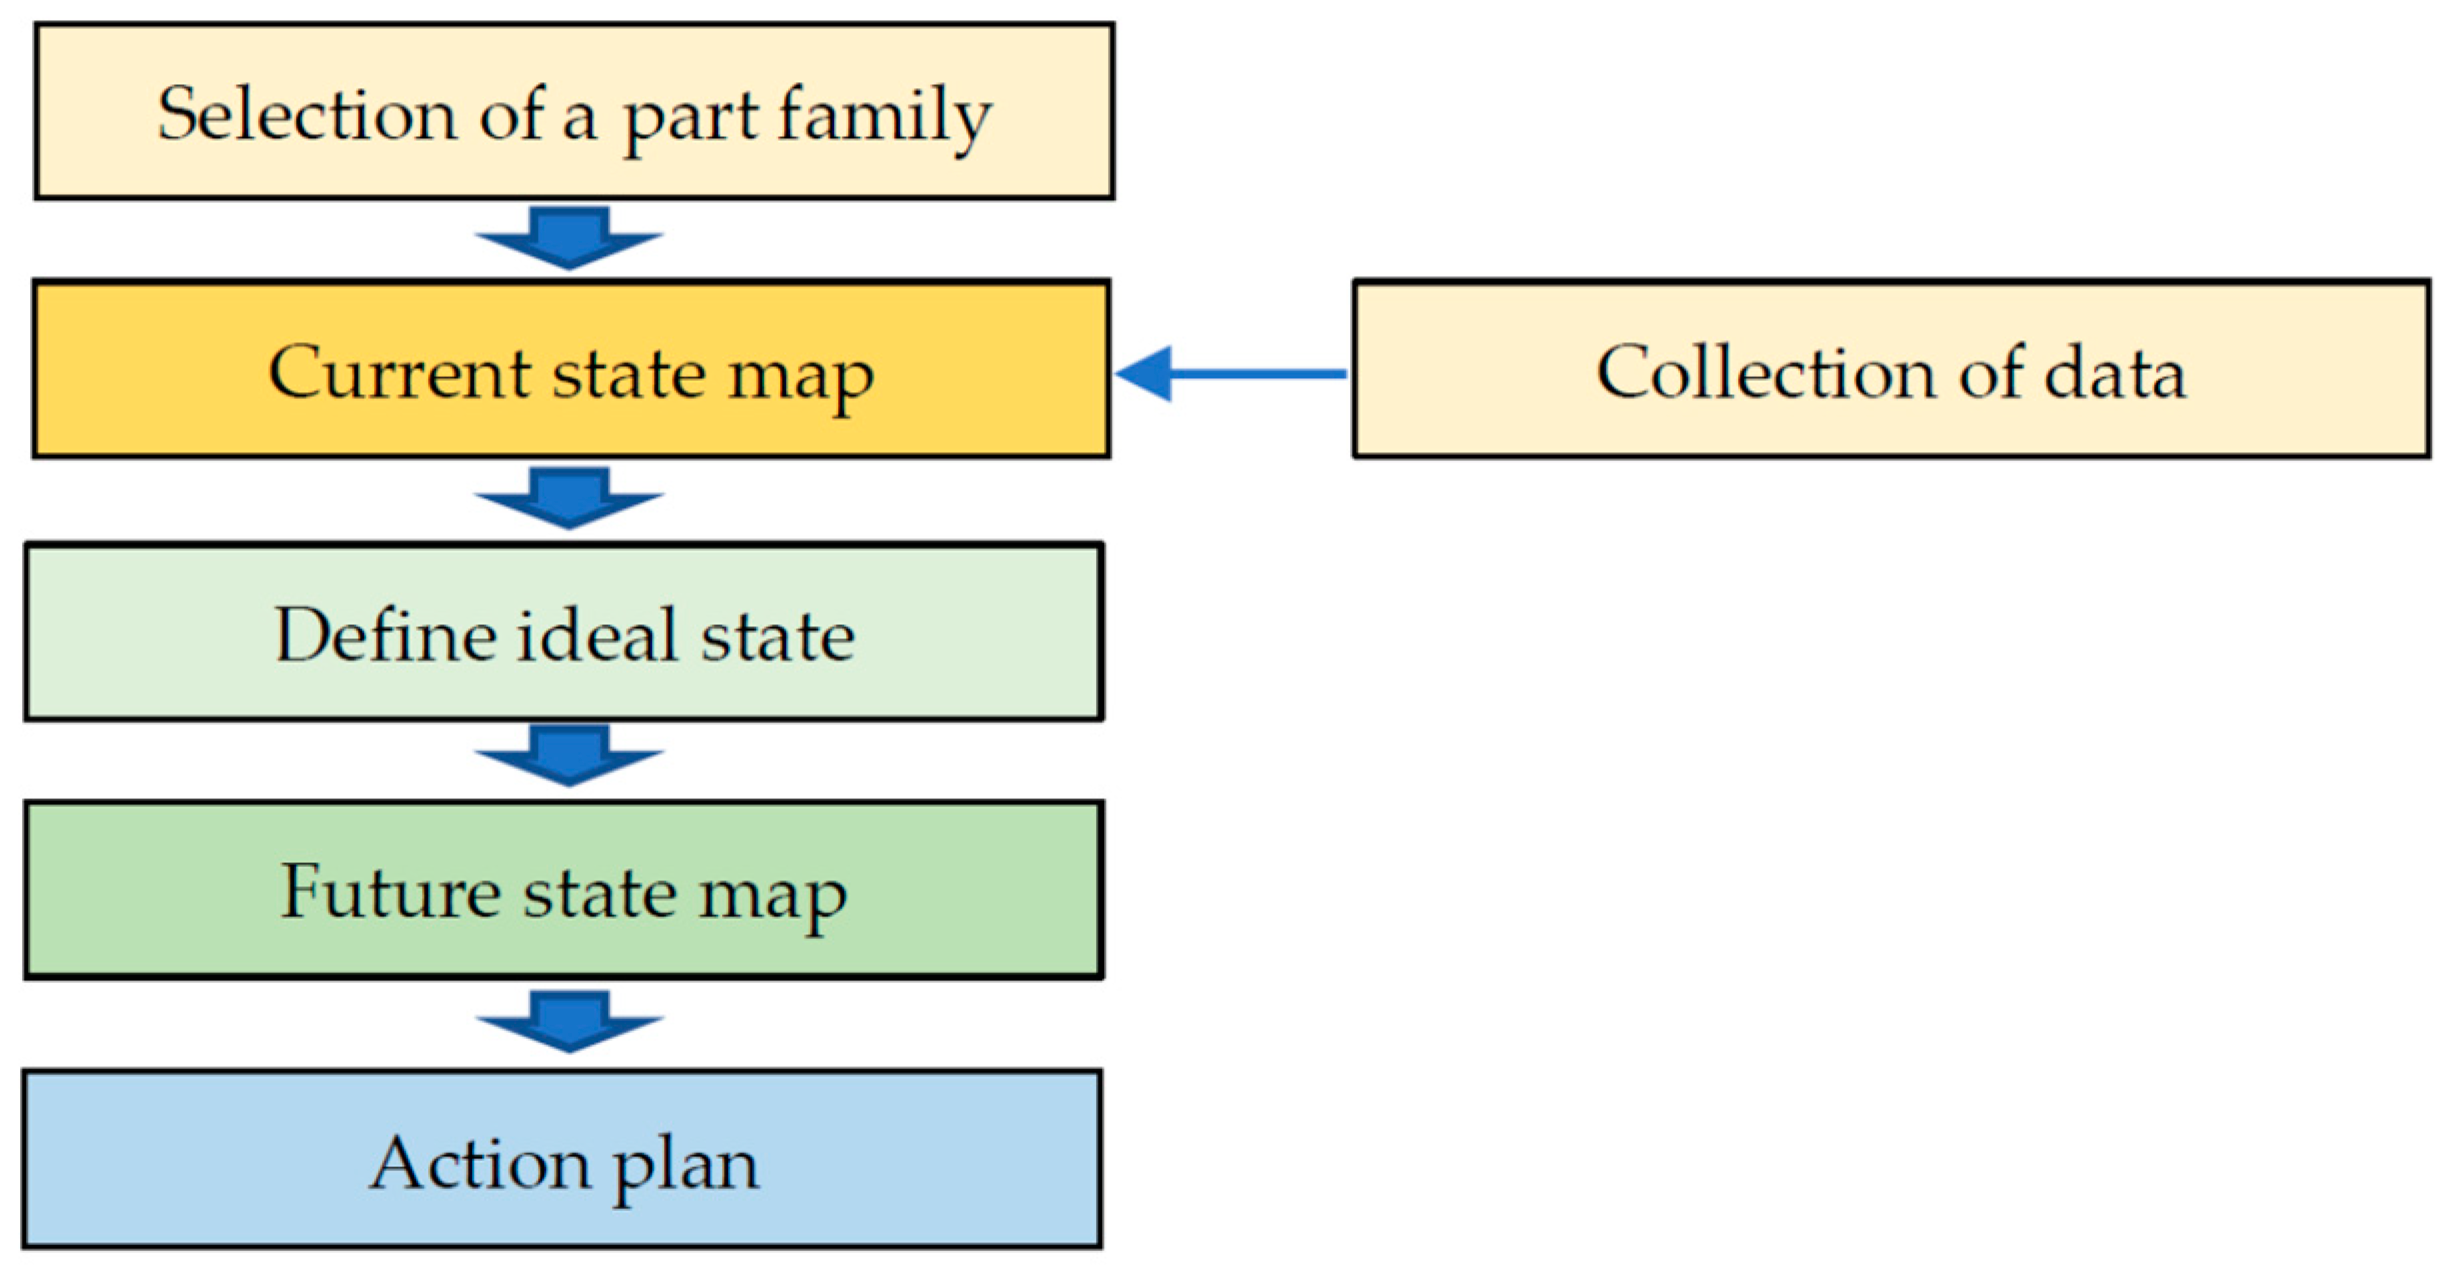
3.1. VSM Application
- 1.
- Collect production-related data:
- 2.
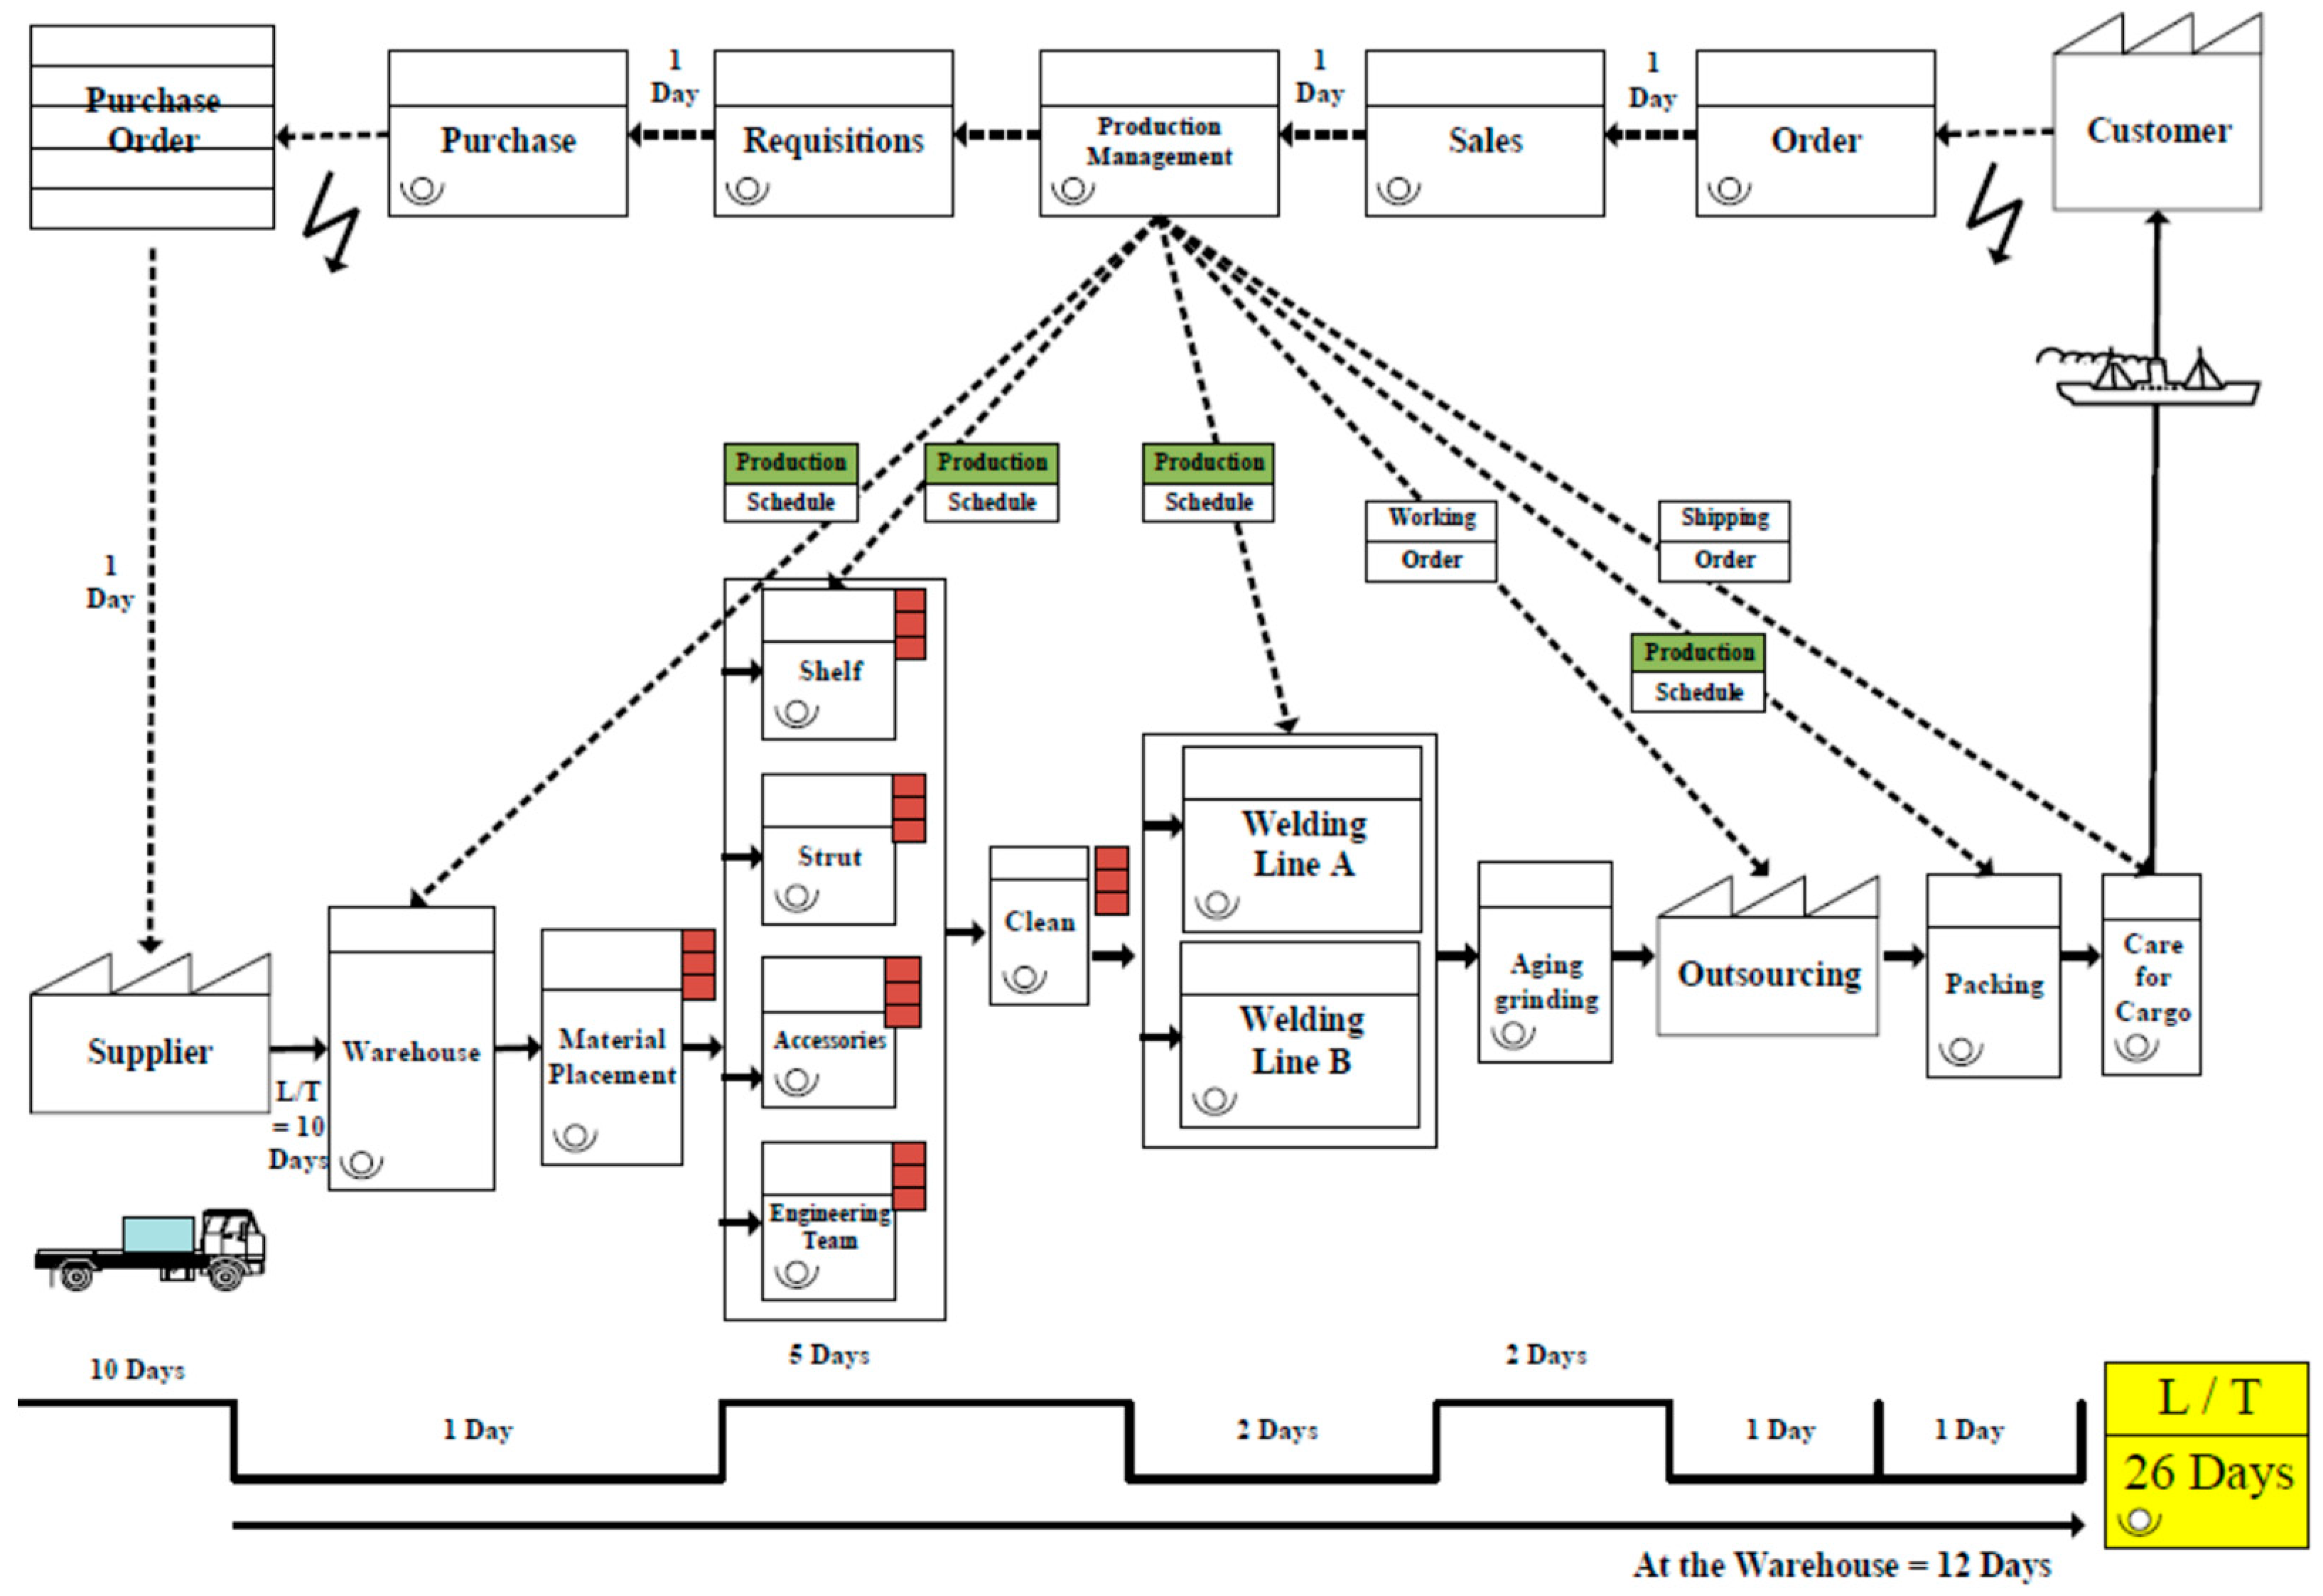
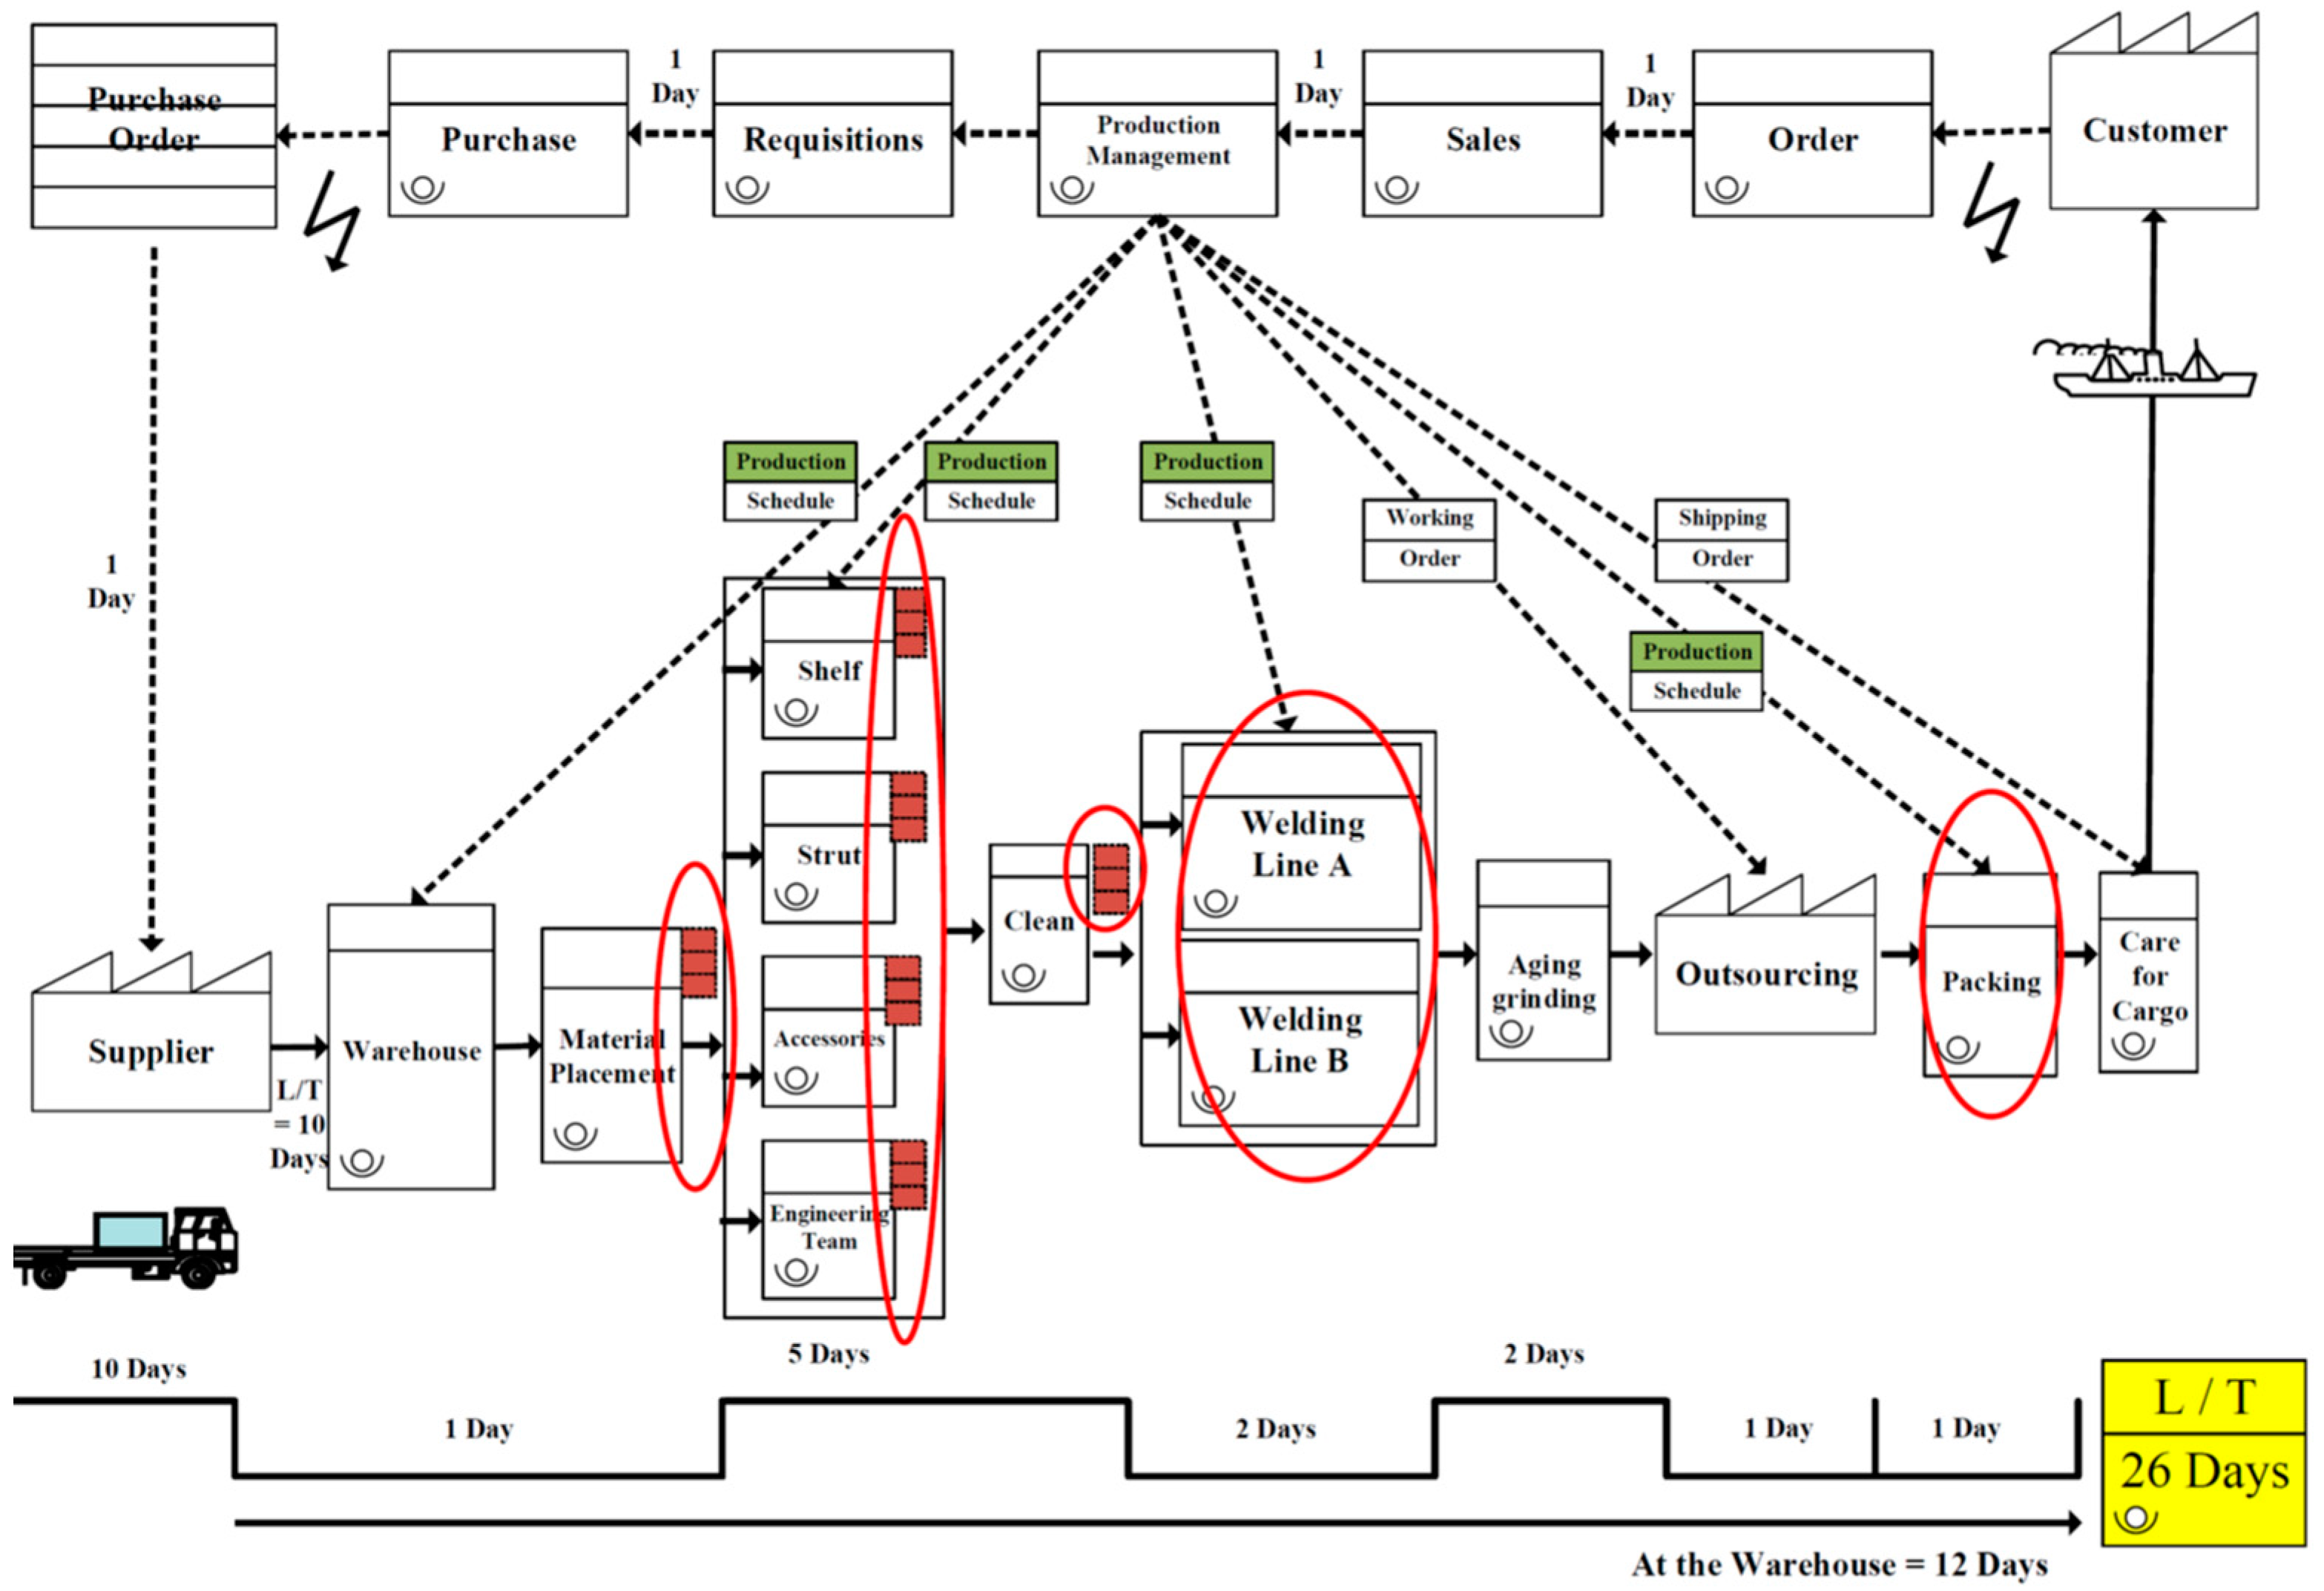
- Draw the current VSM flowchart:
- 3.
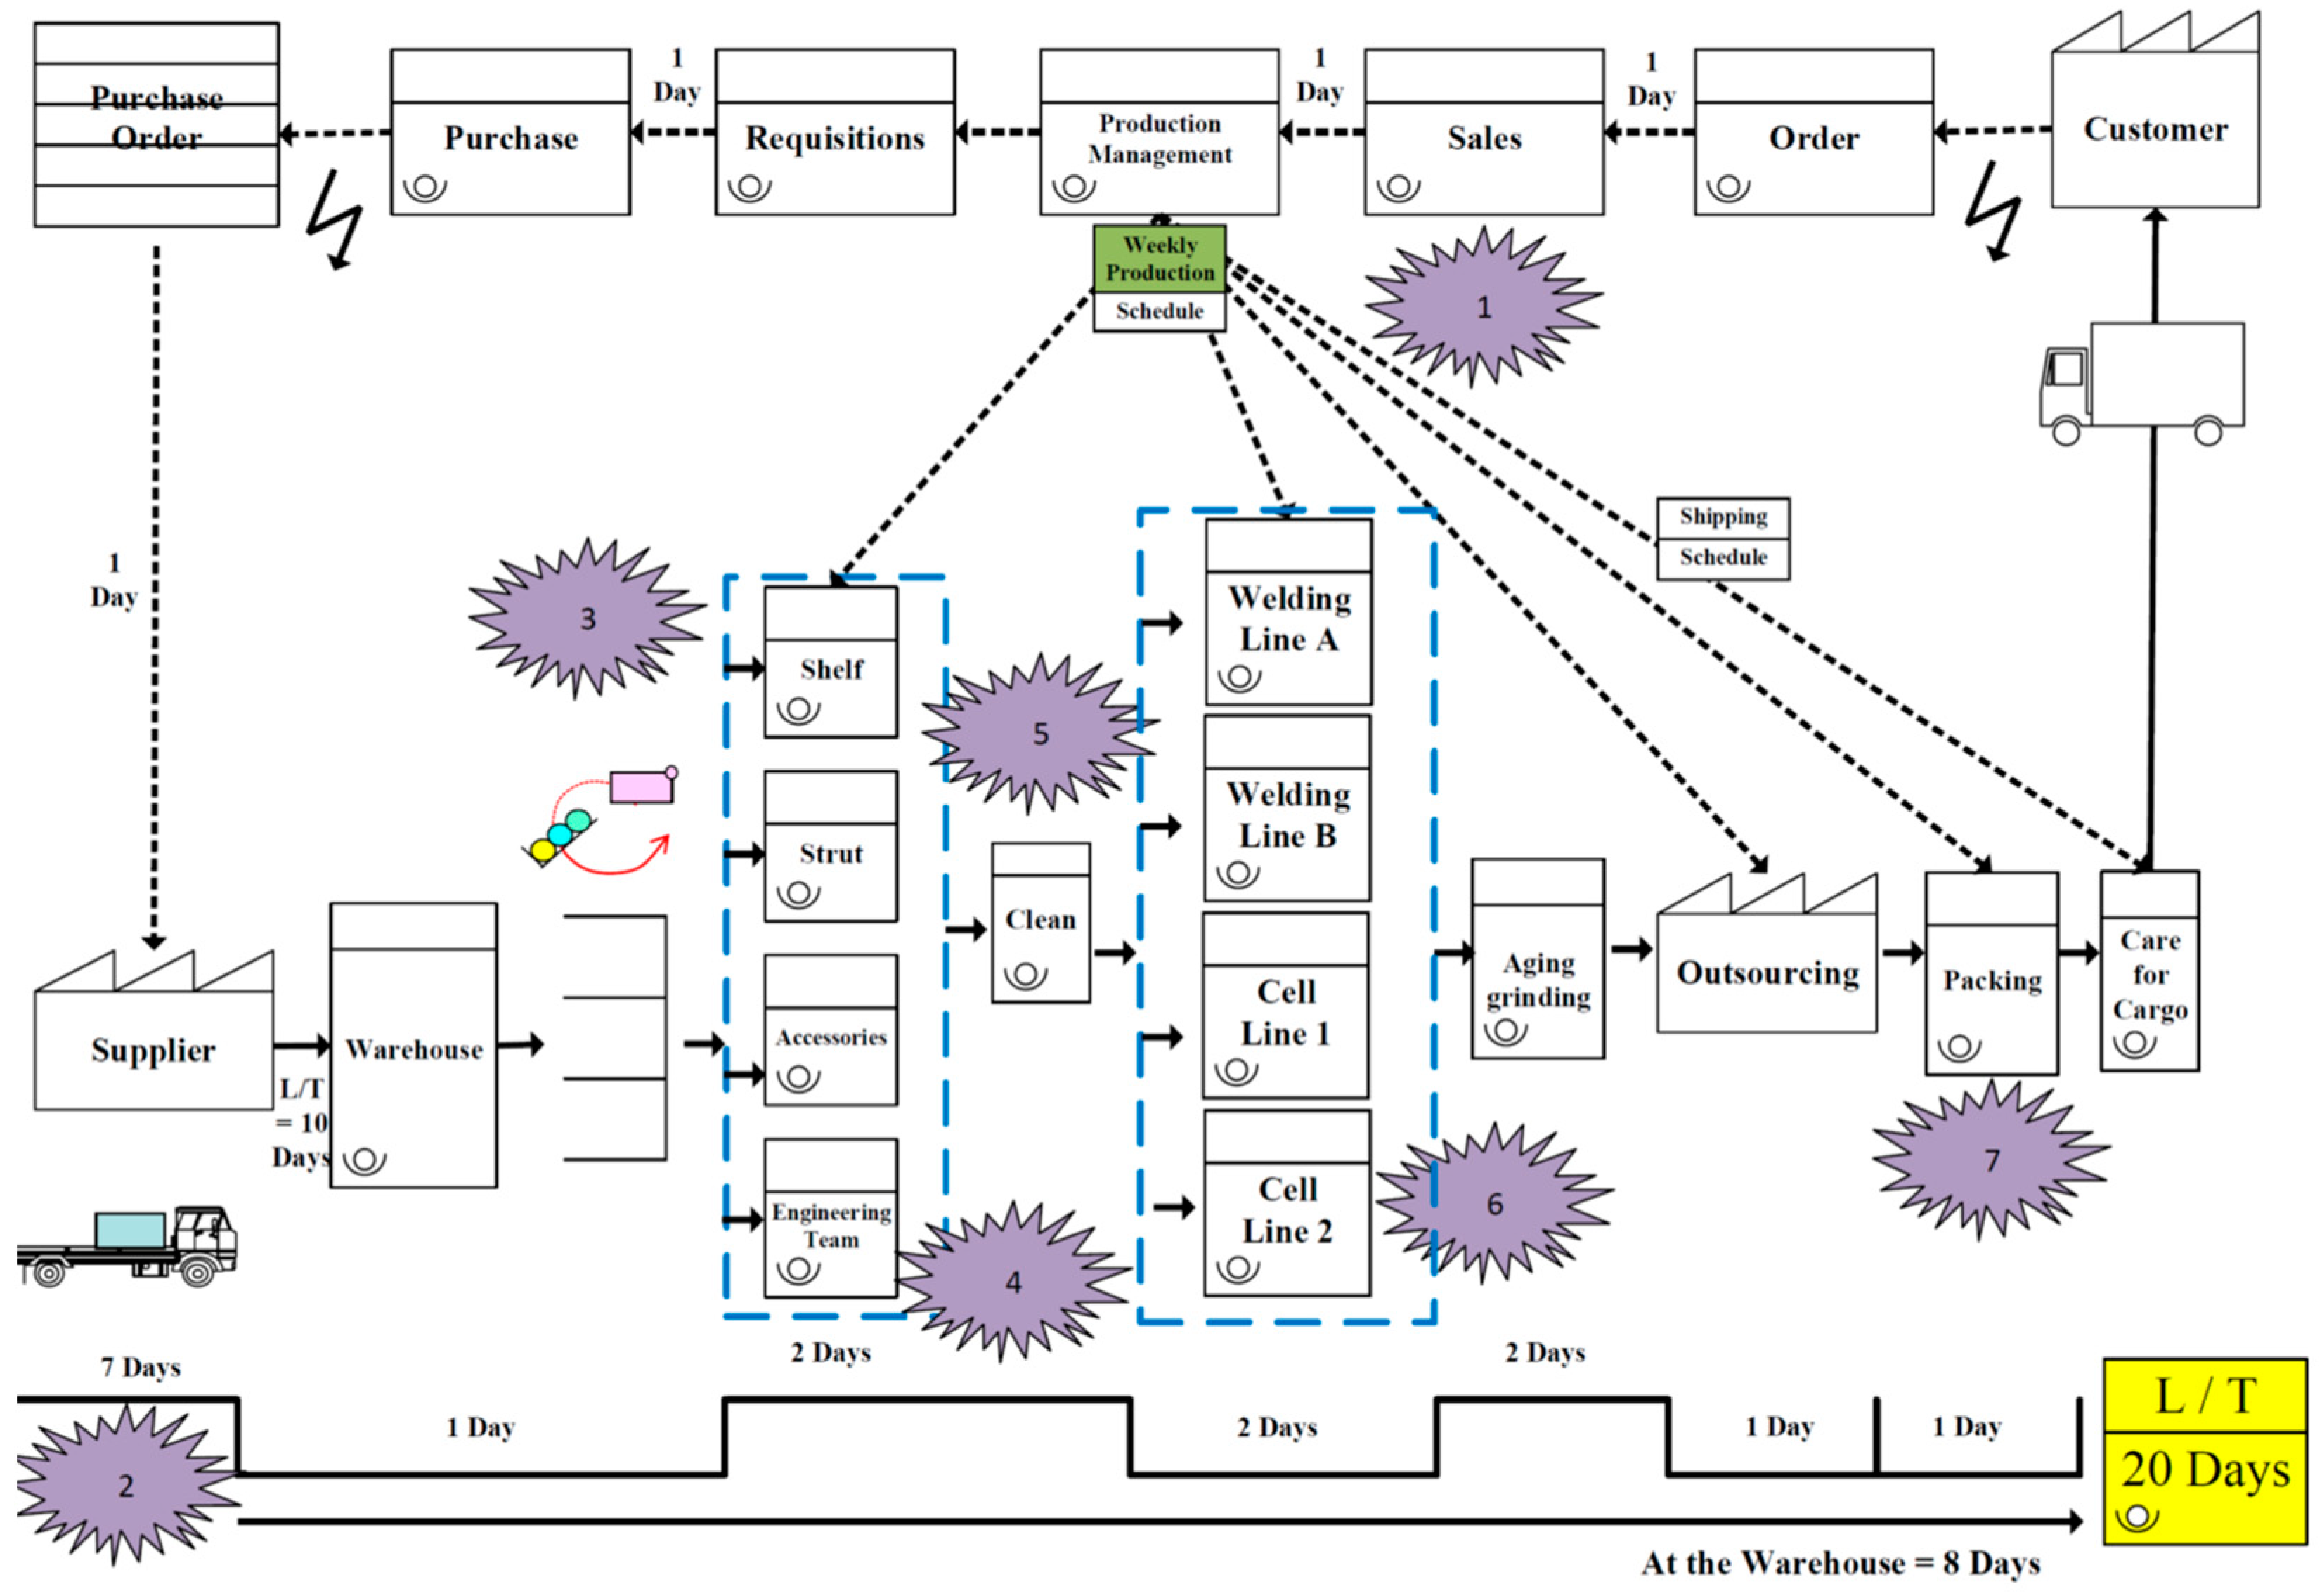
- VSM explosion improvement points:
- 4.
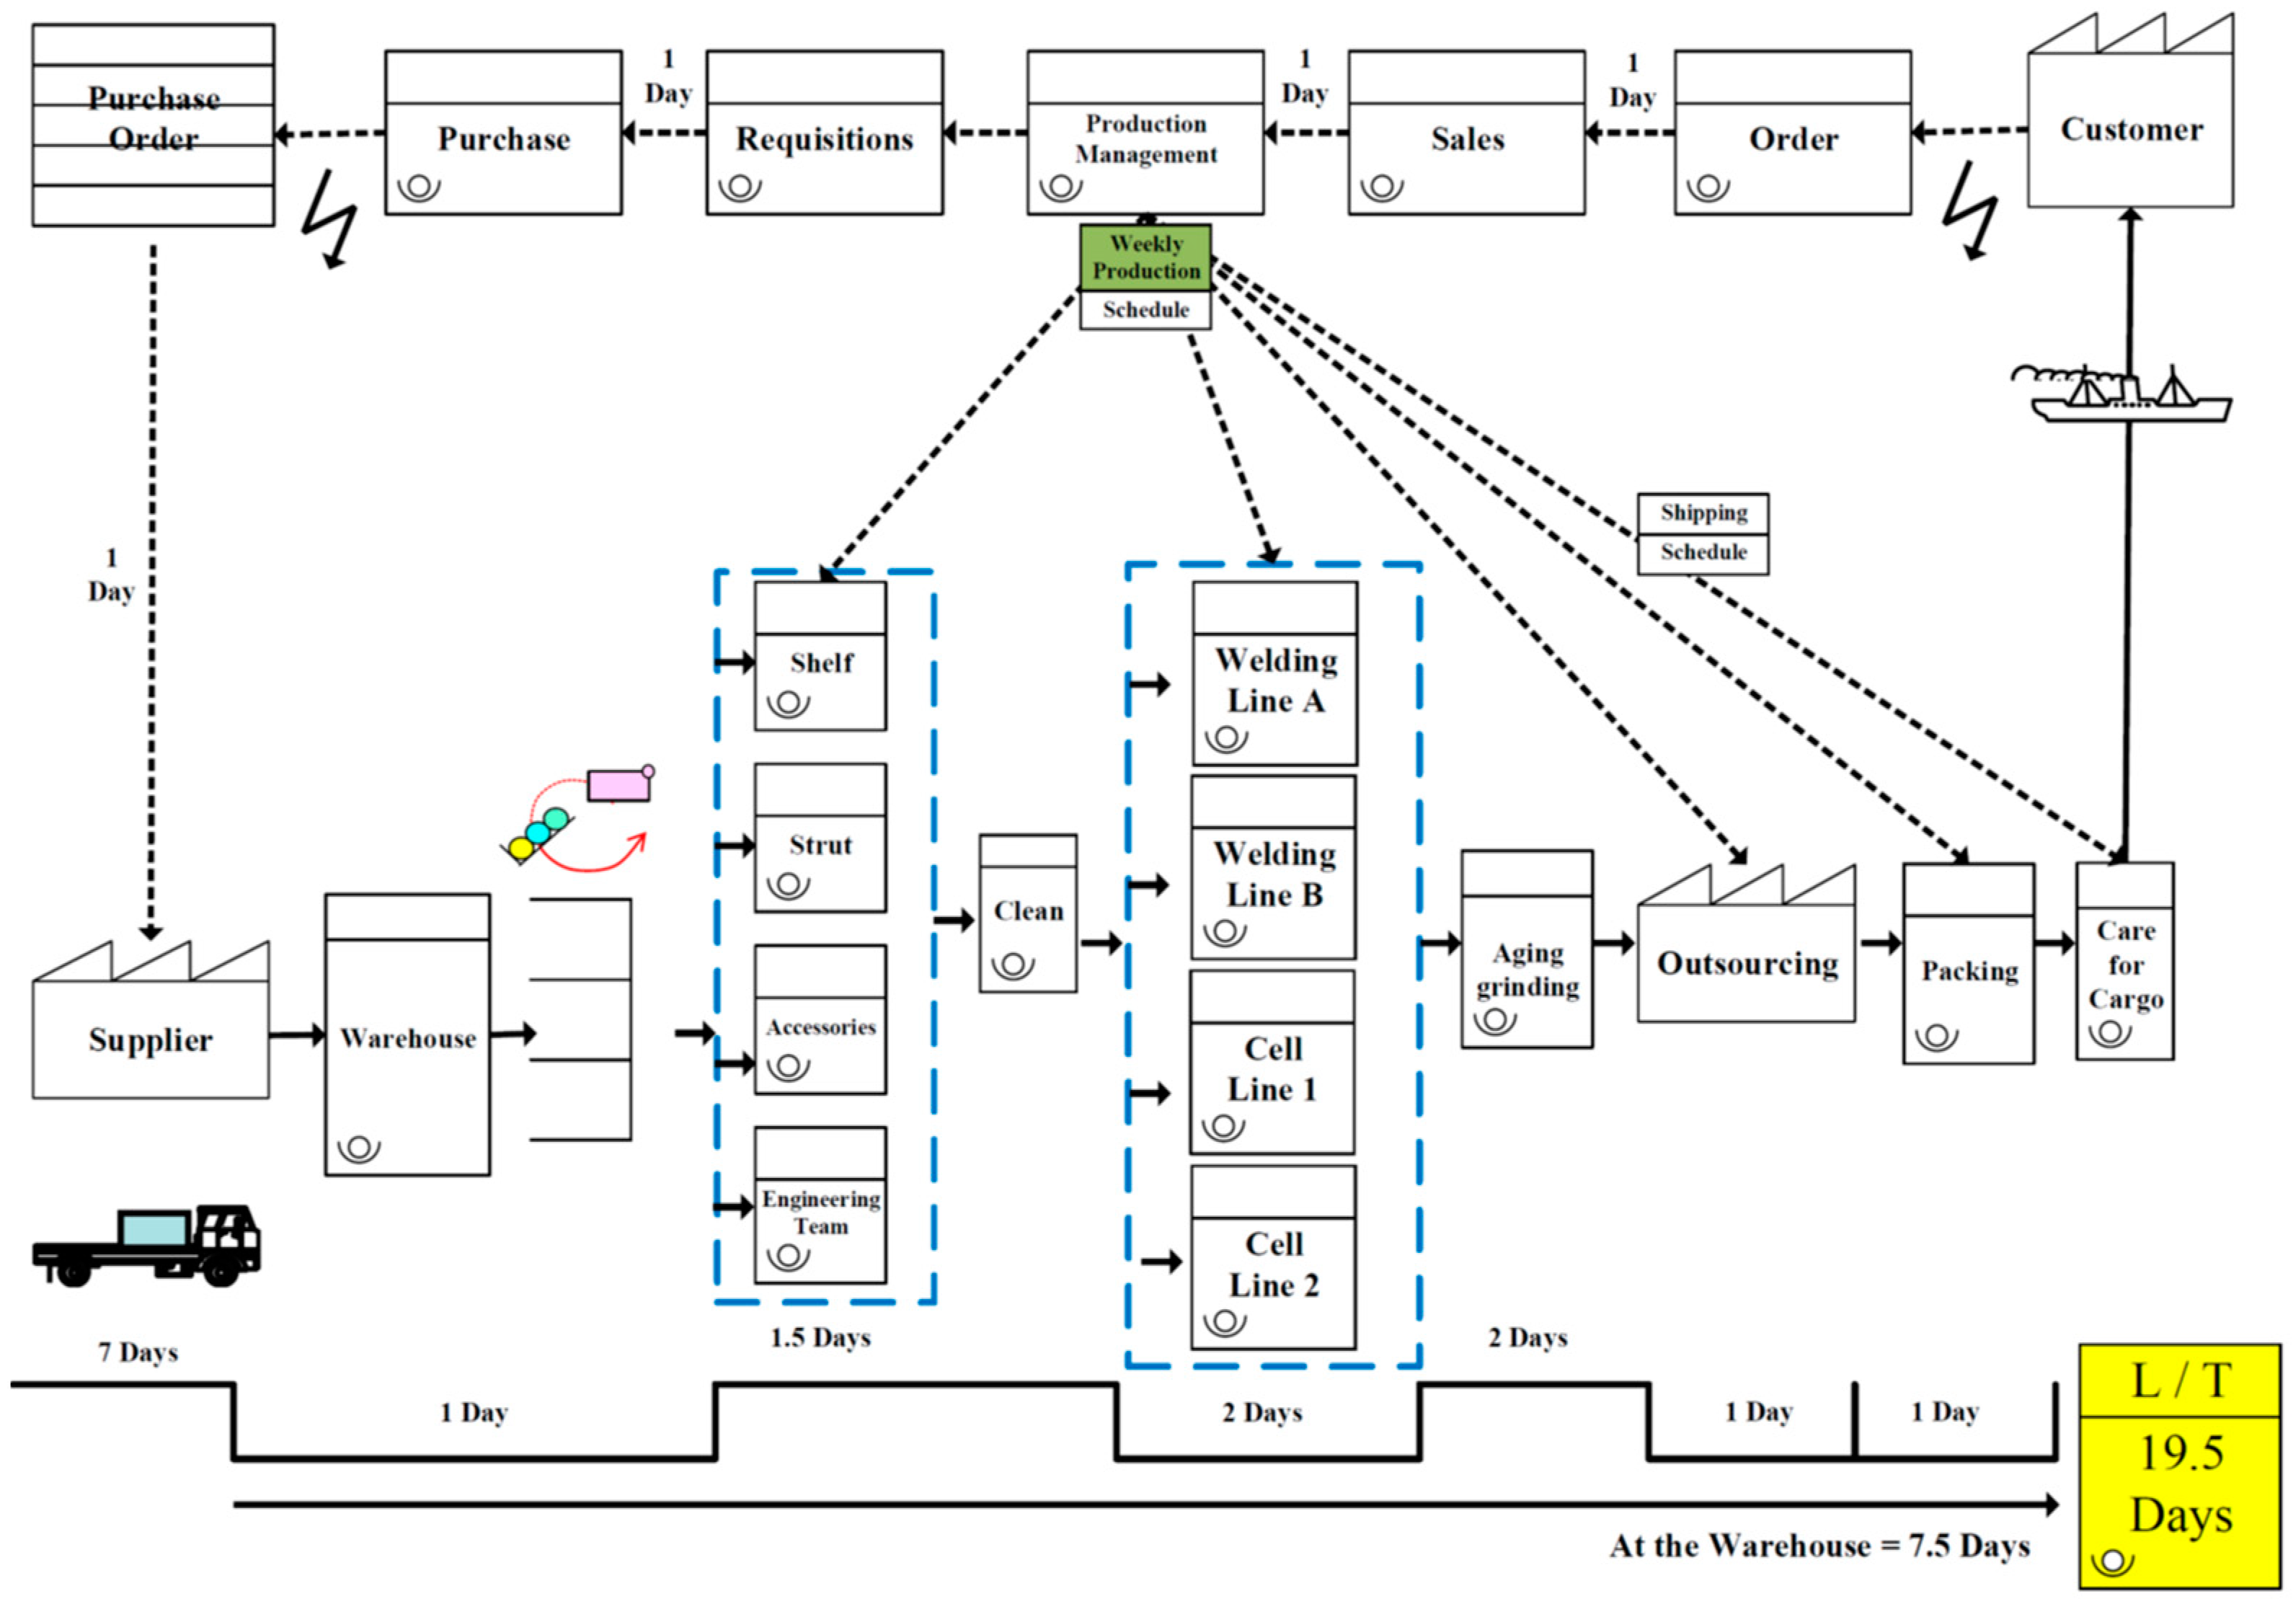
- Drawing the future VSM:
3.2. Improvement of 10 Items of Lean Manufacturing
- Poor efficiency of the original line—change operation:
- A high turnover rate of original employees:
- C1: Collaborative factory delivery design;
- C2: Assist suppliers in order-taking to achieve scheduling optimization;
- C3: Setting and management of delivery process control points;
- C4: Establishment of supply store;
- C5: Different areas of the main products and accessories can be produced simultaneously, along with mobile production;
- C6: Improvement of mold and line change;
- C7: Weld line clearing to avoid improvement;
- C8: Improvement of welding, inspection, and calibration;
- C9: Soldering cell line improvement (for example, X products);
- C10: Packaging cell line improvement (for example, Y products).
4. Discussion
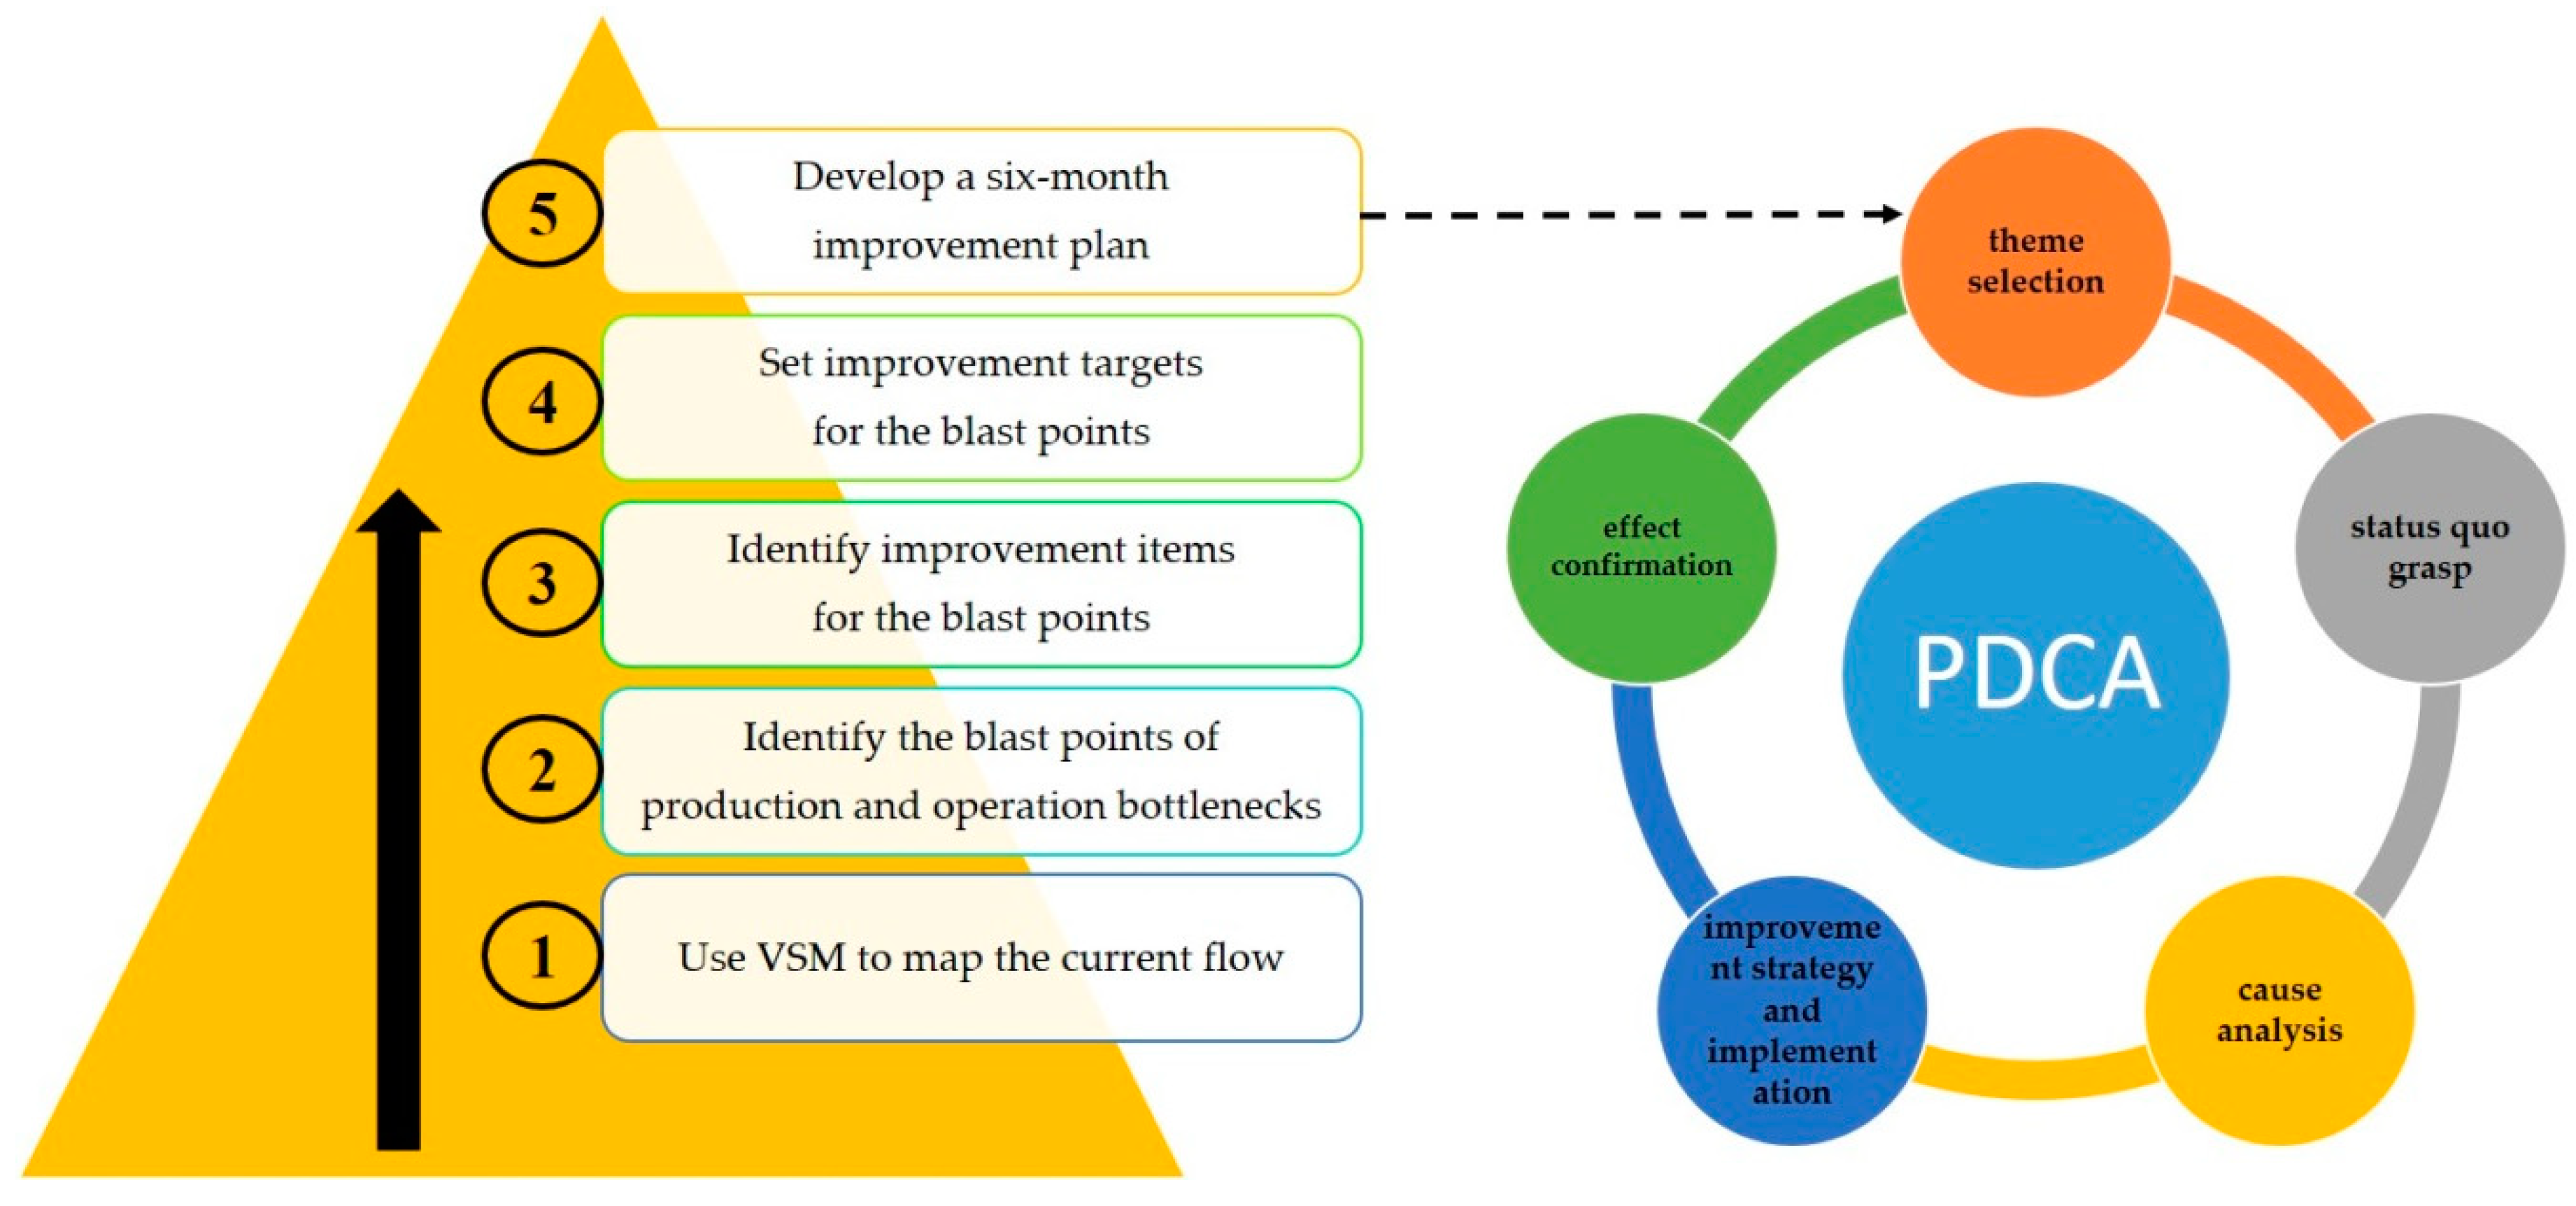
4.1. Lean Production Improvement Model of SMEs
- Use VSM to map the current production flow;
- Identify the explosion points of production and operation bottlenecks;
- Identify improvement items for the explosion points;
- Set improvement targets for the explosion points;
- Use the PDCA management cycle to implement the improvement concept. A five-part improvement process is used to develop a six-month improvement plan (i.e., theme selection, status quo grasp, cause analysis, improvement strategy and implementation, and effect confirmation). A map for promoting lean manufacturing mode in an SME is shown in Figure 5.
4.2. Lean Process after Improvement
5. Conclusions and Suggestions
5.1. Conclusions
- Contribution:
- This study addresses research gaps in the implementation of lean manufacturing in SMEs, and is supplemented by empirical studies to validate the benefits of lean manufacturing in practicing process improvement and improving business performance.
- This study provides a complete analysis of 10 implementation solutions for lean improvement in SMEs, and compiles relevant improvement cases.
- This study develops a five-step implementation model for lean manufacturing—especially in process improvement—that is suitable for SMEs. It also identifies the commitment of senior executives, the formation of project improvement teams, and the training of relevant personnel as the success factors for the implementation of lean manufacturing in SMEs.
- Management Implications:
5.2. Research Limitations and Suggestions for Future Research
Author Contributions
Funding
Data Availability Statement
Conflicts of Interest
References
- Kusiak, A. Smart manufacturing. Int. J. Prod. Res. 2018, 56, 508–517. [Google Scholar] [CrossRef]
- Nallusamy, S. Execution of lean and industrial techniques for productivity enhancement in a manufacturing industry. Mater. Today Proc. 2021, 37, 568–575. [Google Scholar] [CrossRef]
- Singh, M.; Rathi, R.; Garza-Reyes, J.A. Analysis and prioritization of lean six sigma enablers with environmental facets using best worst method: A case of Indian MSMEs. J. Clean. Prod. 2021, 279, 123592. [Google Scholar] [CrossRef]
- Rathi, R.; Prakash, C.; Singh, S.; Krolczyk, G.; Pruncu, C.I. Measurement and analysis of wind energy potential using fuzzy-based hybrid MADM approach. Energy Rep. 2020, 6, 228–237. [Google Scholar] [CrossRef]
- Antony, J.; Snee, R.; Hoerl, R. Lean Six Sigma: Yesterday, today and tomorrow. Int. J. Qual. Reliab. Manag. 2017, 34, 1073–1093. [Google Scholar] [CrossRef]
- Kaswan, M.S.; Rathi, R. Green lean six sigma for sustainable development: Integration and framework. Environ. Impact Assess. 2020, 83, 106396. [Google Scholar] [CrossRef]
- Gonzalez, R.V.D.; Martins, M.F. Capability for Continuous Improvement: Analysis of Companies from Automotive and Capital Goods Industries. TQM J. 2016, 28, 250–274. [Google Scholar] [CrossRef]
- Trubetskaya, A.; Manto, D.; McDermott, O. A Review of Lean Adoption in the Irish MedTech Industry. Processes 2022, 10, 391. [Google Scholar] [CrossRef]
- Alzubi, E.; Atieh, A.M.; Shgair, K.A.; Damiani, J.; Sunna, S.; Madi, A. Hybrid Integrations of Value Stream Mapping, Theory of Constraints and Simulation: Application to Wooden Furniture Industry. Processes 2019, 7, 816. [Google Scholar] [CrossRef] [Green Version]
- Womack, J.P.; Jones, D.T.; Roos, D. The Machine That Changed the World; Simon and Schuster: New York, NY, USA, 1990. [Google Scholar]
- Womack, J.P.; Jones, D.T. Lean Thinking—Banish Waste and Create Wealth in Your Corporation, 3rd ed.; Simon and Schuster: London, UK, 1996. [Google Scholar]
- Marques, P.A.; Carvalho, A.M.; Santos, J.O. Improving Operational and Sustainability Performance in a Retail Fresh Food Market Using Lean: A Portuguese Case Study. Sustainability 2022, 14, 403. [Google Scholar] [CrossRef]
- Baysan, S.; Kabadurmus, O.; Cevikcan, E.; Satoglu, S.I.; Durmusoglu, M.B. A Simulation-based methodology for the analysis of the effect of lean tools on energy efficiency: An application in power distribution industry. J. Clean. Prod. 2019, 211, 895–908. [Google Scholar] [CrossRef]
- Knoll, D.; Reinhart, G.; Prüglmeier, M. Enabling value stream mapping for internal logistics using multidimensional process mining. Expert Syst. Appl. 2019, 124, 130–142. [Google Scholar] [CrossRef]
- Goh, M.; Goh, Y.M. Lean production theory-based simulation of modular construction processes. Autom. Constr. 2019, 101, 227–244. [Google Scholar] [CrossRef]
- Stadnicka, D.; Litwin, P. Value stream mapping and system dynamics integration for manufacturing line modelling and analysis. Int. J. Prod. Econ. 2019, 208, 400–411. [Google Scholar] [CrossRef]
- Wilson, L. How to Implement Lean Manufacturing; McGraw Hill Professional: New York, NY, USA, 2009. [Google Scholar]
- Byrne, B.; McDermott, O.; Noonan, J. Applying Lean Six Sigma Methodology to a Pharmaceutical Manufacturing Facility: A Case Study. Processes 2021, 9, 550. [Google Scholar] [CrossRef]
- Bhasin, S. Lean Management beyond Manufacturing; Springer International Publishing AG: Cham, Switzerland, 2015. [Google Scholar]
- Seth, D.; Seth, N.; Dhariwal, P. Application of value stream mapping (VSM) for lean and cycle time reduction in complex production environments: A case study. Prod. Plan. Control 2017, 28, 398. [Google Scholar] [CrossRef]
- Rother, M.; Shook, J. Learning to See: Value-Stream Mapping to Create Value and Eliminate Muda; Version 1.4; Lean Enterprise Institute: Boston, MA, USA, 1999. [Google Scholar]
- Braglia, M.; Carmignani, G.; Zammori, F. A new value stream mapping approach for complex production systems. Int. J. Prod. Res. 2006, 44, 3929. [Google Scholar] [CrossRef] [Green Version]
- Qin, Y.; Hongrui, L. Application of Value Stream Mapping in E-Commerce: A Case Study on an Amazon Retailer. Sustainability 2022, 14, 713. [Google Scholar] [CrossRef]
- Forno, A.J.D.; Pereira, F.A.; Forcellini, F.A.; Kipper, L.M. Value stream mapping: A study about the problems and challenges found in the literature from the past 15 years about application of Lean tools. Int. J. Adv. Manuf. Syst. 2014, 72, 779–790. [Google Scholar] [CrossRef]
- Goti, A.; De la Calle, A.; Gil, M.J.; Errasti, A.; Bom, P.R.D.; García-Bringas, P. Development and application of an assessment complement for production system audits based on data quality, IT infrastructure, and sustainability. Sustainability 2018, 10, 4679. [Google Scholar] [CrossRef] [Green Version]
- Rathi, R.; Jagadeeswaran, M.; Imran, G.M.; Kumar, K.V.; Eswar, K.V.R.; Sameerpasha, S. Investigation and implementation of VSM in water distillation plant. Mater. Today Proc. 2022, 50, 751–758. [Google Scholar] [CrossRef]
- Gavriluţă, A.C.; Niţu, E.L.; Gavriluţă, C.A. Algorithm to Use Some Specific Lean Manufacturing Methods: Application in an Industrial Production Process. Processes 2021, 9, 641. [Google Scholar] [CrossRef]
- Andreadis, E.; Garza-Reyes, J.A.; Kumar, V. Towards a conceptual framework for value stream mapping (VSM) implementation: An investigation of managerial factors. Int. J. Prod. Res. 2017, 28, 7073–7095. [Google Scholar] [CrossRef]
- Hadid, W. Lean service, business strategy and ABC and their impact on firm performance. Prod. Plan. Control. 2019, 30, 1203–1217. [Google Scholar] [CrossRef]
- Tyagi, S.; Choudhary, A.; Cai, X.; Yang, K. Value stream mapping to reduce the lead-time of a product development process. Int. J. Prod. Econ. 2015, 160, 202–212. [Google Scholar] [CrossRef] [Green Version]
- Santos, A.C.S.G.D.; Reis, A.D.C.; Souza, C.G.; Santos, C.; Ferreria, I.L.; Figueiredo, L.A. The first evidence about conceptual vs analytical lean healthcare research studies. J. Health Organ. Manag. 2020, 34, 789–806. [Google Scholar] [CrossRef] [PubMed]
- Marin-Garcia, J.A.; Vidal-Carreras, P.I.; Garcia-Sabater, J.J. The role of value stream mapping in healthcare services: A scoping review. Int. J. Environ. Res. Public Health 2021, 18, 951. [Google Scholar] [CrossRef]
- Barber, C.S.; Tietje, B.C. A Research Agenda for Value Stream Mapping the Sales Process. J. Pers. Sell. Sales Manag. 2008, 28, 155–165. [Google Scholar] [CrossRef]
- Muñoz-Villamizar, A.; Santos, J.; Garcia-Sabater, J.J.; Lleo, A.; Grau, P. Green value stream mapping approach to improving productivity and environmental performance. Int. J. Product. Perform. Manag. 2019, 68, 608–625. [Google Scholar] [CrossRef]
- Schoeman, Y.; Oberholster, P.; Somerset, V. Value stream mapping as a supporting management tool to identify the flow of industrial waste: A case study. Sustainability 2021, 13, 91. [Google Scholar] [CrossRef]
- Kundgol, S.; Petkar, P.; Gaitonde, V.N. Implementation of value stream mapping (VSM) upgrading process and productivity in aerospace manufacturing industry. Mater. Today Proc. 2021, 46, 4640–4646. [Google Scholar] [CrossRef]
- Berggren, C. Lean Production-the End of History? Work. Empl. Soc. 1993, 7, 163–188. [Google Scholar]
- Yang, C.C. Management Tools Manual; Chinese Society for Quality: Taipei, Taiwan, 2009; ISBN 9578914709. [Google Scholar]
- Álvarez-García, J.; Del Río-Rama, M.D.l.C.; Miras-Rodríguez, M.D.M. How Do Quality Practices Affect the Results?: The Experience of Thalassotherapy Centres in Spain. Sustainability 2017, 9, 671. [Google Scholar] [CrossRef] [Green Version]
- Barclay, R.C.; Cudney, E.A.; Shetty, S.; Antony, J. Determining Critical Success Factors for Lean Implementation. Total Qual. Manag. Bus. Excell. 2021, 1–15. [Google Scholar] [CrossRef]
- Achanga, P.; Shehab, E.; Roy, R.; Nelder, G. Critical success factors for lean implementation within SMEs. J. Manuf. Technol. Manag. 2006, 17, 460–471. [Google Scholar] [CrossRef]
- McDermott, O.; Antony, J.; Sony, M.; Daly, S. Barriers and Enablers for Continuous Improvement Methodologies within the Irish Pharmaceutical Industry. Processes 2022, 10, 73. [Google Scholar] [CrossRef]
- Antony, J.; Krishan, N.; Cullen, D.; Kumar, M. Lean Six Sigma for Higher Education Institutions (HEIs): Challenges, Barriers, Success Factors, Tools/Techniques. Int. J. Product. Perform. Manag. 2012, 61, 940–948. [Google Scholar] [CrossRef]
- Shararah, M.A. A value stream map in motion. Ind. Engi. 2013, 45, 46–50. [Google Scholar]
- Dadashnejad, A.-A.; Valmohammadi, C. Investigating the effect of value stream mapping on operational losses: A case study. J. Eng. Des. Technol. 2018, 16, 478–500. [Google Scholar] [CrossRef]
- Martin, K.; Osterling, M. Value Stream Mapping: How to Visualize Work and Align Leadership for Organizational Transformation, 1st ed.; McGraw-Hill Education: New York, NY, USA, 2013. [Google Scholar]
- Linhares, A. Theory of constraints and the combinatorial complexity of the product-mix decision. Int. J. Prod. Econ. 2009, 121, 121–129. [Google Scholar] [CrossRef]
- Parv, L.; Deaky, B.; Nasulea, M.D.; Oancea, G. Agent-Based Simulation of Value Flow in an Industrial Production Process. Processes 2019, 7, 82. [Google Scholar] [CrossRef] [Green Version]
- Kumar, S.S.; Kumar, M.P. Cycle time reduction of a truck body assembly in an automobile industry by lean principles. Procedia Mater. Sci. 2014, 5, 1853–1862. [Google Scholar] [CrossRef] [Green Version]
- Arunagiri, P.; Gnanavelbabu, A. Identification of high impact lean production tools in automobile industries using weighted average method. Procedia Eng. 2014, 97, 2072–2080. [Google Scholar] [CrossRef] [Green Version]
- Chaudhari, K.; Shah, S.C. A literature review on lead time reduction using the value stream mapping. J. Emerg. Technol. Innov. Res. 2015, 60, 3056. [Google Scholar]
- Marodin, G.A.; Saurin, T.A.; Tortorella, G.L.; Denicol, J. How context factors influence lean production practices in manufacturing cells. Int. J. Adv. Manuf. Technol. 2015, 79, 1389. [Google Scholar] [CrossRef]
- Morales, J.D.; Rodriguez, R.S. Total productive maintenance as a tool for improving productivity: A case study of application in the bottleneck of an auto-parts machining line. Int. J. Adv. Manuf. Technol. 2017, 92, 1013–1026. [Google Scholar] [CrossRef]
- Sutharsan, S.M.; Manickam, C.; Mohan Prasad, M. Production and quality improvement using through lean technique in a monoblock—SWJ1HP pump assembly line. Int. J. Innov. Res. Sci. Eng. Technol. 2015, 4, 201–206. [Google Scholar]
- Vinodh, S.; Arvind, K.R.; Somanaathan, M. Application of value stream mapping in an Indian camshaft manufacturing organisation. J. Manuf. Technol. Manage. 2017, 21, 888–900. [Google Scholar] [CrossRef]
- Brown, A.; Eatock, J.; Dixon, D.; Meenan, B.J.; Anderson, J. Quality and continuous improvement in medical device manufacturing. TQM J. 2008, 20, 541–555. [Google Scholar] [CrossRef]
- Dombrowski, U.; Crespo, I.; Zahn, T. Adaptive Configuration of a Lean Production System in Small and Medium-sized Enterprises. Prod. Eng. 2010, 4, 341–348. [Google Scholar] [CrossRef]
- Wasim, A.; Shehab, E.; Abdalla, H. An innovative cost modelling system to support lean product and process development. Int. J. Adv. Manuf. Technol. 2013, 65, 165–181. [Google Scholar] [CrossRef] [Green Version]
- Hussain, A.; Masood, T.; Munir, H.; Habib, M.S.; Farooq, M.U. Developing resilience in disaster relief operations management through lean transformation. Prod. Plan. Control 2022, 1–22. [Google Scholar] [CrossRef]
- Yankson, B. Continuous improvement process (CIP)-based privacy-preserving framework for smart connected toys. Int. J. Inf. Secur. 2021, 20, 849–869. [Google Scholar] [CrossRef]
- Quality Glossary, American Society for Quality ASQ. Available online: https://asq.org/quality-resources/continuous-improvement (accessed on 11 March 2022).
- Rosa, A.; Marolla, G.; Lega, F.; Manfredi1, F. Lean adoption in hospitals: The role of contextual factors and introduction strategy. BMC Health Serv. Res. 2021, 21, 889. [Google Scholar] [CrossRef] [PubMed]
- Chen, S.C.; Lee, D.S.; Huang, C.Y. Evaluating the Sustainable Operating Performance of Electronics Industry Groups: Taiwanese Firms in Mainland China. Sustainability 2021, 13, 12030. [Google Scholar] [CrossRef]
- Fannon, S.R.; Munive-Hernandez, J.E.; Campean, F. Mastering continuous improvement (CI): The roles and competences of mid-level management and their impact on the organisation’s CI capability. TQM J. 2022, 34, 102–124. [Google Scholar] [CrossRef]


| Work Sequence Measuring Items | Warehouse | Manufacturing | Welding | Timing | Polishing | Outsourcing | Packaging |
|---|---|---|---|---|---|---|---|
| Number of outgoing containers including bulk cargo (pcs/month) | / | / | / | / | / | / | 54 |
| Number of species produced (species/month) | 287 | 287 | 287 | 287 | 287 | 287 | 353 |
| Number of work orders produced (pcs/month) | 99 | 99 | 99 | 99 | 99 | 99 | 99 |
| Production quantity (pcs/month) | 133,424 | 133,424 | 74,667 | 56,485 | 44,485 | 109,230 | 110,128 |
| T/Time (sec) | / | 3.37 | 2.59 | / | 1.24 | / | 3.06 |
| ΣCT (sec) | / | 26,972,672 | 10,066,263 | / | 439,759 | / | 842,2345 |
| Headcount needed | / | 60 | 52 | / | 8 | / | 25 |
| Actual headcount | 3 | 68 | 60 | / | 12 | 1 | 28 |
| Number of production shifts | 1 | 1 | 2 | 1 | 1 | / | 1 |
| Production time/shift (hours) | 8 | 8 | 8 | 8 | 8 | 8 | 8 |
| Overtime hours/day (hours) | 1 | 3 | 0 | 2 | 2 | 1 | 2 |
| Movability | / | 78% | 73% | / | 71% | / | 72% |
| Number of mold and production line changes (times/day) | / | 6 | 4 | / | 4 | / | 8 |
| Mold change time (min/bout) | / | 30 | 20 | / | 10 | / | 10 |
| PPH (per people per hour) | / | 6.86 | 5.98 | / | 14.26 | / | 15.13 |
| Code | Explosion Point | Policy Direction |
|---|---|---|
| B1 | Uncertainty in business orders | Business order normalization. |
| B2 | Supplier delivery chaos | Establish vendor delivery schedules. |
| B3 | Supply is not in real time | Establish the supply sequence store: (1) Kanban introduction, clear sequence; (2) The supply of materials in one cart. |
| B4 | Poor production | (1) Establishing synchronous production; (2) Group operation and resource adaptation; (3) Quick mold change enhancement. |
| B5 | High WIP for cleaning process | Establishment of the sequence of storage before and after cleaning: (1) Clear sequential order; (2) Line correspondence. |
| B6 | Low efficiency of welding | Welding cell line creation. |
| B7 | Low efficiency of packaging | Packaging cell line creation. |
| Improvement Plan | Before Improvement | Objective | Efficiency Gains |
|---|---|---|---|
| L/time reduction (days) | 26 days | 20 days | 6 days curtailment |
| Welded PPH lift (A-type rack) | 10.6 pcs | 13 pcs | 23% improvement in PPH |
| Package PPH lift (B-type bottle cage) | 195 pcs | 300 pcs | 54% improvement in PPH |
| Production site work-in-progress (sets) | 38,763 sets | 7000 sets | 80% reduction |
| Raw material storage weight (KG) | 111,258 KG | 78,000 KG | 30% reduction |
| Shipment achievement rate | 80% | Target 100% | Raised 25% |
| Improvements Category | Explosion Point Improvement Correspondence | Improvement Projects | Expected Improvement Results |
|---|---|---|---|
| Feeding system improvement | B1, B2, B3 | (C1) Collaboration with manufacturers on delivery design. | (1) Suppliers are able to deliver materials according to the schedule set. |
| (C2) Business master scheduling balance. | (2) Easy to access the current production load of Company S. | ||
| (C3) Feeding store establishment. | (3) The warehouse is able to issue materials in an orderly manner. | ||
| (C4) Internal feeding and mixing of multifrequency small-batch dispensing. | (4) Combine the company’s current order status to meet customer needs. | ||
| Synchronization of production | B4, B5, B6 | (C5) SMED (single-minute exchange of die) capability enhancement. | (5) Reduce on-site mold and wire change time to cope with small quantities and diversity. |
| (C6) Production scheduling synchronization + synchronized production in different areas. | (6) Simultaneous set production, shorten L/time by 3.5 days. | ||
| (C7) Same-region mobile production. | (7) The equipment is configured to roughly match the machining process of the workpiece. | ||
| (C8) Welding work line clearing to avoid improvement. | (8) Eliminate waiting time and overtime. | ||
| (C9) Improvement of welding, inspection, and calibration process integration. | (9) To enable the orderly transfer of the complete set of accessories according to the production plan. | ||
| Welding/packaging production model change | B6, B7 | (C10) Welding/packaging cellularization. | (10-1) Improve line balance and productivity per person through small line improvement; (10-2) Accumulate successful experience through successful trial production. |
| C1 | Before | After |
|
| |
| Improvement tool | Heijunka and color control. | |
| Improvement effect |
| |


| C2 | Before | After |
|
| |
| Improvement tool | VSM; production scheduling. | |
| Improvement effect |
| |
| C3 | Before | After |
| The supplier’s delivery is not controlled, and the goods sent are not matched and will pile up in the company’s warehouse, mainly because the control point is not clear. |
| |
| Improvement tool | Supplier management practices. | |
| Improvement effect |
| |
| C4 | Before | After |
| Not in accordance with the needs of the site, but the same specifications of the material on the schedule; the recent production to be sent to the site at once—whether it matches or not—often resulting in the accumulation of materials on site. |
| |
| Improvement tool | Material management; material store setup. | |
| Improvement effect | Based on the needs of the store, the production unit’s daily production of materials is set as required to lay the foundations for production. | |
| C5 | Before | After |
| Improvement: weekly plan with a weighted average number of people calculated, used in each part of the synchronized production implementation:
| |
| Improvement tool | Production scheduling; SMED (single-minute exchange of die). | |
| Improvement effect | Simultaneous production; shorten L/time by 3.5 days. | |
| C6 | Before | After |
| A product mold change time is calculated based on the existing 10 stations; each set of molds takes about 8 min, for a total of 80 min, accounting for 20% of the production time. | After changing the mold base to quick mold change, it takes about 4 min for each set of molds, and only 40 min for 10 stations to change the molds for the same product. | |
| Improvement tool | SMED. | |
| Improvement effect | The mold change time was reduced by 50%, benefitting the current production status of small quantities and diversity. | |
| C7 | Before | After |
| Clear the line at the end of each shift. It takes about 20 min to clear and rearrange the line (for example, 10 work stations). | If the product is not fully welded, 3–5 products are reserved for welding on the next shift, which saves about 20 min each time. | |
| Improvement tool | Production scheduling; 5S. | |
| Improvement effect | A line based on 10 people, in turn, saves 20, 18, 16,…, 2 min; two shifts a day can save about 220 min. | |
| C8 | Before | After |
| The welded products from the three lines are all moved to the calibration table for calibration and packing. |
| |
| Improvement tool | Industrial Engineering 7 tools (IE 7 tools). | |
| Improvement effect |
| |
| C9 | Before | After |
| The use of large assembly line welding easily leads to product pile-up and waiting, while the company’s current staff is more stable, and most of the orders are of small quantity and are diverse. | The welding molds are controlled within 3–4 sets, and the welding time of each station is adjusted to the best balance. | |
| Improvement tool | Industrial Engineering 7 tools (IE 7 tools). | |
| Improvement effect |
| |
| C10 | Before | After |
All products are packaged on large assembly lines, and frequent line changes (usually 30–40 products in a cabinet) and low production line balance have become a problem for managers.
| Depending on the customer’s order and the structure of the product, different packaging methods can be defined.
| |
| Improvement tool | IE 7 tools; bath production. | |
| Improvement effect | The PPH of product Y’s packaging is 195 pcs before improvement, and 320 pcs after improvement, which is an increase of 125 pcs. | |
| Improvement Plan | Before | Goal | After | Efficiency Gains |
|---|---|---|---|---|
| L/time curtailment (days) | 26 days | 20 days | 19.5 days | 25.00% |
| Welded PPH improvement (A-type rack) | 10.6 PCS | 13 PCS | 13.6 PCS | 28.3% |
| Package PPH improvement (B-type bottle cage) | 195 PCS | 300 PCS | 320 PCS | 64.1% |
| Work in progress (sets) | 38,763 sets | 7000 sets | 6263 sets | 83.84% |
| Raw material storage weight (KG) | 111,258 KG | 78,000 KG | 46,022 KG | 58.63% |
| Shipment achievement rate | 80% | 100% | 91.60% * | 14.5% |
| Remark: | * 6-month average of Shipment Achievement Rate: improvement of 1st month: 84.87%, 2nd month: 90.11%, 3rd month: 89.18%, 4th month: 92.81%, 5th month: 93.46%, 6th month: 99.14% respectively. | |||
Publisher’s Note: MDPI stays neutral with regard to jurisdictional claims in published maps and institutional affiliations. |
© 2022 by the authors. Licensee MDPI, Basel, Switzerland. This article is an open access article distributed under the terms and conditions of the Creative Commons Attribution (CC BY) license (https://creativecommons.org/licenses/by/4.0/).
Share and Cite
Huang, C.-Y.; Lee, D.; Chen, S.-C.; Tang, W. A Lean Manufacturing Progress Model and Implementation for SMEs in the Metal Products Industry. Processes 2022, 10, 835. https://doi.org/10.3390/pr10050835
Huang C-Y, Lee D, Chen S-C, Tang W. A Lean Manufacturing Progress Model and Implementation for SMEs in the Metal Products Industry. Processes. 2022; 10(5):835. https://doi.org/10.3390/pr10050835
Chicago/Turabian StyleHuang, Chien-Yi, Dasheng Lee, Shu-Chuan Chen, and William Tang. 2022. "A Lean Manufacturing Progress Model and Implementation for SMEs in the Metal Products Industry" Processes 10, no. 5: 835. https://doi.org/10.3390/pr10050835
APA StyleHuang, C.-Y., Lee, D., Chen, S.-C., & Tang, W. (2022). A Lean Manufacturing Progress Model and Implementation for SMEs in the Metal Products Industry. Processes, 10(5), 835. https://doi.org/10.3390/pr10050835