Article

A Substrate Integrated Waveguide Resonator Sensor for Dual-Band Complex Permittivity Measurement

1
College of Electronics and Information Engineering, Sichuan University, Chengdu 610064, China
2
Chengdu Research Center, Huawei Technologies Co., Ltd., Chengdu 610041, China
3
Research Institute for Sustainable Humanosphere, Kyoto University, Kyoto 606-8501, Japan
*
Authors to whom correspondence should be addressed.
Processes 2022, 10(4), 708; https://doi.org/10.3390/pr10040708
Submission received: 8 March 2022 / Revised: 31 March 2022 / Accepted: 2 April 2022 / Published: 5 April 2022
(This article belongs to the Special Issue Microwave Applications in Chemistry and Materials Processing)

Abstract

:
This paper presents a novel dual-band substrate integrated waveguide (SIW) sensor that is designed to measure the complex permittivities of liquids or solid powders at two industrial, scientific, and medical (ISM) frequencies simultaneously. Resonant frequencies and quality factors are obtained from S-parameter measurements with the proposed SIW sensor, and applied to reconstructing the permittivities of materials under test through an artificial neural network. The water–ethanol mixed liquids were measured with the proposed sensor. The maximum deviations of the measured permittivities at 2.45 and 5.8 GHz are within 3% of literature results. The measurement by the proposed SIW sensor with artificial neural network reconstruction is accurate and efficient.

1. Introduction

Permittivity ( ε = ε j ε ) plays a very important role in materials for industrial, scientific, and medical applications [1]. Hence, the measurement of permittivity in industrial applications of microwave energy is of substantial importance. The measurement methods can be divided into resonant type and non-resonant type [2]. Resonator-based approaches are an attractive choice due to their high sensitivity [3,4]. Non-resonant approaches have broadband frequency capabilities [5,6,7]. Multi-band measurements may combine the advantages of high sensitivities and broadband frequency capabilities together in some particular applications.
In chemistry, we sometimes find that looking at an overall reaction alone fails to tell us accurate information about the dynamics—in particular, the kinetics—of a reaction. Reaction mechanisms act as tools to do this by allowing us to split an overall reaction into a series of intermediate reactions [8,9]. These intermediate properties can then be examined individually and can collectively tell us much about the properties of the overall reaction that we see. In some chemical reactions, the permittivity of reactant mixtures can be measured to examine these intermediate properties and properties of the overall reactions. Dual-band measurements can simultaneously reveal the products in the reaction process at two different frequencies, which can provide more information for the study of the intermediate reactions of the overall chemical reaction, and provide the necessary foundation for the study of the reaction mechanism.
Microwave sensors are key components in permittivity measurement systems, since the measurement results depend on the sensor performance greatly. An increasing number of studies have investigated microwave sensor designs, such as coaxial probes, waveguides, and dielectric resonators, in order to properly characterize their material properties in terms of their complex permittivity [10]. Most of them are costly, since their structure design entails a complicated measurement setup and a complex design construction [11,12,13].
Permittivity measurement technology has become much more advanced through the development of planar microwave resonator sensors. They provide an ideal platform to realize compact and low-cost sensors with high accuracy and high quality (Q) factor, which present enhanced sensitivity for permittivity measurements [14,15,16,17]. SIW structures have been proposed to design a number of planar microwave resonator sensors [18,19,20]. They are considered to be reliable candidates due to the low-cost mass production of microwave circuits [21,22]. A slotted SIW resonator sensor can measure liquid permittivity accurately at C-band [23]. It is worthwhile mentioning that a multi-band permittivity sensor is quite useful due to the properties of dielectric materials dependent upon frequency [24]. Based on the multi-band measurements, the use of SIW sensors has advantages in permittivity measurement.
Real-time measurement is often required in permittivity measurements. In real-time measurements, material permittivity can be reconstructed by using modern optimization algorithms [25]. The artificial neural network (ANN), a modern optimization algorithm, is one of the fastest growing areas of computer science with far-reaching applications [26]. ANN computational modules have been applied to microwave techniques and have become a useful form of tool recently [27,28]. The ANN is introduced to deal with the complex relationship between the applied electromagnetic field and test materials. To establish the non-linear relationship in a microwave measurement, the ANN is applied to provide a mathematical solution that can be trained to map a set of inputs to another set of outputs [29]. The ANN can be trained to learn the behavior of an effective permittivity of a material under microwave irradiation in a test system, and it can provide a fast and accurate result in material permittivity measurements. Thus, an on-line measurement may be realized based on the ANN.
In this paper, a novel dual-band SIW resonator was designed and fabricated. It is composed of two square SIW resonators with cascading connection along diagonal direction. Compared with traditional SIW resonators, the proposed SIW sensor can measure liquid complex permittivity at both C- and S-band simultaneously. It realized highly sensitive measurements at dual-frequency in broadband. Due to the specific structure, the sensor has high-quality factors at both operating frequencies, which makes it suitable to measure a wide range of permittivity with high accuracy. We used an ANN to reconstruct the complex permittivity of measured materials. The proposed SIW sensor can realize real-time measurements. It has a bright future in microwave chemistry applications.

2. Measurement Method and Setup

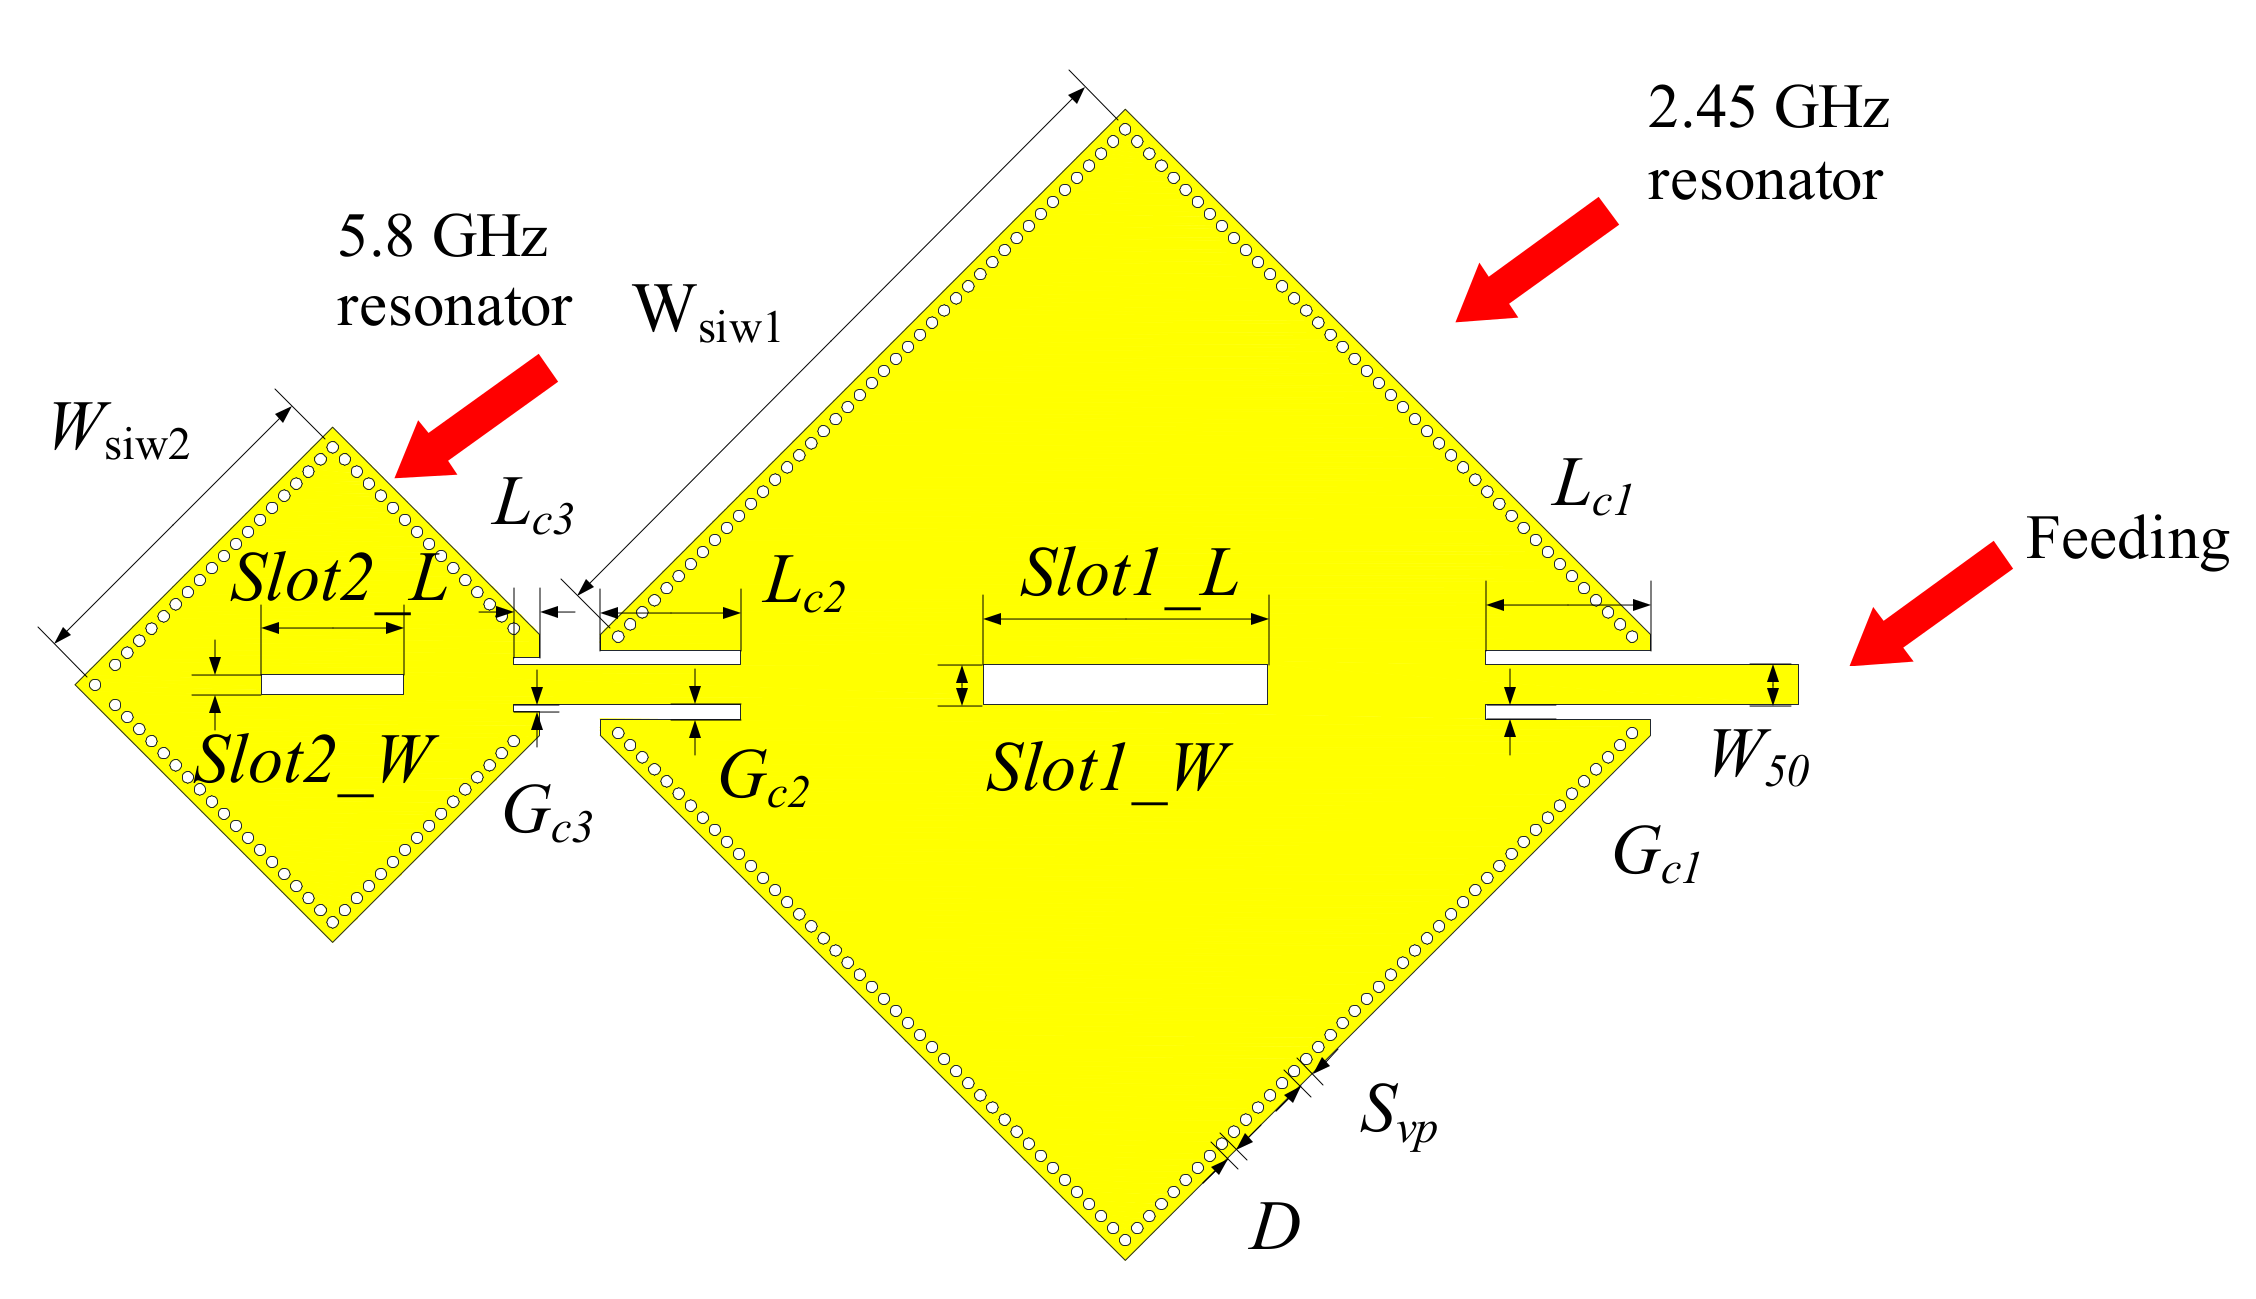
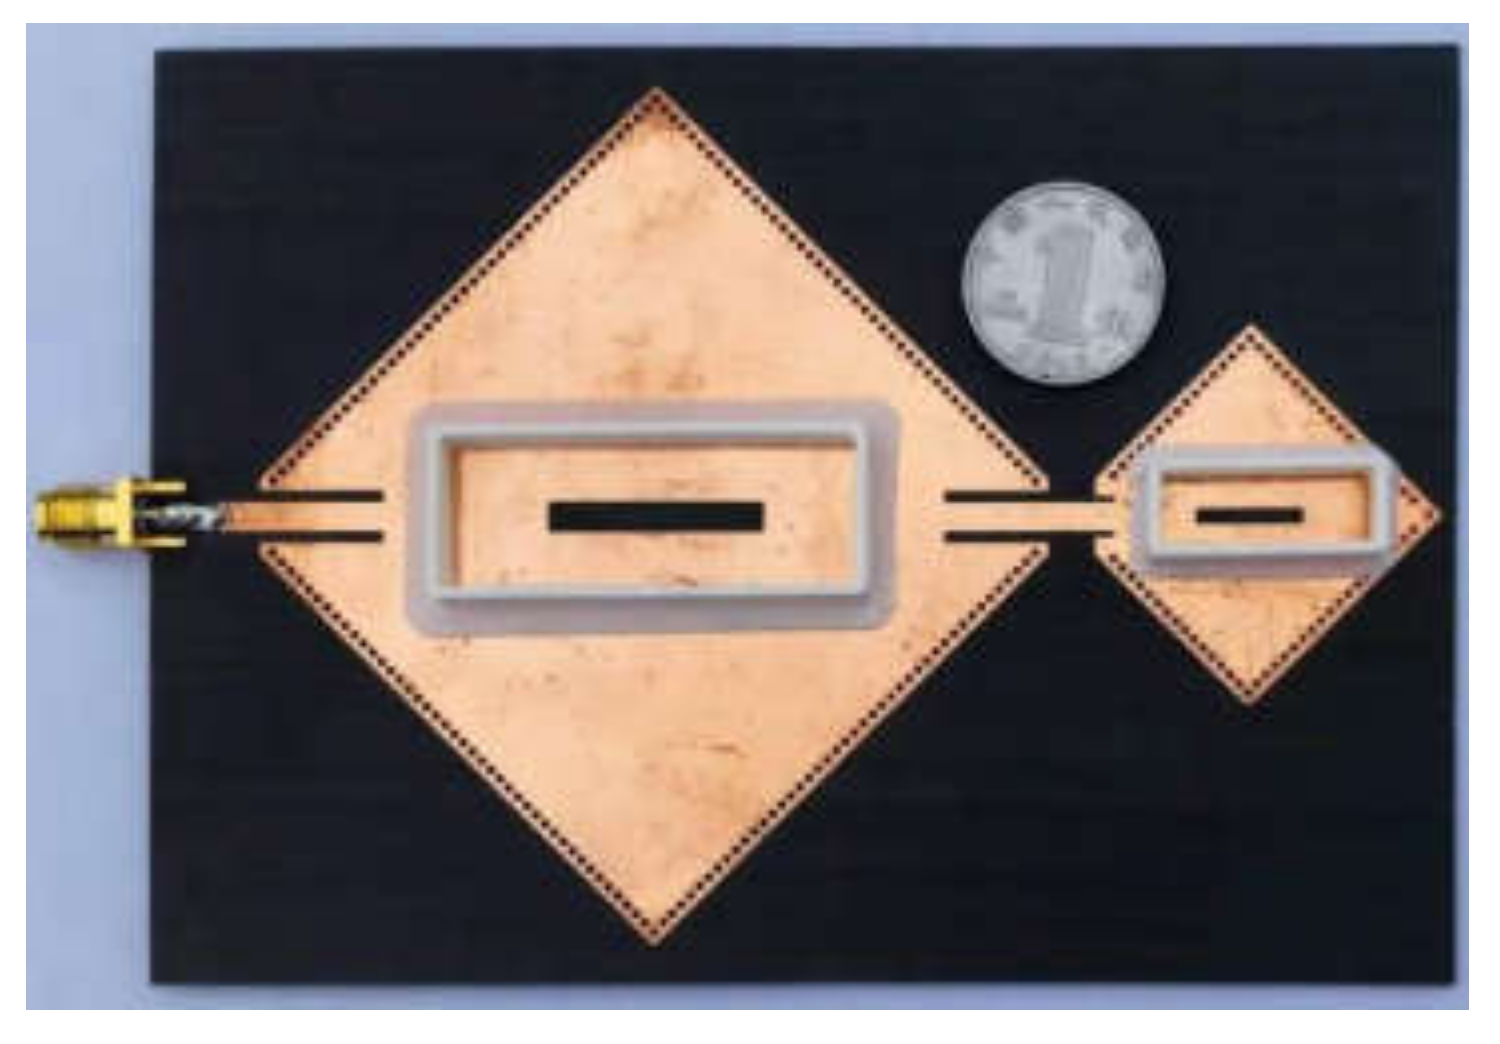
2.1. Structure of the Proposed Sensor

Figure 1 shows the proposed sensor. It consists of three parts: a small and a large resonant cavity working at 5.85 GHz and 2.45 GHz, respectively, and an interconnection between them. The length of each square SIW resonator is determined by the measurement frequency. In the coupling structures, the gaps (Gc1, Gc2, and Gc3 in Figure 1) between the center conductor and the SIW ground plane are minimized to suppress the undesired power leakage. The coupling between two cavities is along the diagonal direction to realize two independent resonances. To minimize reflection, the length of the center feeding to each resonator was tuned to achieve a better resonance at 2.45 GHz and 5.85 GHz, respectively. The resonant mode of each cavity is TE101. We choose an F4B-2 substrate with εr = 2.51, tan δ = 0.0025, and thickness 1 mm to build the sensor. Its dimensions are as follows (referring to Figure 1): W50 = 2.8 mm, Lc1 = 12.0 mm, Lc2 = 12.0 mm, Lc3 = 4.0 mm, slot1_W = 2.8 mm, Wsiw1 = 55.2 mm, slot1_L = 20.0 mm, Wsiw2 = 23.6 mm, slot2_W = 1.4 mm, slot2_L = 10.0 mm, Gc1 = 1.0 mm, Gc2 = 2.8 mm, Gc3 = 0.5 mm, the diameter of the vias D = 0.8 mm, and the center-to-center spacing Svp = 1.2 mm. The thickness of the copper foil is 17 μm. The total dimension of the sensor is 128 × 88 × 1 mm3. There are two narrow slots along its diagonal line at the center of each top layer, and the materials to be measured are placed on the slots when measuring. The length of each slot is approximated to λg/4, where λg is the guided wavelength of the TE10 mode at the resonant frequency.

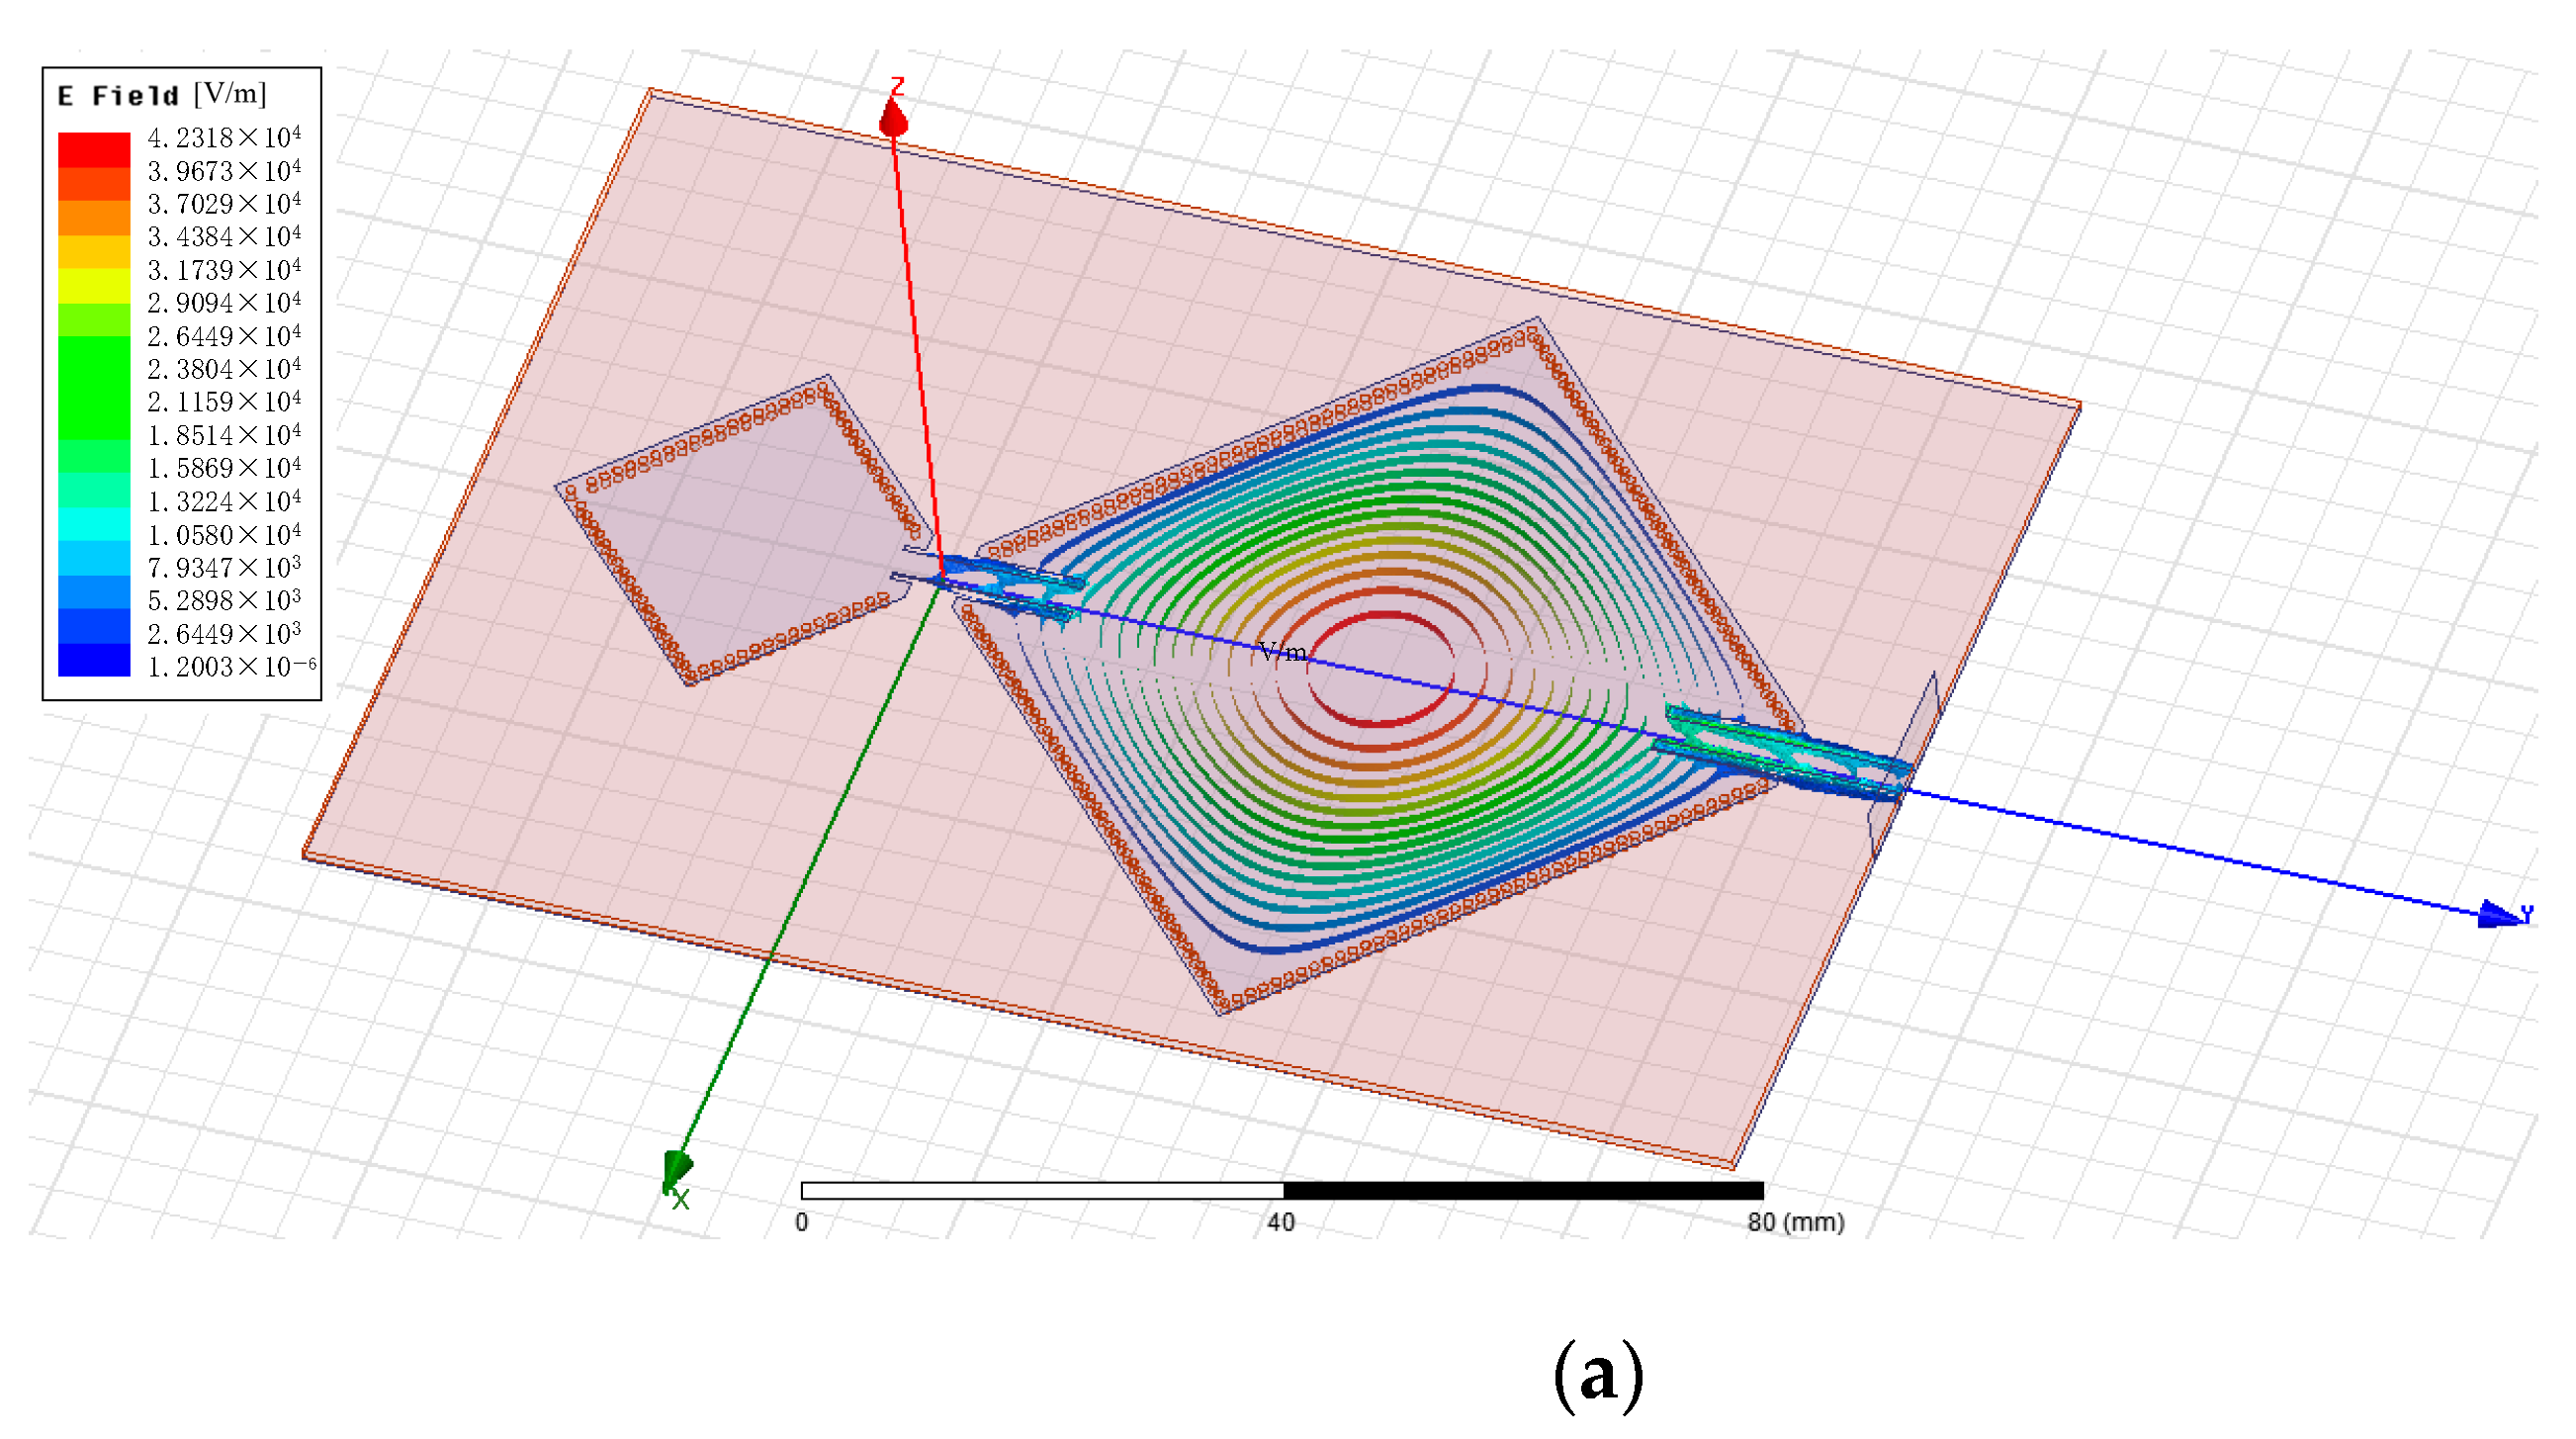
2.2. Electric Field Distribution of the Proposed Sensor

The electric field distribution is achieved from the ANSYS high-frequency structure simulator (HFSS), as shown in Figure 2. The behavior of SIW resonators at two resonance frequencies was analyzed. It is obvious from Figure 2a,b that the electric fields at 2.45 GHz and 5.8 GHz are focused to the large and small cavities, respectively. Each resonator has its own independent corresponding resonance frequencies, which benefit from coupling along the diagonal direction. Furthermore, these two resonators are sufficiently distanced to minimize the interference between them. The specific structures that connect the two resonators contribute to reduced mutual coupling between the resonators and hence an improved performance. The material on the slot affects the electromagnetic field leakage, which in turn affects the resonant frequency and quality factor. However, the slot is very narrow and has no great impacts on the resonators. In addition, the impedance matching was factored into the design and optimized with the inclusion of the two slots. At resonant frequencies, the electric field is weakly affected by the slot, which is similar to the measurement based on the disturbance method.

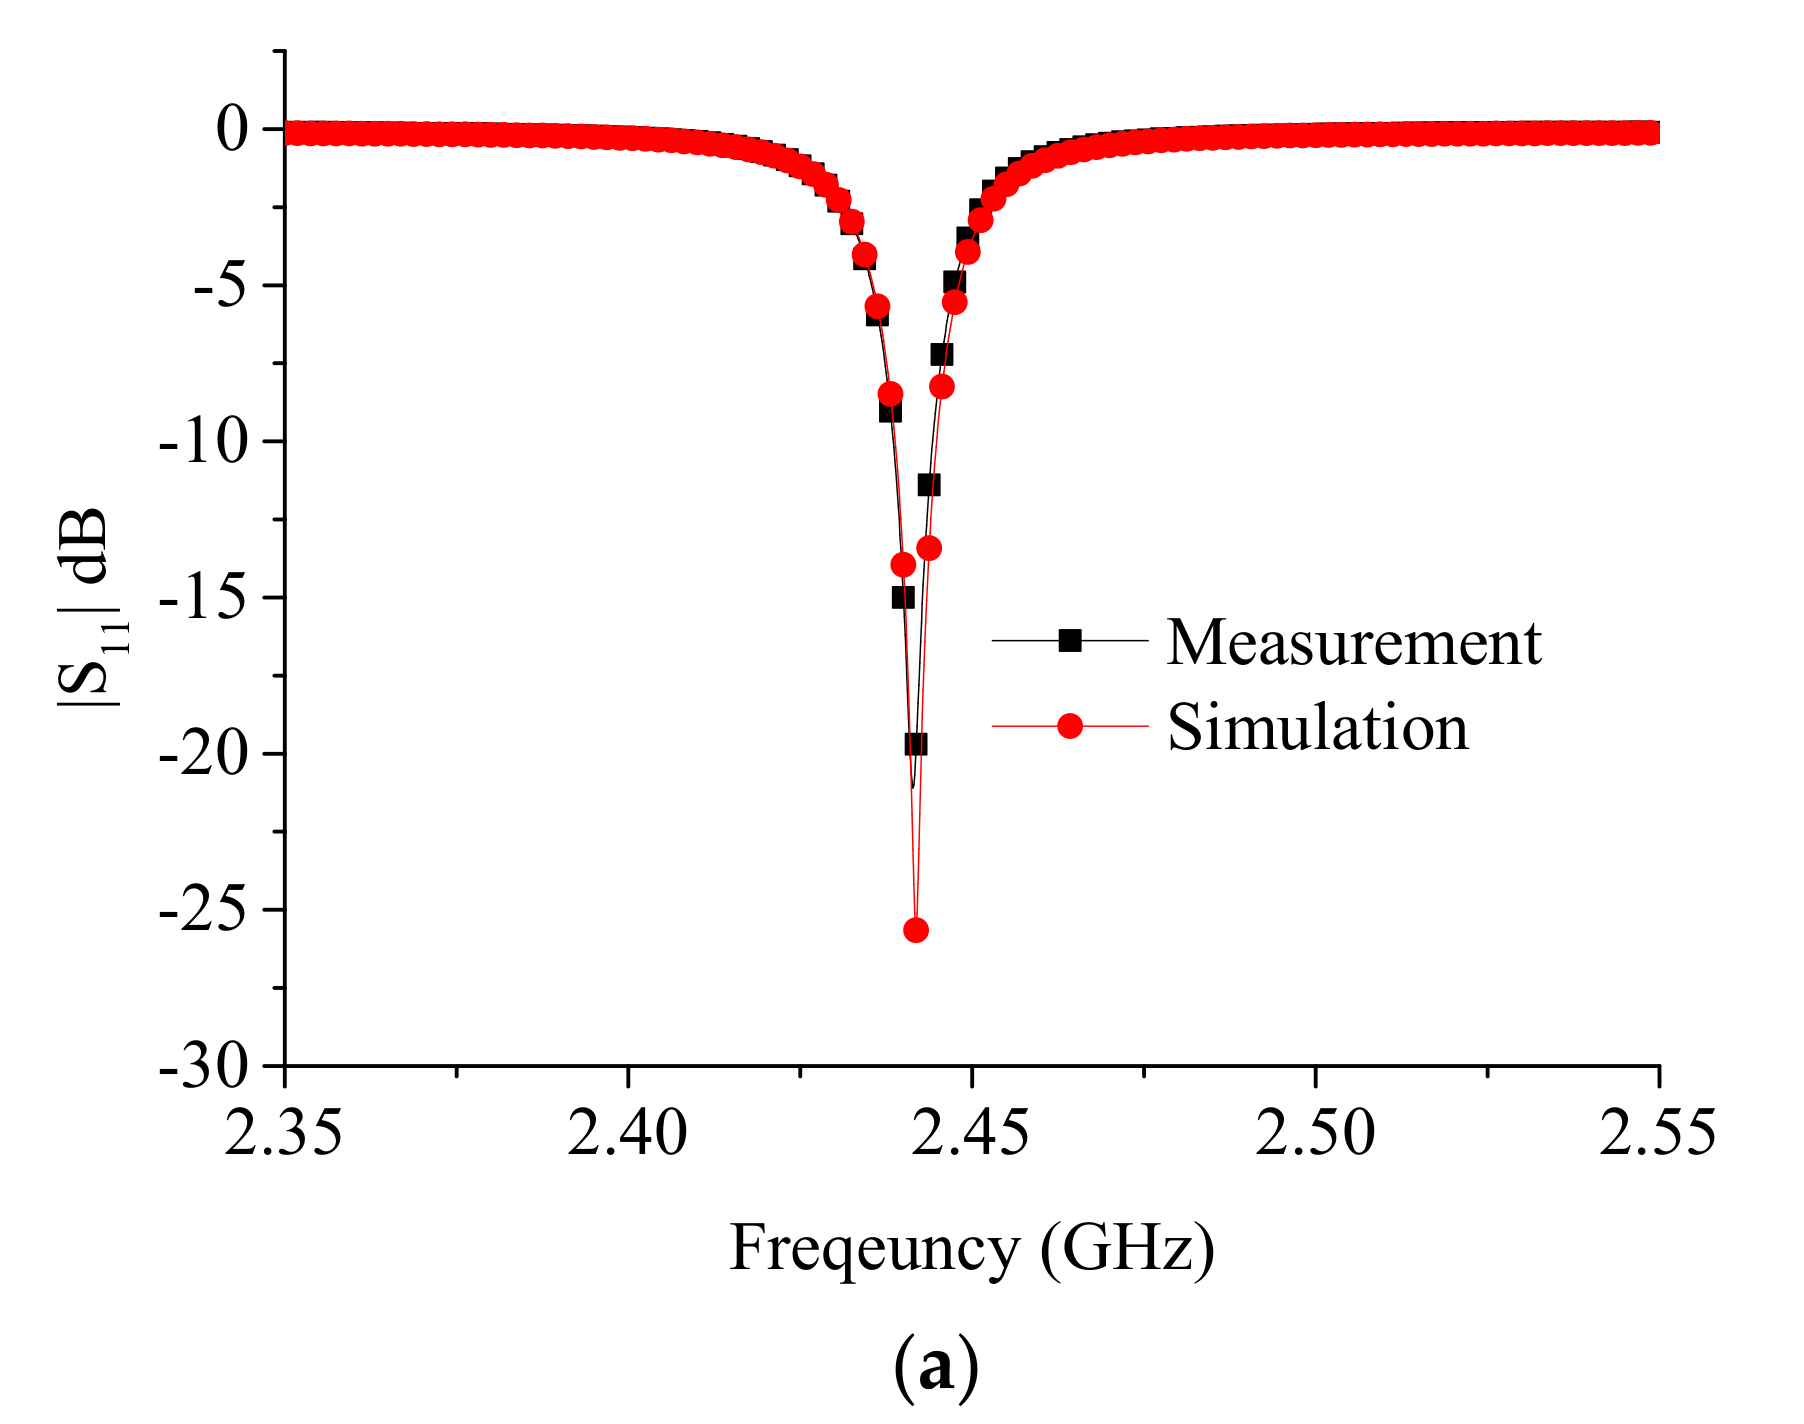
2.3. Measured and Simulated Results of the Proposed Sensor

The simulated and measured results at either frequency are shown in Figure 3. There is good agreement between the simulated and measured results. Detailed results regarding the resonant frequencies and quality factors are shown in Table 1. The simulation results are basically the same as the measurement results. When the frequency increases, the dielectric and conductor losses will increase, resulting in not much difference between the two resonator Q values.
Two plastic frames are applied in order to keep the material under test above the slots. The dimensions of the two frames are 40 × 16 × 5 mm3 and 22 × 9 × 5 mm3, respectively. According to the simulated and measured results, the two frames have no influence on the sensor. The liquids under test influence the resonant frequencies and quality factors of the sensor through two slots. During measurements, the slots are completely covered with the liquid mixtures of ethanol and water. By varying the ethanol concentrations, the resonant frequencies and quality factors vary with the complex permittivities of liquid under test. The fabricated sensor for complex permittivity measurement and the measurement system are shown in Figure 4 and Figure 5, respectively. In order to reduce the errors, each sample is measured 10 times in order to generate average values for consideration.

3. Extraction of Permittivities

3.1. Measurements of the Sensor Resonant Frequency and Quality Factor

The resonant frequencies of the TEmnp mode for an SIW resonator are as follows:
f m n p S I W = 1 2 π ε μ m π L e f f 2 + n π h 2 + p π W e f f 2
where m = 1, 2,…, n = 1, 2,…, p = 1, 2,…, μ = μ0μr, and ε = ε0εr are the permeability and permittivity of the substrate, respectively. Leff, h, and Weff are length, thickness, and width, respectively. They are related to the resonator dimensions. The dimensions of the two resonators are different, and the resonant frequencies are also different. The thickness of the SIW resonator is h. Its equivalent length and width are as follows:
W e f f = W S I W 1.08 D 2 S v p + 0.1 D 2 W S I W
L e f f = L S I W 1.08 D 2 S v p + 0.1 D 2 L S I W
where LSIW and WSIW are the length and width of the SIW resonator [30], respectively, for the designed sensor LSIW = WSIW.
Characterization of the SIW resonator can be achieved according to the letter [31]. The unloaded quality factor of the SIW resonator is influenced by Qc and Qd, respectively.
1 Q u = 1 Q c + 1 Q d
where Qc and Qd represent the quality factor of the resonator, when the dielectric is lossless and the metal is a perfect metal, respectively. The relationship between Qd and tan δ is as follows.
Q d = ε ε = 1 tan δ
where ε′ and ε″ are the real and imaginary part of the permittivity, respectively.
The complex permittivity of the substrate and liquid under test mainly affect the effective complex permittivity of the SIW resonator at working frequency. The above Equations (1), (4), and (5) explain the relationship.

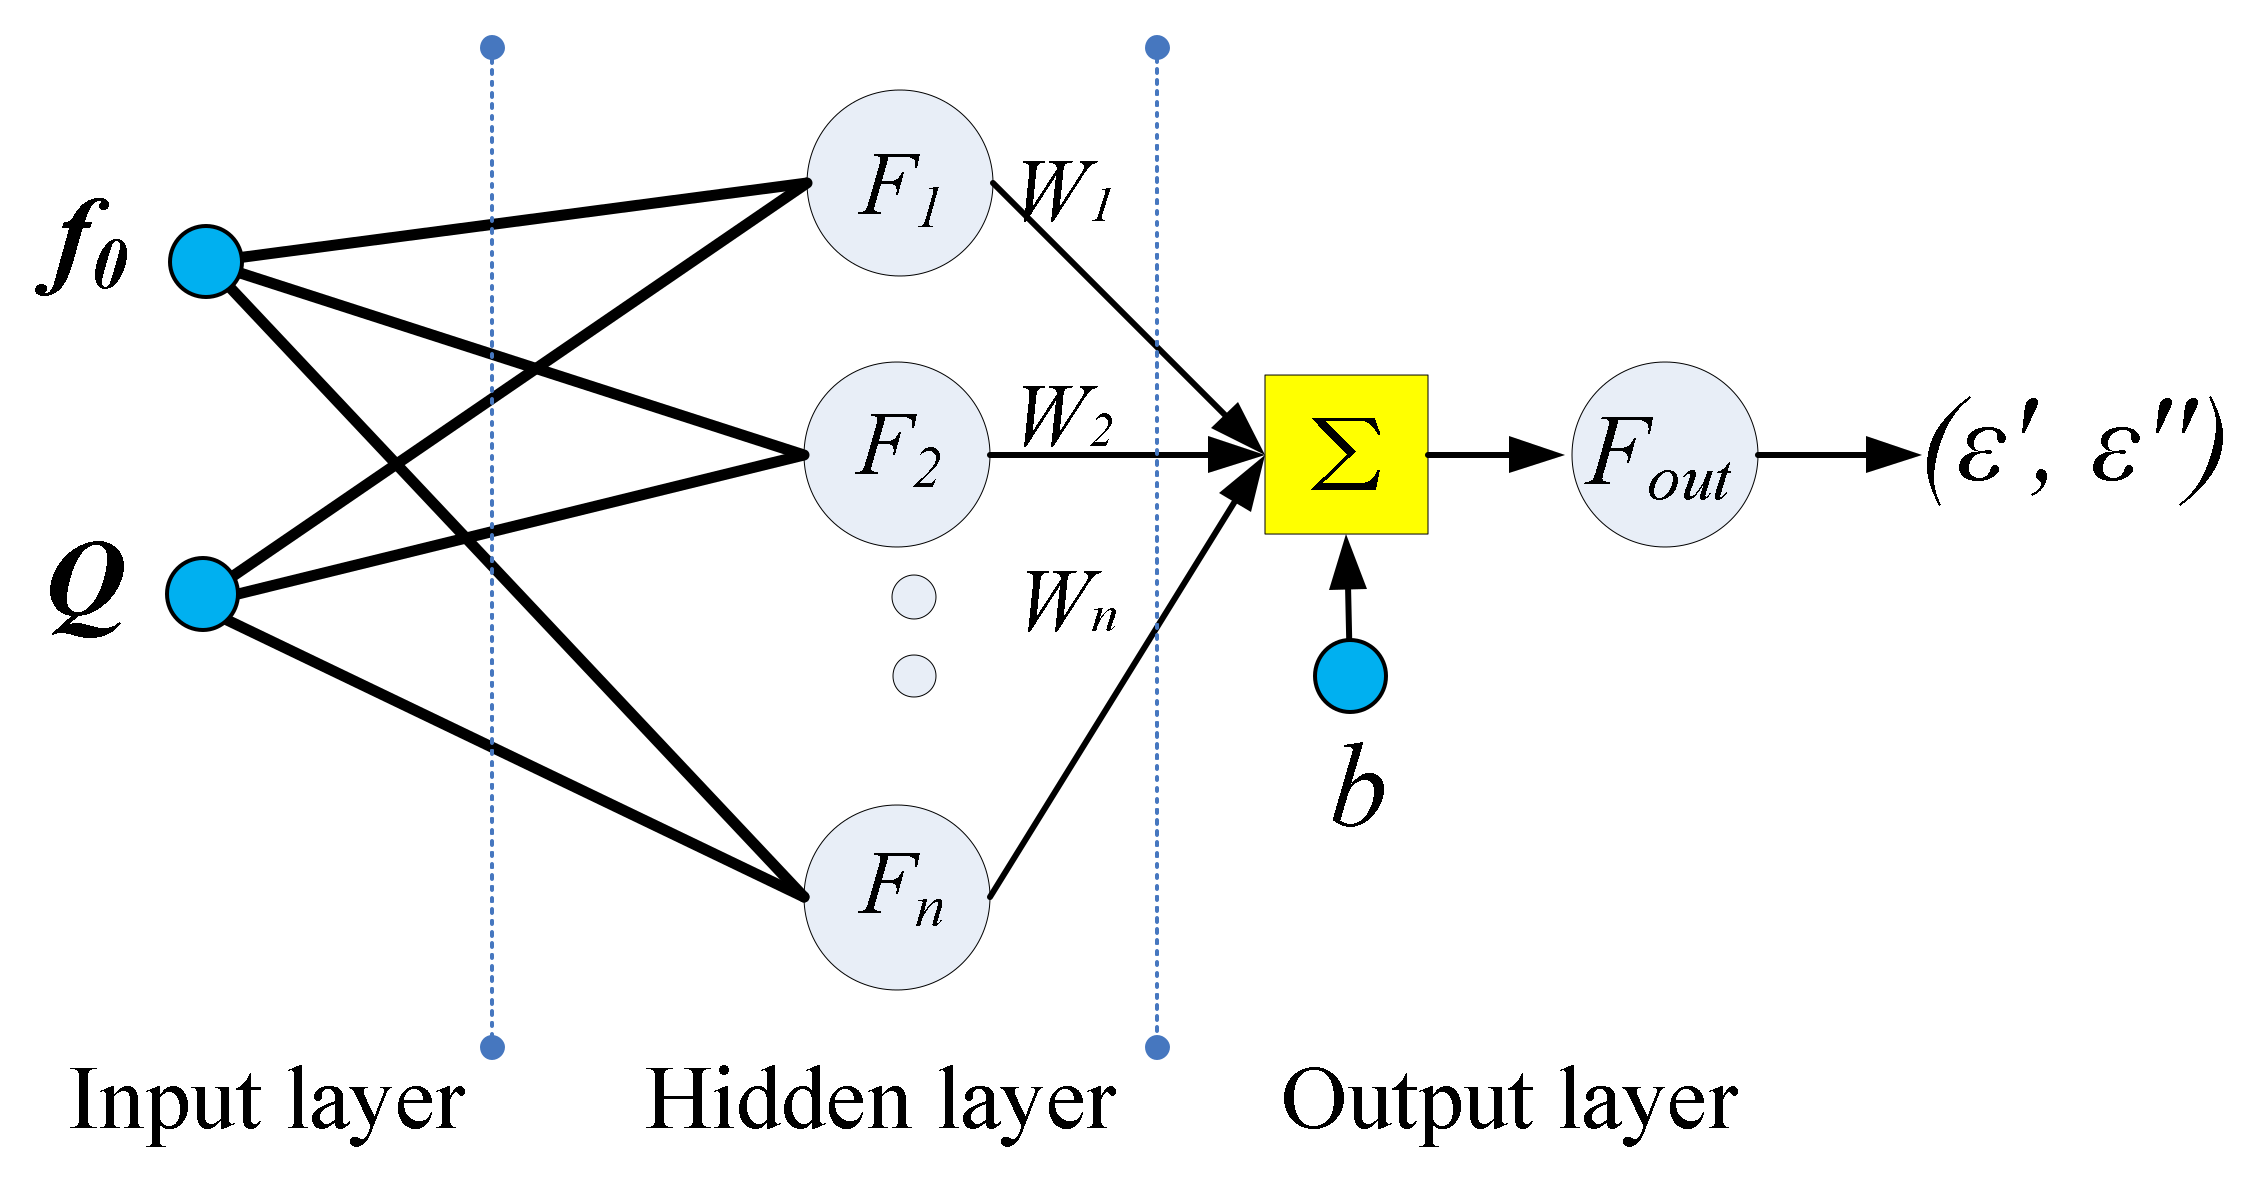
3.2. Diagram of the BP-ANN Algorithm

The complex permittivity of liquid under test mainly affects the quality factors and resonant frequencies of the SIW resonator in the working frequency band. We used a back-propagation artificial neural network (BP-ANN) (Figure 6) to reconstruct the complex permittivity of the material measured by the unloaded quality factor Q and resonant frequency f0. The measured Q and f0 along with permittivities of the methanol–water mixtures constitute the input and output of the BP-ANN, respectively. We obtained the relationship between the complex permittivities of liquids under test and measured parameters including the unloaded quality factors and resonant frequencies, which are determined by the simulation results with the HFSS. These data are applied to the training of the BP-ANN, which is influenced by the connection strength of the neural units and the transfer rules.

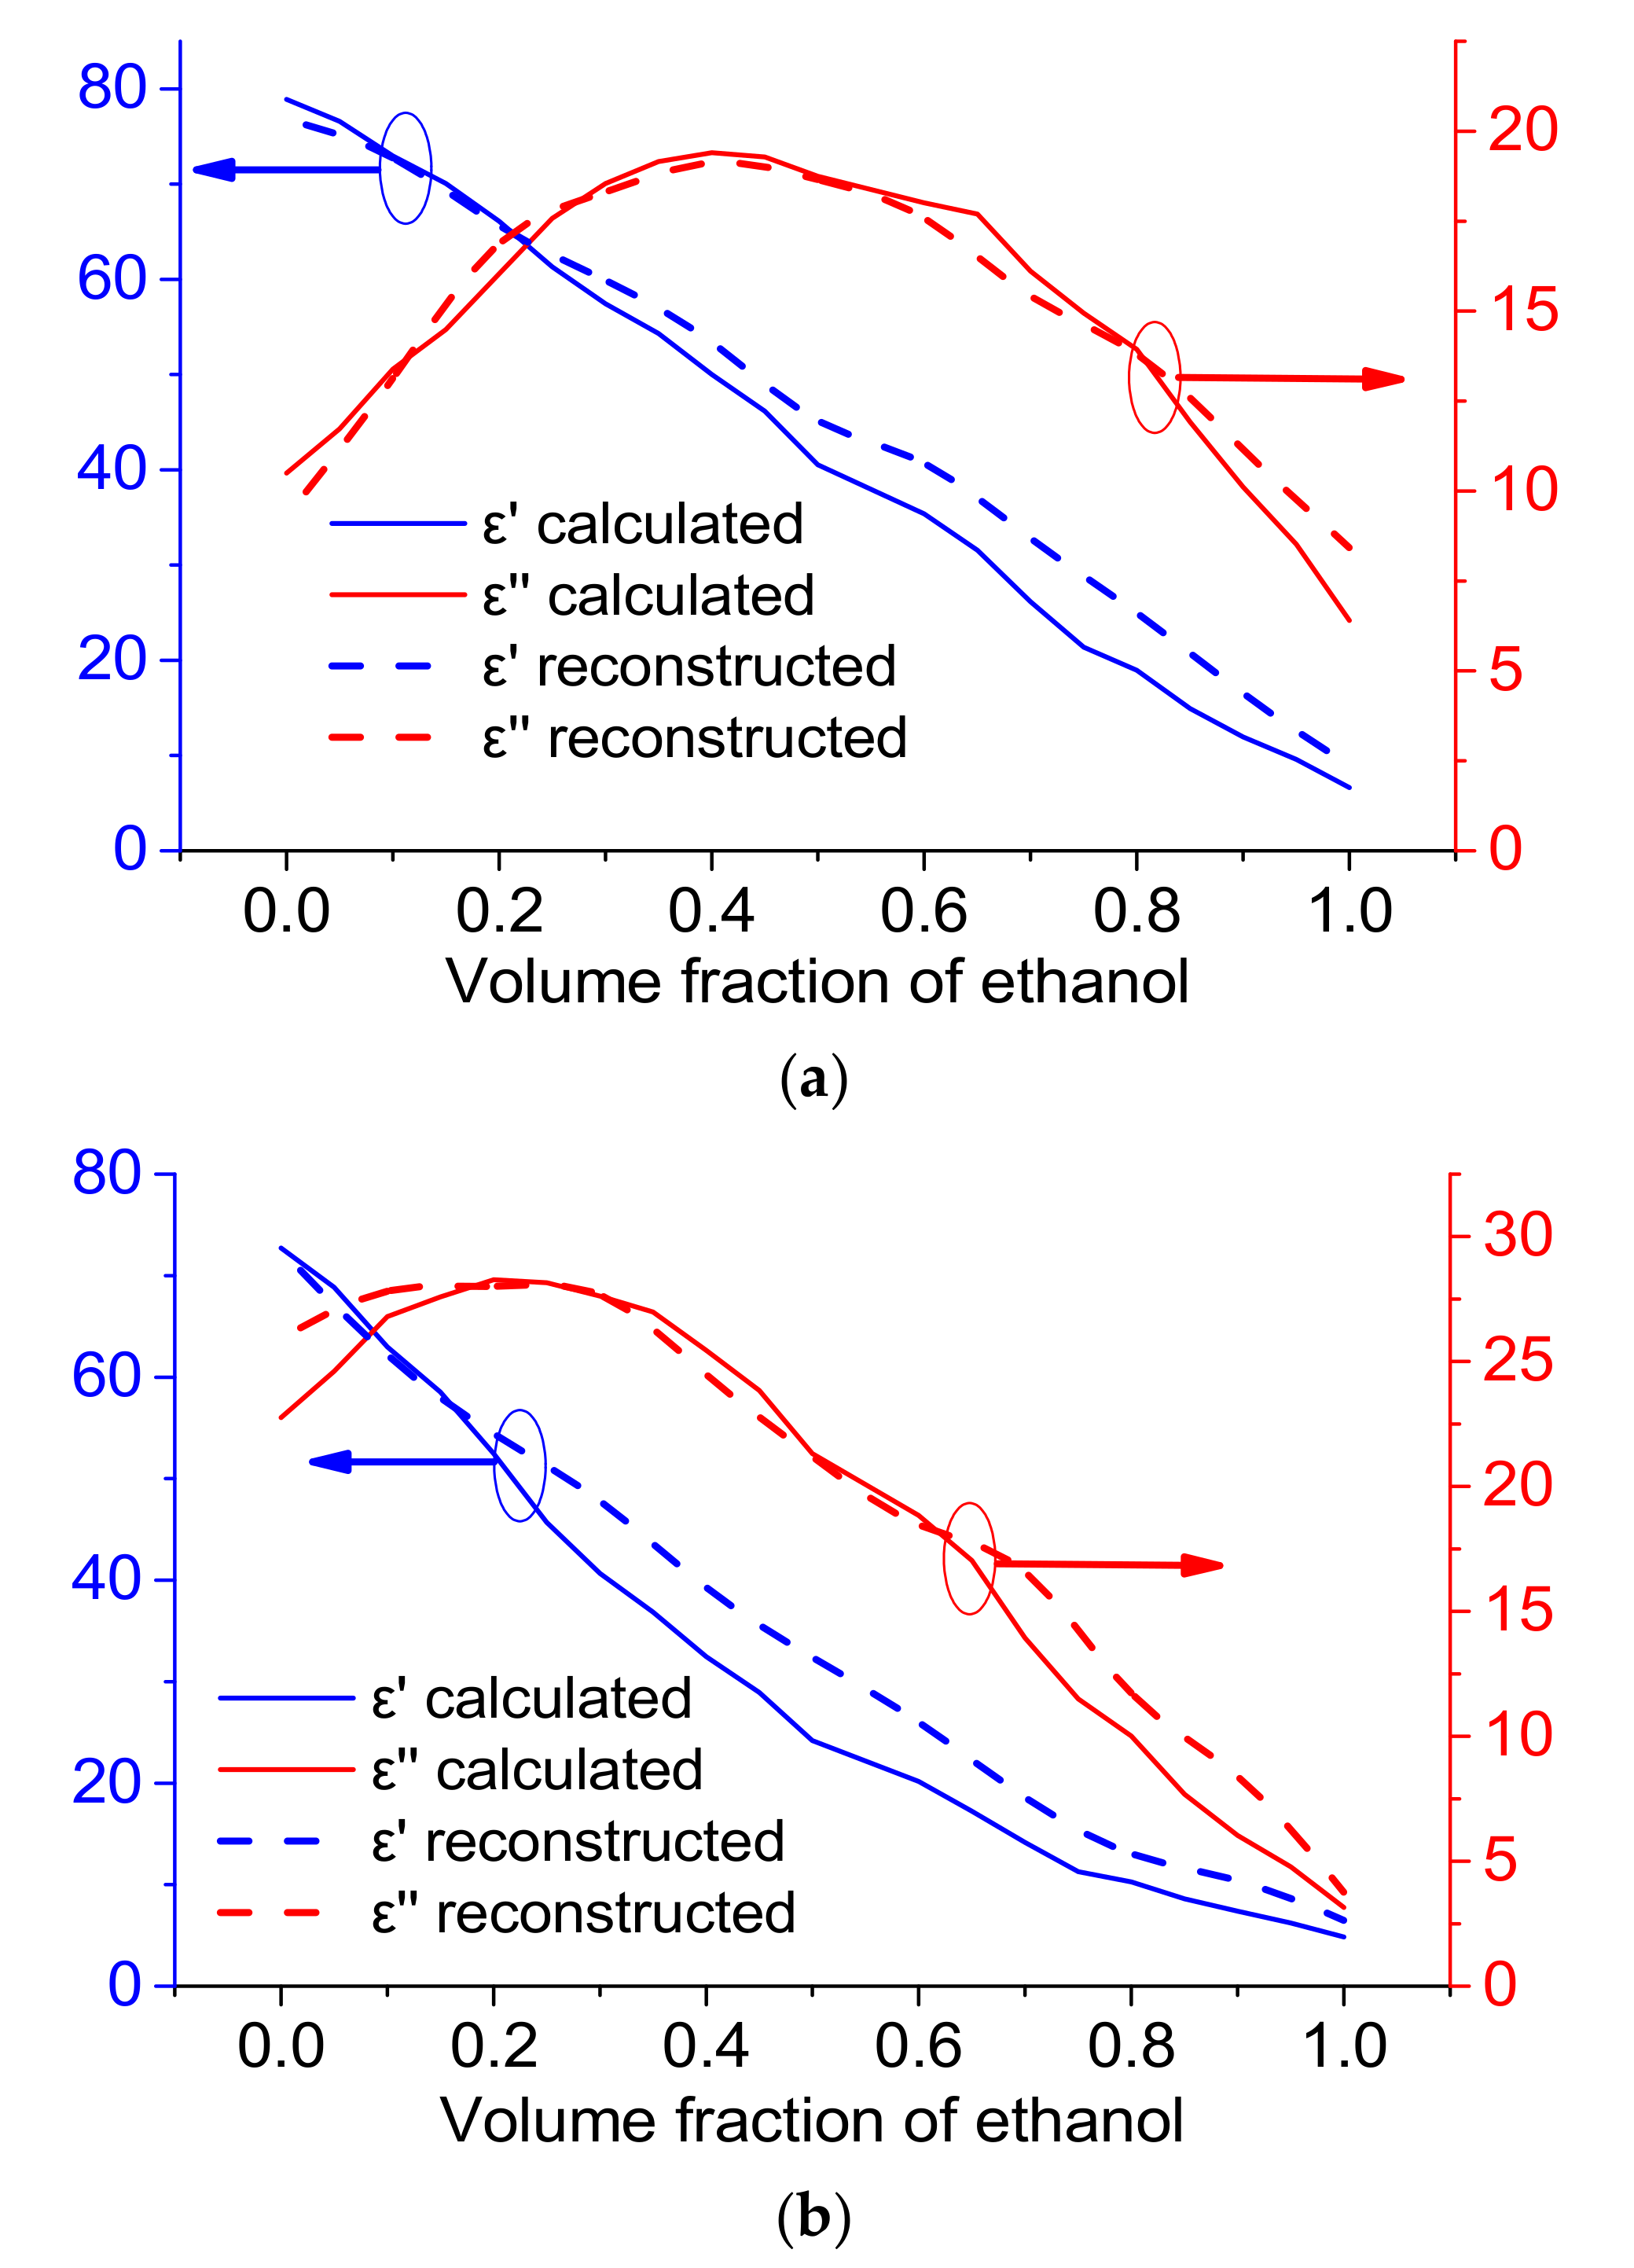
3.3. Reconstruction of Material Permittivity by the BP-ANN Algorithm

The training process is terminated when the training errors are less than a given value or the processes are converged. At this moment, the complex permittivity of the liquid under test can be determined from the BP-ANN whose weight matrixes are on a suitable state. We measured the S-parameters of the sensor at working frequencies to get the resonant frequencies and the unloaded quality factors of the sensor. The complex permittivity of the liquid under test is calculated in real-time when the measured resonant frequencies and unloaded quality factors are input into the trained BP-ANN, and the calculation speed from measured S parameters for obtaining the permittivity of the material under test is less than 3 s on a normal personal computer with 3 GHz CPU and 4 GB RAM.

4. Experimental Results

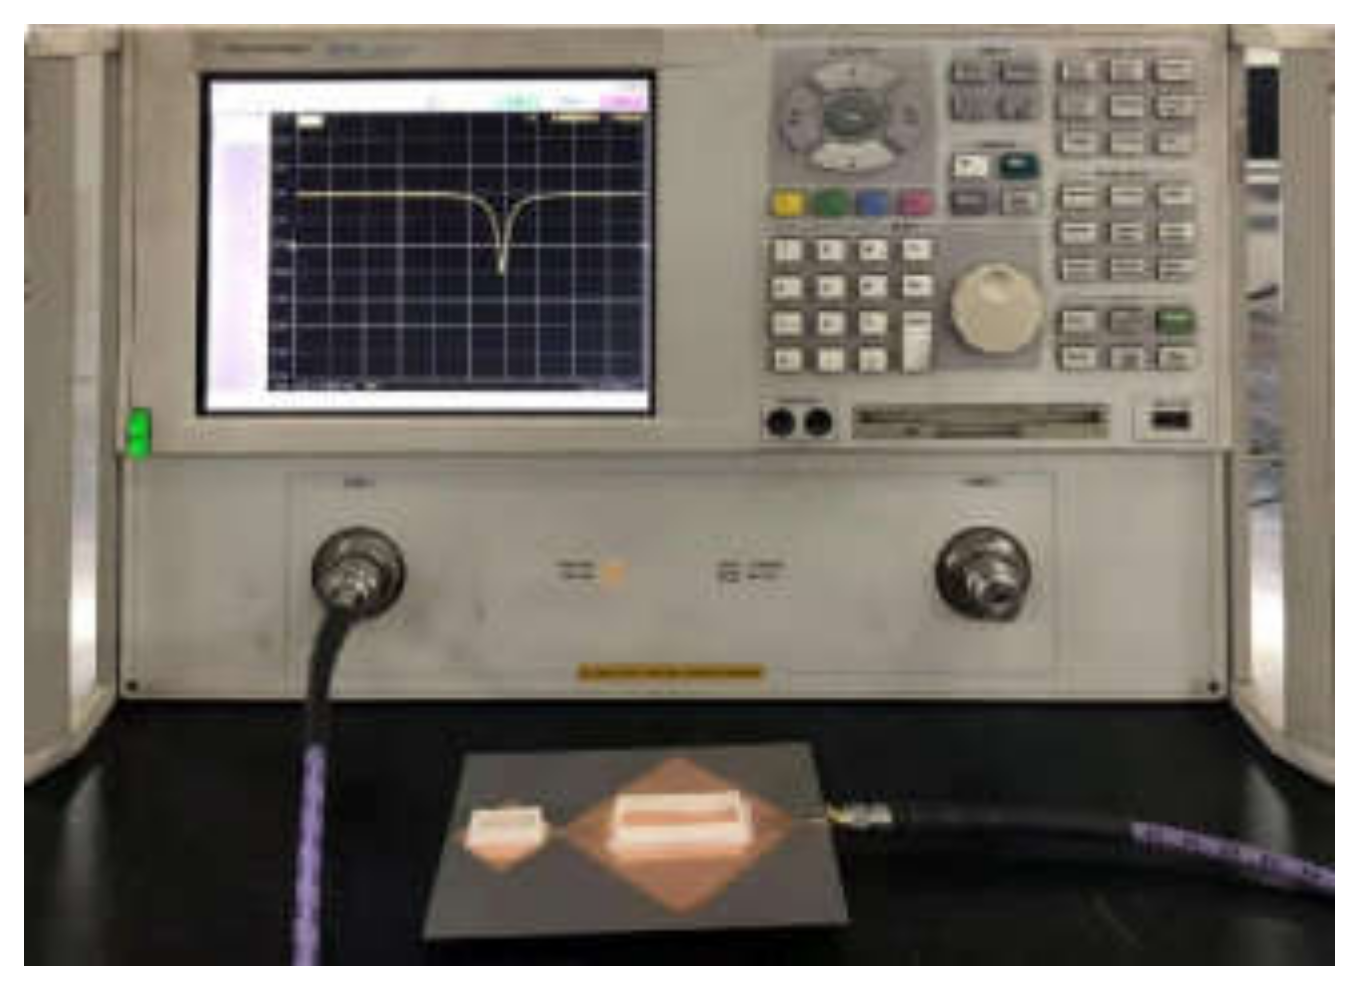
4.1. Measurement Process with the Proposed Sensor

The permittivity of ethanol–water mixtures for the entire concentration range in the frequency range from 500 MHz to 25 GHz is known [32]. Ethanol–water mixtures are used because the permittivities for the mixtures of solvents have calculated values, which are easy to compare with the measured values and to verify the accuracy of the measurements. Moreover, binary liquid mixtures of ethanol and water have a wide permittivity range, which means that they are suitable to be measurement standard templates. We measured ethanol–water mixtures with different molar fractions of ethanol, and the scattering parameters were recorded when the mixtures were put into the experimental system. We obtained the unloaded quality factors and resonant frequencies from the measured scattering parameters. We used a 5-mL measuring cylinder and a 20-mL glass beaker to prepare different concentrations of ethanol by mixing purified water at 20 °C. When measuring the |S11| of the sensor at working frequency, we dropped the prepared liquids into the frames. The measurement bandwidth and the number of sweeping points was 200 MHz and 1601, respectively. Before the next measurement with a different volume fraction of ethanol, we cleaned the sensor to reduce measurement errors. The measured results were obtained from an average of 10 measurements. The sensor was connected to an Agilent N5230A Vector Network Analyzer with a coaxial cable. We put the measured resonant frequencies and unloaded quality factors into the BP-ANN, which had been trained already. The complex permittivity can be quickly and accurately obtained from the BP-ANN.

4.2. Measurement Results with the Proposed Sensor

The room temperature and relative humidity were 20 °C and 70%, respectively, when the measurements were made. Figure 7 shows the reconstruction of the real and imaginary parts of the complex permittivity at working frequencies. They have good agreement with the calculated values according to the dielectric relaxation parameters of ethanol–water mixtures with different mole fractions in [32]. The relative errors of ε′ and ε″ were 1.98% and 1.28% at 2.45 GHz, and are 2.51% and 2.68% at 5.85 GHz, respectively. The results show that the SIW sensors can be used in permittivity measurements at 2.45 GHz and 5.8 GHz frequency bands. The average and standard deviation for each volume fraction of ethanol shown in Table 2.

5. Conclusions

In summary, the proposed dual-band SIW sensor with the BP-ANN algorithm was found to be able to accurately determine the complex permittivities of liquids in the ISM bands. A BP-ANN was trained from simulated data and applied to reconstructing the complex permittivities of liquids. The relative errors of ε′ and ε″ were 1.98% and 1.28% at 2.45 GHz, and were 2.51% and 2.68% at 5.85 GHz, respectively. The proposed sensor was able to realize real-time measurements of the permittivity, and the reconstruction time of obtaining material permittivities from measured S-parameters was less than 3 s. The proposed sensor, therefore, offers high sensitivity with a simple structural design, a fast-sensing response, and cost-effectiveness. In addition, the sensor can be used not only for liquids, but also for measuring the permittivity of solid powders. The solid powders can be placed in the area to be measured for permittivity measurements. The sensor can be integrated with other kinds of planar circuits or RF front-ends. It is low cost and with high sensitivity for dual-band permittivity measurements, and it could be applied to microwave chemistry industrial applications in the future.

Author Contributions

Q.C., Z.L. and C.L. developed the model, finished the experiment, and analyzed the data. Q.C. wrote the initial draft of the manuscript; Q.C., N.S. and C.L. reviewed and contributed to the final manuscript. All authors have read and agreed to the published version of the manuscript.

Funding

This work was supported in part by the National Natural Science Foundation of China (NSFC) under Grant 62071316 and the Sichuan Science and Technology Program (Grant No. 2020YFH0100, Grant No. 2021YFH0152).

Institutional Review Board Statement

Not applicable.

Informed Consent Statement

Not applicable.

Data Availability Statement

The data that support the findings of this study are available from the corresponding author upon reasonable request.

Conflicts of Interest

The authors declare no conflict of interest.

References

  1. Zhang, H.; Zeng, B.; Ao, L.; Zhang, W.; Li, N.; Guo, J. Printed four arcs coupler in cylindrical cavity for permittivity measurement. Electron. Lett. 2012, 48, 1460–1462. [Google Scholar] [CrossRef]
  2. Cheng, G. Calibration-independent measurement of complex permittivity of liquids using a coaxial transmission line. Rev. Sci. Instrum. 2015, 86, 014704. [Google Scholar]
  3. Shaforost, E.N.; Klein, N.; Vitusevich, S.A.; Barannik, A.A.; Cherpak, N.T. High sensitivity microwave characterization of organic molecule solutions of nanoliter volume. Appl. Phys. Lett. 2009, 94, 112901. [Google Scholar] [CrossRef]
  4. Su, L.; Mata-Contreras, J.; Vélez, P.V.; Fernández-Prieto, A.; Martín, F. Analytical method to estimate the complex permittivity of oil samples. Sensors 2018, 18, 984. [Google Scholar] [CrossRef] [PubMed] [Green Version]
  5. Booth, J.C.; Orloff, N.; Mateu, J.; Janezic, M.; Rinehart, M.; Beall, J.A. Quantitative Permittivity Measurements of Nanoliter Liquid Volumes in Microfluidic Channels to 40 GHz. IEEE Trans. Instrum. Meas. 2010, 59, 3279–3288. [Google Scholar] [CrossRef]
  6. Nyshadham, A.; Sibbald, C.L.; Stuchly, S.S. Permittivity Measurements using Open-Ended Sensors and Reference Liquid Calibration—An Uncertainty Analysis. IEEE Trans. Microw. Theory Tech. 1992, 40, 305–314. [Google Scholar] [CrossRef]
  7. Kaatze, U.; Feldman, Y. Broadband dielectric spectrometry of liquids and biosystems. Meas. Sci. Technol. 2005, 17, R17–R35. [Google Scholar] [CrossRef]
  8. Anon. Reaction Mechanisms. 2021. Available online: https://chem.libretexts.org/@go/page/1417 (accessed on 23 February 2022).
  9. Wille, U. Reaction mechanisms: Radical and radical ion reactions. Annu. Rep. Prog. Chem. Sect. B Org. Chem. 2012, 108, 228–250. [Google Scholar] [CrossRef]
  10. Mohd Bahar, A.A.; Zakaria, Z.; Md Arshad, M.K.; Isa, A.A.M.; Dasril, Y.; Alahnomi, R.A. Real Time Microwave Biochemical Sensor Based on Circular SIW Approach for Aqueous Dielectric Detection. Sci. Rep. 2019, 9, 184–188. [Google Scholar] [CrossRef]
  11. Hong, J.S.; Vogt, S.; Schneider, M. Dielectric Permittivity Determination in W-Band with Dielectric Ring Resonators. In Proceedings of the 2016 German Microwave Conference (GeMiC), Bochum, Germany, 14–16 March 2016; pp. 453–456. [Google Scholar]
  12. Watts, C.; Hanham, S.M.; Ahmad, M.M.; Adabi, M.; Klein, N. Coupled dielectric-split ring microwave resonator for liquid measurements in microfluidic channels at nanoliter volumes. In Proceedings of the 46th European Microwave Conference (EuMC), London, UK, 4–6 October 2016; pp. 257–260. [Google Scholar]
  13. Bahar, A.M.; Zakaria, Z.; Isa, A.A.M.; Ruslan, E.; Alahnomi, R.A. Current developments of material characterization using microwave resonator based sensors: A review. Int. J. Appl. Eng. Res. 2015, 10, 34416–34419. [Google Scholar]
  14. Lee, C.S.; Yang, C.L. Complementary split-ring resonators for measuring dielectric constants and loss tangents. IEEE Microw. Wirel. Compon. Lett. 2014, 24, 563–565. [Google Scholar] [CrossRef]
  15. Chretiennot, T.; Dubuc, D.; Grenier, K. A Microwave and microfluidic planar resonator for efficient and accurate complex permittivity characterization of aqueous solutions. IEEE Trans. Microw. Theory Tech. 2013, 61, 972–978. [Google Scholar] [CrossRef] [Green Version]
  16. Boybay, M.S.; Ramahi, O.M. Material characterization using complementary split-ring resonators. IEEE Trans. Instrum. Meas. 2012, 61, 3039–3046. [Google Scholar] [CrossRef]
  17. Javed, A.; Arif, A.; Zubair, M.; Mehmood, M.Q.; Riaz, K. A Low-Cost Multiple Complementary Split-Ring Resonator Based Microwave Sensor for Contactless Dielectric Characterization of Liquids. IEEE Sens. 2020, 20, 11326–11334. [Google Scholar] [CrossRef]
  18. Iqbal, A.; Smida, A.; Saraereh, O.A.; Alsafasfeh, Q.H.; Mallat, N.K.; Lee, B.M. Cylindrical Dielectric Resonator Antenna-Based Sensors for Liquid Chemical Detection. Sensors 2019, 19, 1200. [Google Scholar] [CrossRef] [Green Version]
  19. Hao, H.; Wang, D.; Wang, Z. Design of Substrate-Integrated Waveguide Loading Multiple Complementary Open Resonant Rings (CSRRs) for Dielectric Constant Measurement. Sensors 2020, 20, 857. [Google Scholar] [CrossRef] [Green Version]
  20. Chuma, E.L.; Iano, Y.; Fontgalland, G.; Roger, L.L.B. Microwave Sensor for Liquid Dielectric Characterization Based on Metamaterial Complementary Split Ring Resonator. IEEE Sens. J. 2018, 18, 9978–9983. [Google Scholar] [CrossRef]
  21. Fesharaki, F.; Akyel, C.; Wu, K. Broadband permittivity measurement of dielectric materials using discontinuity in substrate integrated waveguide. Electron. Lett. 2013, 49, 194–196. [Google Scholar] [CrossRef]
  22. Loconsole, A.M.; Francione, V.V.; Portosi, V.; Losito, O.; Catalano, M.; di Nisio, A.; Attivissimo, F.; Prudenzano, F. Substrate-Integrated Waveguide Microwave Sensor for Water-in-Diesel Fuel Applications. Appl. Sci. 2021, 11, 10454. [Google Scholar] [CrossRef]
  23. Liu, C.; Tong, F. An SIW resonator sensor for liquid permittivity measurements at C band. IEEE Microw. Wirel. Compon. Lett. 2015, 25, 751–753. [Google Scholar]
  24. Zhou, H.; Hu, D.; Yang, C.; Chen, C.; Ji, J.; Chen, M.; Chen, Y.; Yang, Y.; Mu, X. Multi-Band Sensing for Dielectric Property of Chemicals Using Metamaterial Integrated Microfluidic Sensor. Sci. Rep. 2018, 8, 14801. [Google Scholar] [CrossRef] [Green Version]
  25. Chen, Q.; Huang, K.-M.; Yang, X.; Luo, M.; Zhu, H. An artificial nerve network realization in the measurement of material permittivity. Prog. Electromagn. Res. 2011, 116, 347–361. [Google Scholar] [CrossRef] [Green Version]
  26. Asteris, P.G.; Mokos, V.G. Concrete compressive strength using artificial neural networks. Neural Comput. Appl. 2020, 32, 11807–11826. [Google Scholar] [CrossRef]
  27. Li, S.; Wang, S.; Xie, D. Research on radar clutter recognition method based on LSTM. J. Eng. 2019, 19, 6247–6251. [Google Scholar]
  28. Chen, Q.; Huang, K.; Zeng, X.; Liu, C. Note: Coaxial apparatus to measure the permittivities of chemical solutions at microwave frequencies. Rev. Sci. Instrum. 2017, 88, 046102. [Google Scholar] [CrossRef]
  29. Meng, Z.; Wu, Z.; Gray, J. Microwave sensor technologies for food evaluation and analysis: Methods, challenges and solutions. Trans. Inst. Meas. Control 2018, 40, 3433–3448. [Google Scholar] [CrossRef] [Green Version]
  30. Xu, F.; Wu, K. Guided-wave and leakage characteristics of substrate integrated waveguide. IEEE Trans. Microw. Theory Tech. 2005, 53, 66–73. [Google Scholar]
  31. Kwok, R.; Liang, J.-F. Characterization of high-Q resonators for microwave filter applications. IEEE Trans. Microw. Theory Tech. 1999, 47, 111–114. [Google Scholar] [CrossRef]
  32. Sato, T.; Chiba, A.; Nozaki, R. Dynamical aspects of mixing schemes in ethanol–water mixtures in terms of the excess partial molar activation free energy enthalpy and entropy of the dielectric relaxation process. J. Chem. Phys. 1999, 110, 2508–2521. [Google Scholar] [CrossRef]
Figure 1. Structure of the SIW resonators.
Processes 10 00708 g001
Figure 2. Distribution of electric field of the proposed SIW at (a) 2.45 GHz and (b) 5.85 GHz.
Processes 10 00708 g002aProcesses 10 00708 g002b
Figure 3. Measured and simulated |S11| of the SIW resonator, (a) 2.45 GHz, (b) 5.85 GHz.
Processes 10 00708 g003aProcesses 10 00708 g003b
Figure 4. The fabricated SIW resonator sensor.
Processes 10 00708 g004
Figure 5. The measurement system.
Processes 10 00708 g005
Figure 6. Structure of the BP.
Processes 10 00708 g006
Figure 7. Reconstructed complex permittivity (real and imaginary parts) with respect to the volume fraction of ethanol from 0% to 100%, (a) 2.45 GHz, (b) 5.85 GHz.
Processes 10 00708 g007
Table 1. Measurement and simulated resonant characteristics.
Low Working FrequencyHigh Working Frequency
f0/GHzQf0/GHzQ
Simulation2.4417301.55.8415324.3
Measurement2.4414319.25.8412317.9
Table 2. Measured permittivities with average and standard deviation.
Volume
Fraction of Ethanol
2.45 GHz5.85 GHz
ε′ Averageε′ Standard Deviationε″ Averageε″ Standard Deviationε′ Averageε′ Standard Deviationε″ Averageε″ Standard Deviation
0%77.341.9110.381.4772.521.9923.311.65
10%71.601.6513.230.9561.621.7327.491.56
20%64.831.8416.211.2553.111.5627.841.47
30%56.521.5618.351.4041.461.6528.261.65
40%50.901.9219.591.5633.041.4724.811.32
50%41.201.3918.641.2224.711.3921.221.47
60%36.091.2517.791.3220.681.1318.401.32
70%26.671.4815.921.0414.441.3014.311.18
80%19.251.3514.120.8710.481.1410.271.08
90%12.101.0410.230.367.550.966.160.98
100%6.760.876.470.444.960.873.230.78
Publisher’s Note: MDPI stays neutral with regard to jurisdictional claims in published maps and institutional affiliations.

