
Research on Decision Making of Design for Coupling System Based on Complexity Composite


Abstract
:1. Introduction
2. Theoretical Foundations
2.1. DCC Theory
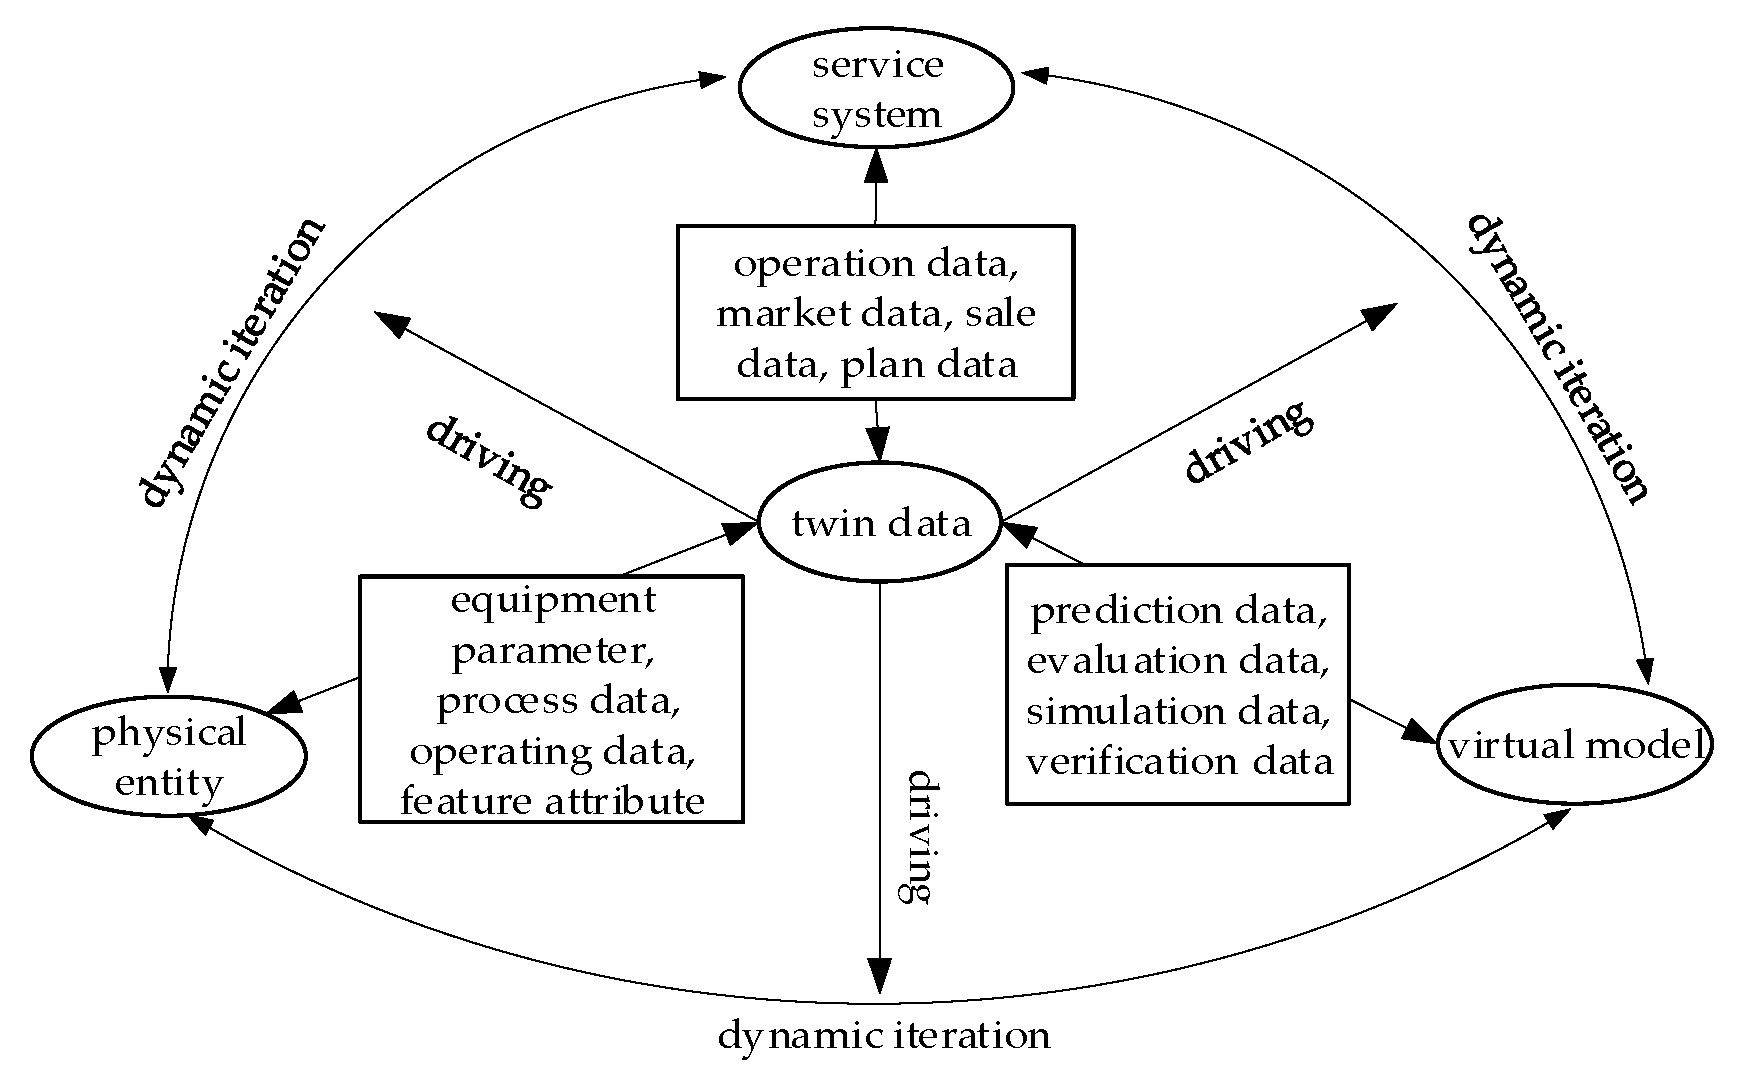
2.2. Digital Twins
2.3. Data-Driven Modeling Based on BP Neural Network
3. Composite Paradigm of Complexity
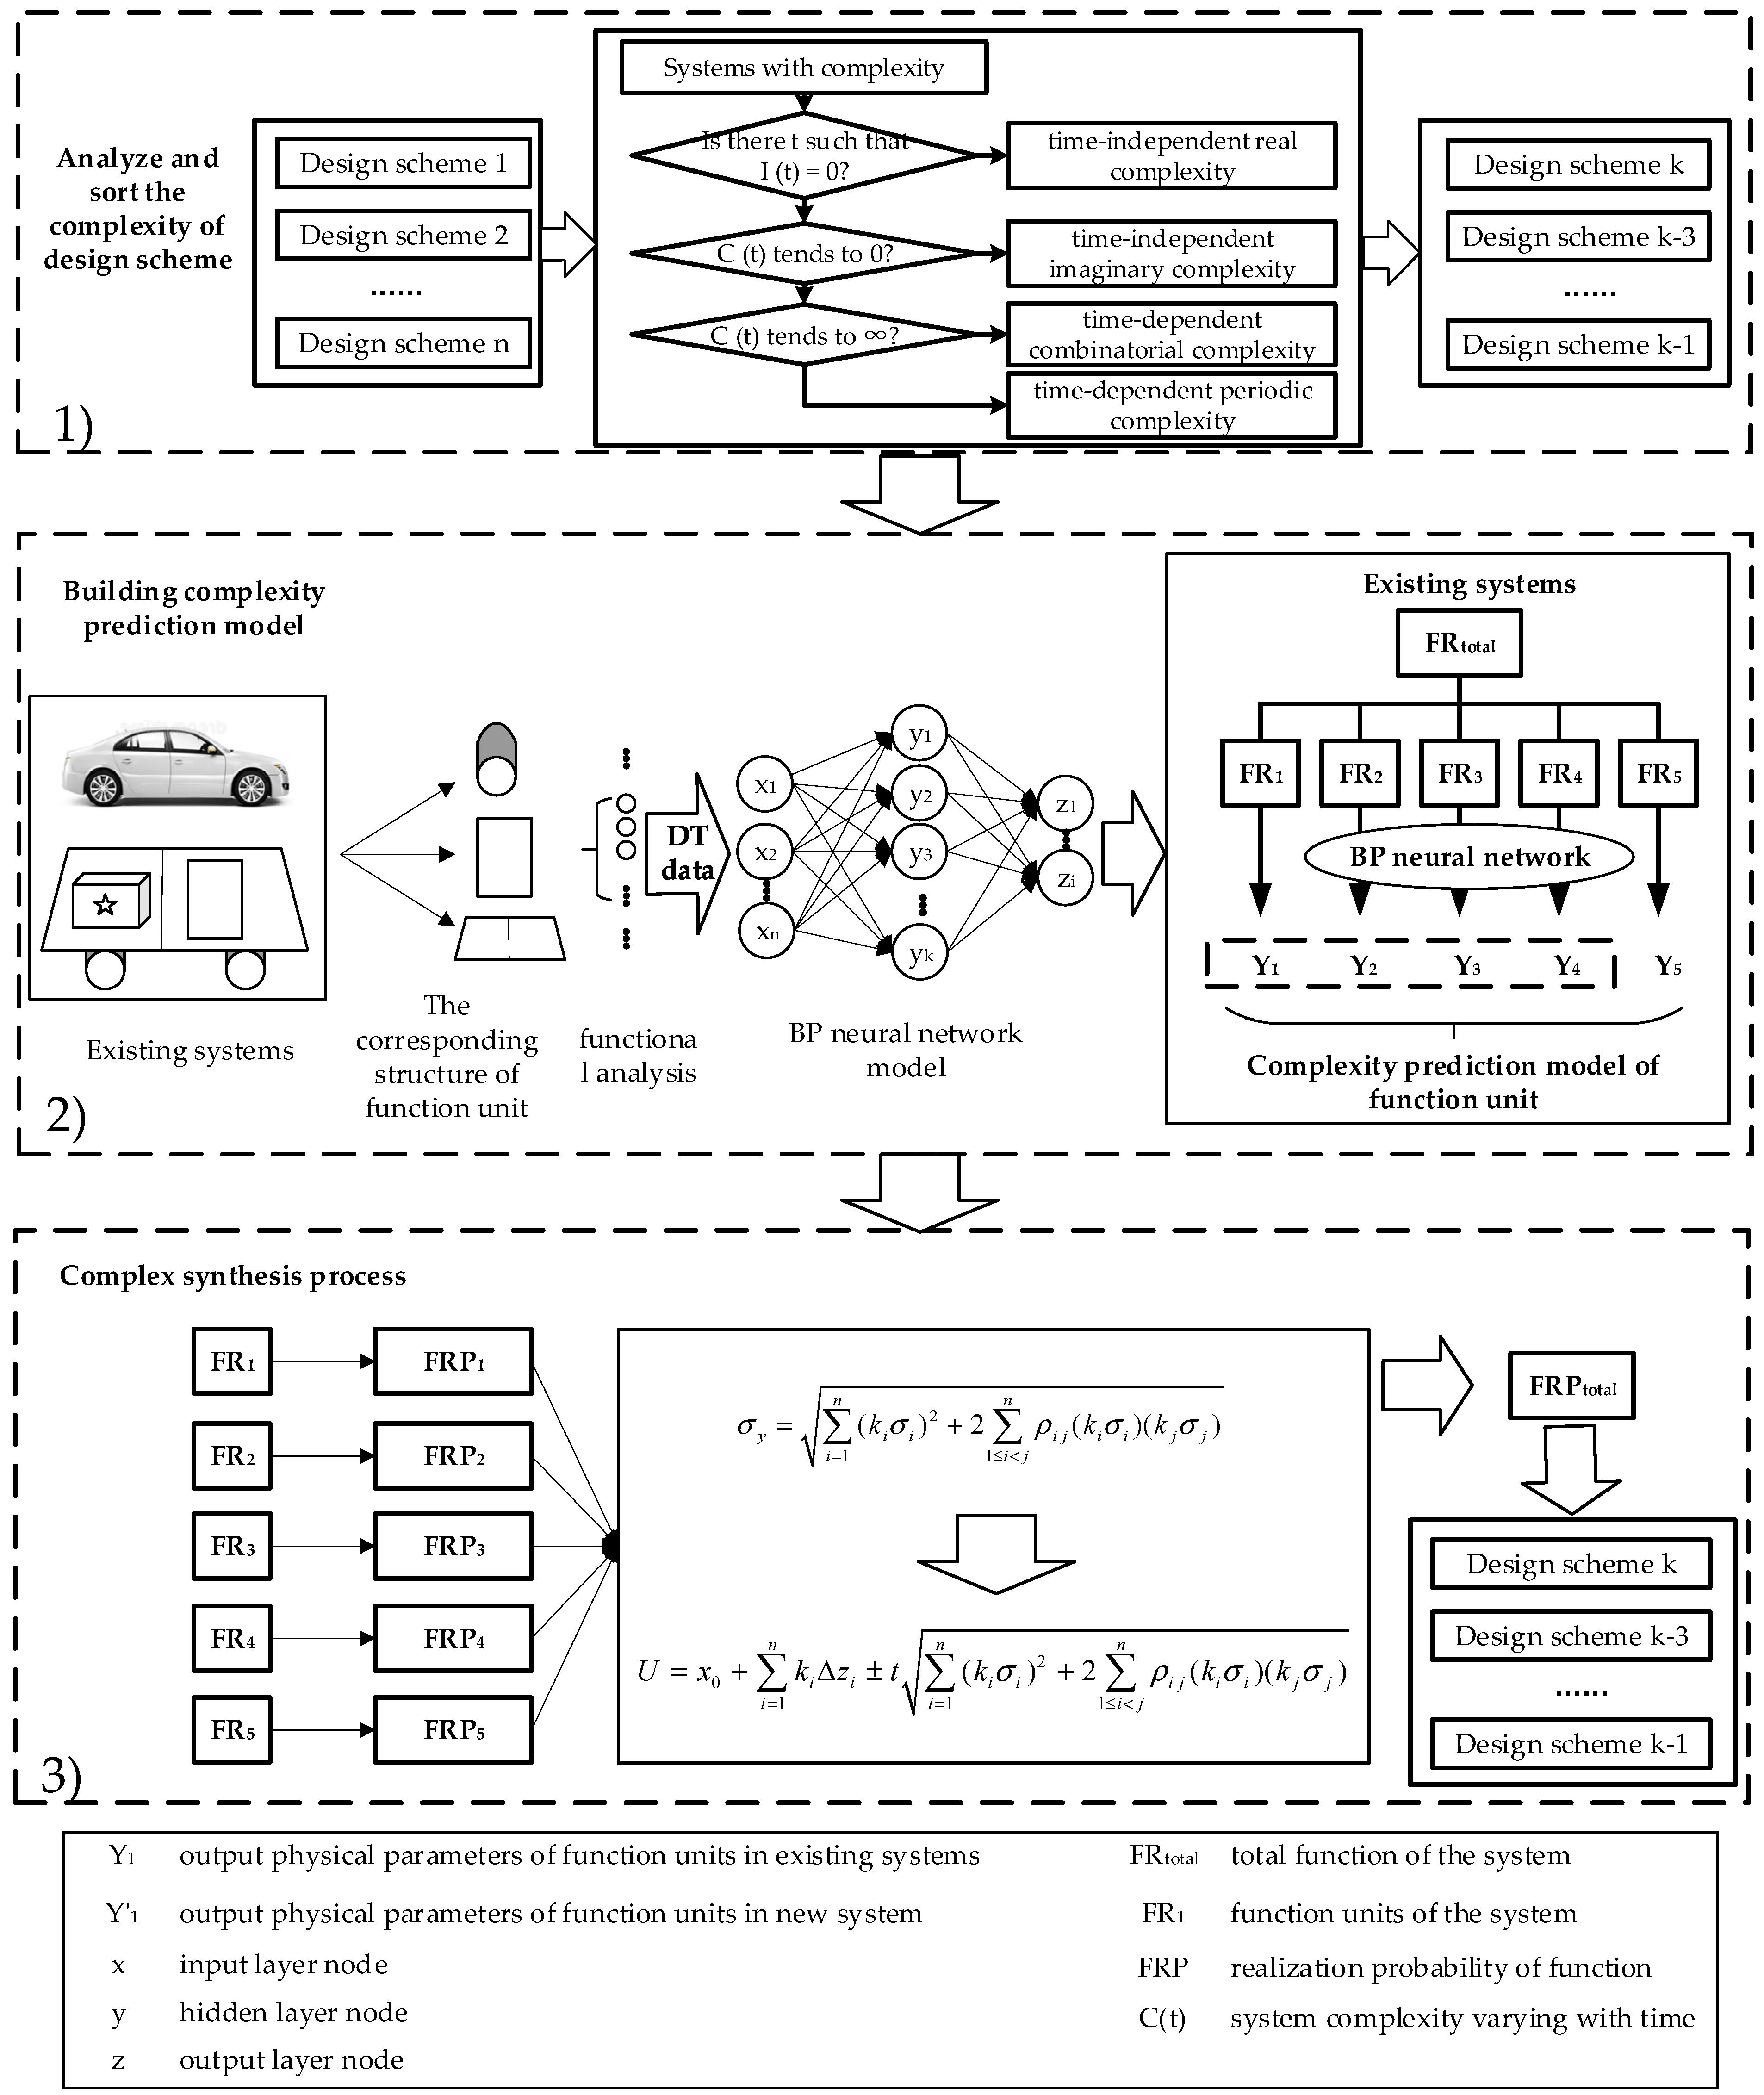
3.1. Design Scheme Sorting Principle
- Time-dependent complexity should be excluded as much as possible in the improved design scheme.
- The functional structure of the previous generation system should be changed as little as possible.
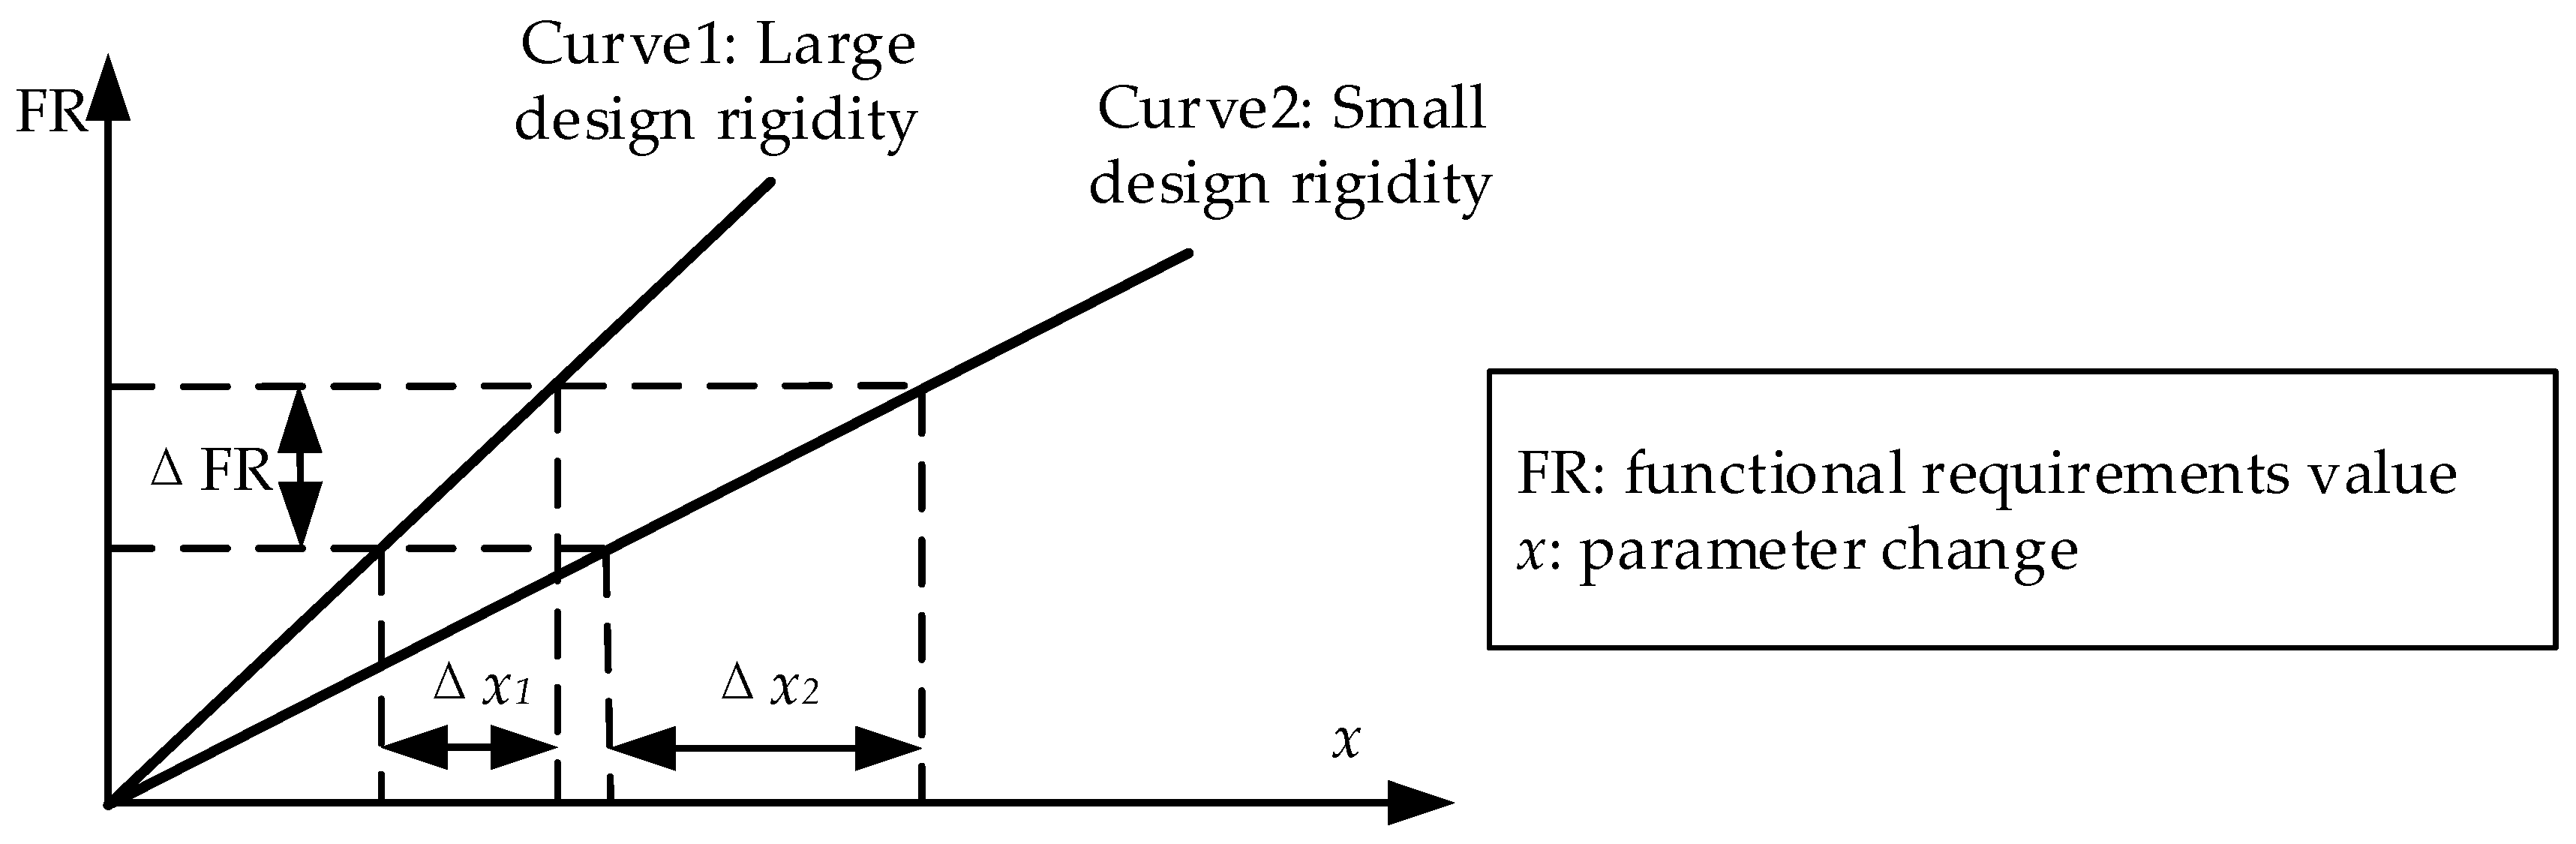
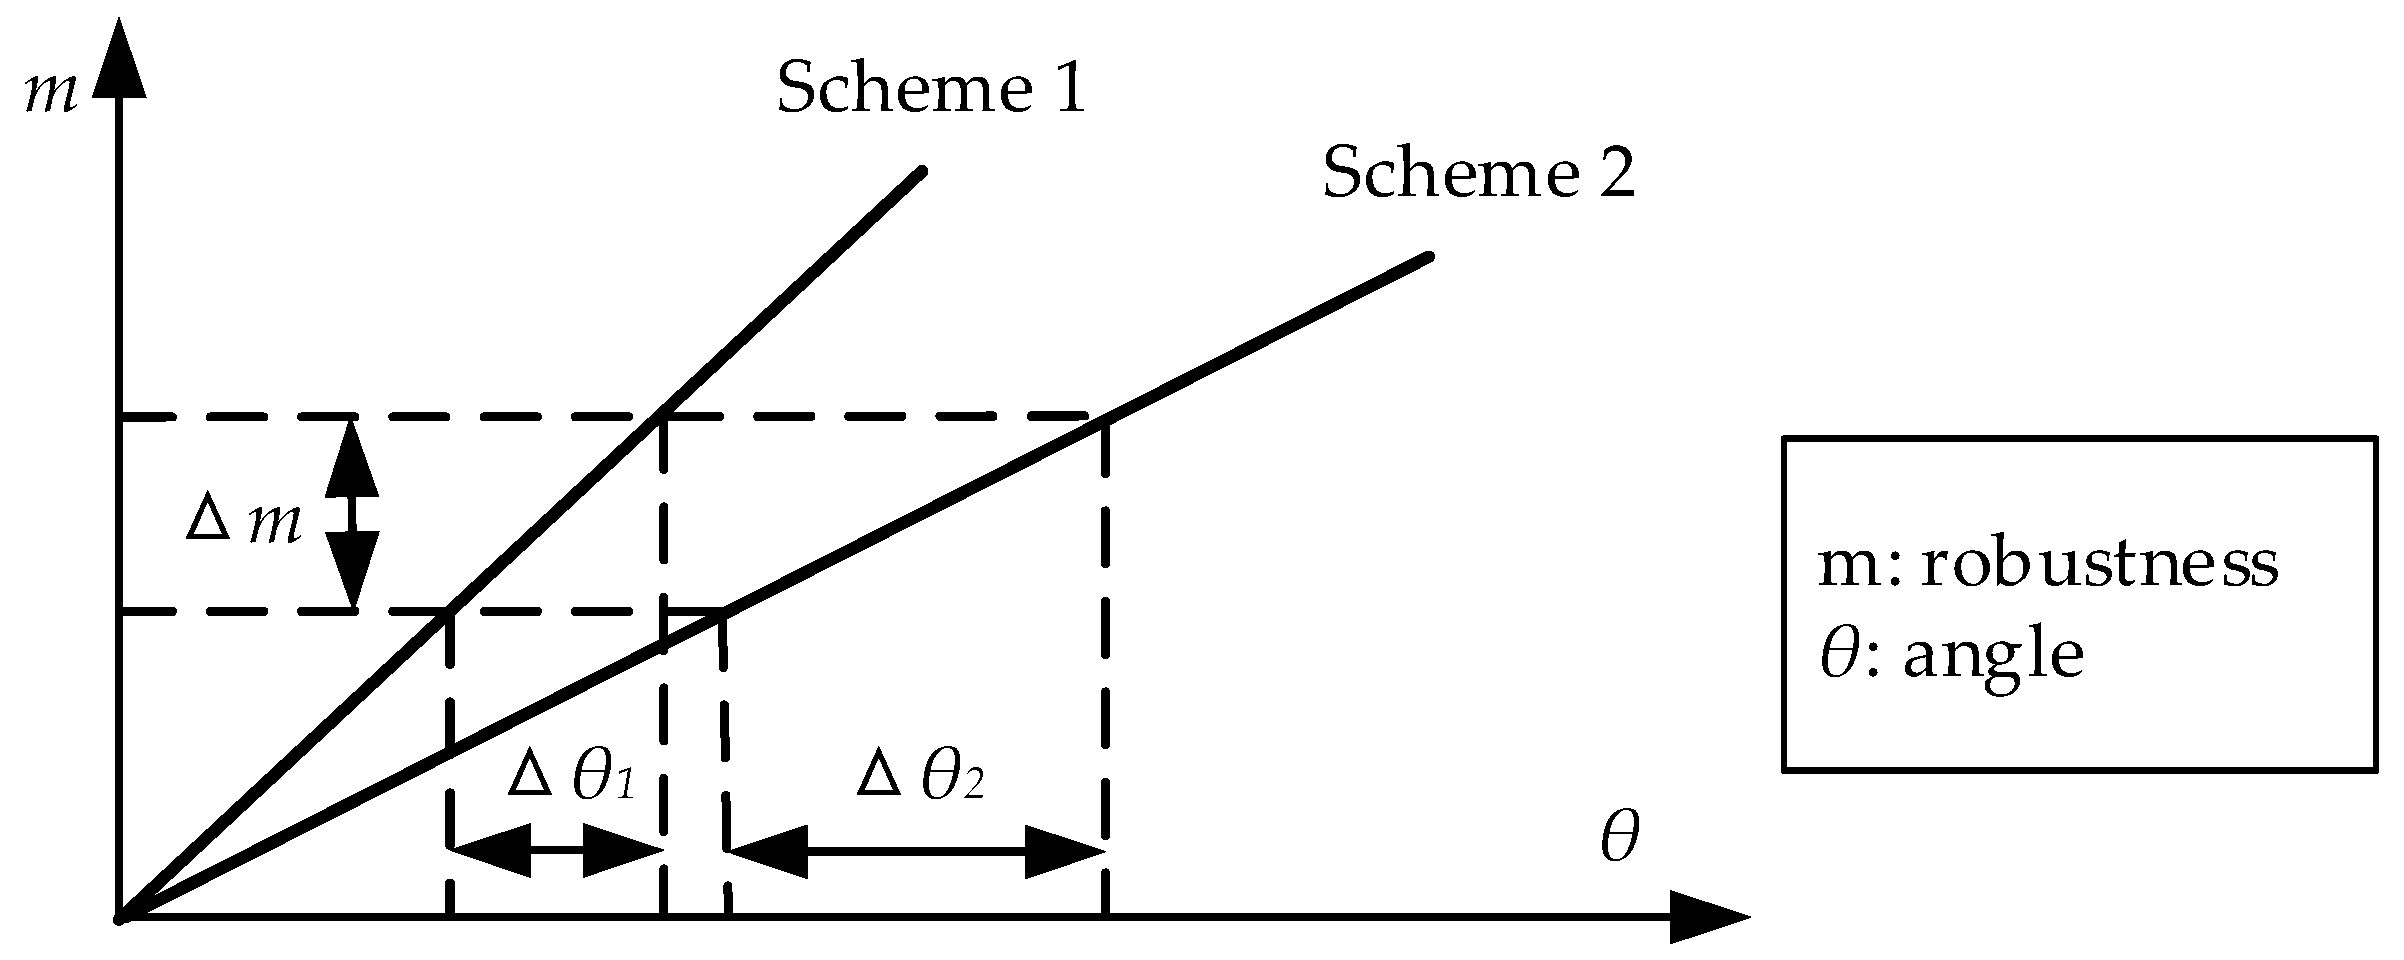
- The design of DP must consider three aspects of information content: the robustness, signal-to-noise ratio, and response rate.
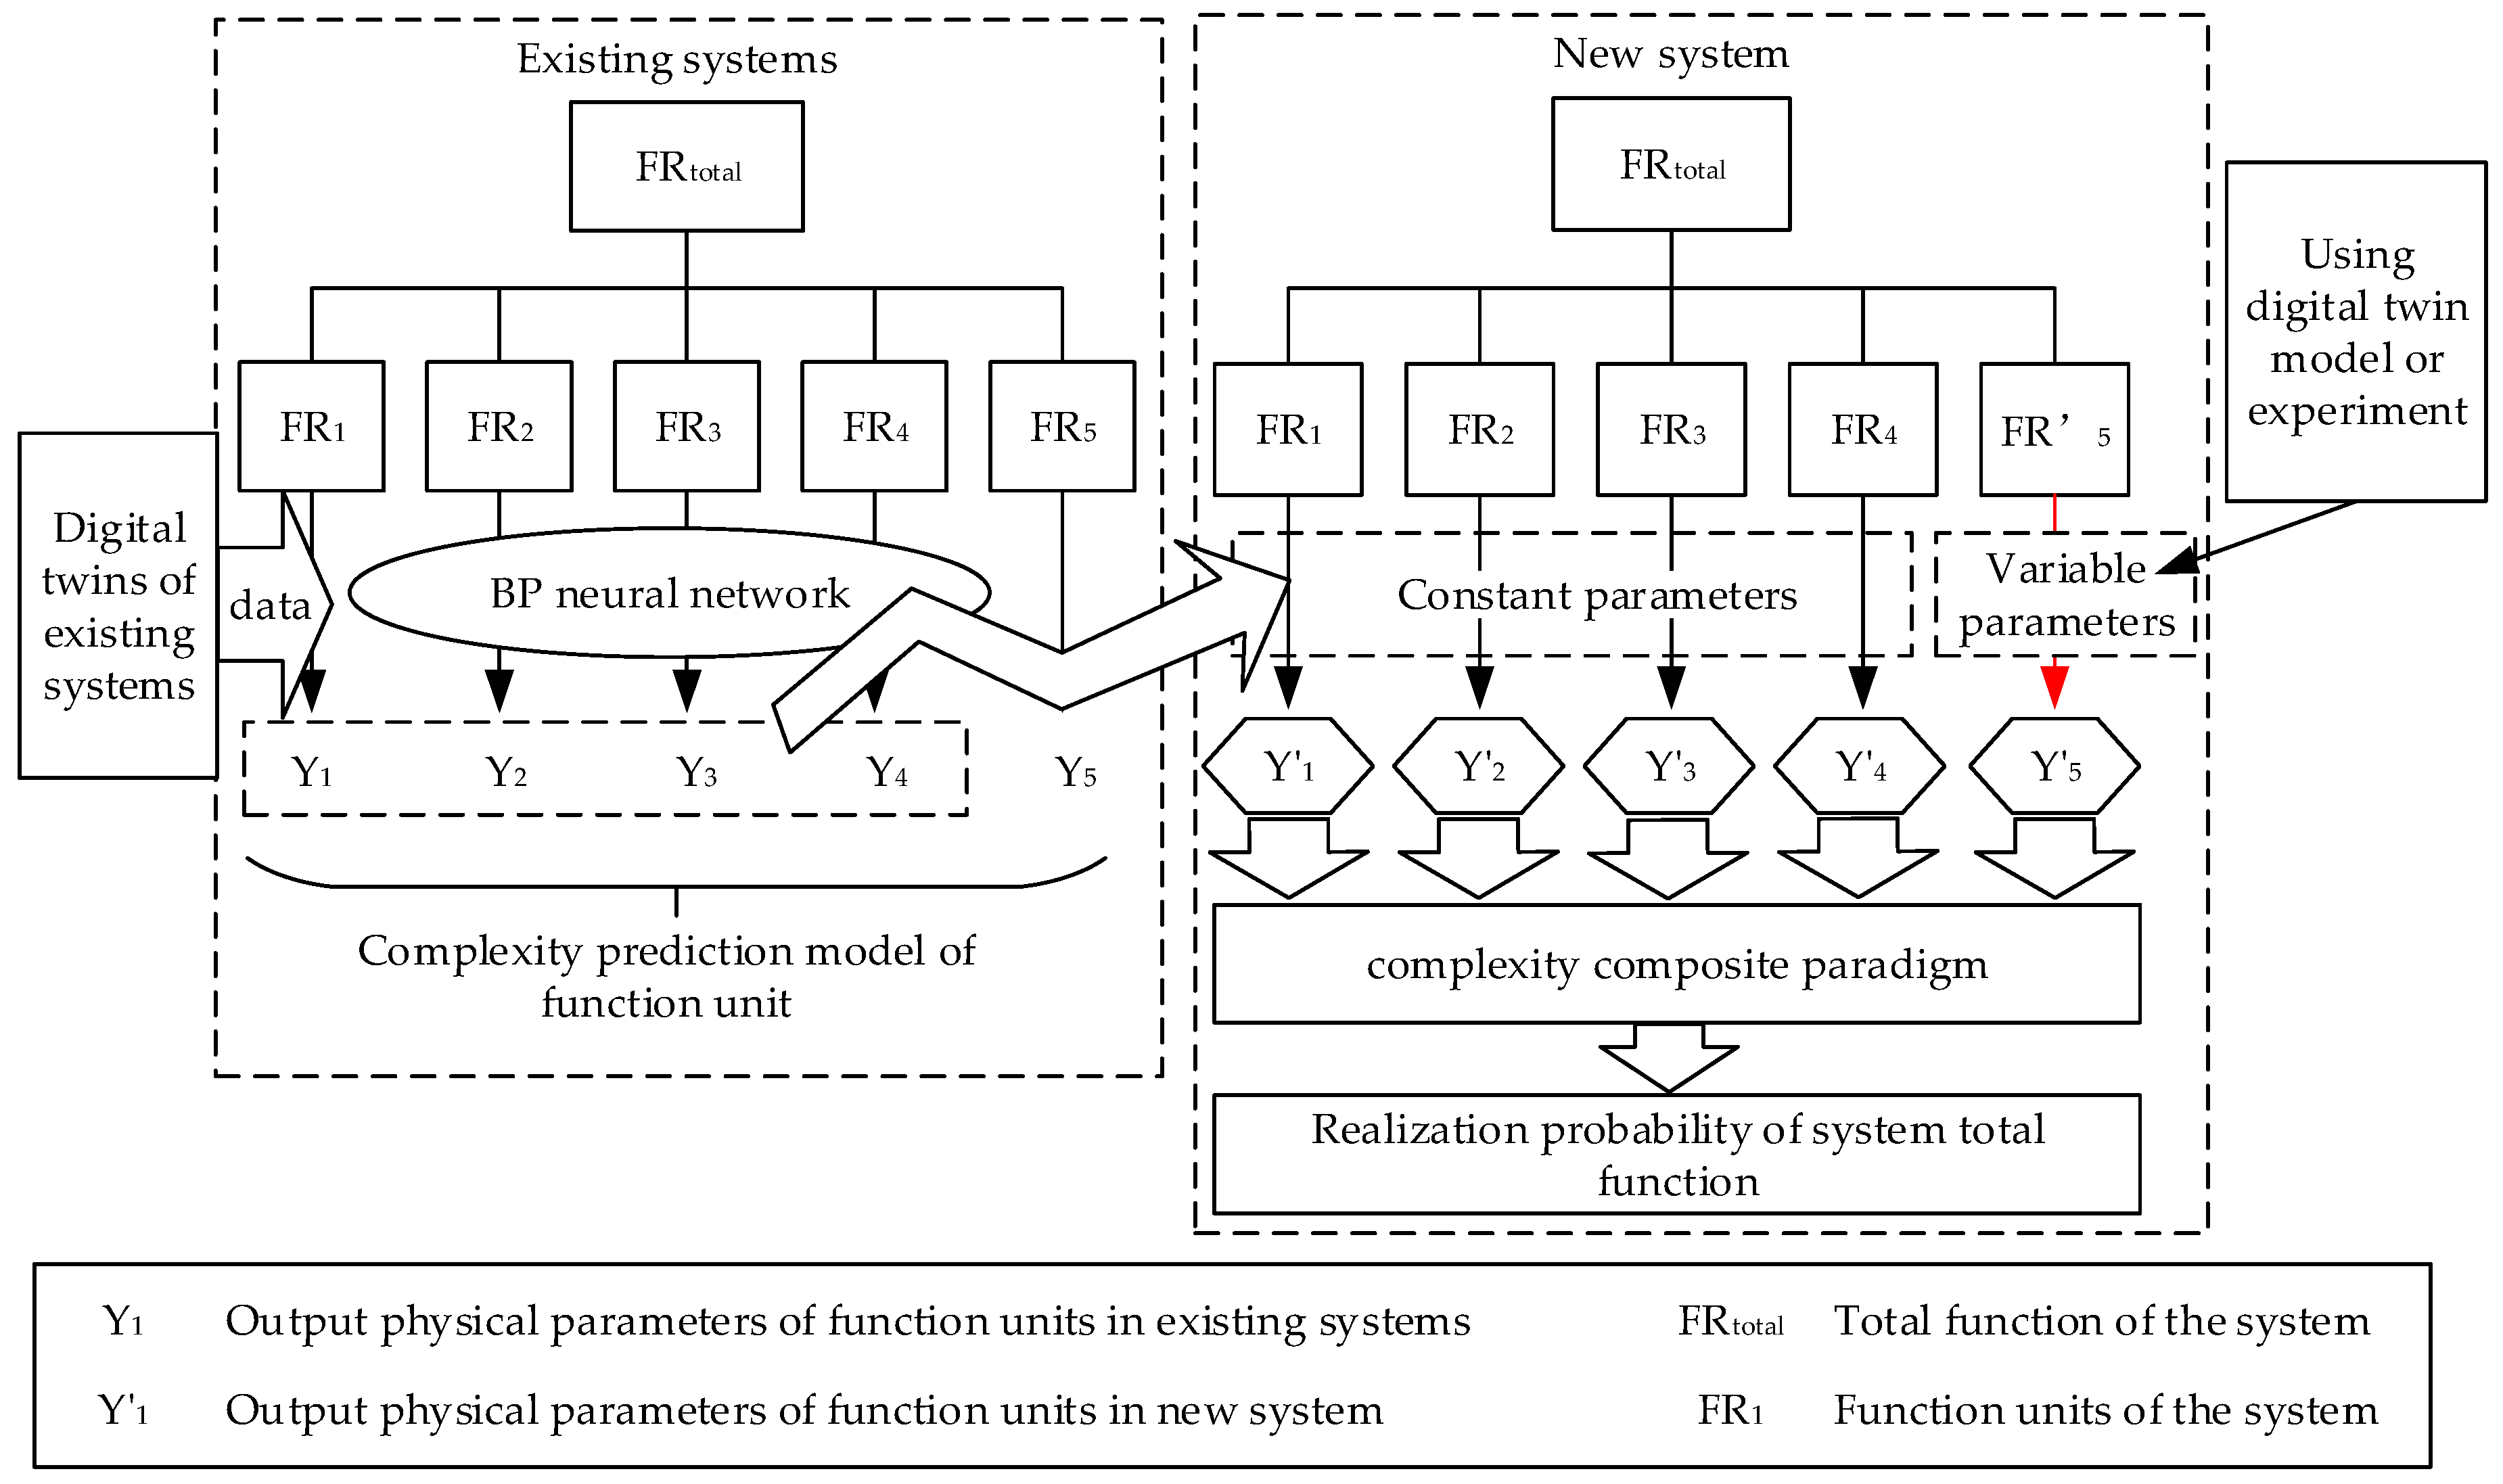
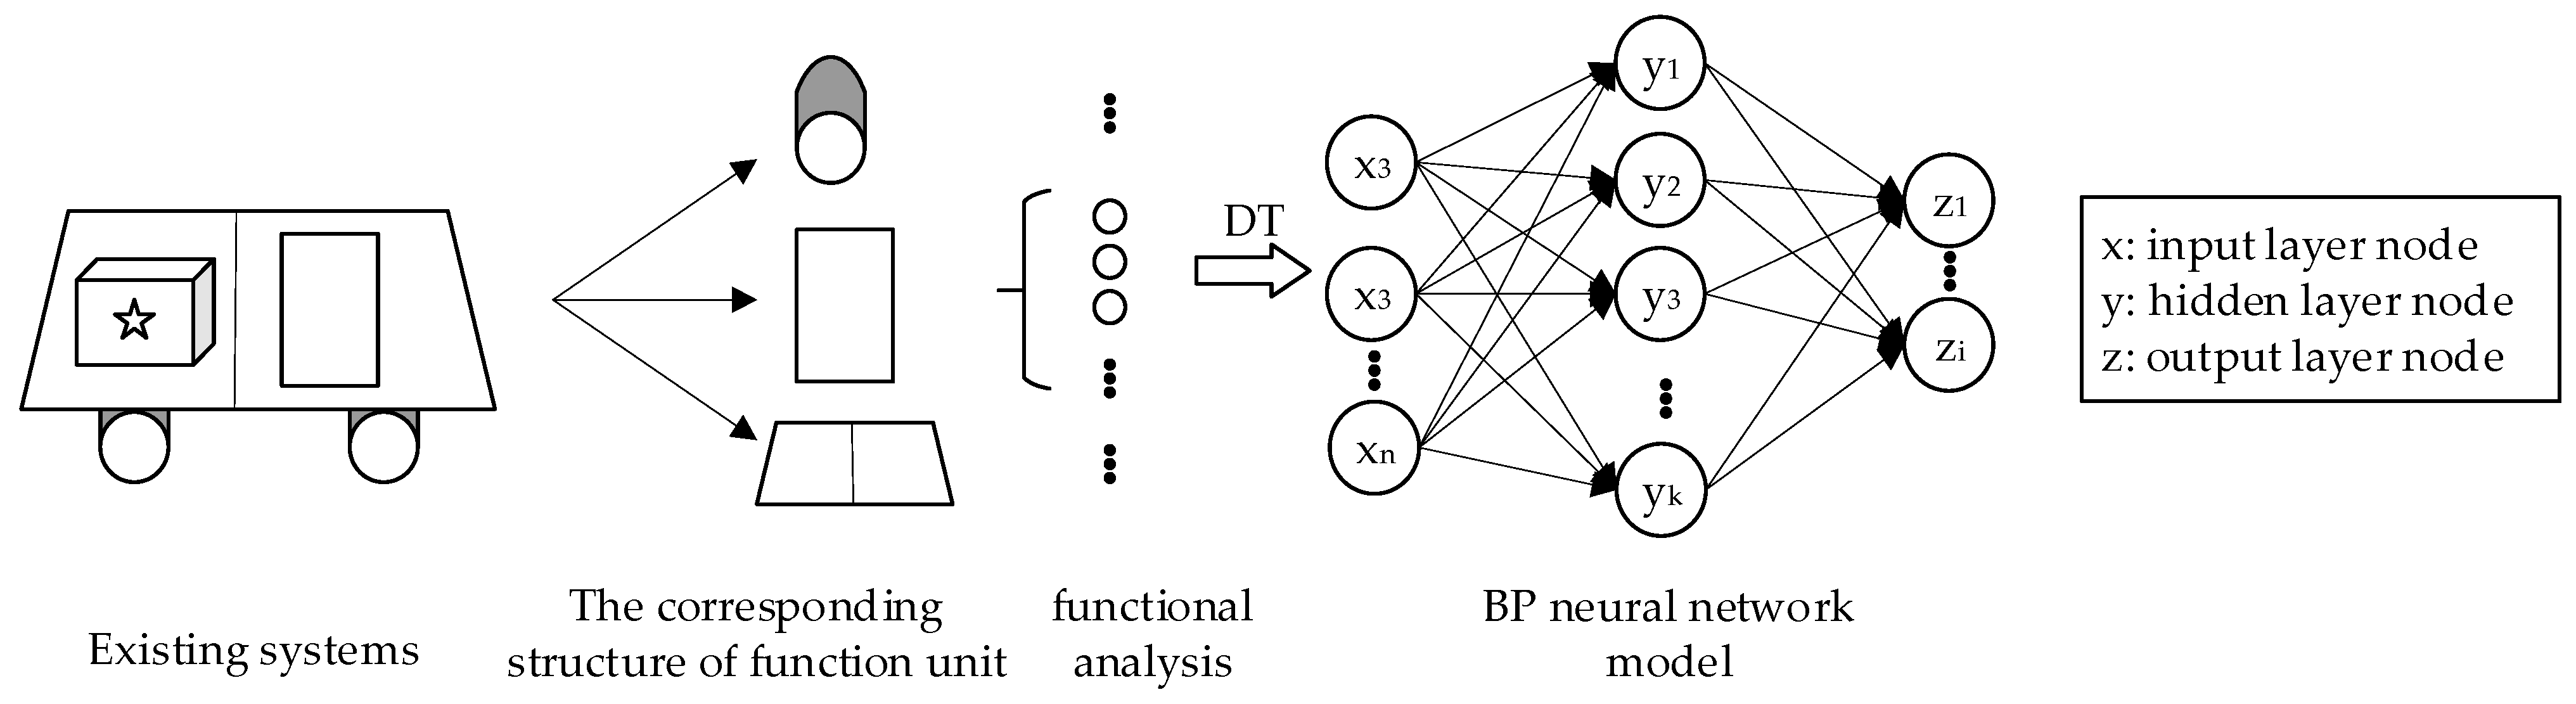
3.2. Complexity Prediction Model of Function Unit
- Firstly, the function of the existing systems is analyzed, and the corresponding components are determined in the function model according to the function units determined by the function structure.
- Then, physical parameters corresponding to the function units of the system range-related function units are extracted.
- Relevant twin data are obtained from the digital twin model of the previous generation systems, and the corresponding characteristics are obtained by using these twin data. These features are combined into the input as the training set and the corresponding features of the new system as the test set.
- The nonlinear relationship between and is established by the BP neural network.
- The structure does not change;
- The structure changes, but only the values of physical parameters;
- The structure changes, and the attributes of the physical parameters also change, but the original understanding does not change;
- The principle solution changes.
3.3. Composite Paradigm of Total Functional Complexity
4. A Decision-Making Method of Design for Coupling System Based on Complexity Composite
5. Engineering Example
5.1. Case Background
- the device is supposed to be easy and simple enough to handle the proportion of different forms of traditional Chinese medicine;
- the dispensing channel needs to be improved to enhance the efficiency of dispensing;
- the existing device needs to be improved on the premise of reducing the cost as much as possible.
5.2. Decision-Making Process of the Bulk TCM Dispensing Device
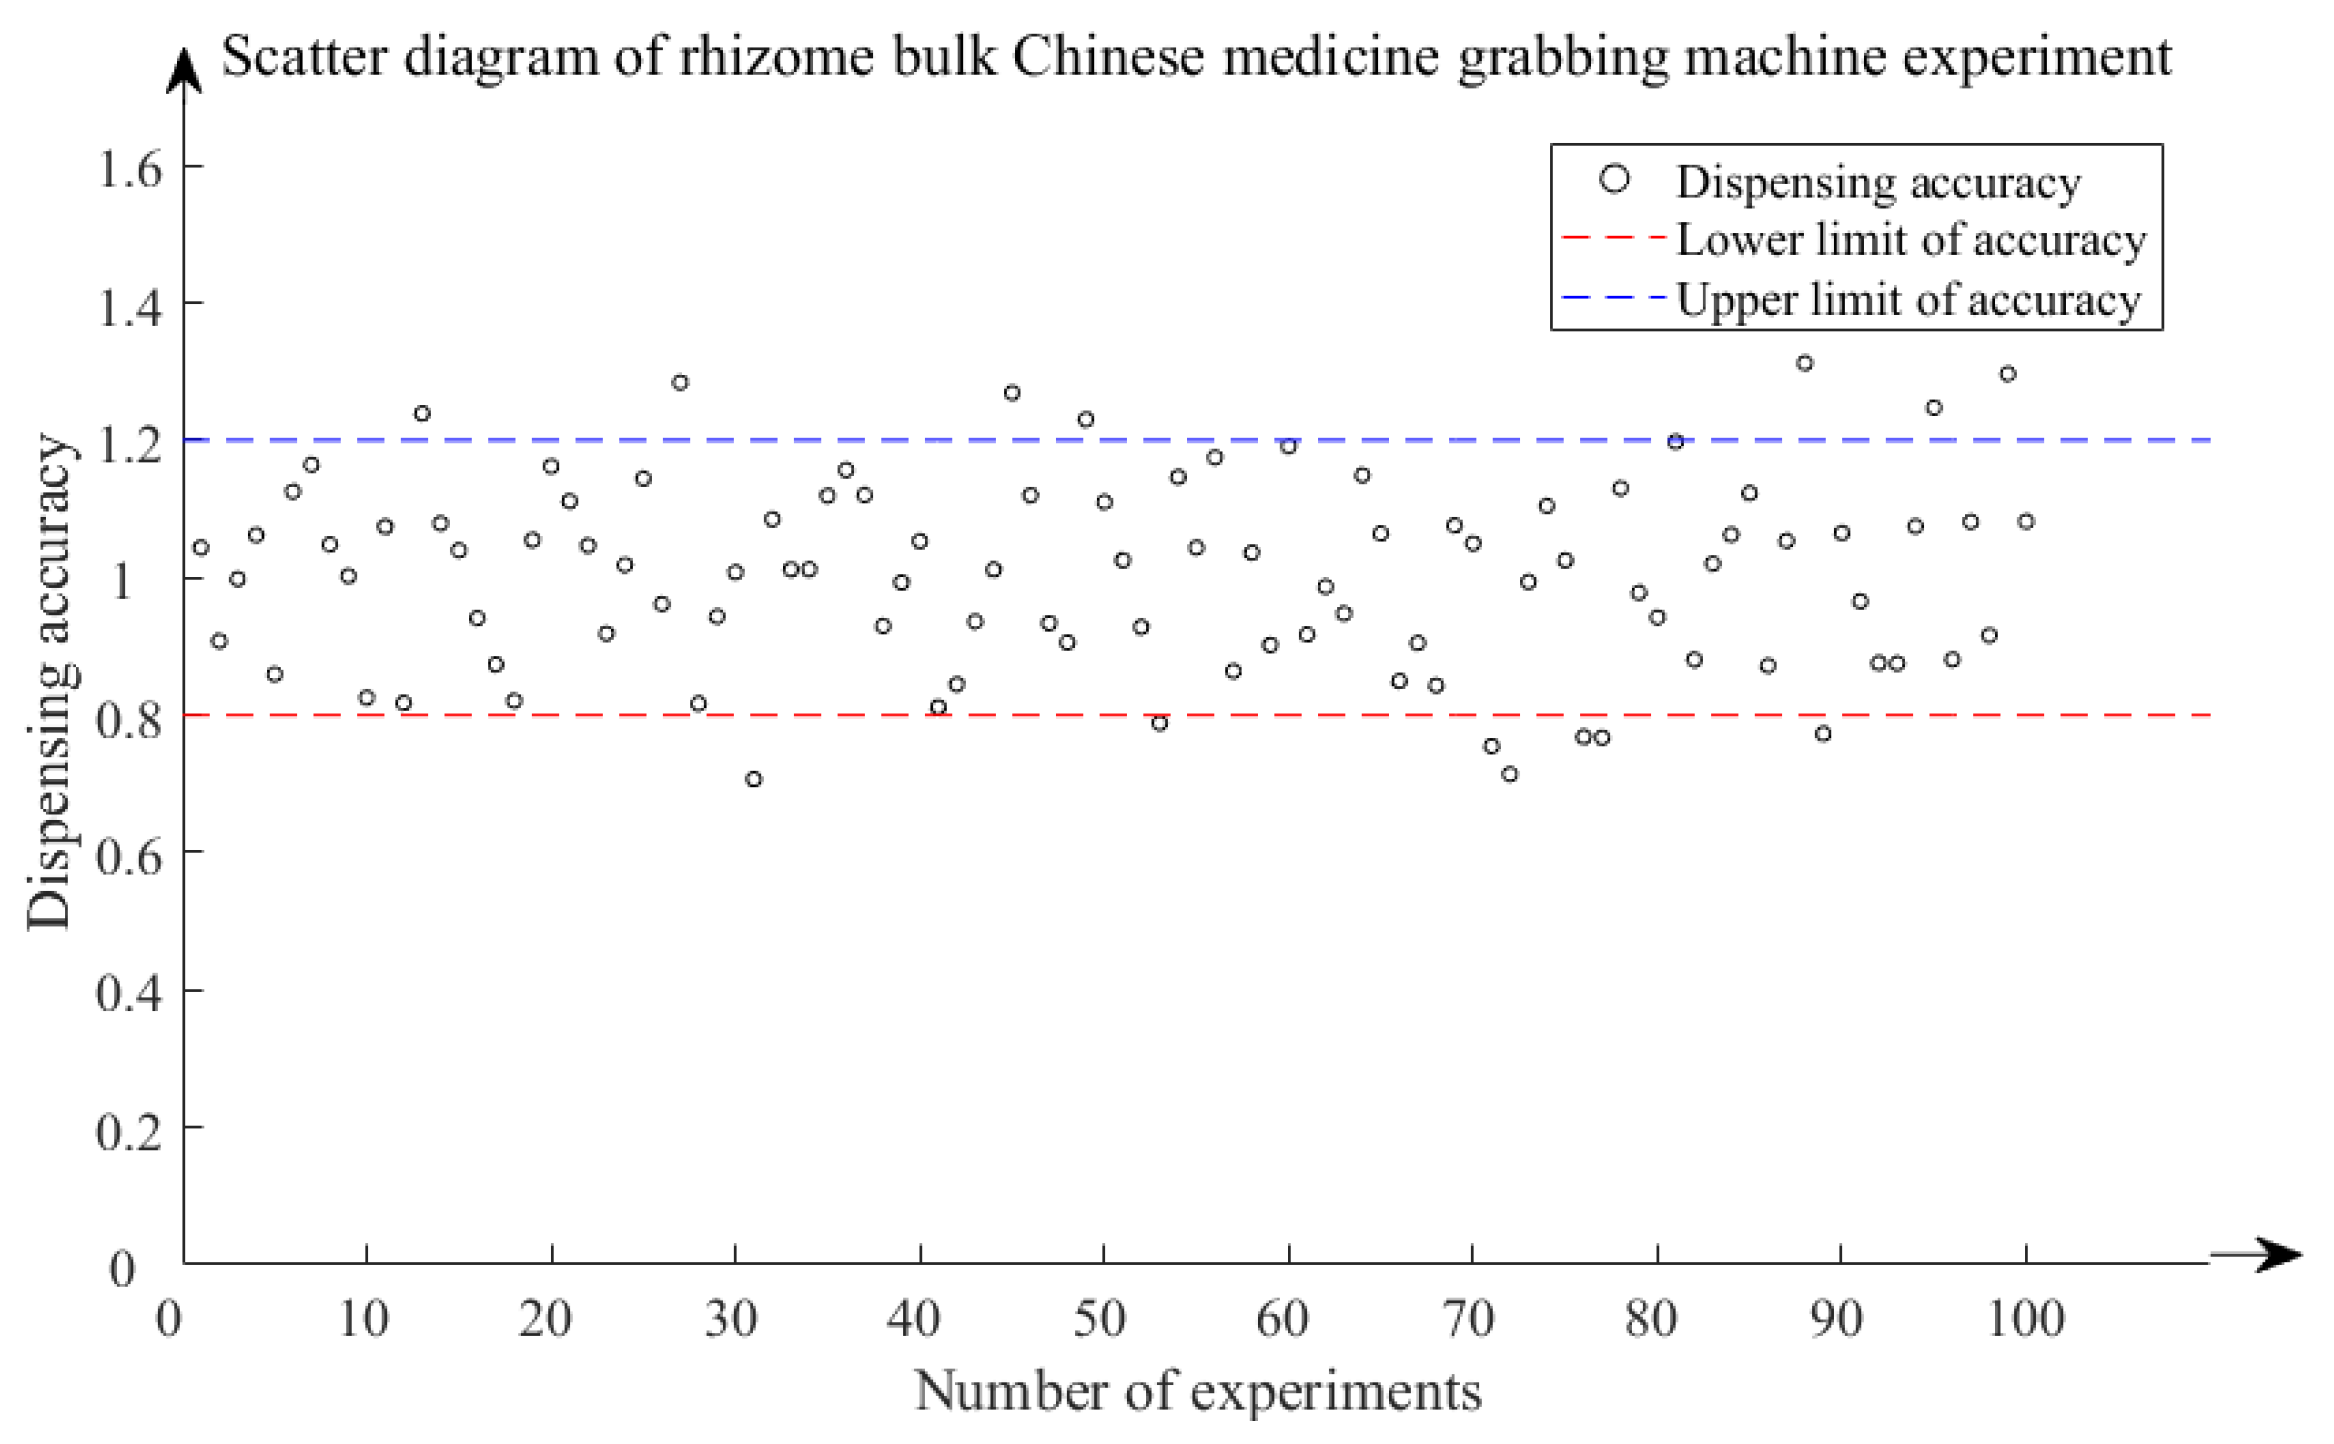
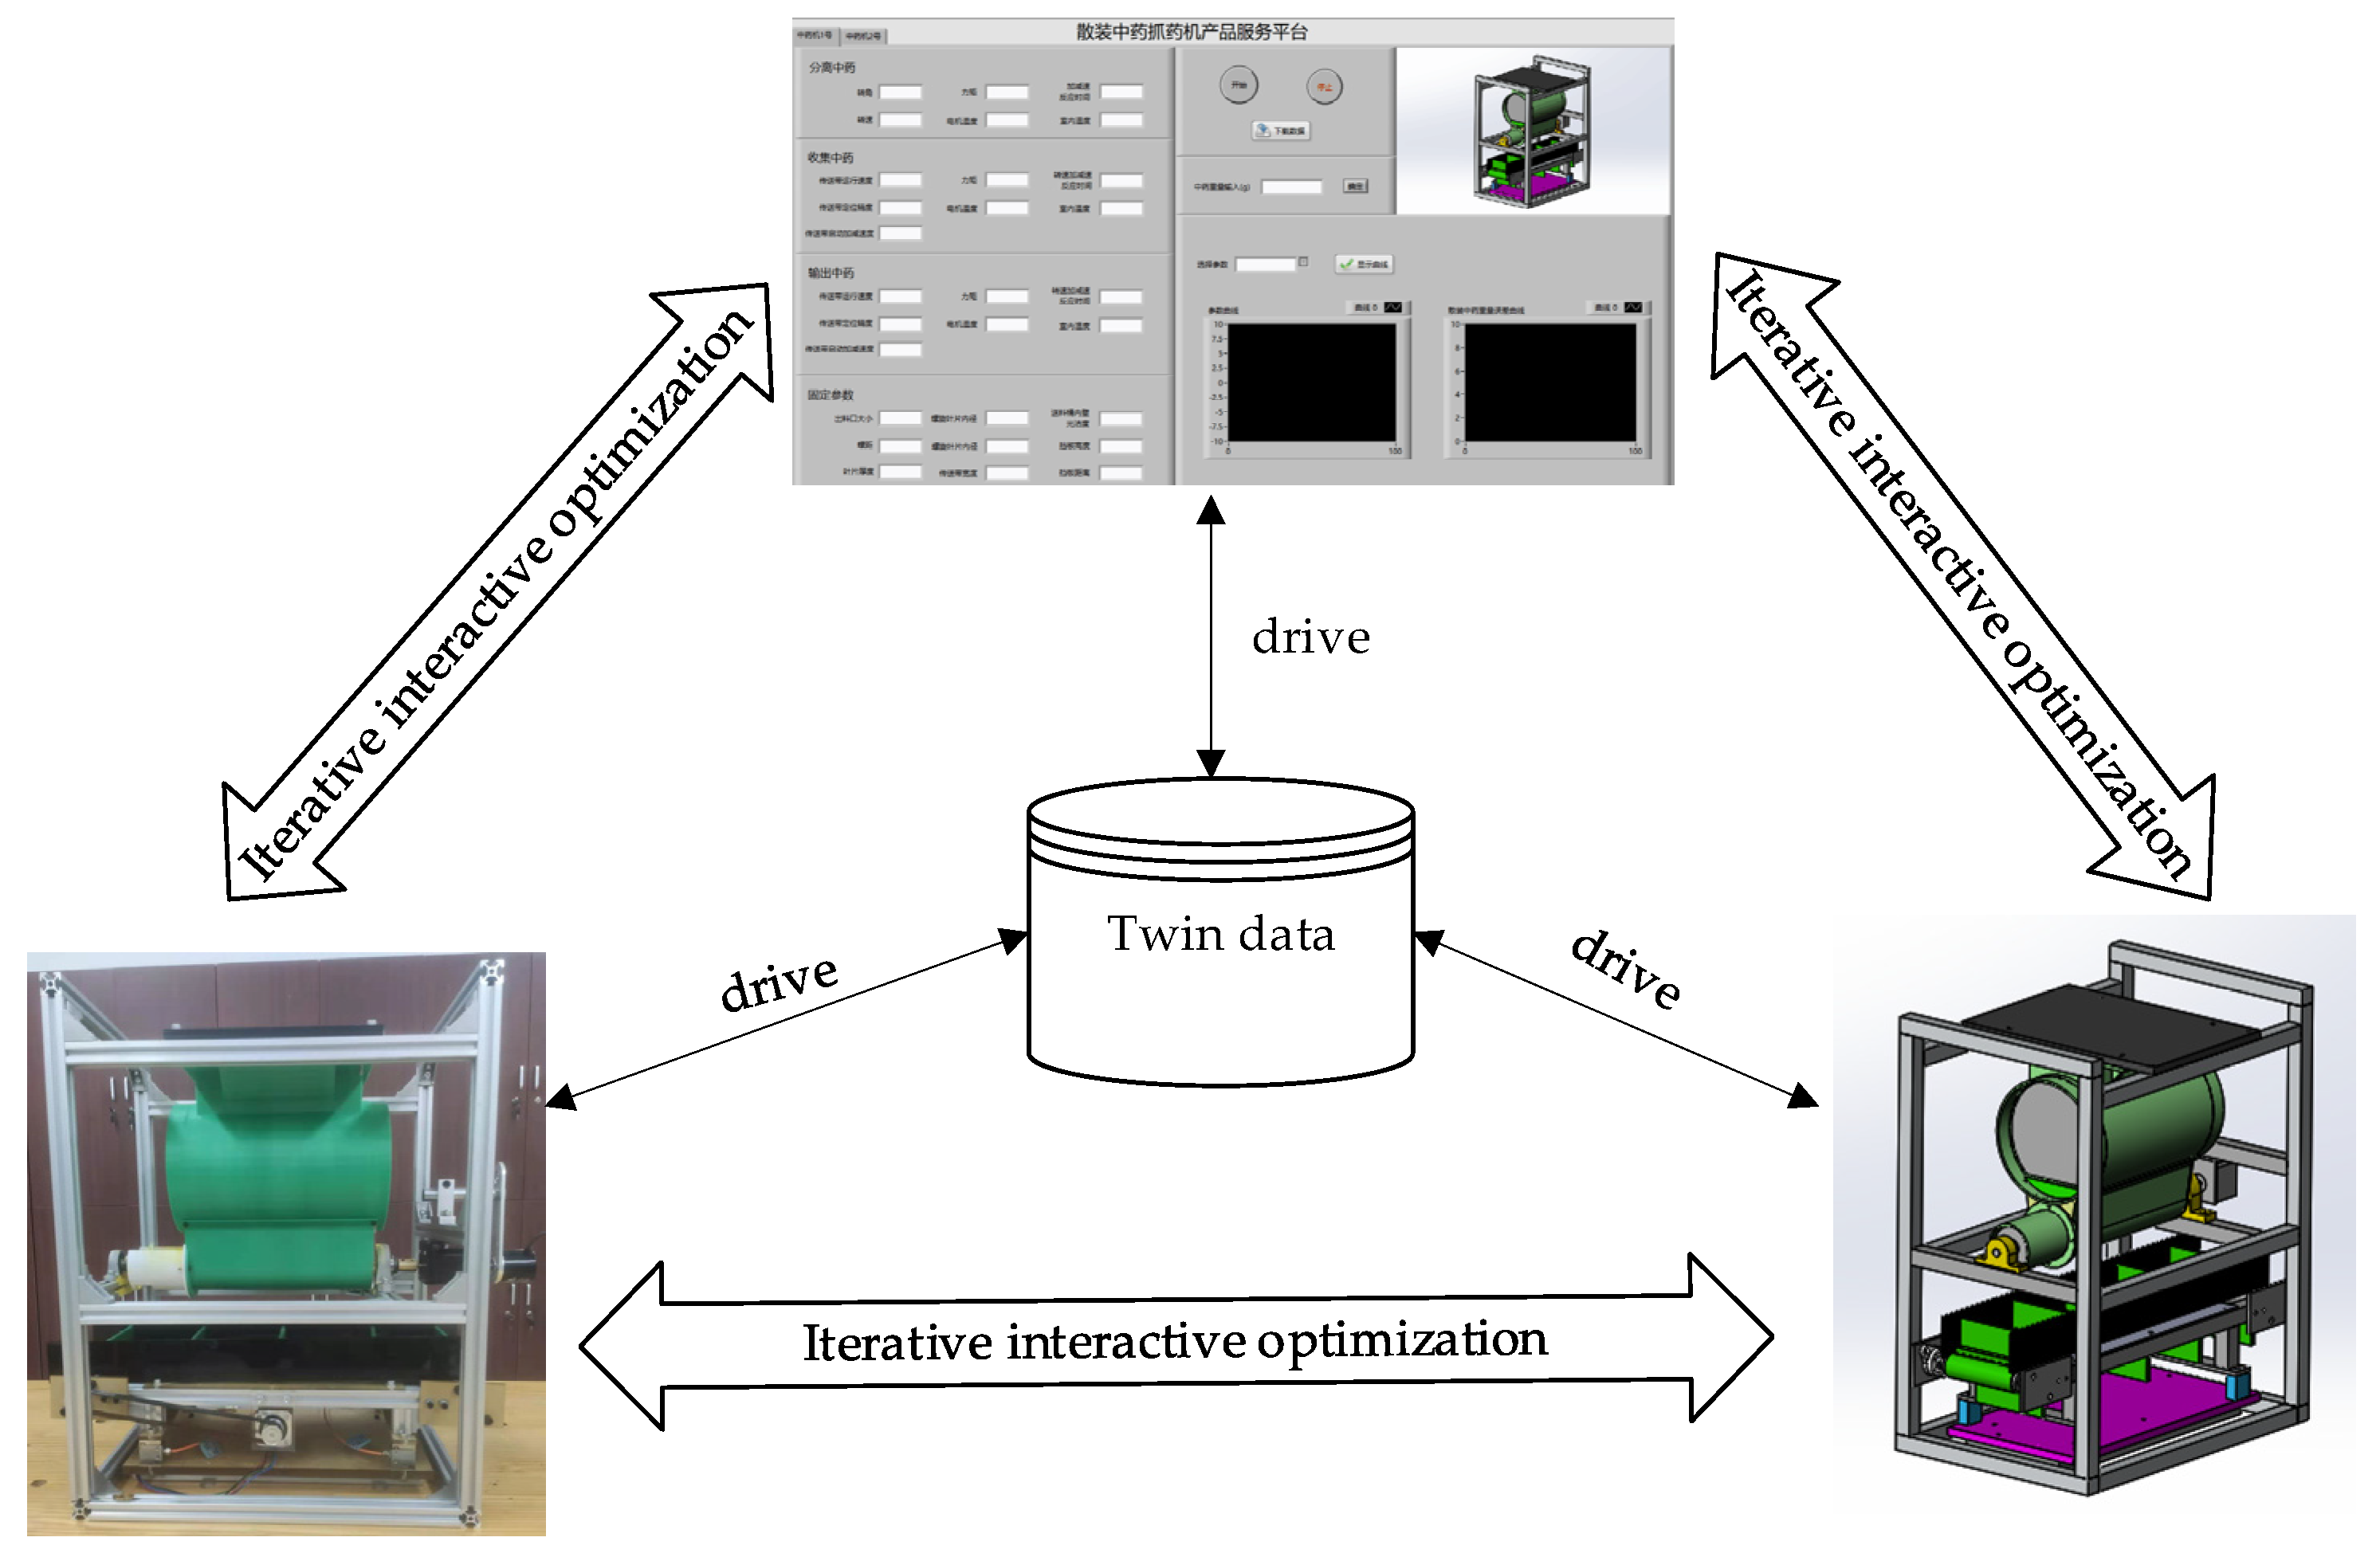
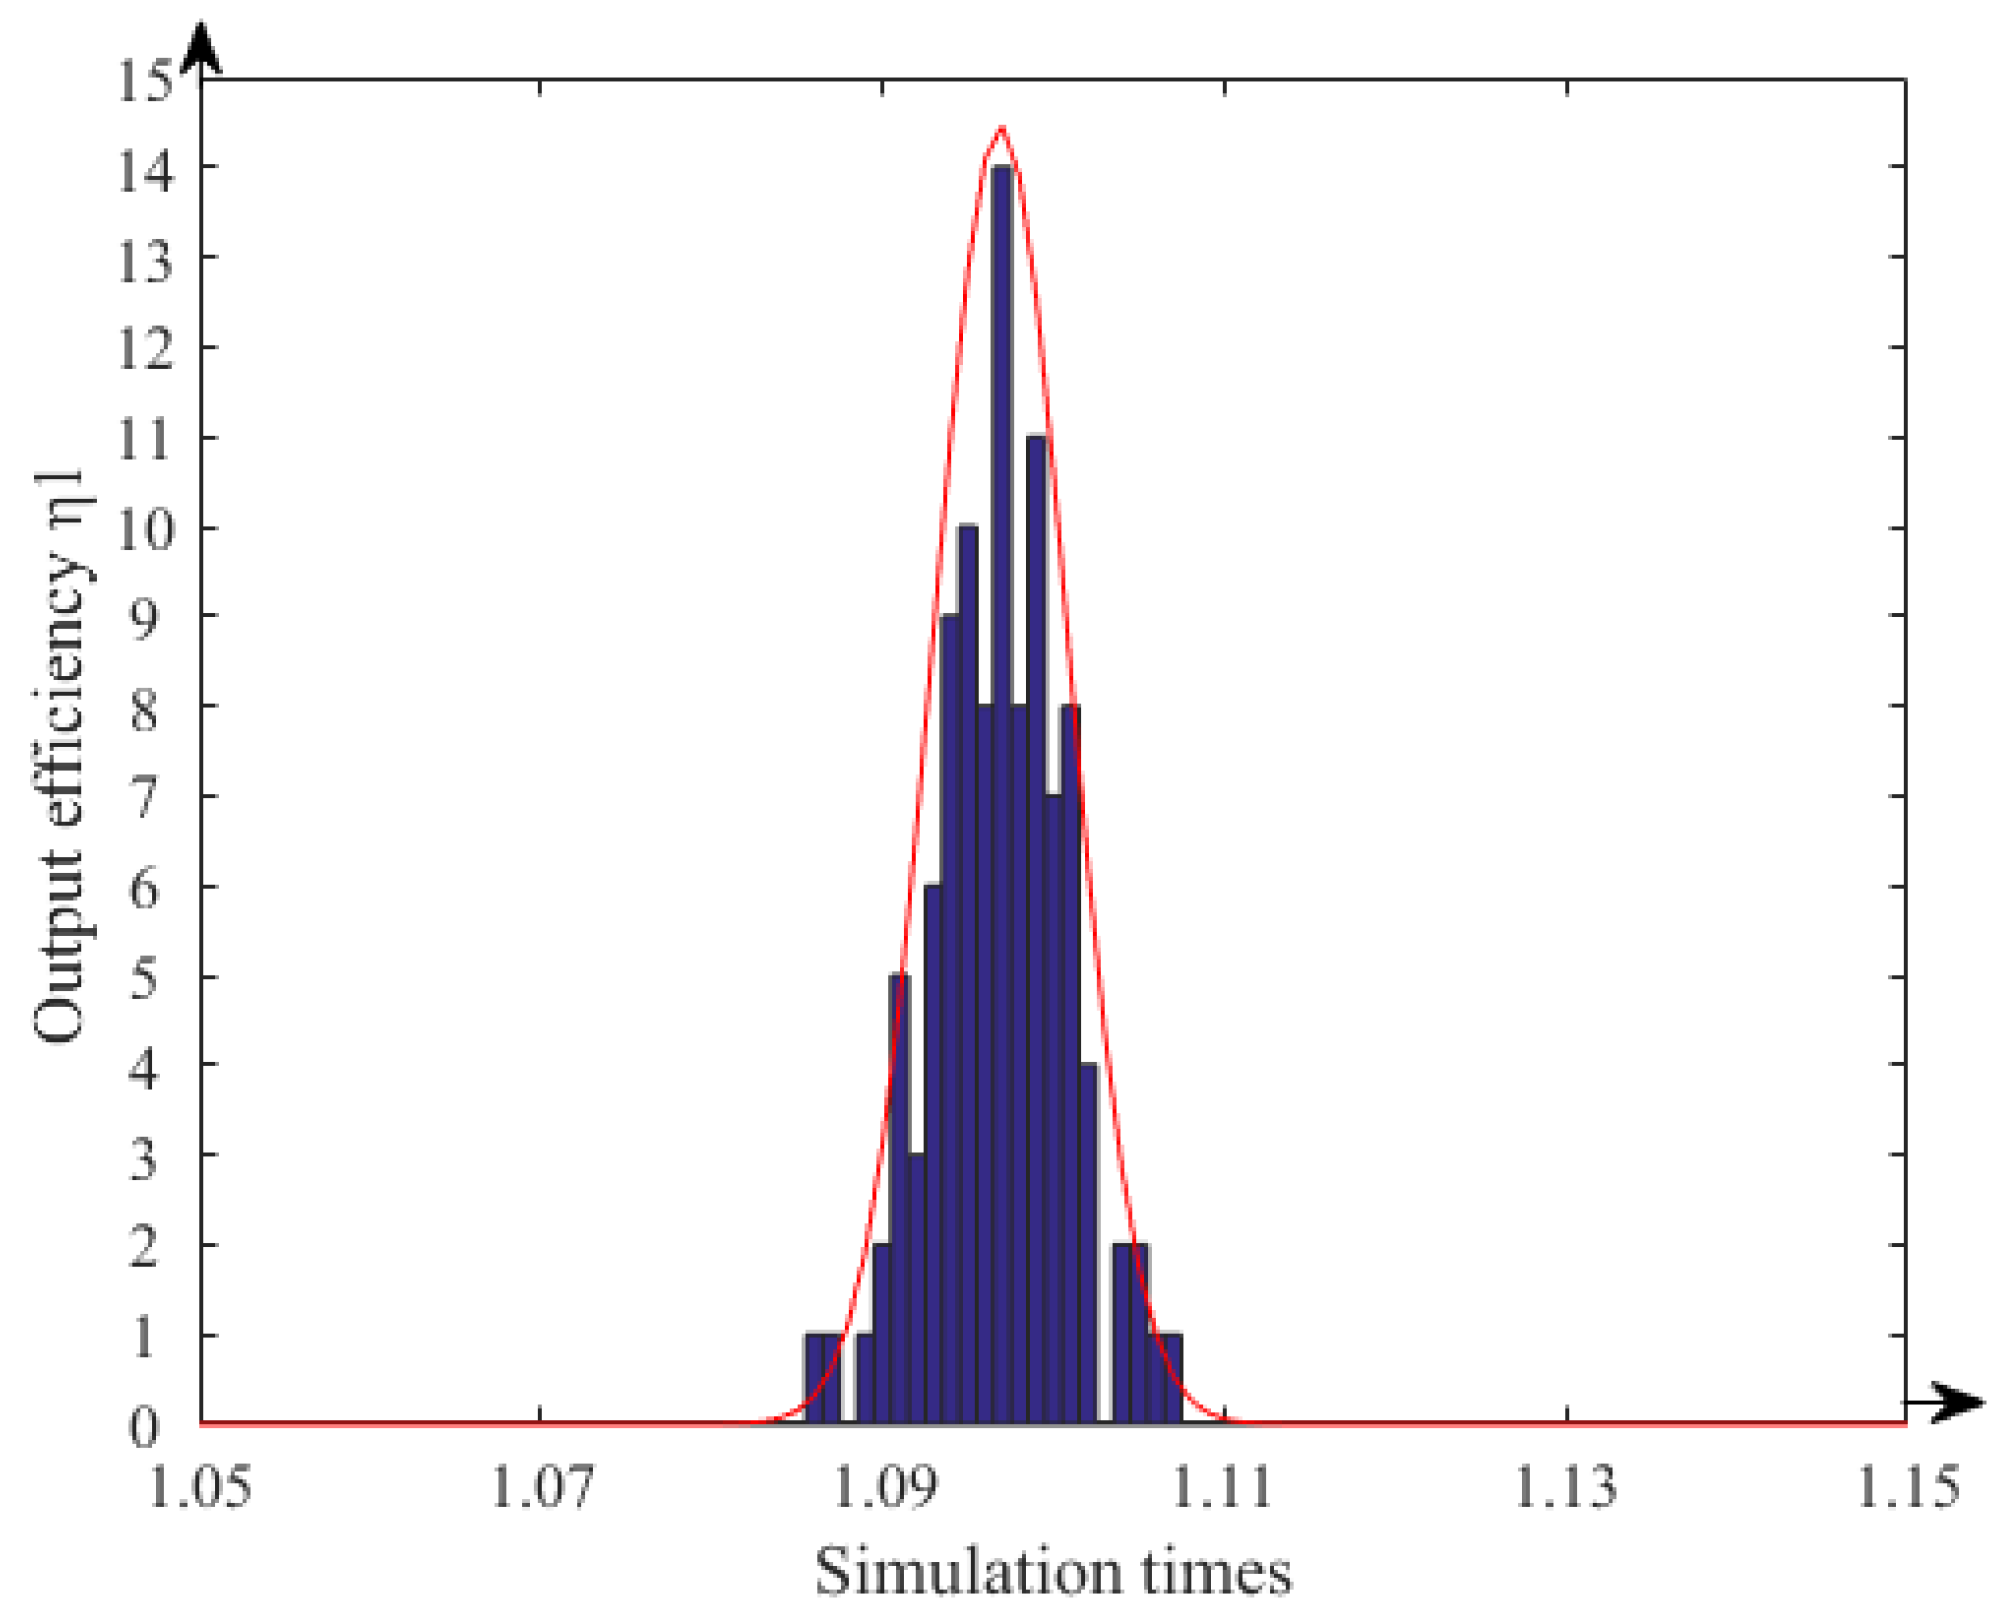
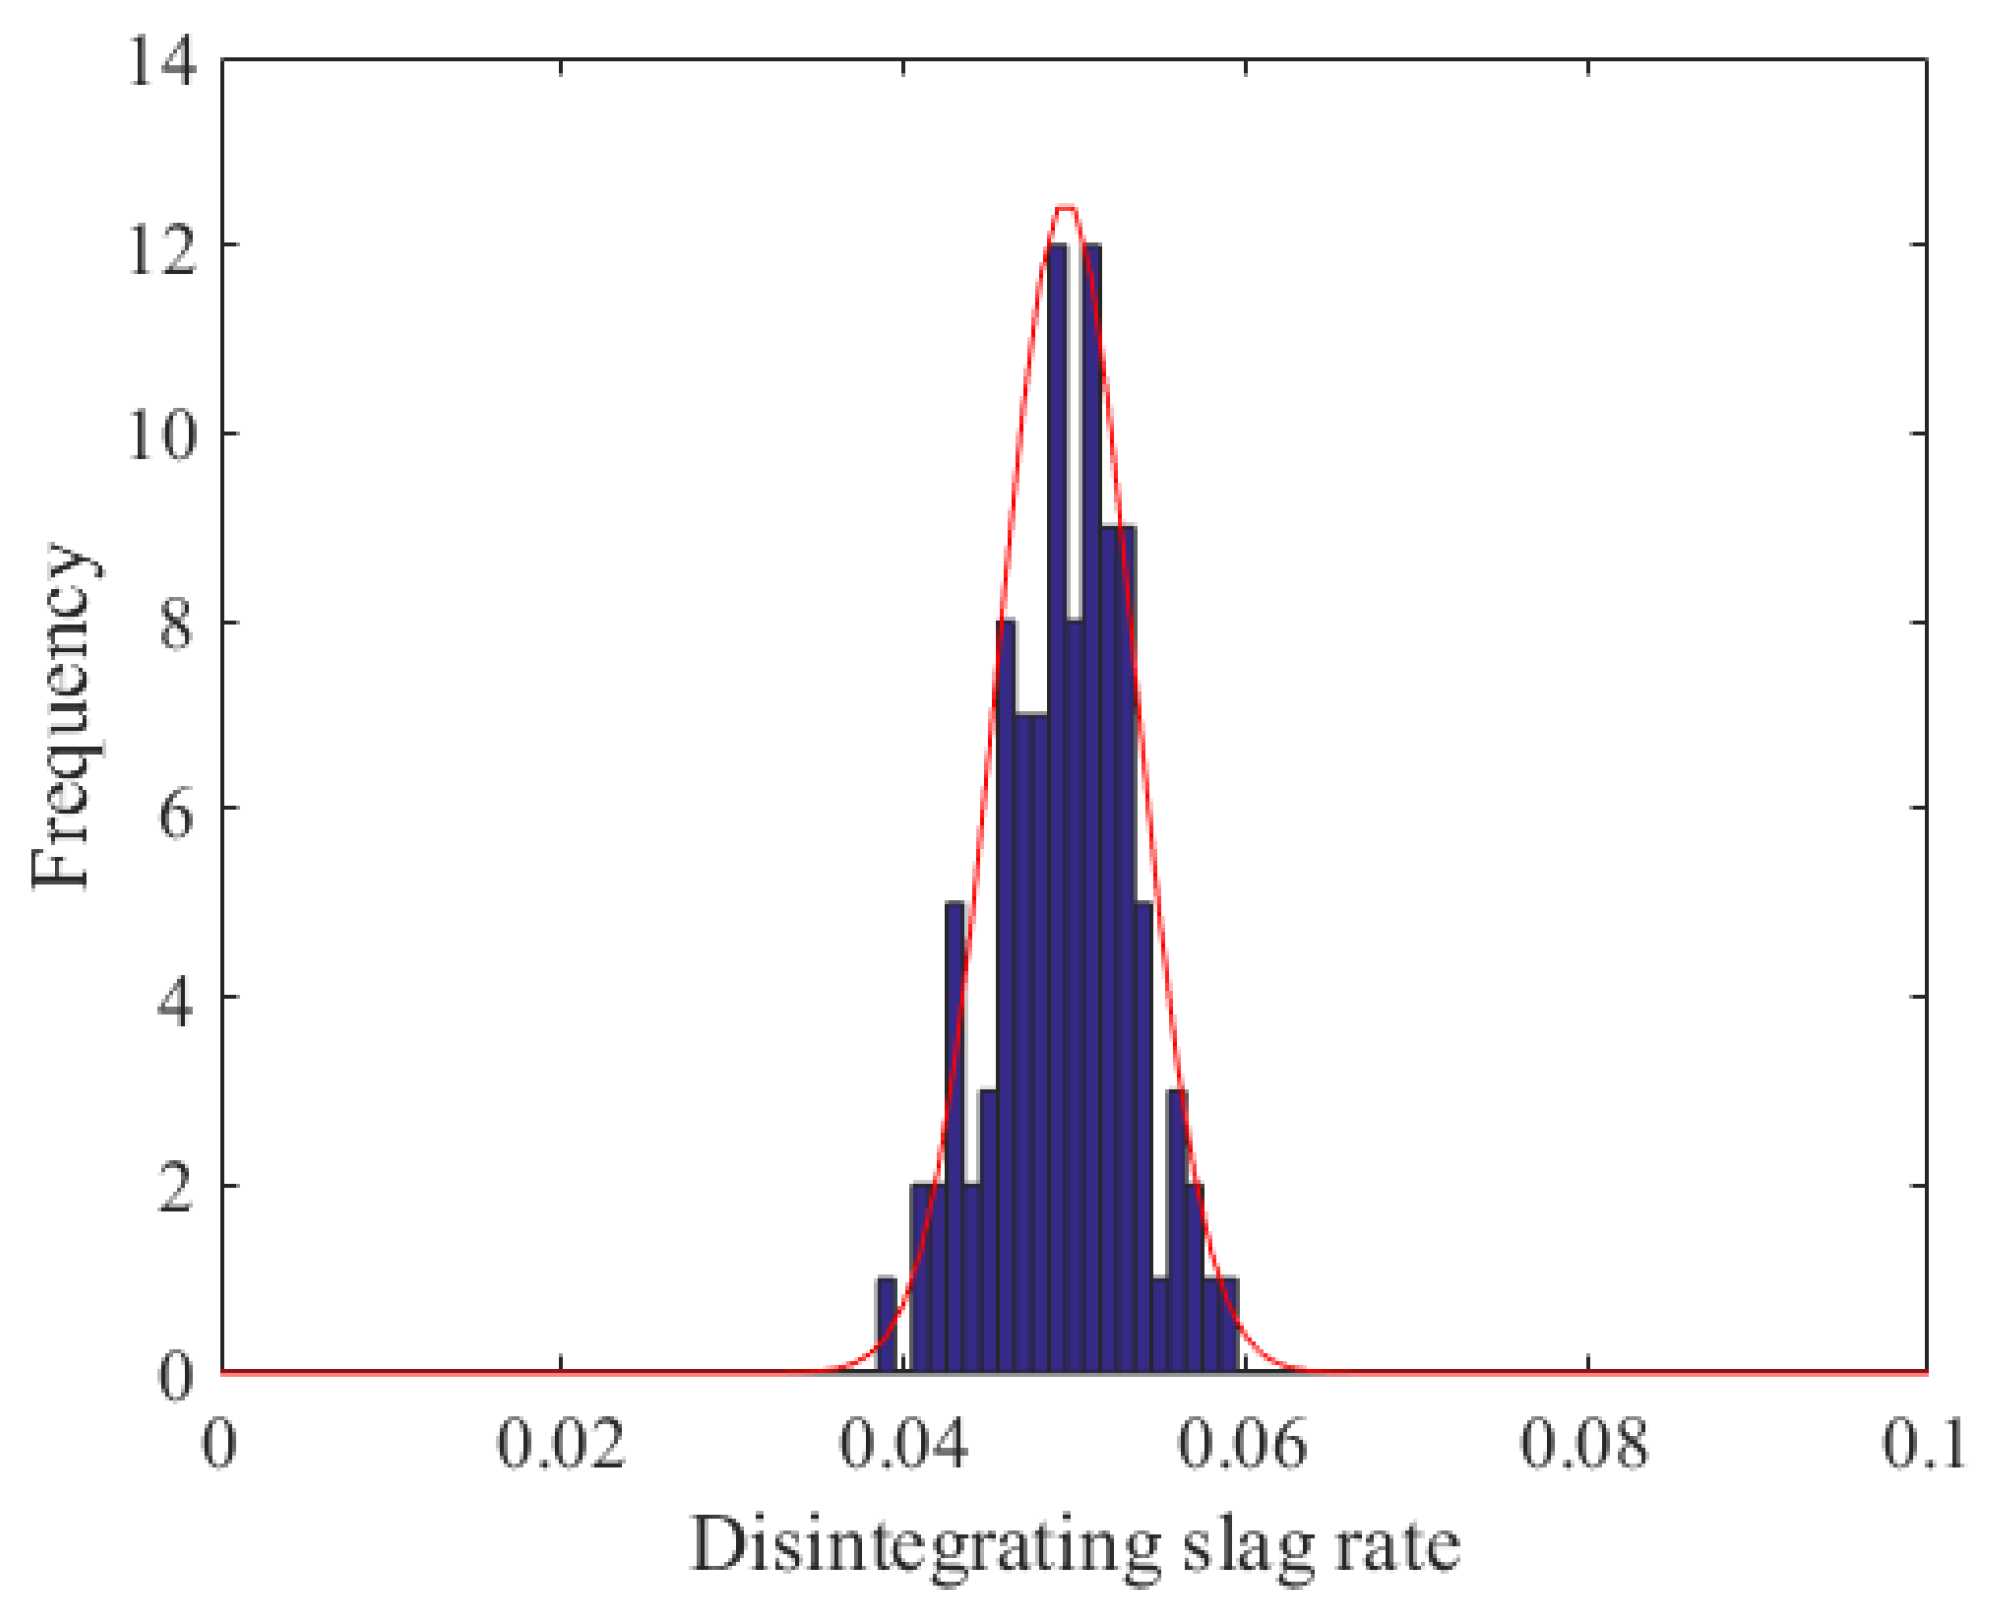
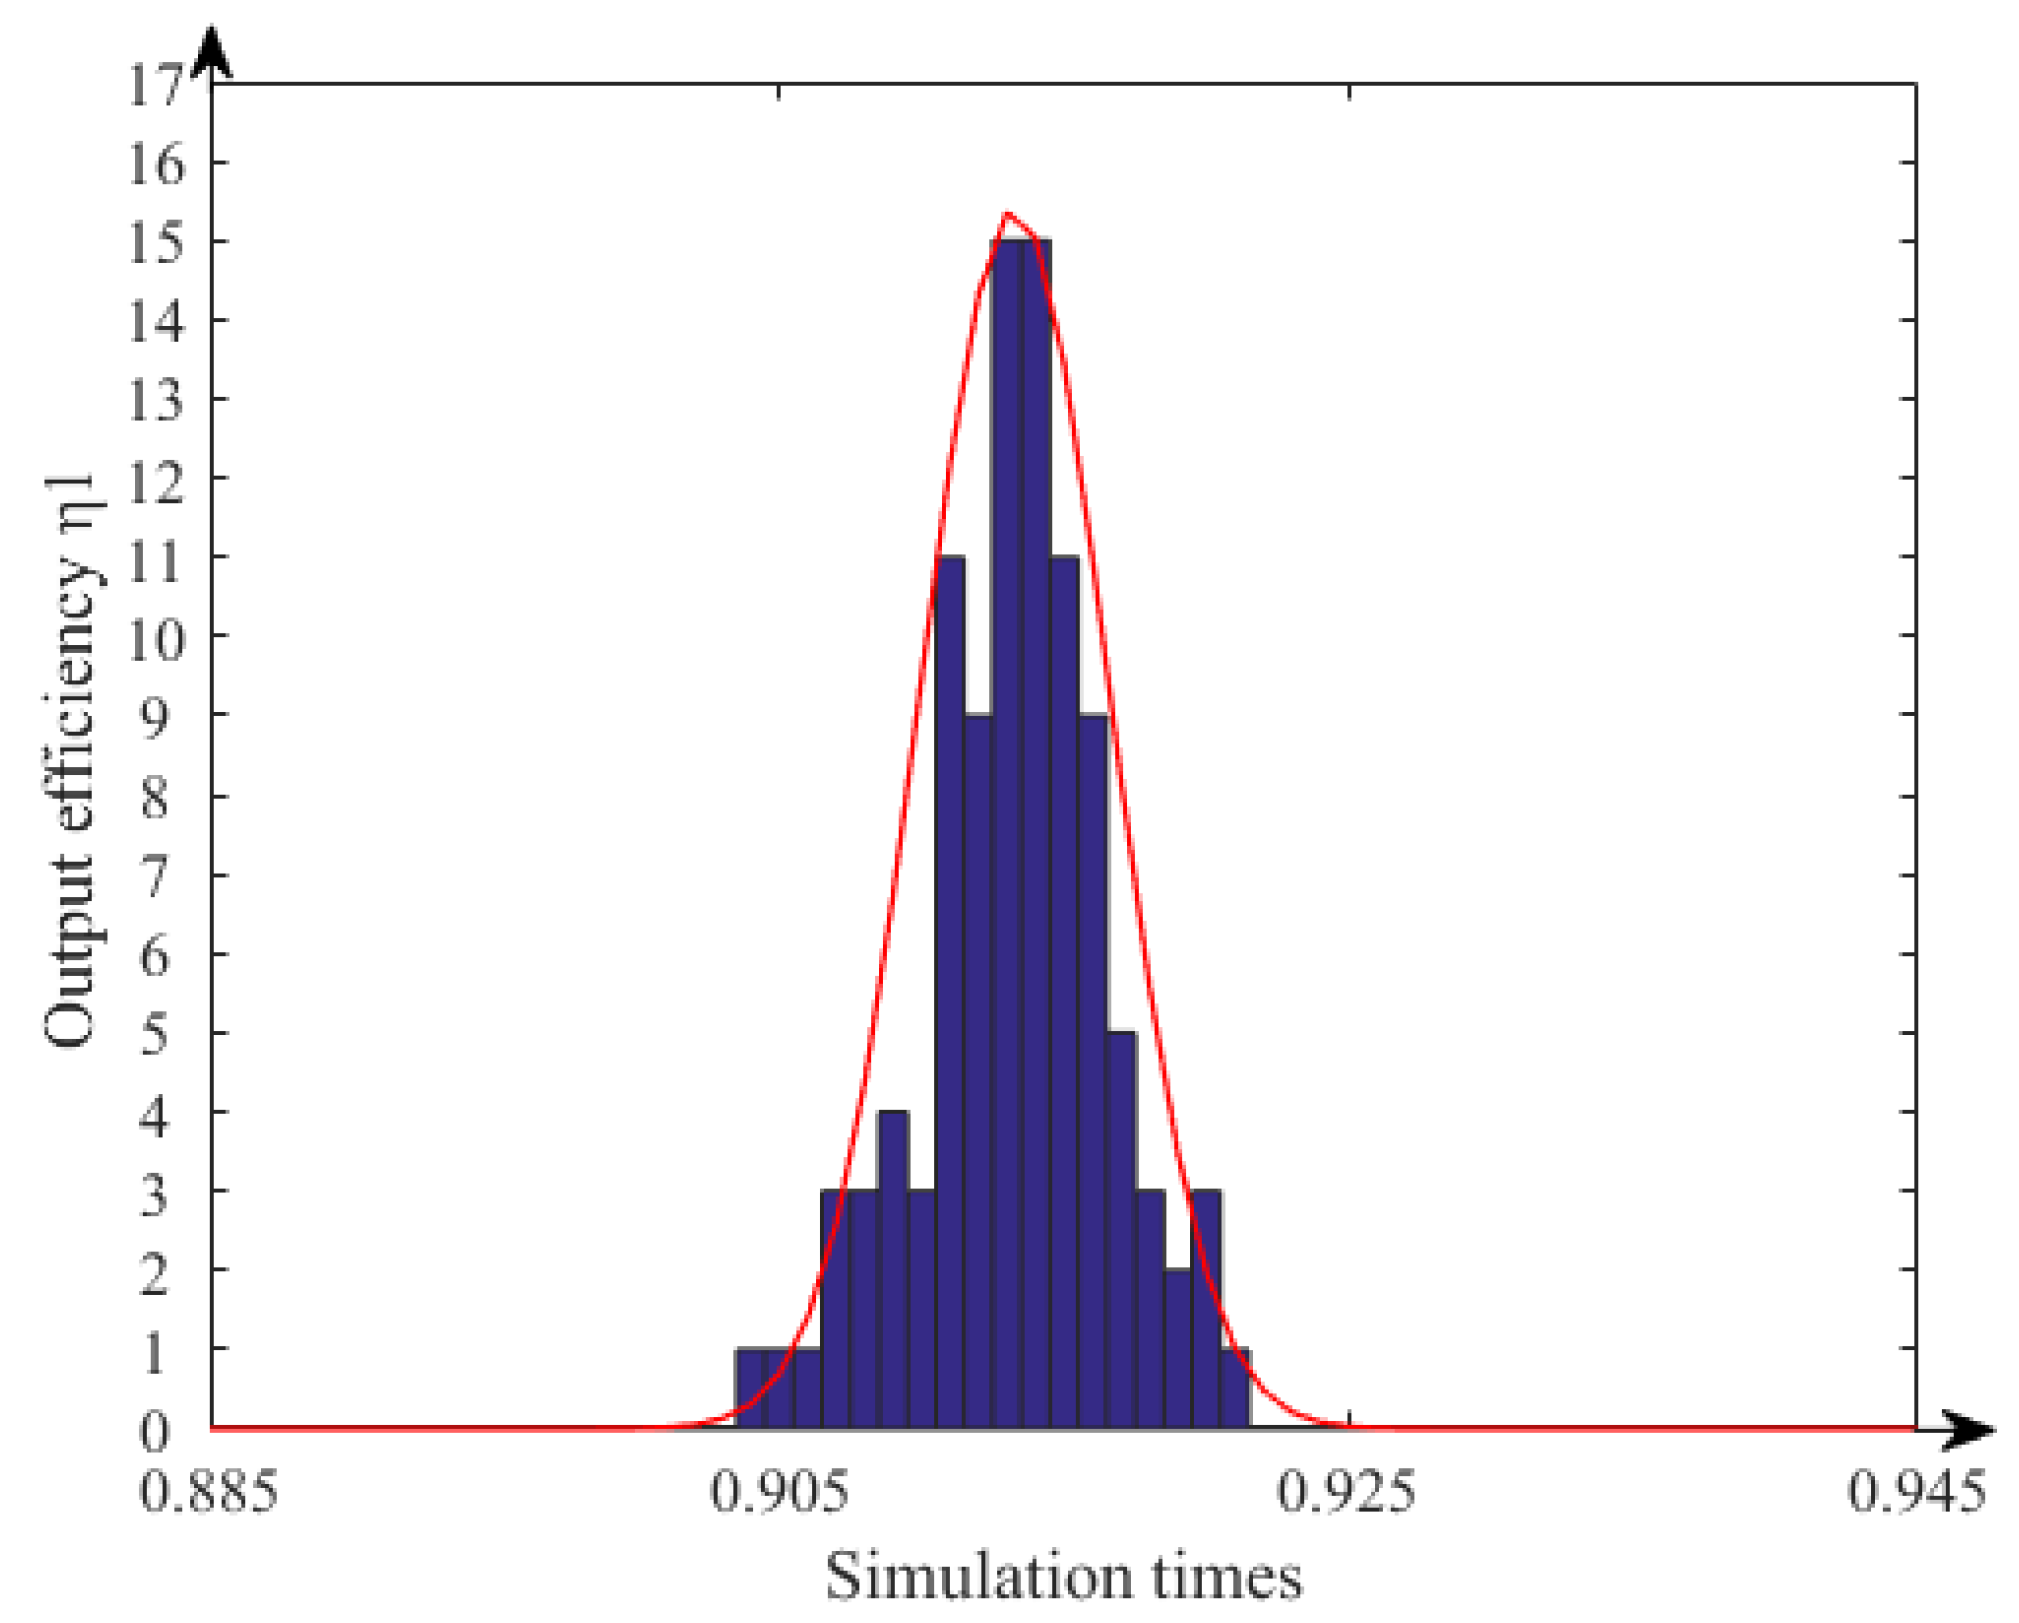
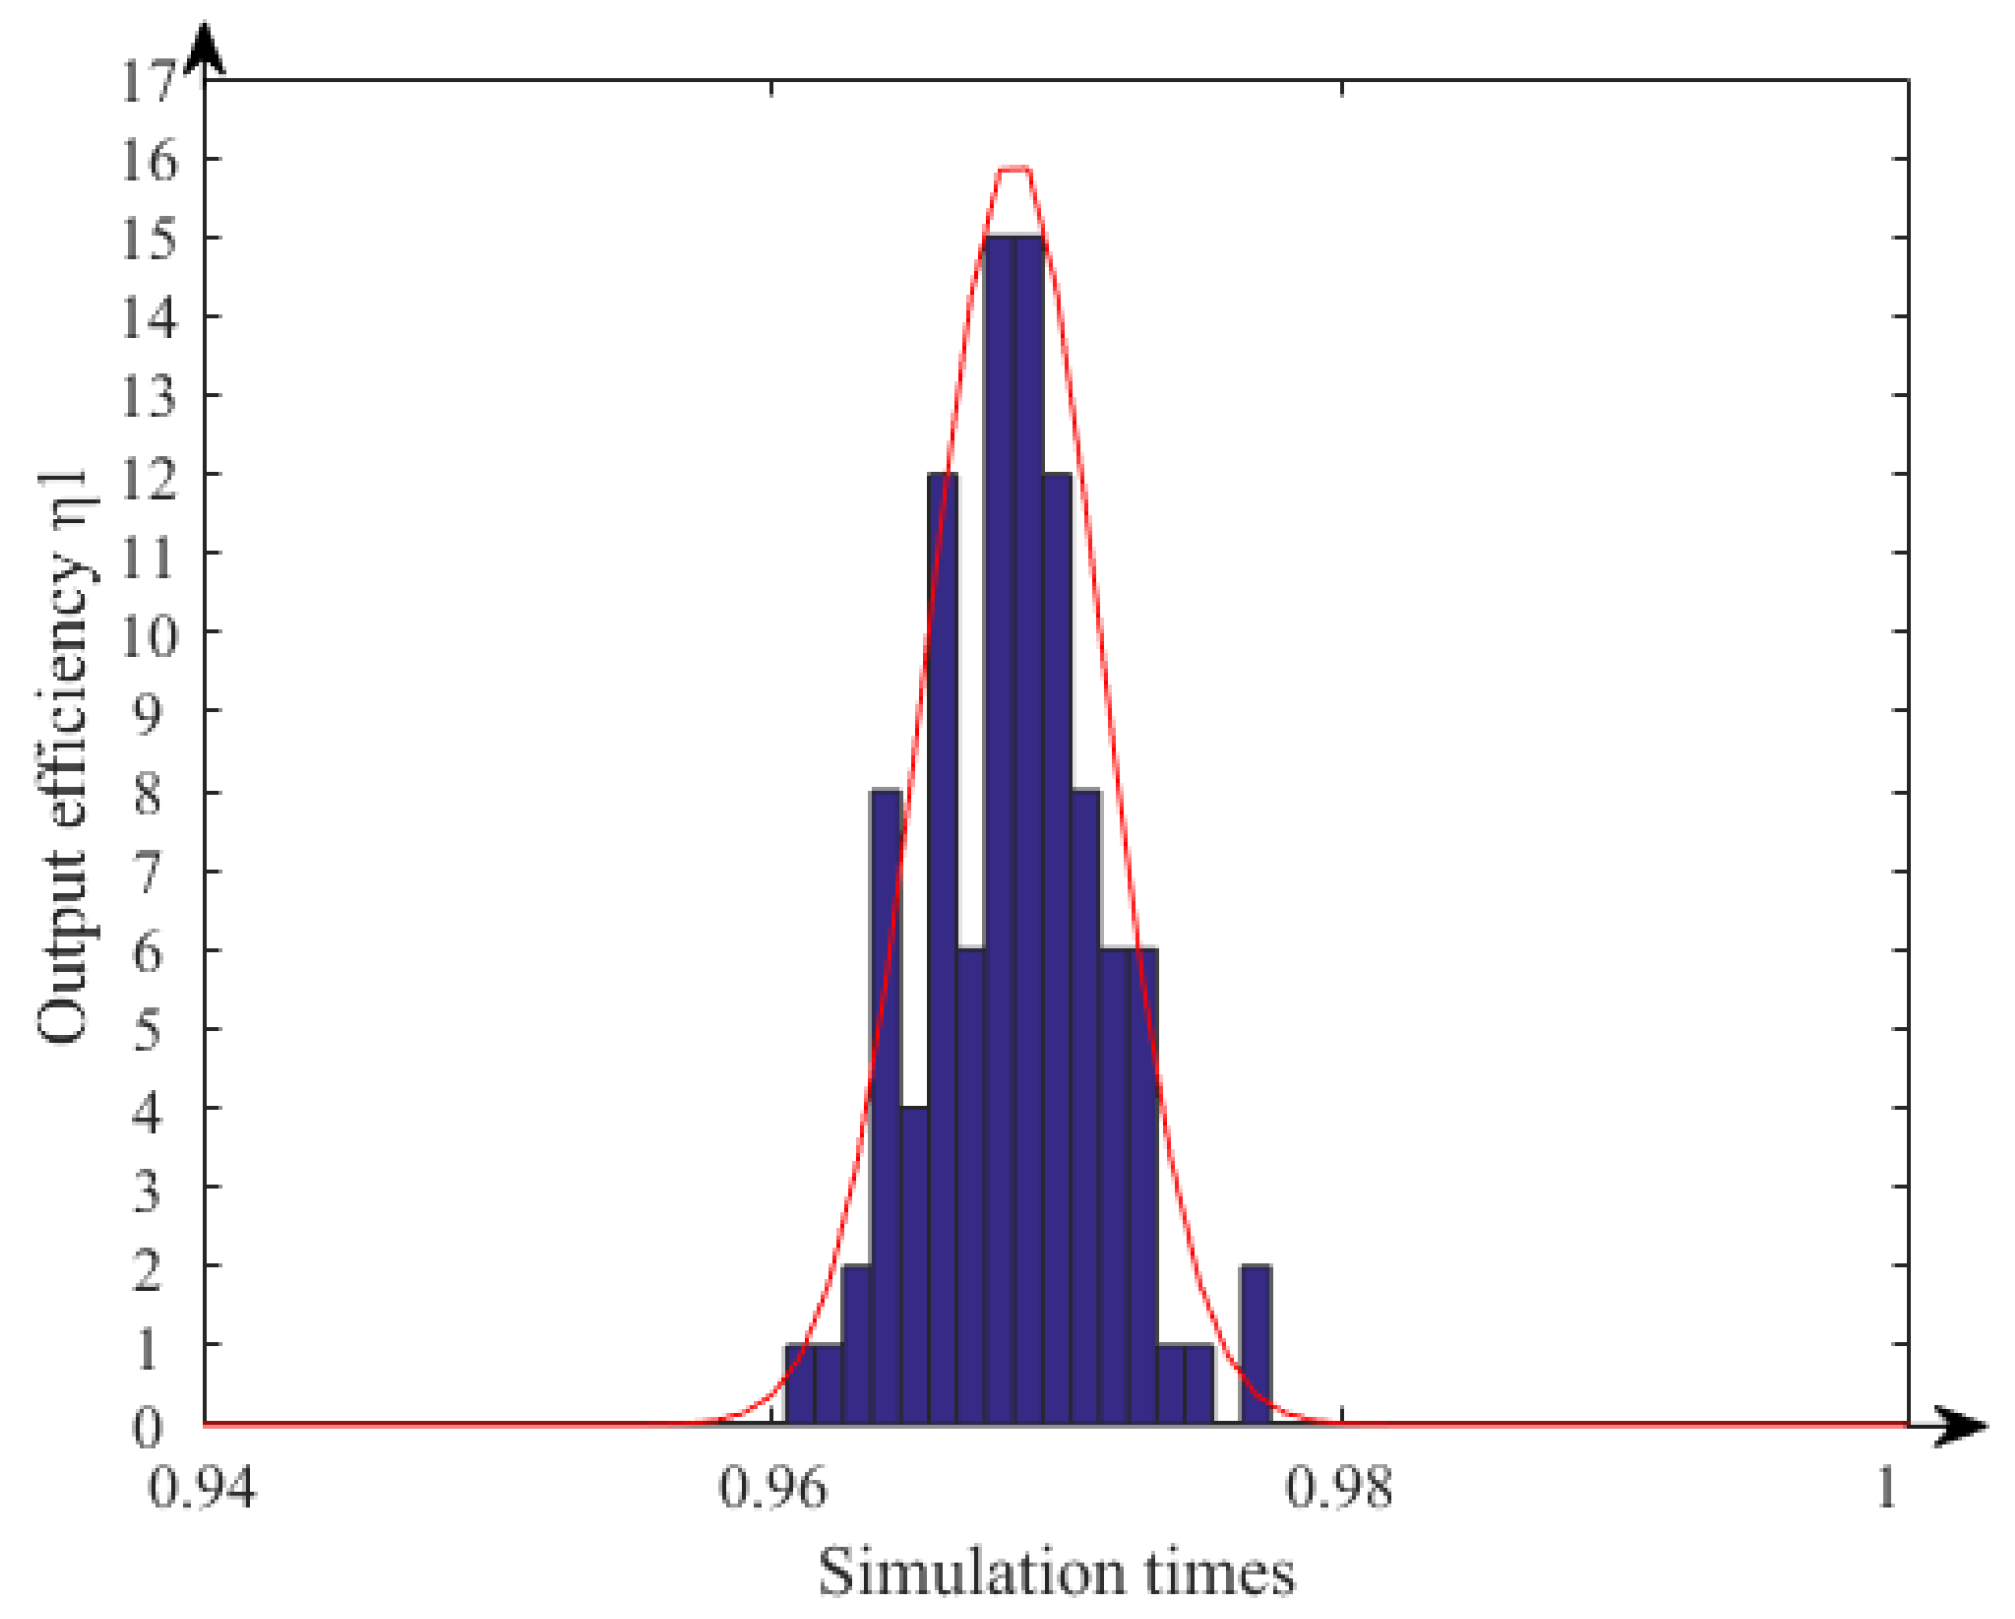
- The data corresponding to each parameter of the function unit are collected by using the digital twin model of the existing system, as shown in Figure 11.
- SolidWorks is used to build the model of new systems.
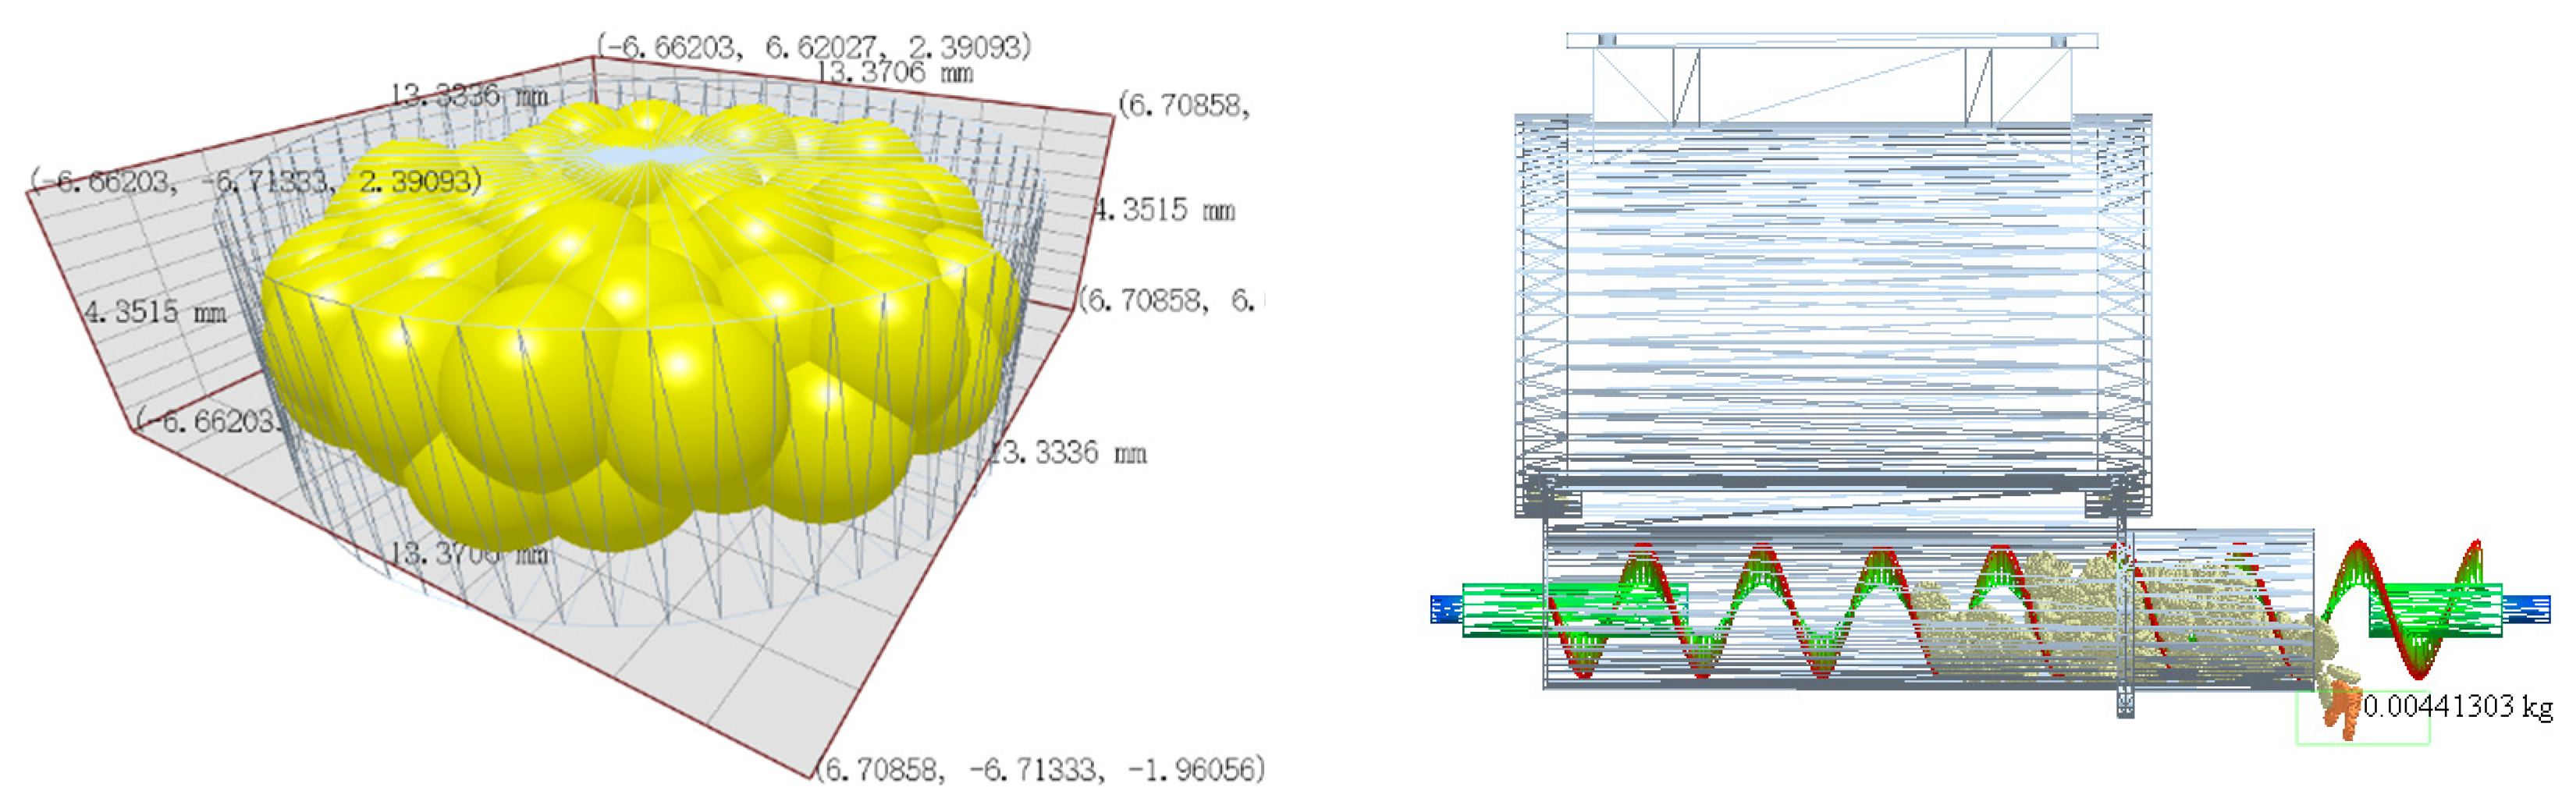
- The prototype model built by SolidWorks is imported into EDEM software. Then, according to the prototype data of existing systems, the constraints of each part can be set.
- A virtual granule factory can be set with constraints according to the data statistics of the rhizome bulk TCM dispensing device.
- The directions of gravity acceleration, dynamic constraints, calculation domain and other constraints are set, and, finally, the digital twin model of the new system is improved.
6. Discussion
- The cost is lower. After the introduction of ten devices, the pharmacy saved about 20.4% in dispensing costs in the first year, increased the dispensing efficiency by 12% in the same time, and saved about 8% in electricity costs.
- Post maintenance is simple. It is mainly to replace the mechanical connecting parts, which can save more maintenance costs for the pharmacy.
7. Conclusions
Author Contributions
Funding
Data Availability Statement
Conflicts of Interest
Appendix A
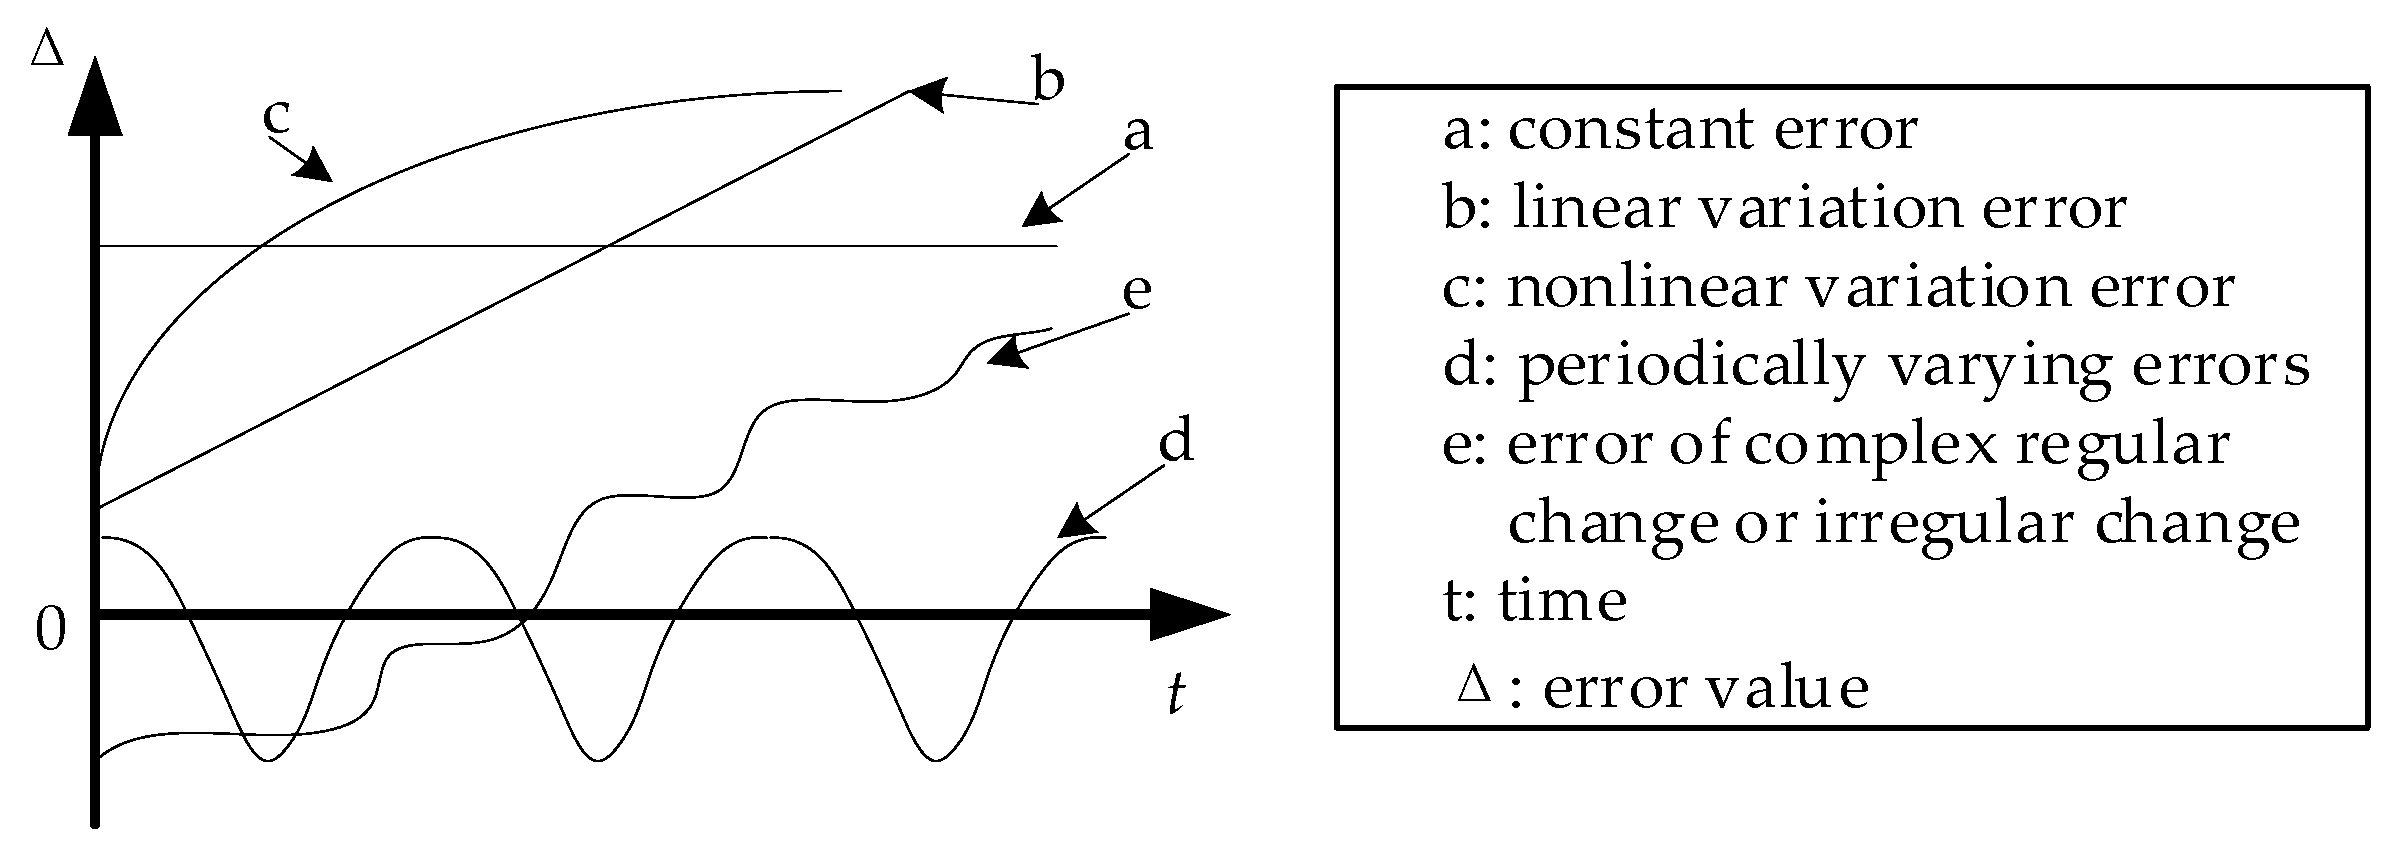
- there are problems in the structure domain itself;
- the system range shift caused by the change in physical parameters of the structure domain over time.
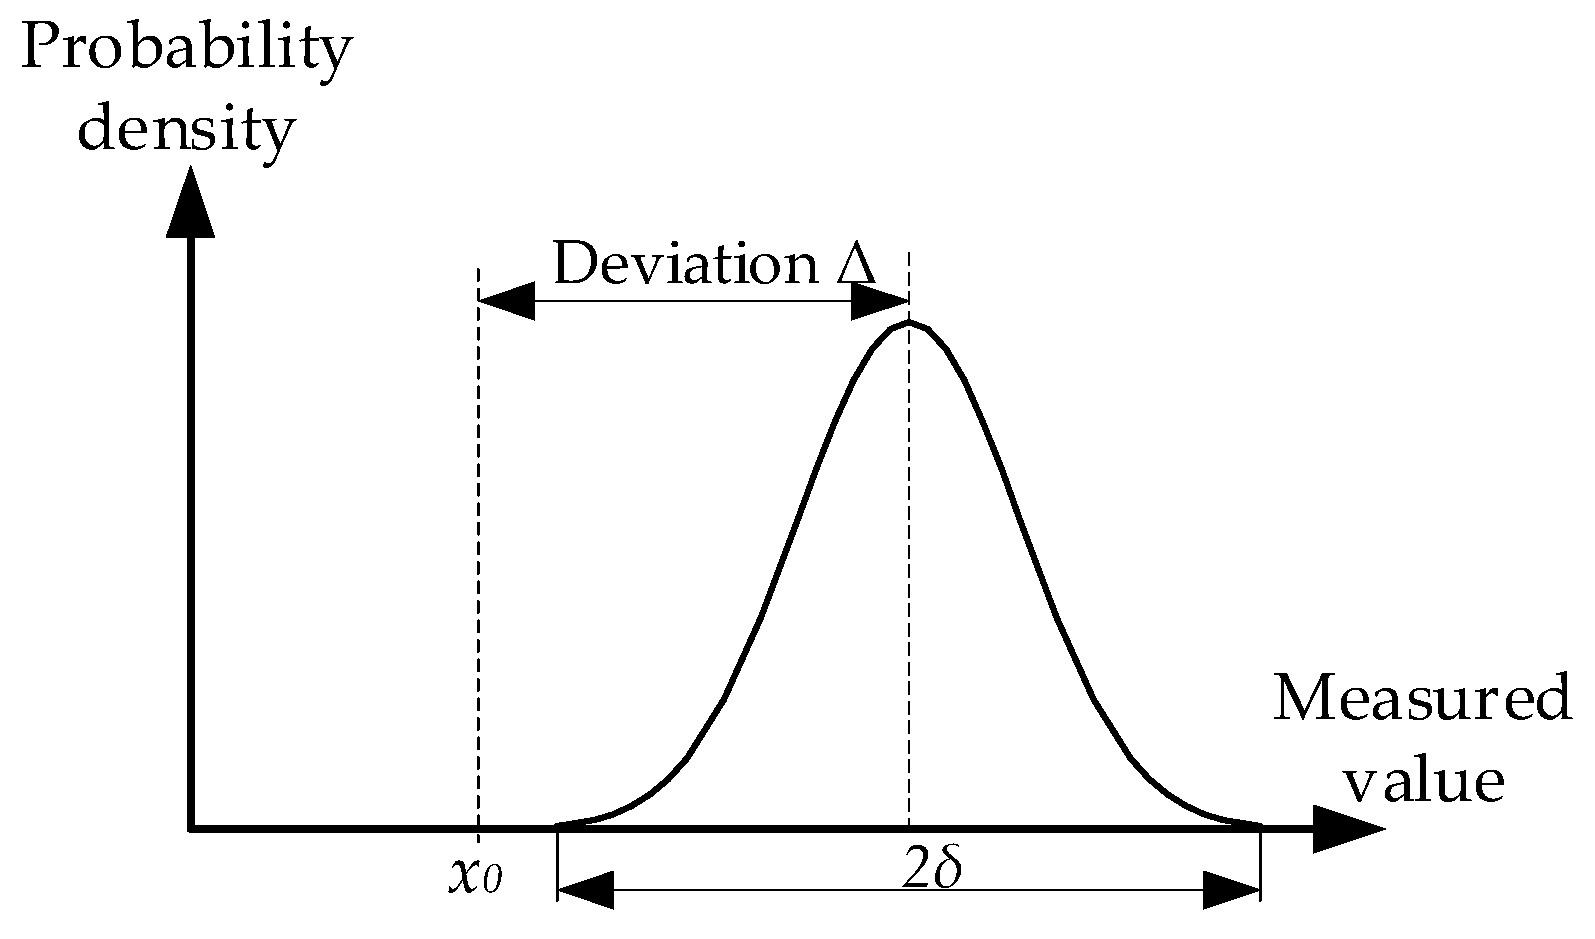
- (1)
- Constant systematic error and time-independent real complexity
- (2)
- Periodic systematic error and time-dependent periodic complexity
- (3)
- Time-dependent combinatorial complexity and systematic errors of linear, nonlinear, and complex variation laws
- (4)
- Time-independent imaginary complexity
Appendix B. Comparative Experiment of Physical Prototype

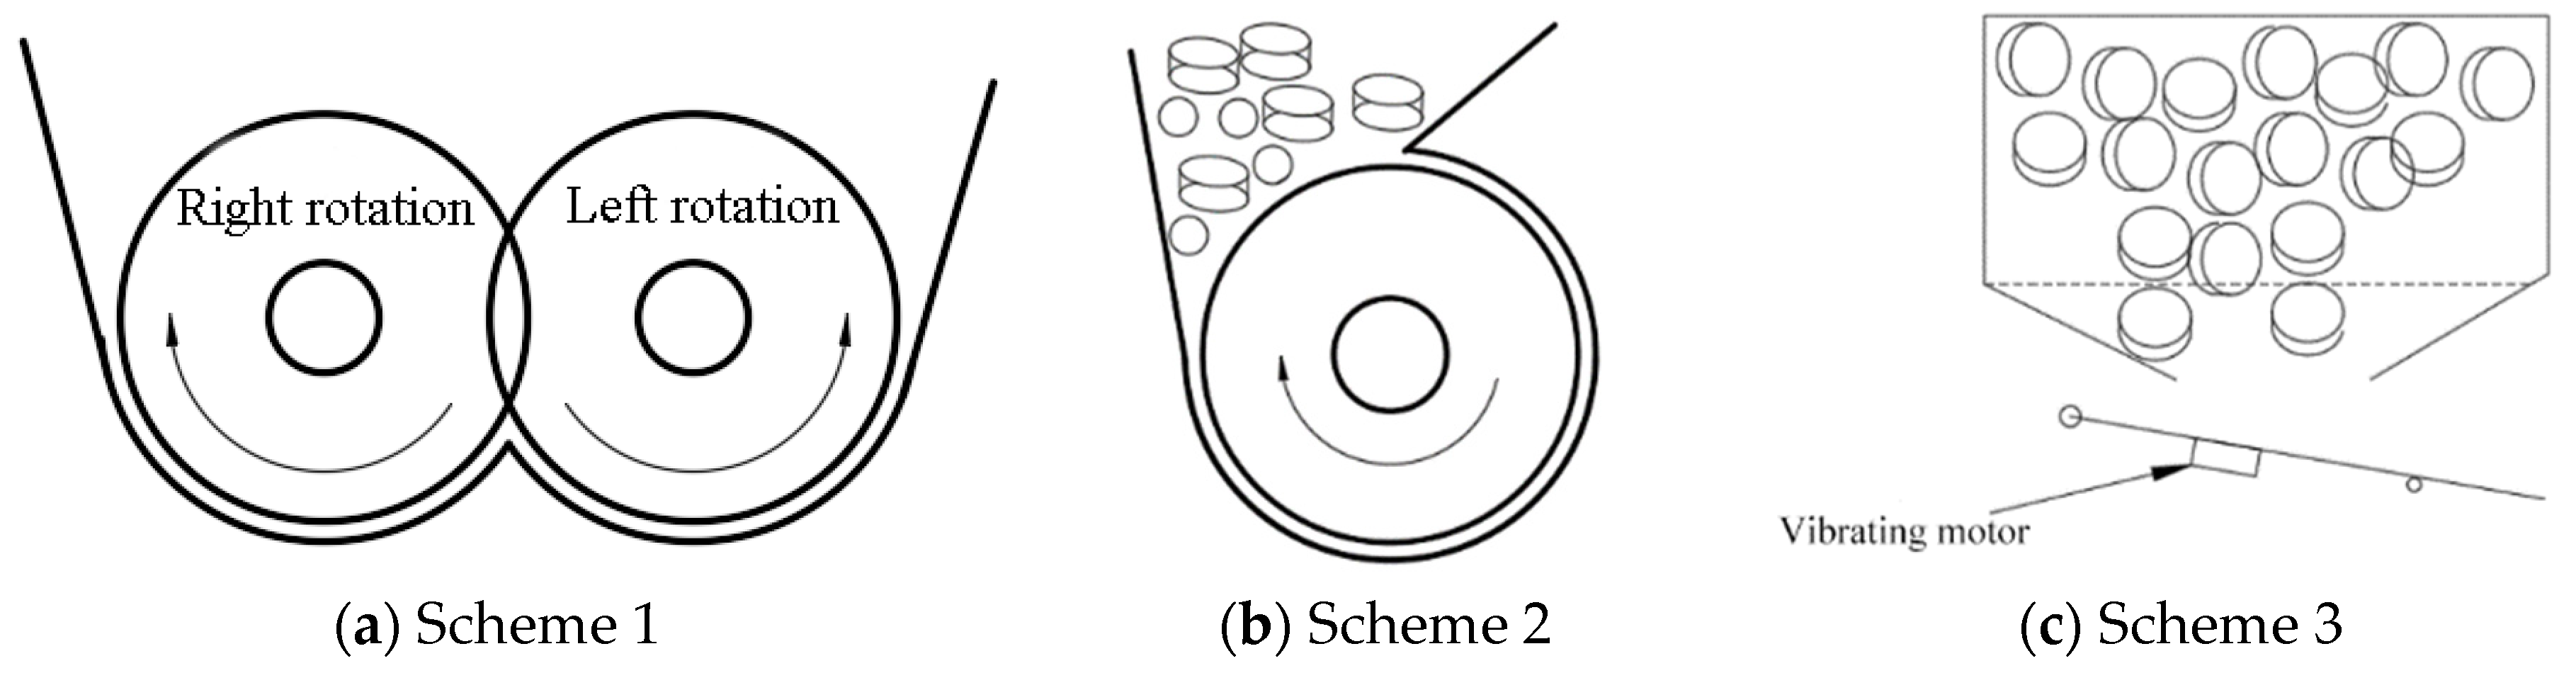
| Scheme | Scheme 1 | Scheme 2 | Scheme 3 |
|---|---|---|---|
| Total function realization probability | 83.29% | 86.67% | 81.94% |
Appendix C. Comparison with AHP
| Target Layer | Comprehensive Index Layer (Weight Value) | Project Index Layer (Weight Value) |
|---|---|---|
| Product function realization degree | 1 Customer perception—tangible assets (0.31) | 11 Material of the product (0.07) |
| 12 Product convenience (0.62) | ||
| 13 Product durability (0.31) | ||
| 2 Customer cognitive—sustainability (0.58) | 21 Energy saving (0.65) | |
| 22 Views on waste reduction (0.22) | ||
| 23 Time saving/convenience (0.14) | ||
| 3 Company influence—consumption (0.11) | 31 Consumption of manufacturing raw materials (0.07) | |
| 32 Waste from manufacturing (0.20) | ||
| 33 Greenhouse gas emissions from manufacturing (0.72) |
| Description | Very Good | Good | Moderate | Not Very Good | Not Good | Very Bad |
|---|---|---|---|---|---|---|
| Score | 9–10 | 7–8 | 5–6 | 3–4 | 1–2 | 0–1 |
- The original judgment matrix is normalized according to columns, and is obtained:
- Calculating the vector :
- normalized to obtain the feature vectors:
| Comprehensive Evaluation Indicator | Score for Scheme 1 | Score for Scheme 2 | Score for Scheme 3 |
|---|---|---|---|
| Customer cognitive | 6.71 | 6.65 | 6.97 |
| Customer perception | 6.59 | 7.35 | 6.04 |
| Company influence | 5.05 | 7.63 | 7.61 |
| Final score of product function realization degree | 6.13 | 6.72 | 6.26 |
Appendix D. Comparison with Information Axiom
| Scheme | Scheme 1 | Scheme 2 | Scheme 3 | |
|---|---|---|---|---|
| total function realization probability | experiment of physical prototype | 83.29% | 86.67% | 81.94% |
| DMDCC | 86.34% | 89.13% | 84.27% | |
| information axiom | 79.49% | 83.96% | 78.86% | |
References
- Zurita, N.S.; Colby, M.K.; Tumer, I.Y.; Et, A. Design of Complex Engineered Systems Using Multi-Agent Coordination. J. Comput. Inf. Sci. Eng. 2017, 18, 11003. [Google Scholar] [CrossRef] [Green Version]
- Ming, Z.; Nellippallil, A.B.; Yan, Y.; Wang, G.; Goh, C.H.; Allen, J.K.; Mistree, F. PDSIDES-A Knowledge-Based Platform for Decision Support in the Design of Engineering Systems. J. Comput. Inf. Sci. Eng. 2018, 18, 041001. [Google Scholar] [CrossRef]
- Rehman, F.; Yan, X. A Case Study to Support Conceptual Design Decision Making Using Context Knowledge. In Advanced Design and Manufacture to Gain a Competitive Edge; Springer: Berlin/Heidelberg, Germany, 2008; pp. 13–22. [Google Scholar]
- Jing, L.; Zhan, Y.; Li, Q.; Peng, X.; Li, J.; Gao, F.; Jiang, S. An integrated product conceptual scheme decision approach based on Shapley value method and fuzzy logic for economic-technical objectives trade-off under uncertainty. Comput. Ind. Eng. 2021, 156, 107281. [Google Scholar] [CrossRef]
- Girodon, J.; Monticolo, D.; Bonjour, E.; Perrier, M. An organizational approach to designing an intelligent knowledge-based system: Application to the decision-making process in design projects. Adv. Eng. Inform. 2015, 29, 696–713. [Google Scholar] [CrossRef]
- Wang, Y.; Yu, S.; Ma, N.; Wang, J.; Hu, Z.; Liu, Z.; He, J. Prediction of product design decision Making: An investigation of eye movements and EEG features. Adv. Eng. Inform. 2020, 45, 101095. [Google Scholar] [CrossRef]
- Qi, J.; Hu, J.; Peng, Y. Integrated rough VIKOR for customer-involved design concept evaluation combining with customers’ preferences and designers’ perceptions. Adv. Eng. Inform. 2020, 46, 101138. [Google Scholar] [CrossRef]
- Wang, H.; Duanmu, L.; Lahdelma, R.; Li, X. A fuzzy-grey multicriteria decision making model for district heating system. Appl. Therm. Eng. 2018, 128, 1051–1061. [Google Scholar] [CrossRef]
- Zhang, X.; Qu, Y.; Tong, S. Evaluating New Product Alternatives in Case of Uncertain Targets and Product Attributes. Oper. Res. Manag. Sci. 2020, 29, 166–174. [Google Scholar] [CrossRef]
- Li, W.; Ren, X.; Ding, S.; Dong, L. A multi-criterion decision making for sustainability assessment of hydrogen production technologies based on objective grey relational analysis. Int. J. Hydrogen Energy 2020, 45, 34385–34395. [Google Scholar] [CrossRef]
- Wang, H.; Fang, Z.; Wang, D.; Liu, S. An integrated fuzzy QFD and grey decision-making approach for supply chain collaborative quality design of large complex products. Comput. Ind. Eng. 2020, 140, 106212. [Google Scholar] [CrossRef]
- Wang, P.; Meng, P.; Zhai, J.; Zhu, Z. A hybrid method using experiment design and grey relational analysis for multiple criteria decision making problems. Knowl. Based Syst. 2013, 53, 100–107. [Google Scholar] [CrossRef]
- Yurdakul, M.; Tansel, İ.Ç.Y. Application of correlation test to criteria selection for multi criteria decision making (MCDM) models. Int. J. Adv. Manuf. Technol. 2009, 40, 403–412. [Google Scholar] [CrossRef]
- Suh, N. Axiomatic Design: Advances and Applications; Oxford University Press: New York, NY, USA, 2001. [Google Scholar]
- Chen, D.; Chu, X.; Feng, T.; Li, Y.; Zuo, G. Product-service system evaluation based on information axiom in hybrid uncertain environment. Comput. Integr. Manuf. Syst. 2014, 20, 2071–2078. [Google Scholar] [CrossRef]
- Zhang, R.; Qiu, J.; Jia, Q.; Wang, X.; Dong, M. An improved fuzzy evaluation method for design schemes based on the information axiom. Int. J. Comput. Integr. Manuf. 2014, 27, 1067–1078. [Google Scholar] [CrossRef]
- He, Q.; Zhang, R.J.; Guo, N.; Cong, D.S.; Qiu, J.W. Fuzzy Information Axiom in Conceptual Design Scheme Evaluation of Handling Equipments. Adv. Mater. Res. 2013, 605–607, 263–266. [Google Scholar] [CrossRef]
- Tian, Q.; Xiao, R.; Zhong, Y.; Du, Y.; Yang, H. Evaluation Schemes Method for Design Based on Information Axiom and Fuzzy Mathematics. Trans. Chin. Soc. Agric. Mach. 2008, 39, 136–140. [Google Scholar]
- Wang, X.; Tang, D.; Lou, P. Multi-attribute Decision Making Method Based on Design Axioms. J. Southwest Jiaotong Univ. 2008, 43, 392–397. [Google Scholar] [CrossRef]
- Xiao, R.; Cheng, X.; Liao, X. Evaluation method and its application for design scheme based on fuzzy information axiom. Comput. Integr. Manuf. Syst. 2007, 2331–2338. [Google Scholar] [CrossRef]
- Suh, N.P. Complexity: Theory and Applications; Oxford University Press: Oxford, UK, 2005. [Google Scholar]
- Zhang, P.; Wang, Z.; Zhao, B.; Wang, T.; Tan, R. Review of the research on disruptive innovation theory. J. Mach. Des. 2018, 35, 1–6. [Google Scholar] [CrossRef]
- Zhang, P.; Dong, Y.; Zhang, H.; Zhang, J.; Tan, R. Decomposition Process Model for Complex Electromechanical Based on Design-centric Complexity and TRIZ. J. Mech. Eng. 2016, 52, 17–24. [Google Scholar] [CrossRef]
- Zhang, P.; Zhang, J.; Dong, Y.; Zhang, H.; Tan, R. Analysis process model of design-centric complexity based on additional effect. Comput. Integr. Manuf. Syst. 2018, 24, 444–454. [Google Scholar] [CrossRef]
- Zhang, P.; Yang, B.; Zhang, H.; Tan, R. Conflict determination oriented to CAI based on designrcentric complexity. Comput. Integr. Manuf. Syst. 2013, 19, 330–337. [Google Scholar] [CrossRef]
- Cao, D.; Tan, R.; Yuan, C.; Zhang, J. Conceptual design of mechanical products based on function decomposition. J. Mech. Eng. 2001, 37, 13–17. [Google Scholar] [CrossRef]
- Tao, F.; Sui, F.; Liu, A.; Qi, Q.; Zhang, M.; Song, B.; Guo, Z.; Lu, S.C.Y.; Nee, A.Y.C. Digital twin-driven product design framework. Int. J. Prod. Res. 2019, 57, 3935–3953. [Google Scholar] [CrossRef] [Green Version]
- Zhang, K.; Qu, T.; Zhou, D.; Jiang, H.; Lin, Y.; Li, P.; Guo, H.; Liu, Y.; Li, C.; Huang, G.Q. Digital twin-based opti-state control method for a synchronized production operation system. Robot. Comput. Integr. Manuf. 2020, 63, 101892. [Google Scholar] [CrossRef]
- Lu, Y.; Liu, C.; Wang, K.I.; Huang, H.; Xu, X. Digital Twin-driven smart manufacturing: Connotation, reference model, applications and research issues. Robot. Comput. Integr. Manuf. 2020, 61, 101837. [Google Scholar] [CrossRef]
- Aivaliotis, P.; Georgoulias, K.; Chryssolouris, G. The use of Digital Twin for predictive maintenance in manufacturing. Int. J. Comput. Integr. Manuf. 2019, 32, 1067–1080. [Google Scholar] [CrossRef]
- Zhang, B.; Li, X.; Wan, X. From Digital Twin to Digital Engineering Modeling and Simulation Entering a New Era. J. Syst. Simul. 2019, 31, 369–376. [Google Scholar] [CrossRef]
- Karve, P.M.; Guo, Y.; Kapusuzoglu, B.; Mahadevan, S.; Haile, M.A. Digital twin approach for damage-tolerant mission planning under uncertainty. Eng. Fract. Mech. 2020, 225, 106766. [Google Scholar] [CrossRef]
- Francisco, A.; Mohammadi, N.; Taylor, J.E. Smart City Digital Twin-Enabled Energy Management: Toward Real-Time Urban Building Energy Benchmarking. J. Manag. Eng. 2020, 36, 04019045.1–04019045.11. [Google Scholar] [CrossRef]
- Zheng, Y.; Yang, S.; Cheng, H. An application framework of digital twin and its case study. J. Ambient. Intell. Humaniz. Comput. 2019, 10, 1141–1153. [Google Scholar] [CrossRef]
- Chakraborty, S.; Adhikari, S. Machine learning based digital twin for dynamical systems with multiple time-scales. Comput. Struct. 2021, 243, 106410. [Google Scholar] [CrossRef]
- Tao, F.; Liu, W.; Zhang, M. Five-dimension digital twin model and its ten applications. Comput. Integr. Manuf. Syst. 2019, 25, 1–18. [Google Scholar] [CrossRef]
- Nie, Z.; Zhang, P.; Wang, F.; Wang, Z. Sustainable innovation pathway for mechanical products by inducing characteristic parameters. Adv. Eng. Inform. 2021, 49, 101349. [Google Scholar] [CrossRef]
- Pylianidis, C.; Osinga, S.; Athanasiadis, I.N. Introducing digital twins to agriculture. Comput. Electron. Agric. 2021, 184, 105942. [Google Scholar] [CrossRef]
- Leong, W.D.; Teng, S.Y.; How, B.S.; Ngan, S.L.; Lam, H.L.; Tan, C.P.; Ponnambalam, S.G. Adaptive analytical approach to lean and green operations. J. Clean. Prod. 2019, 235, 190–209. [Google Scholar] [CrossRef] [Green Version]
- Kusiak, A. Smart manufacturing must embrace big data. Nature 2017, 544, 23–25. [Google Scholar] [CrossRef] [PubMed]
- Ji, W.; Yin, S.; Wang, L. A big data analytics based machining optimisation approach. J. Intell. Manuf. 2019, 30, 1483–1495. [Google Scholar] [CrossRef] [Green Version]
- Teng, S.Y.; How, B.S.; Leong, W.D.; Teoh, J.H.; Siang Cheah, A.C.; Motavasel, Z.; Lam, H.L. Principal component analysis-aided statistical process optimisation (PASPO) for process improvement in industrial refineries. J. Clean. Prod. 2019, 225, 359–375. [Google Scholar] [CrossRef] [Green Version]
- Wang, K.; Tan, R.; Peng, Q.; Wang, F.; Shao, P.; Gao, Z. A holistic method of complex product development based on a neural network-aided technological evolution system. Adv. Eng. Inform. 2021, 48, 101294. [Google Scholar] [CrossRef]
- Kang, M.; Shao, B.; Zhu, Y.; Chen, C.; Wang, T. Comparison of multiple nonlinear regression model and BP neural network model for landslide slip distance prediction. Geol. Bull. China 2021, 1–12. [Google Scholar]
- Bui, D.T.; Nhu, V.H.; Hoang, N.D. Prediction of soil compression coefficient for urban housing project using novel integration machine learning approach of swarm intelligence and Multi-layer Perceptron Neural Network. Adv. Eng. Inform. 2018, 38, 593–604. [Google Scholar] [CrossRef]
- Zhang, P.; Jing, S.H.; Nie, Z.F.; Al, E. Design and Development of Sustainable Product Service Systems Based on Design-Centric Complexity. Sustainability 2021, 13, 532. [Google Scholar] [CrossRef]
- Zhang, P.; Tan, R. Method of Establish Functional Period Assisted by TRIZ. J. Mech. Eng. 2012, 48, 78–85. [Google Scholar] [CrossRef]
- Chou, C.; Chen, C.; Conley, C. An approach to assessing sustainable product-service systems. J. Clean. Prod. 2015, 86, 277–284. [Google Scholar] [CrossRef]
- Bertolini, M.; Braglia, M.; Carmignani, G. Application of the AHP methodology in making a proposal for a public work contract. Int. J. Proj. Manag. 2006, 24, 422–430. [Google Scholar] [CrossRef]


| Function Unit | Component | Physical Parameters |
|---|---|---|
| Separate TCM | Screw feeding barrel, discharge drum, spiral blade | Outlet size, spiral blade thickness, inner diameter of spiral blade, outer diameter of spiral blade, cylinder wall finish, clearance between blade and feeding barrel, corner, speed, temperature, humidity, particle size of traditional Chinese medicine, density of traditional Chinese medicine, rated weight |
| Collect TCM | Medicine box | Height of medicine box, width of medicine box, distance between discharge port and conveyor belt, positioning accuracy of medicine box, temperature, humidity, rated weight, disintegrating slag rate |
| Output TCM | Synchronous wheel, synchronous belt, roller, conveyor belt, medicine box | Height of medicine box, width of medicine box, distance between discharge port and conveyor belt, reduction ratio, conveyor belt surface characteristic parameters, positioning accuracy of conveyor belt, speed of conveyor belt, temperature, humidity, rated weight, disintegrating slag rate |
| Function Unit FR | Relative Deviation of Function Unit (%) | Standard Deviation of Function Unit (%) | Coupling Coefficient |
|---|---|---|---|
| Separate TCM | 9.69 | 1.17 | 0 |
| Collect TCM | 2.88 | 3.3 | 0.630 |
| Output TCM | 8.4 | 2.48 |
Publisher’s Note: MDPI stays neutral with regard to jurisdictional claims in published maps and institutional affiliations. |
© 2022 by the authors. Licensee MDPI, Basel, Switzerland. This article is an open access article distributed under the terms and conditions of the Creative Commons Attribution (CC BY) license (https://creativecommons.org/licenses/by/4.0/).
Share and Cite
Zhang, P.; Chen, S.; Zhao, B.; Nie, Z. Research on Decision Making of Design for Coupling System Based on Complexity Composite. Processes 2022, 10, 542. https://doi.org/10.3390/pr10030542
Zhang P, Chen S, Zhao B, Nie Z. Research on Decision Making of Design for Coupling System Based on Complexity Composite. Processes. 2022; 10(3):542. https://doi.org/10.3390/pr10030542
Chicago/Turabian StyleZhang, Peng, Shaohan Chen, Boyuan Zhao, and Zifeng Nie. 2022. "Research on Decision Making of Design for Coupling System Based on Complexity Composite" Processes 10, no. 3: 542. https://doi.org/10.3390/pr10030542
APA StyleZhang, P., Chen, S., Zhao, B., & Nie, Z. (2022). Research on Decision Making of Design for Coupling System Based on Complexity Composite. Processes, 10(3), 542. https://doi.org/10.3390/pr10030542