Abstract
Over the last decade, the conical mill has emerged as a potential piece of equipment to use for continuous dry coating pharmaceutical powders. In this work, silicon dioxide was used as a guest particle on two excipients, fast flow lactose (FFL) and grade PH200 microcrystalline cellulose (MCC), for dry coating by a conical mill with a modified screen that permitted batch and continuous mode operation. Samples were pre-processed in a V-blender. SEM images, particle size distribution, and EDS mapping were used to characterise the treated powders. Pre-processed samples showed some discrete coating of the host particle. After batch processing, the samples were covered with a complete coating. When processed at high impeller speed, coating of FFL was a mix of A200P and FFL fines generated by attrition. Continuous mode processed samples, which had a lower processing time, were coated discretely and showed a better coating than the pre-processed samples. Increasing guest/host mass ratio with FFL host particle had a positive impact on the quality of the coating. These results help to build the case that the processing time of the conical mill is a key parameter to the success of the conical mill as dry coating equipment in the pharmaceutical industry.
1. Introduction
Dry coating is a method that relies on the use of guest particles with specific properties to cover the surface of the host particle. The potential it has to modify flow and surface properties of APIs and excipients is the reason why interest has grown in the pharmaceutical industry for this method since the early 2000s [1,2]. Moreover, it can be used to create a process where dry coated powders are directly compressible [3,4,5]. This can help to save costs related to the drying step following wet granulation as well as to treat heat and/or moisture sensitive drugs without loosing compressibility, a disadvantage of dry granulation [6].
Additionally, continuous manufacturing is highly desired by regulatory agencies at it is amenable to the development of drug products by quality-by-design and the application of process analytical technologies to monitor quality [7,8,9]. The initiatives reported by some pharmaceutical companies offer several advantages regarding the dry coating process: (a) more compact equipment size and layouts for longer periods of time; (b) reduced space and utility costs; (c) reduction in overall operating costs; (d) more consistent product quality with tighter specifications [10].
It is apparent in the literature that over time, various equipment types have been used to achieve dry coating. Magnetically assisted impaction coating (MAIC), as its name suggest, uses a magnetic field to agitate magnetic particles. The particles’ energy is then transferred to the powders present in the chamber that produces dry coating [11,12,13]. The high intensity vibrational mixer sometimes, also referred to as the LabRam, uses acoustic resonance to vibrate the chamber. The intense mixing generated in the equipment causes dry coating of the host particles [5,14,15,16]. The fluid energy mill (FEM), uses a high-pressure gas to generate a vortex in its chamber. Contacts between the particles and walls of the chamber at high velocity both grinds and dry coats the host particles [4,14,17]. Good results were obtained with these three types of equipment. A point of interest for dry coating APIs and excipients is using it for continuous mode manufacturing. The MAIC and FEM are compatible with continuous mode manufacturing, but they each present some limitations. Another type of mill, the conical mill has also attracted the interest of some research groups for dry coating over the last ten years [3,4,13,14,18,19,20,21,22,23,24]. Already used in the pharmaceutical industry for particle size reduction, this equipment has a conical chamber with a screen wall and an impeller at its center. Various parameters such as the speed of the impeller, type of host particle, screen hole size, and number of passes through the conical mill were studied in the literature. Only one of those parameters had an impact on processing time, i.e., the number of passes in the conical mill. In some cases over 10 passes in the conical mill were needed to achieve an optimal flow improvements [18,23]. Recently an article published by Capece et al. [25] worked on a new parameter to help increase the processing time in a different way: the open area of the conical mill’s screen. The screen openings were partially covered, leading to an increase in the mean residence time of the particles. This was found to positively affect the flow properties of the tested host particles.
The objective of this study is to compare the batch and continuous processing time on the efficiency of the conical mill. In some preliminary sets of experiments, the conical mill was tested in a batch process by covering up the screen in order to directly control the processing time and to establish what level of coating is achieved in this controlled setting. Afterwards, a second set of experiments were run with a partially covered screen and with the same processing parameters. Coating, in both batch and continuous mode, could then be compared. It is also important to add that improving flow properties was not an objective of this study.
2. Materials and Methods
2.1. Materials
Spray dried lactose (grade 316, Kerry Inc., Beloit, WI, USA) and microcrystalline cellulose (grade PH200, JRS Pharma, Holzmühle, ON, Canada) were selected as host particles. All host particles were sieved between 150 and 300 µm prior to their use. Different lots of both host particles were used for the batch mode and continuous mode tests. Silicon dioxide (Aerosil 200 P (A200P) grade, Evonik Industries AG, Essen, Germany) was used as a guest particle.
2.2. Methods
All samples were pre-mixed in a V-shaped lab scale mixer (Blend Master, Patterson Kelly Co., East Stroudsburg, PA, USA) for 5 min at 12 rpm. Host particles were first weighed and then the amount of A200P needed to reflect the mass/mass ratio was added. For the test, 1.0% guest/host mass ratio was used with both host particles, which is a standard value used in literature [4,13,14,18,20,21]. Additionally, a 1.5% guest/host mass ratio and a 0.5% guest/host ratio were used for both FFL and MCC, respectively. Next, the V-Blender mixed samples were processed for dry-coating by using an under-driven conical mill, model U5 (Quadro Engineering, Waterloo, ON, Canada) with a round edge impeller and a 457 µm round hole screen. Impeller speeds of 476 rpm (1.87 m/s) and 1762 rpm (6.92 m/s) were used for all experiments. The 476 rpm speed was chosen because it was the lowest possible speed with the conical mill used and the coating at a low speed had been achieved in a previous study [21]. The 1762 rpm speed was chosen after discussion with Quadro Engineering’s engineers who noted that 7 m/s is the low-end speed recommended for particle breakage. In the literature, similar speed was usually used [18,19,20,25]. For batch experimentations, aluminium foil tape was placed on the outer surface of the screen to prevent particles from escaping the chamber. A sample size of 45 g for the FFL and 25 g for the MCC and processing time in the batch conical mill was 5 min or 10 min. Powder was added in the chamber prior to sample run. For continuous experiments, the lower half of the conical mill screen was covered with aluminium foil tape. This section was chosen following the observation that the particles were pushed upwards during processing, and this prevented mass holdup in the equipment chamber. Samples sizes were 150 g for FFL and 100 g for MCC. Samples were run for 4 cycles. Each cycle followed these steps:
- Conical mill was started.
- After the speed of the impeller had stabilized, the sample was poured into the feed chute.
- When the whole sample was processed, the conical mill was stopped.
- A sample was collected from the collecting bin.
- The powder from the collecting bin was transferred to a clean bin to start the next cycle.
Experimental conditions are summarized in Table 1.

Table 1.
Summary of the experimental conditions.
Even if it was not within the objectives of this study to improve flow properties, they were analyzed with a FT4 powder rheometer© (Freeman Technology, Tewkesbury, Gloucestershire, UK). The stability and variable flow rate method, as well as the shear cell method were used [26,27]. Variations of all samples were within the error bars. Particle flow properties were conserved for all samples. Thus, these results are not presented in this article.
2.2.1. Particle Size Analysis
Particle size distribution was acquired using a laser diffraction particle size analyzer (Mastersizer 3000) (Malvern Panalytical, Malvern, Worcestershire, UK) coupled with a high energy venturi nozzle and a vibrating tray for dry particle analysis. Samples were measured five times and calculations were done using Mastersizer 3000 software (version 3.81). Due to an error in the lower obscuration limit leading to artefacts in the results, data from 3 to 5 inner detectors was removed. This was suggested by Malvern technical support after consultation. Further details are provided Appendix A.
2.2.2. Microscopy and Chemical Surface Analysis
Scanning electron microscopy (SEM) images were acquired with a field emission gun scanning electron microscope (S-4700, Hitachi, Tokyo, Japan) using an electron beam voltage of 3.0 kV. The same scanning electron microscope was also used for energy-dispersive X-ray spectroscopy (EDS) mappings. An X-Max 50 detector (Oxford Instruments, Abingdon, Oxfordshire, UK) was used with an electron beam voltage of 10 kV and a working distance of 12.0 mm. All samples were sputter-coated (Hummer® VI, Anatech, Sparks, NV, USA) with a fine gold/palladium layer to help conductivity and prevent charging.
3. Results and Discussion
A discussion about the batch mode results and then followed by a discussion of the continuous mode will be presented next. Various results presented in this section will help to validate the efficacy of the conical mill for dry coating pharmaceutical excipients.
3.1. Batch Mode Experimentations
The literature shows that the conical mill leads to dry coating of pharmaceutical powders as a continuous mode equipment [3,4,13,14,18,19,20,21,22,23,24,25]. In some of those studies, the conical mill is compared to other types of equipment capable of dry coating [4,13,14]. The issue with these comparisons is that the processing time for some equipment is not equivalent. Processing for batch equipment, for example, is usually executed in terms of minutes while mean residence time in the conical mill is less than a second [25]. To help validate the potential of the conical mill as dry coating equipment, the equipment was modified, as specified earlier, to test it as a batch dry coating equipment. The Section 3.1.1 details experimental runs where no guest particles were added to investigate the effects of the conical mill on the host particles. In Section 3.1.2, A200P was added to assess dry coating.
3.1.1. Host Particles Only
For these experiments, only particle size distributions were evaluated. They are presented in Table 2. Graphical representations of the d10, d50, and d90 values with the measure error are also available in the Supplementary Materials. The presented variation of the percentage in various columns is always in proportion to the raw host particle sieved between 150 to 300 µm. All particle size distributions were normally distributed.
Table 2.
Particle size distribution results of the preliminary batch mode experimentations.
Since the conical mill was not used for its typical size reduction application. The goal, instead, was to increase particle or minimally maintain particle size distribution after processing. The first general trend that can be observed is that higher impeller speed leads to particle attrition regardless of the host particle. Rows 2 and 3 (impeller speed = 476 rpm) of the FFL/None and MCC/None sections have higher d10 values than rows 4 and 5 (impeller speed = 1762 rpm). Moreover, increasing the processing time led to more fine generation. The two tested host-particles did not react the same way when processed at 476 rpm. Indeed, the general size of the FFL host particle increased. While for the MCC host particle, only the d10 value increased and there was little to no variation in the d50 and d90 values. It is suspected that larger particles break into fine particles that are bigger than the d10 of the unprocessed sample.
3.1.2. Host Particles with 1.0% A200P
For the tests that involved dry coating with different particles containing 1.0% A200P (host and guest), particle size distributions (Table 2) and imaging analysis (Figure 1) were acquired. To be consistent with the previous sub-section, all variation percentages are related to the raw host particles that were sieved between 150 to 300 µm. The size distribution of the first sample with A200P for both FFL and MCC host particles (V-Blender mix) was acquired after mixing in the V-Blender. A large drop in the d10 size was observed for this sample. This can be explained by the addition of the silica guest particles. The same trend related to the impeller speed identified in the previous sub-section was observed after mixing the host particles with 1.0% A200P. Higher impeller speed led to more fine particles. Moreover, all the FFL/1.0%A200P samples showed a significant increase in d10 when compared to the V-Blender mix sample. Since the equipment was operated in a batch mode and that no mass was lost in the process, it is suspected that fine particles dry coated the surface of the host FFL particles. This is confirmed via SEM pictures that are presented in Figure 1. When comparing Figure 1a with the Figure 1b, it can be observed that the surface of the FFL host particle was modified as soon as it was mixed with A200P. Some small guest particles can be observed. Things are different for samples processed in the conical mill. Figure 1c shows smooth continuous coating of the host particles. For the sample processed at 1762 rpm, Figure 1d, it shows a similar type of coating but also exhibits another type of fine particles on their surface. Those larger fine particles are suspected to be FFL. A similar situation can be observed with the raw FFL host particle shown on Figure 1a as the fine particles are present on the particle surface. The higher impeller speed of the sample shown on Figure 1d lead to fine particle generation that then coated the host particle. As for the processing time variable, no notable difference can be observed with the results presented in Table 2 as with other images acquired.
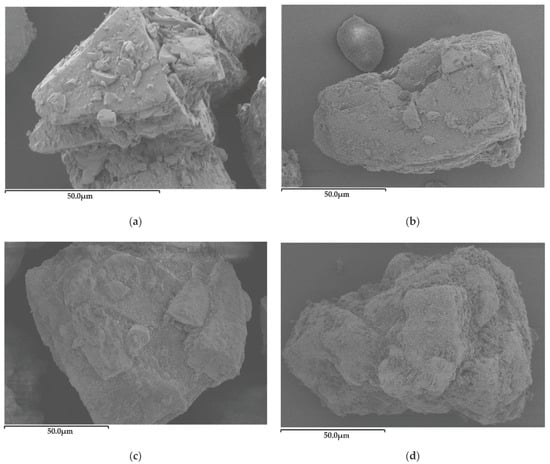
Figure 1.
SEM images at 1 K magnification of (a) unprocessed FFL particle at 1.5 K magnification and FFL host particles with 1.0% A200P; (b) after mixing in a V-Blender and after processing in the conical mill 10 min; (c) at 476 rpm; and (d) at 1762 rpm.
For the MCC host particles results shown in Table 2, an increase of the whole particle size distribution is observed when processed at 476 rpm. The d10 value is close to the raw MCC particles which is suspected to be A200P coating. The processing time had little effect on the results. Samples processed at the same speed but during different times are within each other’s error bar as seen on the Supplementary Materials Figure S4. When processed at 1762 rpm, the distribution was similar to the sample mixed in the V-Blender. MEB images were also acquired following experimentations, but particle charging lead to low quality images. Some observations were still possible as particle attrition was due to processing at 1762 rpm was observed due to the presence of small needle shaped MCC host particles. Those smaller host particles were still coated with A200P. The SEM photos also showed similar A200P coating to the 476 rpm FFL samples for the 476 rpm MCC samples.
This preliminary set of experiment shows that when used in a batch mode, the conical mill can lead to good dry coating due to the large processing time.
3.2. Continuous Mode Experimentations
To increase the processing time, a typical practice in the literature was to run the sample multiple times in the conical mill [18,22,23,24]. The problem with this practice is related to the process from a manufacturing perspective as it adds recirculation steps, resulting in higher manipulation/contamination/cost. Another way to increase processing time, which was presented recently in the literature, is to partially cover the screen of the mill [25]. Both practices were combined in the continuous mode experimentations presented in this section. Table 3 and Table 4 show the particles’ size distribution results for the FFL host particle and the MCC host particle, respectively. The presentation is the same as seen in Table 2, the variation percentage for the distributions are related to the raw host particles that were sieved between 150 to 300 µm. Again, all particles’ size distributions were normally distributed. Graphical representations of the d10, d50, and d90 values with measurement errors are also available in the Supplementary Materials. Similar observations can also be made for the values for the d10, d50 and d90 all reduce after mixing with A200P, in fact, the d10 value reduces by the largest value as was noted in the previous section.
Table 3.
FFL particle size distribution results of the continuous mode experimentations.
3.2.1. FFL Host Particle Results
First, particle size distribution values presented in Table 3 show a difference with Table 2 results regarding the impact of the higher impeller speed of 1762 rpm. It can be observed that the higher speed of the impeller, 1762 rpm, does not lead to fine particle generation. The d10 values for the high-speed samples are all higher than the 476 rpm samples regardless of the host particle ratio. Another trend that can be observed is that each pass in the conical mill leads to an increase in d10 value, moving it closer to the raw host particle. This shows that even with the higher residence time due to the partially covered screen, additional passes still have a positive effect on the d10 values. As for the d50 and d90 values variations are small to non-existent. When increasing the weight/weight ratio of A200P in the samples to 1.5%, particle size data from Table 3 show the same trends related to impeller speed and passes in the conical mill. The major difference in the values is due to an increased amount of A200P. Trends are similar, but the caused variation is bigger especially when looking at d10 values. To help access the coating of the FFL host particles, Figure 2 and Figure 3 show SEM images (top column) and EDS mappings (bottom column).
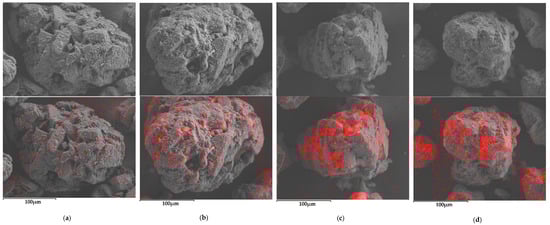
Figure 2.
SEM (top) and EDS mapping (bottom) at 1 K magnification of (a) unprocessed FFL particle and FFL particle with 1.0% A200P, (b) after mixing in a V-Blender, after processing in the conical mill 4 times at (c) 476 rpm and (d) 1762 rpm. Red dots on bottom row are EDS mapping results of silicon.
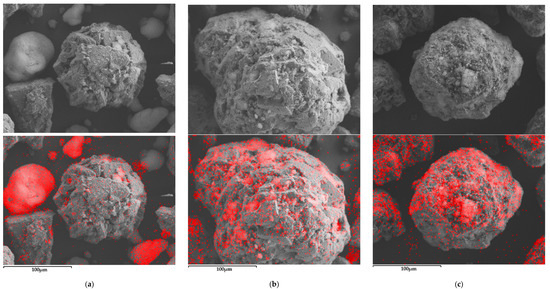
Figure 3.
SEM (top) and EDS mapping (bottom) at 1 K magnification of FFL particles with 1.5% A200P (a) after mixing in a V-Blender, after processing in the conical mill 4 times at (b) 476 rpm and (c) 1762 rpm. Red dots on bottom row are EDS mapping results of silicon.
The first column of Figure 2 presents a raw host particle. As with the raw host particle shown on Figure 1a, FFL fine particles can be observed on the surface. For the EDS mapping, red points associated to silicon are observed randomly on the surface of the particles and thus, are considered as measurement noise. Moreover, the other columns in Figure 2 show concentrated red dots that can also be identified as A200P when looking at the regular SEM image. This helps to confirm that the fine particles observed in Figure 2a are fine FFL particles. The particle shown on Figure 2b presents some white spots that look like A200P aggregates. These spots can be confirmed as the guest particle because of the concentrated dot present on the EDS mapping. Note that the bottom part of the EDS mapping shows fewer red points. This is because of the position of the detector. It sits at an angle north of the sample and not directly over it. This causes very low to no signal acquisition in some areas during EDS mapping. The two other columns, Figure 2c,d do not present aggregates like the ones observed on Figure 2b. A few patches that are similar to the coating of Figure 1c,d are observed. There is also a progression in the concentration of the red spots associated to the guest particles.
For Figure 3, only three columns are present as the host particle is the same and was already present in Figure 2a. Figure 3a has similarities to Figure 2b, with white spots on the surface of the host particle. Large A200P aggregates are also observed. A combination of smaller aggregates, as well as coating patches are observed on Figure 3b. As for Figure 3c, the particle has rounder edges and a uniform coating that is similar. No A200P aggregates are observed. When compared to results from Figure 2, the higher mass ratio of A200P did lead to a more uniform coating of the FFL host particles.
A difference is observed between Figure 2 and Figure 3 and the results from the batch tests shown in Figure 1. Samples processed at 1762 rpm do not have FFL fines on their surface. Two factors were hypothesized for this observation. First, processing time is lower when compared to the batch process and leads to less attrition. Multiple passes in the conical mill and the partially covered screen help increase the processing time but it does not compare to the processing time used in the batch experimentations. Secondly, as mentioned in Section 2.1, different lots of products were used for both batch and continuous experiments. Besides, no quantitative analysis was run to assess the coverage of the host particles by using the EDS mapping data. Still, the partially covered screen leads to coating with A200P of the host FFL particle even after only mixing in the V-Blender. Processing in the conical mill then leads to a coating free of agglomerates and is better spread out on the surface of the host particles.
3.2.2. MCC Host Particle Results
Particle size distribution results for continuous experimentation with MCC as a host particle are presented in Table 4. An initial observation that can be made is that unlike with the FFL host particle, there is no trend in the d10 value that can be linked to the number of passes in the conical mill. The second pass d10 value is either a low point for samples with 1.0% A200P or a high point for samples processed with 0.5% A200P. Secondly, it is harder to assess the influence of the impeller speed on the results of the particle size distributions. The differences between the samples processed at the two speeds are within error bars as seen in the graphs presented in Supplementary Materials. They cannot be compared to the difference for FFL host particles processed under the same conditions and the batch experimentations with the MCC host particles. Still Figure 4 shows that the coating of the host particles is achieved. An unprocessed host particle is shown in the first column, Figure 4a. First, the surface of the MCC is different than the FFL as it does not present flat surfaces as observed on Figure 1a and Figure 2a. Moreover, the red dots present in this EDS mapping are considered as noise as they are randomly scattered over the sample. After mixing with A200P in the V-blender a few aggregates are observable on the surface as seen on Figure 4b. There is a small increase of the red silicon dots other than the two spots related to those aggregates. After processing in the conical mill, the condition is not the same as more dots are visible on the surface of the particles shown in Figure 4c,d. No A200P aggregates are observed on the surface but small patches are visible. They are harder to observe on the SEM image when compared to Figure 2c,d because of the rugged surface of the MCC host particles. SEM images and EDS mapping were also acquired for the MCC host particles mixed with 0.5% A200P. Less coating of the particles was observed. It was decided not to present these images as they show no additional information.
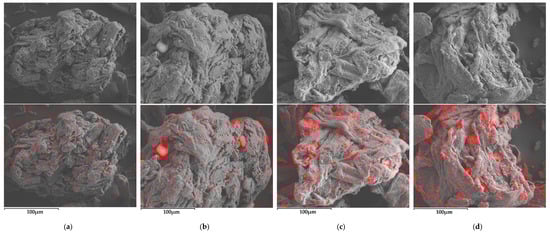
Figure 4.
SEM (top) and EDS mapping (bottom) at 1 K magnification of (a) unprocessed MCC particle and MCC particle with 1.0% A200P (b) after mixing in a V-Blender, after processing in the conical mill 4 times at (c) 476 rpm and (d) 1762 rpm. Red dots on bottom row are EDS mapping results of silicon.
Table 4.
MCC particle size distribution results of the continuous mode experimentations.
Table 4.
MCC particle size distribution results of the continuous mode experimentations.
| Host/Guest Particle | Impeller Speed (rpm) | Pass through Conical Mill | d10 | d10 var % | d50 | d50 var % | d90 | d90 var % |
|---|---|---|---|---|---|---|---|---|
| MCC/None | N/A | N/A | 48.6 | N/A | 196 | N/A | 363 | N/A |
| MCC/1.0% A200P | V-Blender Mix | N/A | 36.1 | −26% | 195 | −1% | 372 | 2% |
| 476 | 1 | 39.4 | −19% | 190 | −3% | 360 | −1% | |
| 2 | 38.2 | −21% | 180 | −8% | 343 | −6% | ||
| 3 | 40.9 | −16% | 186 | −5% | 349 | −4% | ||
| 4 | 41.6 | −14% | 182 | −7% | 340 | −6% | ||
| 1762 | 1 | 44.3 | −9% | 199 | 2% | 372 | 2% | |
| 2 | 40.1 | −17% | 180 | −8% | 344 | −5% | ||
| 3 | 43.2 | −11% | 185 | −6% | 346 | −5% | ||
| 4 | 43.2 | −11% | 182 | −7% | 341 | −6% | ||
| MCC/0.5% A200P | V-Blender Mix | N/A | 44.9 | −8% | 197 | 1% | 369 | 2% |
| 476 | 1 | 50.4 | 4% | 195 | −1% | 356 | −2% | |
| 2 | 53.4 | 10% | 198 | 1% | 359 | −1% | ||
| 3 | 49.0 | 1% | 191 | −3% | 355 | −2% | ||
| 4 | 48.9 | 1% | 189 | −4% | 348 | −4% | ||
| 1762 | 1 | 46.2 | −5% | 193 | −2% | 361 | −1% | |
| 2 | 51.8 | 7% | 200 | 2% | 365 | 1% | ||
| 3 | 45.8 | −6% | 185 | −6% | 344 | −5% | ||
| 4 | 46.7 | −4% | 184 | −6% | 340 | −6% |
4. Conclusions
This research study introduced new excipients to dry particle coating with a conical mill and tested new processing parameters: lower impeller speed and reduced open area of the screen. Batch experimentations with a fully covered conical mill screen acted as a first proof that increasing processing time led to a good coverage of the host particles. On the other hand, an impeller speed that is too high can lead to particle attrition. When looking at the FFL host particles processed in batch mode, the fine particles generated coated the surface of the host particles. With the purpose in mind to obtain a similar quality of coating in a continuous mode, the screen was partially covered. Results show this was partially achieved. Host particles were coated with A200P yet the coverage was not as good as the one observed in batch mode. The coating that is most similar to the batch experiments occurred when the mass ratio of the guest host particle was increased to 1.5%. Furthermore, some coating after only mixing in the V-Blender was observed but it was mostly with A200P aggregates and it was low when compared to the conical mill processed samples The self coating effect of the FFL particles when processed at 1762 rpm in batch mode, was not observed in continuous mode. For the MCC host particle, particle size distribution results showed little to no variation regardless of the processing parameters. Still, SEM and EDS images showed some coating of the host particles. This work helps to build the case of partially covering the conical mill screen as a method to increase the processing time of each pass and thus improving the quality of dry coating. More work needs to be done to continue to improve this technique to one day implement it in a full-scale process. As EDS mapping were only examined in a qualitative way, an analysis method to quantify the coating of the host particle using these mappings would be a great tool to access coating of future experiments.
Supplementary Materials
The following are available online at https://www.mdpi.com/article/10.3390/pr10030540/s1. Supplementary Materials shows other graphs that were prepared to analyse the d10, d50, and d90 values for all the samples presented in this paper. The graph visualisation also includes the measure error for each measurement.
Author Contributions
Conceptualization: W.R., I.E.A. and N.A.; methodology: W.R., S.H. and N.A.; project discussion and validation: W.R., I.E.A. and N.A.; formal analysis: W.R.; writing—original draft preparation: W.R.; writing—review and editing: W.R., I.E.A. and S.H.; supervision: I.E.A. and N.A.; project creation: S.H. and N.A.; project administration: J.-S.S. and N.A.; funding acquisition: J.-S.S. and N.A. All authors have read and agreed to the published version of the manuscript.
Funding
This research was funded by Natural Sciences and Engineering Research Council of Canada and Pfizer Canada through their participation in the Chaire Pfizer sur les proceeds et technologies d’analyses en génie pharmaceutique, grant number: RDCPJ 522450-17.
Institutional Review Board Statement
Not applicable.
Informed Consent Statement
Not applicable.
Data Availability Statement
Not applicable.
Acknowledgments
The authors would also like to acknowledge the work of the technicians at Université de Sherbrooke’s PRAM (Platform of Research and Analysis of Materials) as well as Louis Fradette for the access to the CREPEC installations.
Conflicts of Interest
The authors declare no conflict of interest. Publication of these results were approved by Pfizer Canada.
Appendix A. Ajustments to the Particle Size Analysis
As was explained in Section 2.2.1, results of the particle size analysis were adjusted following a setting error on the Mastersizer 3000. The error to the particle size distributions was discovered when plotting results. The red curve of Figure A1 shows an example of one of these results.
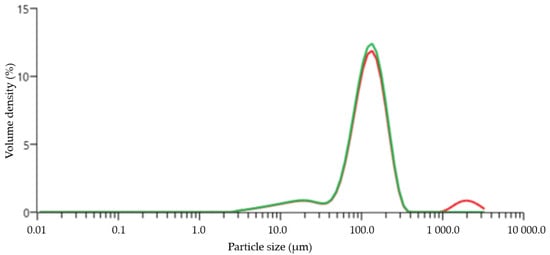
Figure A1.
Example of the error observed between a raw (red) and corrected (green) particle size distribution.
The peak observed over 1000 µm was not expected and should not be present of the graph. Samples had previously been processed in the conical mill which means they had gone trough the 476 µm screen. Moreover, visual inspection of the samples showed no agglomerates. Malvern Instruments technical support was contacted, and it was discovered that the lower obscuration parameter used during data acquisition was set to low at 0.1%. A low setting like the one used tends to let the instrument measure extremely low scattering signals. Those can be overwhelmed by inner detector noise, which leads to large particles being falsely detected. A higher obscuration limit between 1% and 2% for future experiments was recommended. For the data that was already acquired, an advanced parameter of the Malvern Mastersizer v3.81 software was used to correct errors. Malvern Instruments’s technical support suggested excluding 3 to 5 inner detectors. The green curve of Figure A1 shows the corrected result. The error is null for small particle sizes but for particles close to 100 µm the height of the peak is underestimated if no correction is made.
References
- Pfeffer, R.; Dave, R.N.; Wei, D.; Ramlakhan, M. Synthesis of engineered particulates with tailored properties using dry particle coating. Powder Technol. 2001, 117, 40–67. [Google Scholar] [CrossRef]
- Sharma, R.; Setia, G. Mechanical dry particle coating on cohesive pharmaceutical powders for improving flowability—A review. Powder Technol. 2019, 356, 458–479. [Google Scholar] [CrossRef]
- Yuan, J.; Shi, L.; Sun, W.-J.; Chen, J.; Zhou, Q.; Sun, C.C. Enabling direct compression of formulated Danshen powder by surface engineering. Powder Technol. 2013, 241, 211–218. [Google Scholar] [CrossRef]
- Han, X.; Ghoroi, C.; Davé, R. Dry coating of micronized API powders for improved Dissolution of directly compacted tablets with high drug loading. Int. J. Pharm. 2013, 442, 74–85. [Google Scholar] [CrossRef]
- Huang, Z.; Scicolone, J.V.; Han, X.; Davé, R.N. Improved blend and tablet properties of fine pharmaceutical powders via dry particle coating. Int. J. Pharm. 2015, 478, 447–455. [Google Scholar] [CrossRef] [PubMed]
- Bittorf, K.J.; Sanghvi, T.; Katstra, J.P. Design of Solid Dosage Formulations. In Chemical Engineering in the Pharmaceutical Industry; am Ende, D.J., am Ende, M.T., Eds.; John Wiley & Sons, Inc.: Hoboken, NJ, USA, 2019; pp. 19–52. [Google Scholar]
- Coperion, K.-T. Continuous Pharmaceutical Dry Granulation and Direct Compression Tableting Processes. Pharm. Online. Available online: https://www.pharmaceuticalonline.com/doc/continuous-pharmaceutical-dry-granulation-and-direct-compression-tableting-processes-0001 (accessed on 9 December 2021).
- Shah, A.V.; Serajuddin, A.T.M. Twin screw continuous wet granulation. In Handbook of Pharmaceutical Wet Granulation; Narang, A.S., Badawy, S.I.F., Eds.; Elsevier: Amsterdam, The Netherlands, 2019; pp. 791–823. [Google Scholar]
- Nuneviller, F.; Gonzalez, R.; Muppireddy, K.K.; Bhatia, I.; Paz, C.; Pattok, E. Evaluating Continuous Coating Parameters and Their Effects on Appearance (Surface Roughness) Using a High Productivity Film Coating System; Colorcon: Harleysville, PA, USA, 2017. [Google Scholar]
- Siew, A. Exploring the potential of continuous coating. Pharm. Technol. 2015, 39, 44–46. [Google Scholar]
- Jallo, L.J.; Ghoroi, C.; Gurumurthy, L.; Patel, U.; Davé, R.N. Improvement of flow and bulk density of pharmaceutical powders using surface modification. Int. J. Pharm. 2012, 423, 213–225. [Google Scholar] [CrossRef]
- Ghoroi, C.; Gurumurthy, L.; McDaniel, D.J.; Jallo, L.J.; Davé, R.N. Multi-faceted Characterization of pharmaceutical powders to discern the influence of surface modification. Powder Technol. 2013, 236, 63–74. [Google Scholar] [CrossRef]
- Huang, Z.; Scicolone, J.V.; Gurumuthy, L.; Davé, R.N. Flow and bulk density enhancements of pharmaceutical powders using a conical screen mill: A continuous dry coating device. Chem. Eng. Sci. 2015, 125, 209–224. [Google Scholar] [CrossRef]
- Chen, L.; He, Z.; Kunnath, K.; Zheng, K.; Kim, S.; Davé, R.N. Fine grade engineered microcrystalline cellulose excipients for direct compaction: Assessing suitability of different dry coating processes. Eur. J. Pharm. Sci. 2020, 151, 105408. [Google Scholar] [CrossRef]
- Zheng, K.; Kunnath, K.; Ling, Z.; Chen, L.; Davé, R.N. Influence of guest and host particle sizes on dry coating effectiveness: When not to use high mixing intensity. Powder Technol. 2020, 366, 150–163. [Google Scholar] [CrossRef]
- Kunnath, K.; Chen, L.; Zheng, K.; Davé, R.N. Assessing predictability of packing porosity and bulk density enhancements after dry coating of pharmaceutical powders. Powder Technol. 2021, 377, 709–722. [Google Scholar] [CrossRef]
- Han, X.; Ghoroi, C.; To, D.; Chen, Y.; Davé, R. Simultaneous micronization and surface modification for improvement of flow and dissolution of drug particles. Int. J. Pharm. 2011, 415, 185–195. [Google Scholar] [CrossRef] [PubMed]
- Chattoraj, S.; Shi, L.; Sun, C.C. Profoundly improving flow properties of a cohesive cellulose powder by surface coating with nano-silica through comilling. J. Pharm. Sci. 2011, 100, 4943–4952. [Google Scholar] [CrossRef]
- Karde, V.; Ghoroi, C. Influence of surface modification on wettability and surface energy characteristics of pharmaceutical excipient powders. Int. J. Pharm. 2014, 475, 351–363. [Google Scholar] [CrossRef]
- Karde, V.; Panda, S.; Ghoroi, C. Surface modification to improve powder bulk behavior under humid conditions. Powder Technol. 2015, 278, 181–188. [Google Scholar] [CrossRef]
- Mullarney, M.P.; Beach, L.E.; Davé, R.N.; Langdon, B.A.; Polizzi, M.; Blackwood, D.O. Applying dry powder coatings to pharmaceutical powders using a comil for improving powder flow and bulk density. Powder Technol. 2011, 212, 397–402. [Google Scholar] [CrossRef]
- Wei, G.; Mangal, S.; Denman, J.; Gengenbach, T.; Lee Bonar, K.; Khan, R.I.; Qu, L.; Li, T.; Zhou, Q. (Tony) Effects of coating materials and processing conditions on flow enhancement of cohesive acetaminophen powders by high-shear processing with pharmaceutical lubricants. J. Pharm. Sci. 2017, 106, 3022–3032. [Google Scholar] [CrossRef]
- Zhou, Q.; Shi, L.; Chattoraj, S.; Sun, C.C. Preparation and characterization of surface-engineered coarse microcrystalline cellulose through dry coating with silica nanoparticles. J. Pharm. Sci. 2012, 101, 4258–4266. [Google Scholar] [CrossRef]
- Zhou, Q.; Shi, L.; Marinaro, W.; Lu, Q.; Sun, C.C. Improving manufacturability of an ibuprofen powder blend by surface coating with silica nanoparticles. Powder Technol. 2013, 249, 290–296. [Google Scholar] [CrossRef]
- Capece, M.; Borchardt, C.; Jayaraman, A. Improving the effectiveness of the comil as a dry-coating process: Enabling direct compaction for high drug loading formulations. Powder Technol. 2021, 379, 617–629. [Google Scholar] [CrossRef]
- Freeman Technology Stability & Variable Flow Rate Method; Freeman Technology: Tewkesbury, UK, 2007.
- Freeman Technology Shear Cell; Freeman Technology: Tewkesbury, UK, 2010.
Publisher’s Note: MDPI stays neutral with regard to jurisdictional claims in published maps and institutional affiliations. |
© 2022 by the authors. Licensee MDPI, Basel, Switzerland. This article is an open access article distributed under the terms and conditions of the Creative Commons Attribution (CC BY) license (https://creativecommons.org/licenses/by/4.0/).