Article

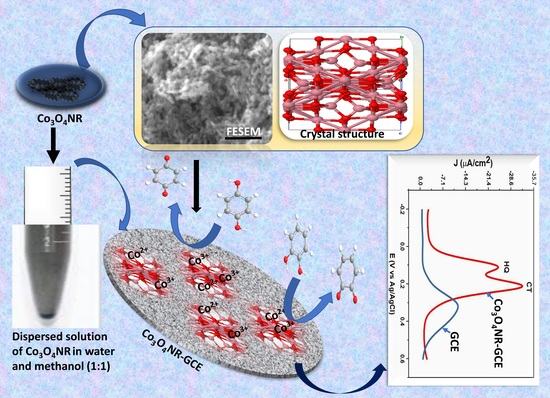
Cobalt Oxide Nanorod-Modified GCE as Sensitive Electrodes for Simultaneous Detection of Hydroquinone and Catechol

by
Nasrin Sultana
1,†,
Sanjay Datta Shawon
1,†,
S. M. Abu Nayem
1,
Md. Mahedi Hasan
1,
Tamanna Islam
1,
Syed Shaheen Shah
2,3,
Mohammad Mahbub Rabbani
4,5,*,
Md. Abdul Aziz
3,* and
A. J. Saleh Ahammad
1,*
1
Department of Chemistry, Jagannath University, Dhaka 1100, Bangladesh
2
Physics Department, King Fahd University of Petroleum & Minerals, Dhahran 31261, Saudi Arabia
3
Interdisciplinary Research Center for Hydrogen and Energy Storage (IRC-HES), King Fahd University of Petroleum & Minerals, Dhahran 31261, Saudi Arabia
4
Department of Chemistry, American International University-Bangladesh (AIUB), Dhaka 1229, Bangladesh
5
Center for Nanotechnology Research (CNR), American International University-Bangladesh (AIUB), Dhaka 1229, Bangladesh
*
Authors to whom correspondence should be addressed.
These authors contributed equally to this work.
Processes 2022, 10(2), 390; https://doi.org/10.3390/pr10020390
Submission received: 14 January 2022 / Revised: 3 February 2022 / Accepted: 14 February 2022 / Published: 17 February 2022
(This article belongs to the Special Issue Technological Advancements in Nanomaterials Synthesis and Application)

Abstract

:
An electrochemical sensor based on a cobalt oxide nanorod (Co3O4NR) modified glassy carbon electrode (GCE) (Co3O4NR-GCE) was prepared for simultaneous and selective determination of hydroquinone (HQ) and catechol (CT). Surface morphology and crystallinity of Co3O4NR were investigated employing field emission scanning electron microscopy (FESEM) and X-ray diffraction (XRD) analysis. The structure (16 nm) of the Co3O4 nanorod was observed in the FESEM image. A sharp peak pattern in the XRD survey revealed the following crystal planes in Co3O4NR material: (111), (220), (311), (222), (400), (422), (511), and (440). Electrochemical characterization of modified Co3O4NR-GCE was carried out performing cyclic voltammetry (CV) and electrochemical impedance spectroscopy (EIS). Selective and simultaneous detection of HQ and CT was carried out by performing CV and differential pulse voltammetry (DPV) analysis. In both studies, modified Co3O4NR-GCE showed well defined oxidation and reduction peaks for HQ and CT with enhanced peak current, and the oxidation peaks for HQ and CT were observed at 0.152 V and 0.254 V, respectively, in the CV analysis. Scan rate and pH variation analysis were performed to evaluate different kinetic parameters, including charge transfer coefficient (α = 0.56 for HQ and 0.66 for CT), heterogeneous charge transfer rate constant (ks = 56 for HQ and 72 for CT), and the number of electrons involved in HQ and CT oxidation. Quantitative analysis of HQ and CT was studied by observing the current response of DPV analysis with respect to concentration variation. Here, the detection limit was calculated as 0.2 µM for HQ with a linear concentration range of 5–200 µM, and 0.4 µM for CT with a linear concentration range of 5–150 µM. The practical applicability of the proposed sensor was investigated using sample solutions prepared in tap water. The reported sensor showed impressive selectivity towards HQ and CT in the presence of common interferents.

Graphical Abstract

1. Introduction

Industrialization often has negative consequences on the environment. Industrial byproducts and toxic chemicals can cause environmental pollution and degradation of the ecosystem. In this case, benzene and its metabolites have a great contribution to environmental pollution and human diseases. Hydroquinone (HQ, 1.4-dihydroxybenzene) and catechol (CT, 1.2-dihydroxy benzene) are benzene metabolites, largely used as raw materials and synthetic intermediates in the manufactures of dye, cosmetics, pesticides, pharmaceuticals, etc. [1]. They are easily introduced into the environment due to their use in such manufacturing fields. It has been reported that the toxic and poor biodegradable nature of HQ and CT are detrimental to the environment and humans even if they are present at low concentration [2,3,4,5,6]. They can easily enter into the human body through digestive and respiratory systems. High exposures of HQ and CT is responsible for headache, fever, fatigue, liver function lesion, kidney damage, and renal tube degeneration [7,8], while low concentrations of HQ and CT may cause cough, anorexia, nausea, spew, pigmentation of the eye, mutagenesis, and cancer [9]. The European Union (EU) and US environmental protection agency (EPA) enlisted HQ and CT as a prior organic pollutant because of their high persistence and toxic nature [10]. Even in national standard (GB 8978-1996) of China, the acceptable emission level of dihydroxy benzene is 0.00454 mole/L [11]. Hence sensitive and simultaneous detection of these two substances becomes crucial. Chemiluminescence [12], HPLC (high performance liquid chromatography) [13], spectroscopy [14], pH-based flow injection analysis [15], and synchronous fluorescence [16] are the different analytical methods for detecting HQ and CT. Very often, these methods are time-consuming, costly, and required additional pretreatment. On the other hand, the electrochemical method is regarded as a favorable approach due to its conveniences, such as simple operation, fast response, high sensitivity, and excellent selectivity [17,18].
In electrochemical analysis, GCE is exoteric because of its availability, wide potential range, and chemical inertness in most electrolyte solutions [19]. However, simultaneous detection of HQ and CT is difficult for bare GCE. Because of their identical structures and similar physical and chemical properties, a broad oxidation peak is observed for a mixture or HQ and CT [20]. Thus, it is essential to develop a highly sensitive electrochemical sensor for selective and simultaneous detection of HQ and CT. In this circumstance, scientists have tried to develop the surface properties of bare electrodes by fabricating the electrode surface with materials such as metal oxides [21,22], carbon materials [23,24], conducting polymers [25,26], and composite materials [17]. In addition, synthesis of conducting polymers and composite materials is time consuming and follows intricate procedures. Nowadays, transition metal oxides draw much attention as a sensing material due to their low cost and non-toxic and simple preparation method [27]. Among different transition metal oxides, Co3O4 has been exploited as a potential sensing material due to its unique characteristics such as high surface area, high electrocatalytic activity, long term performance stability, and simple preparation method [28]. Basically, it is a p-type semiconductor containing cobalt ions in two oxidation states, namely Co2+ in tetrahedral and Co3+ in octahedral sites [29]. These different sites in the crystal structure of Co3O4 can help to detect the analytes and increase charge transfer kinetics [30]. In addition, nano-size Co3O4 exhibits enhanced electrocatalytic activity compared to bulk ones due to its large effective surface area [31] and hence is successively used as a sensor (i.e., to detect glucose, hydrogen peroxide) and charge storage material in supercapacitors [32,33,34,35].
In this report, we used Co3O4NR as a sensing material to detect HQ and CT. The electrochemical characterization of the modified Co3O4NR-GCE was studied by CV and EIS analysis. Selective and quantitative analysis of HQ and CT detection were done by performing CV and DPV. Scan rate and pH variations analysis were also studied to evaluate the kinetics of redox reaction. Practical applicability of the reported sensor was evaluated by using tap water as a real sample.

2. Experimental

2.1. Instrumentation

All electrochemical analyses were carried out by using a single electrochemical power-station (CHI 660E, CH Instruments, Houston, TX, USA). A typical three-electrode system contains GCE or Co3O4NR-GCE, Ag/AgCl (3 M KCl), and platinum wire electrodes as working, reference, and counter electrodes, respectively. A 5 mM K3[Fe(CN)6] solution in 1 M KCl was used as an electrochemical probe to study the conductivity and interface electron transfer properties of Co3O4NR-GCE. All the experiments were conducted at room temperature (25 °C). The FESEM and XRD analyses were performed using a high resolution field emission scanning electron microscope (JEOL JSM6610LV, JEOL GmbH, Freising, Germany), and a Rigaku Miniflex-II diffractometer (Rigaku Innovative Technologies, Auburn Hills, MI, USA), to study the surface morphology and crystalline structure of Co3O4NR. The pH values of the solutions were measured by a pH meter (HANNA instruments, Nusfalau, Romania).

2.2. Materials

HQ, CT, sodium dibasic phosphate (Na2HPO4), sodium monobasic phosphate (NaH2PO4), methanol, potassium chloride (KCl), potassium ferricyanide (K3[Fe(CN)6]), hydrochloric acid (HCl), and sodium hydroxide (NaOH) were purchased from Sigma Aldrich (Darmstadt, Germany) and used without any further purification or pretreatment. A 0.1 M phosphate buffer solution (PBS, pH = 7), as a supporting electrolyte, was used in all the electrochemical experiments, and the buffer solution was prepared by mixing 0.1 M Na2HPO4 and 0.1 M NaH2PO4. The pH of the mixture was adjusted by adding an appropriate amount of acidic (HCl) or basic (NaOH) solution.

2.3. Synthesis of Co3O4NR

Co3O4NR was synthesized by thermal decomposition of Co(NO3)·6H2O [35]. In brief, 400 mg of Co(NO3)·6H2O was taken in a crucible. Then the crucible was placed in the furnace, and the furnace temperature was set to 450 °C with an increasing temperature rate of 10 °C/min. The crucible was kept in the furnace for 3 h, maintaining the same temperature. After the time interval, the temperature was allowed to gradually decrease to room temperature by turning the switch of the system off, and the crucible was brought out of the furnace. Surface morphology and crystallinity of Co3O4NR were characterized by FESEM and XRD analysis.

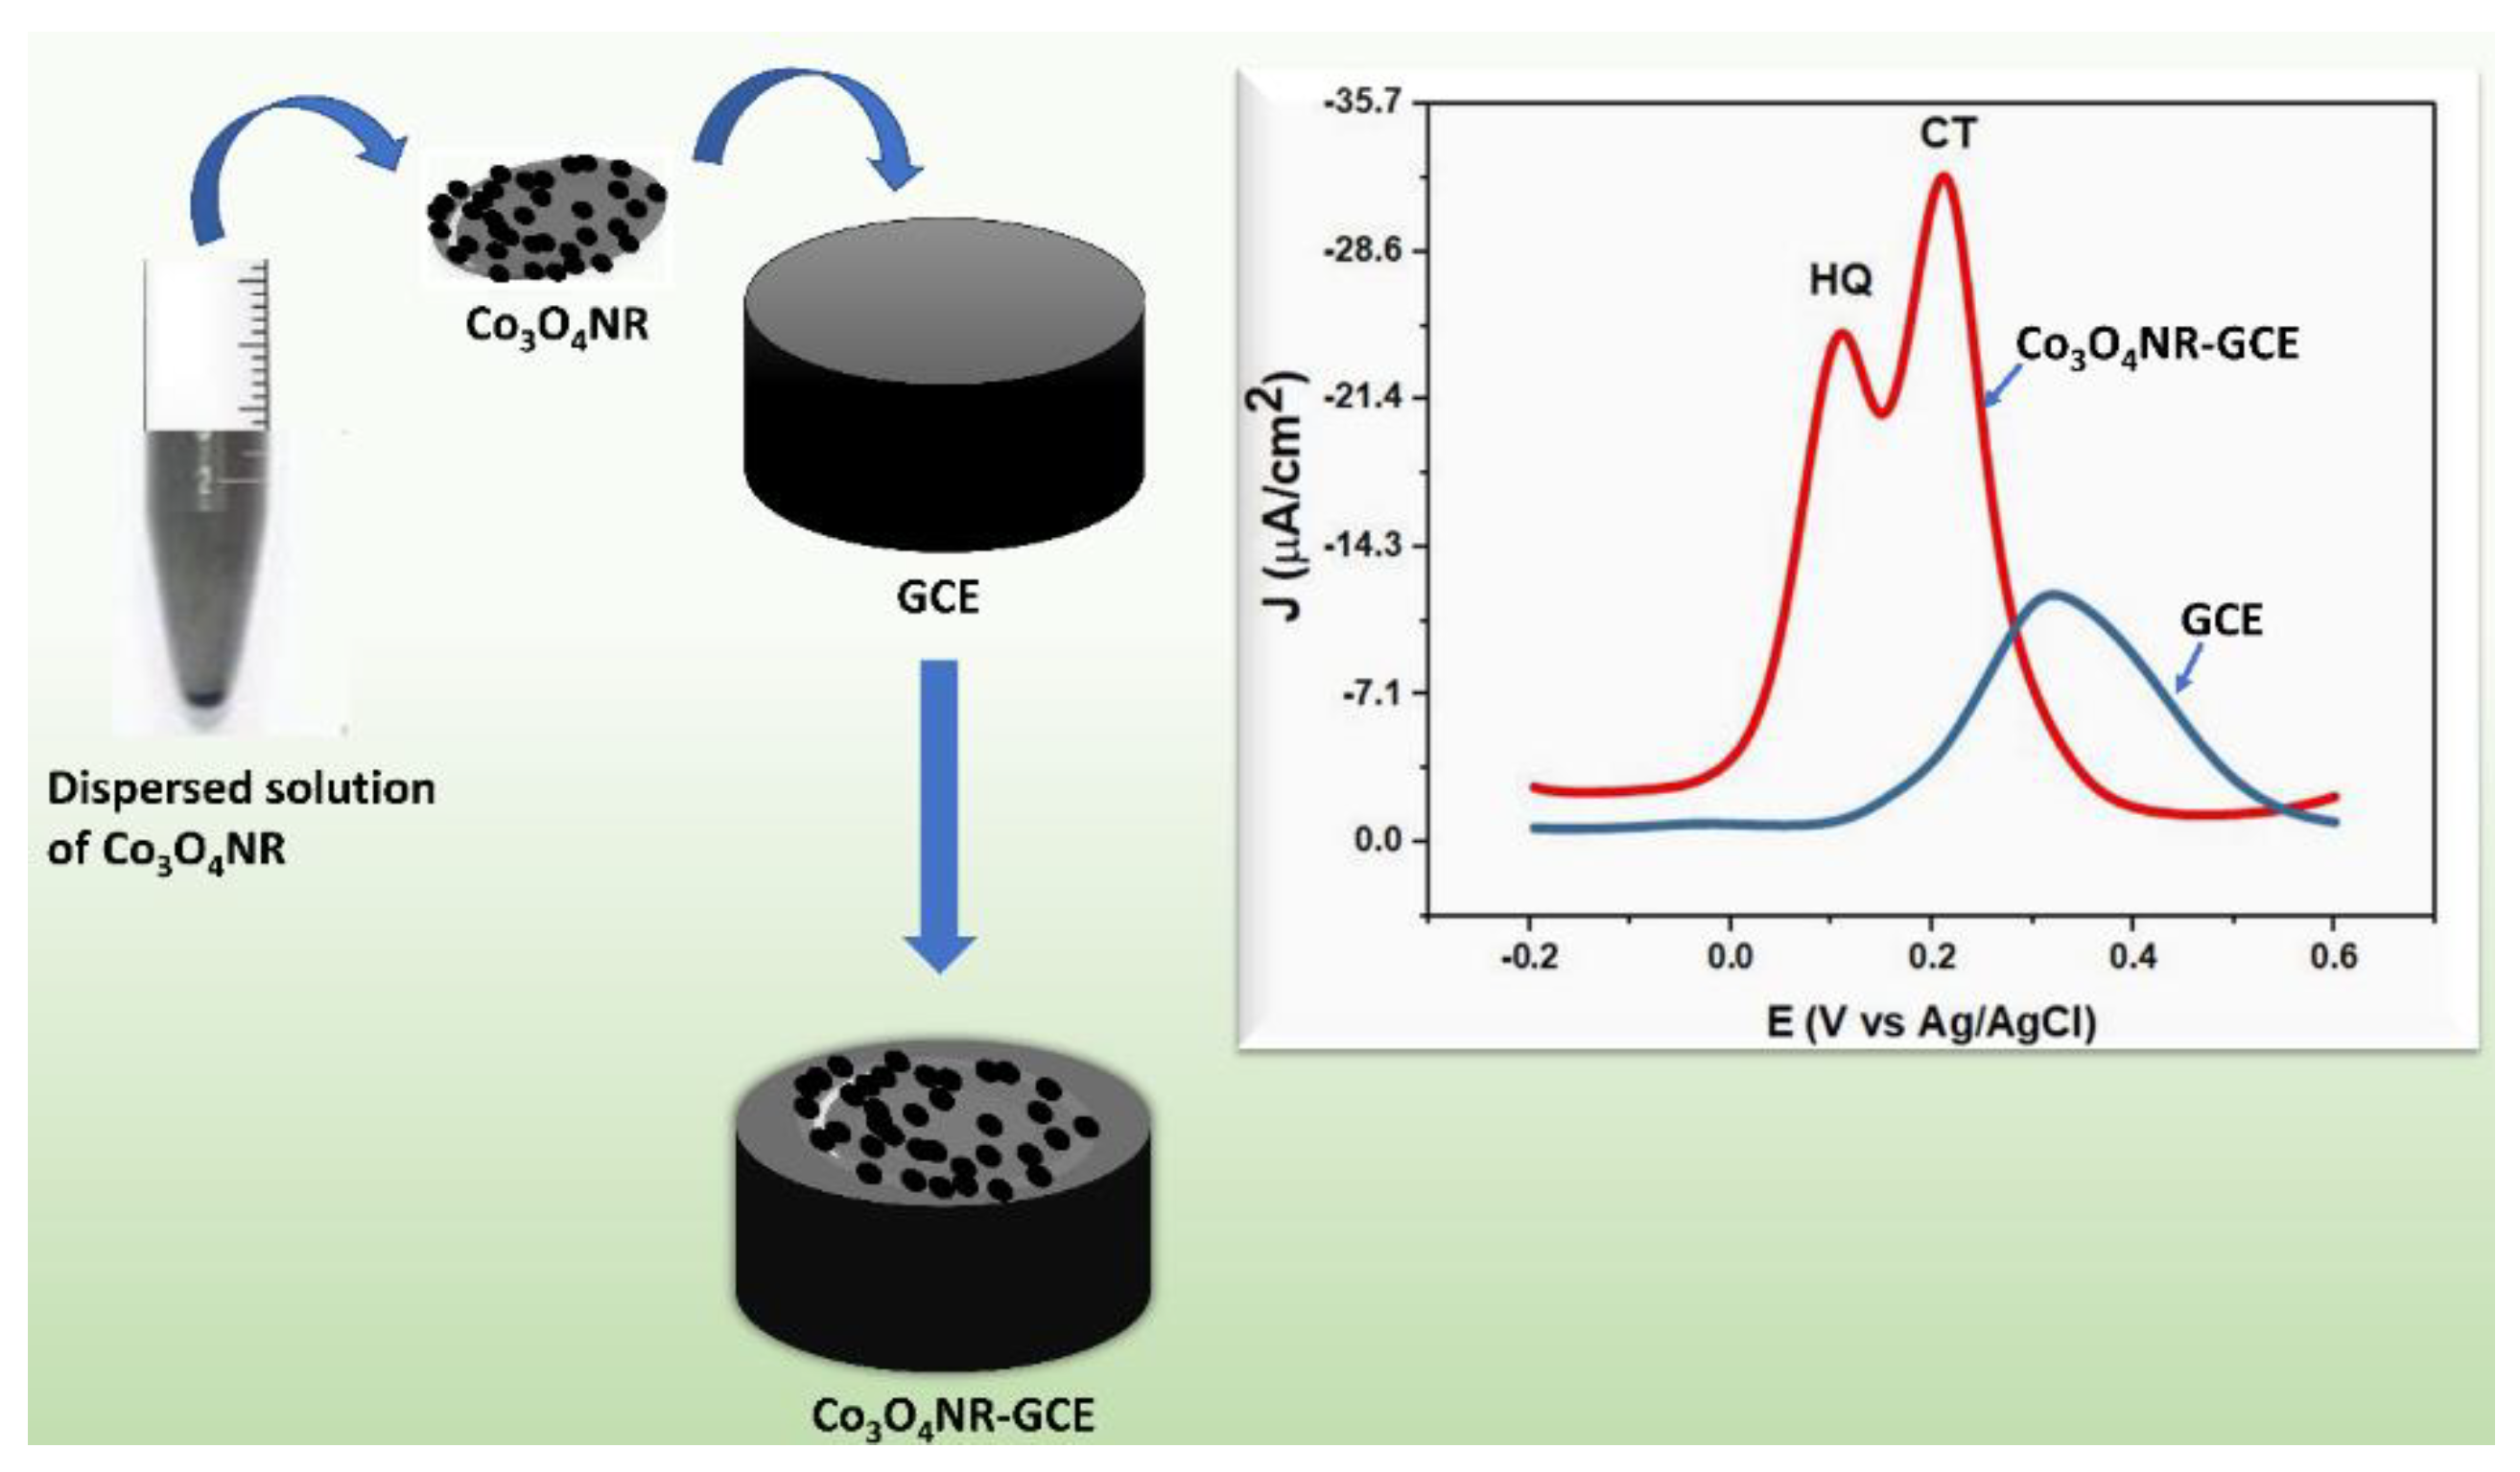
2.4. Preparation of Modified Electrode

Before modification, GCE was polished over a polishing cloth with a 0.5 µm alumina slurry to obtain a mirror-like surface, and then fast flow DI water was used to clean the surface of the electrode. After cleaning, polished GCE was kept at room temperature to allow the surface to dry. On the other hand, an approximate amount of 0.1 mg of Co3O4NR was dispersed in 1.5 mL DI water, and the mixture was sonicated for half an hour. When a uniform dispersed solution was obtained, the GCE electrode was modified by drop casting 3 µL dispersed solution with the help of a micropipette and again kept at room temperature to dry the electrode surface. A schematic representation of modification and sensing is shown in Scheme 1.

3. Results and Discussion

3.1. Morphological Characterization of Co3O4NR

The surface morphology and crystallinity of the Co3O4NR were investigated by FESEM and XRD analysis. Figure 1A shows the FESEM images of Co3O4NR, and Figure 1B shows the XRD pattern of Co3O4NR. The growing nanorod structure was observed in the FESEM image of Co3O4NR, and the size was measured as 16 nm. Here, Co3O4NR was quite uniformly dispersed, creating coarseness in the surface. Crystallinity and different crystal planes in the Co3O4NR material were evaluated by XRD analysis. The XRD survey showed different sharp and intense peaks, which indicated the crystalline morphological feature of Co3O4NR. The crystallinity of Co3O4NR was calculated as 51.56% using the following equation [36]:
C r y s t a l l i n i t y = A r e a   o f   e i g h t   c r y s t a l l i n e   p e a k T o t a l   a r e a   o f   a l l   ( c r y s t a l l i n e + a m o r p h o u s )   p e a k × 100 %
In the XRD pattern, the sharp crystalline peaks appeared at 19.13°, 31.40°, 37.0°, 38.63°, 44.91°, 55.71°, 59.43°, and 65.29°, which corresponded to the following crystal planes, respectively:(111), (220), (311), (222), (400), (422), (511), and (440) [35].

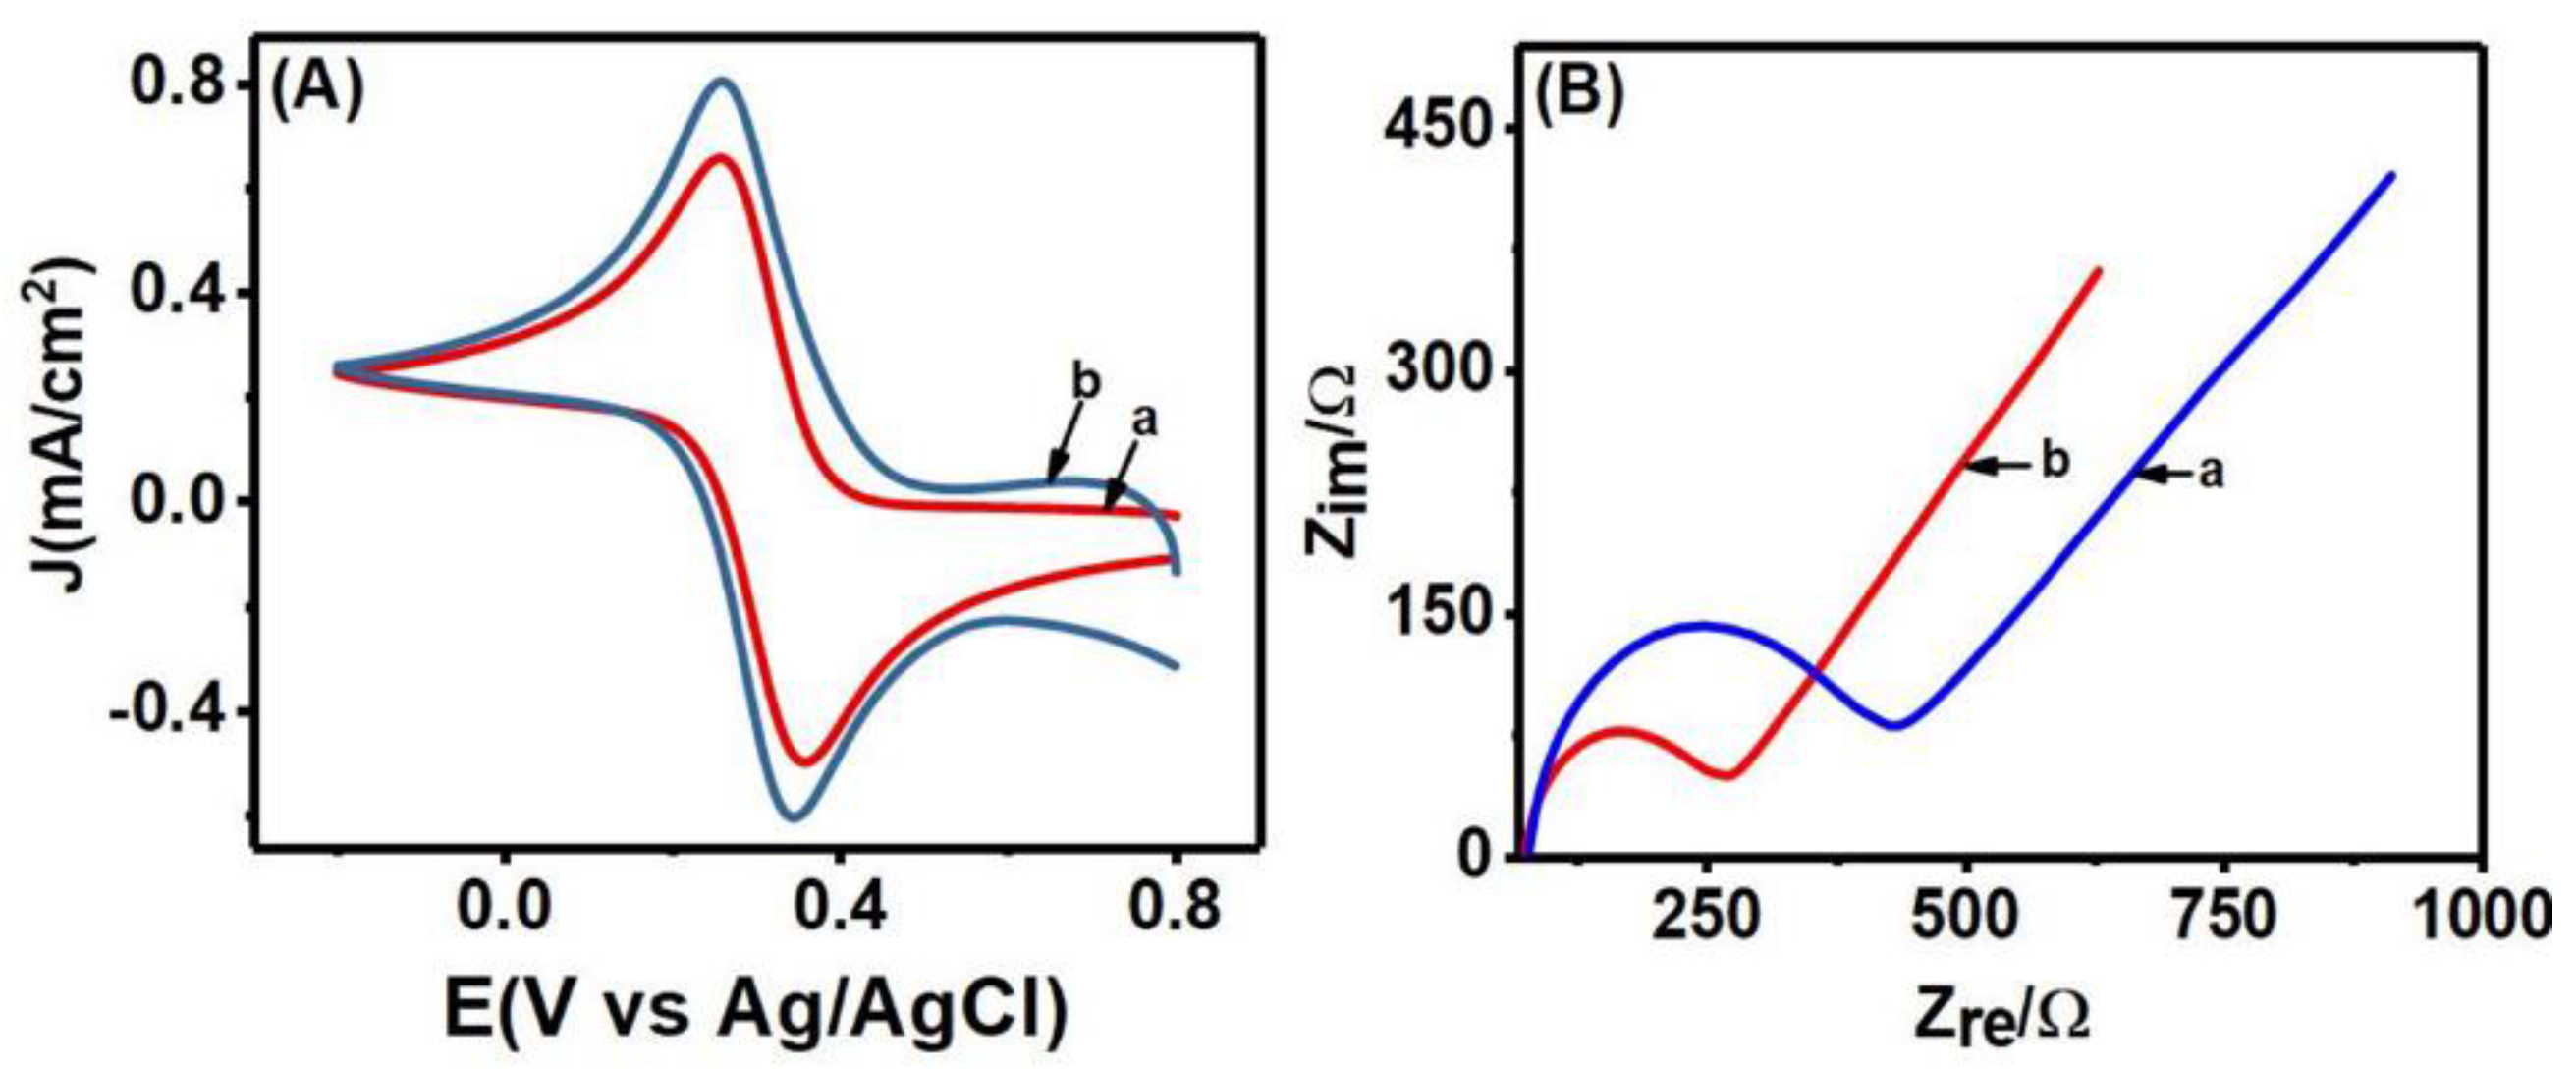
3.2. Electrochemical Characterization of Modified Co3O4NR-GCE

Electrical conductivity and charge transfer properties of Co3O4NR-GCE and the bare GCE surface were studied by performing CV and EIS analysis employing K3[Fe(CN)6] (in 1 M KCl) as redox prove. The results of CV analysis are shown in Figure 2A to compare the conductivity of Co3O4NR-GCE with GCE. Though well-defined redox peaks were obtained for both the electrodes, enhanced redox peak currents with small peak separation were observed at modified electrodes. The oxidation peak current was 2.06 × 10⁻⁵ A and 3.41 × 10⁻⁵ A for GCE and Co3O4NR-GCE, respectively. Here, increases in peak current could be the result of greater extent of interaction between [Fe(CN)6]3– and Co3O4NR-GCE. This observation indicated high conductivity of Co3O4NR-GCE and successful modification of GCE by using Co3O4NR. The effective surface area of Co3O4NR-GCE and GCE was measured using the Randles–Sevcik equation (Equation (2)) [11]:
I p   = 2.69 × 10 5 n 3   A D C 0 ν      
where n is the number of electrons, Ip is the peak current in amperes (A), D is the diffusion coefficient (6.7 × 10⁻⁶ cm2 s−1) [11], C0 is the concentration of K3[Fe(CN)6] (mol cm−3), ν is the scan rate (Vs−1), and A is the effective surface area (cm2). A large electroactive surface area was found for Co3O4NR-GCE (0.031 cm2) compared to bare GCE (0.022 cm2).
In addition to this CV analysis, the charge transfer properties of Co3O4NR-GCE and GCE were evaluated by using the EIS technique over the 1 Hz to 100 kHz frequency range. In the Nyquist plot (Figure 2B) obtained from analysis, the semicircular portion at the high frequency region corresponded to the charge transfer resistance (Ret) process, and the straight line at the low frequency region corresponded to the diffusion-control process [37]. For bare GCE, Ret was found to 354 Ω, and after immobilization of Co3O4NR on GCE, the Ret decreased to 195 Ω. A decrease in the Ret value indicated accelerated charge transfer properties of the modified Co3O4NR-GCE. The enhanced electroconductivity and large effective area imbued us to use Co3O4NR-GCE as a working electrode for further analysis in HQ and CT detection.

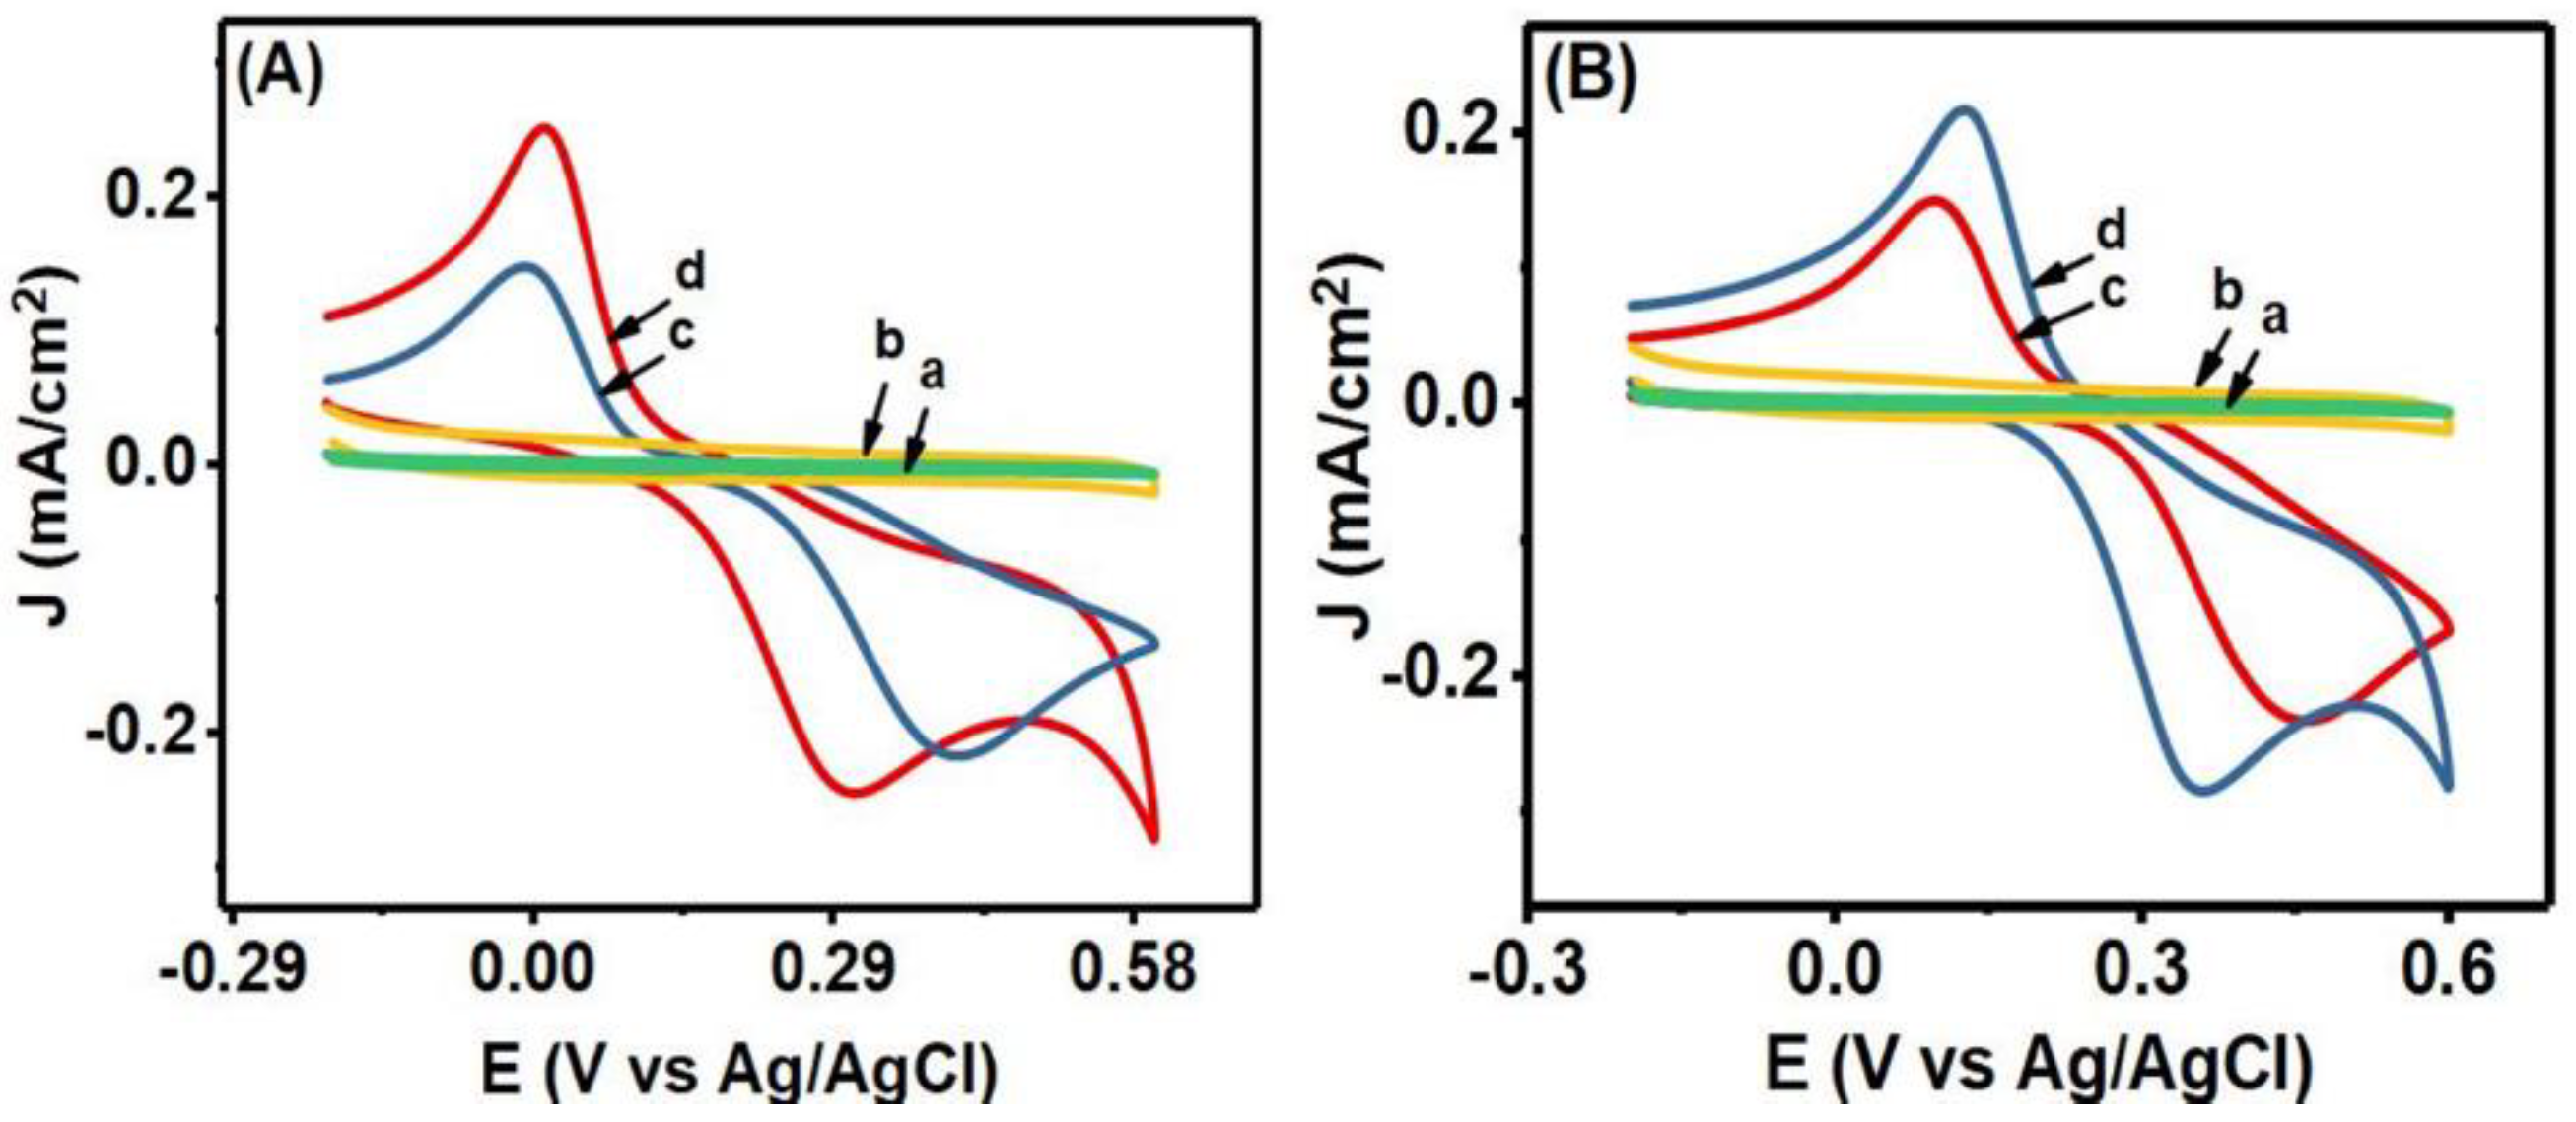
3.3. Electrochemical Response of HQ and CT at Modified Co3O4NR-GCE

In individual solutions of HQ and CT (in 0.1 M PBS, pH = 7), CV was performed to investigate their electrochemical responses at the Co3O4NR-GCE within a potential range of −0.2 V to 0.6 V. Figure 3A,B show the results of CVs in individual 0.5 mM solutions of HQ and CT. In Figure 3A, the CV of HQ at the bare electrode (c) exhibited the oxidation potential at 0.413 V and reduction potential at 0.011 V, and the peak potential difference ( Δ Ep) was 0.402 V. However, at the modified Co3O4NR-GCE, enhanced oxidation and reduction peak current were observed for HQ. The oxidation peak shifted toward negative potential, indicating that the Co3O4NR catalyzed the oxidation reaction and accelerated the electron transfer process. Here, the redox peak potential difference, Δ Ep, for the modified electrode was 0.271 V, and the anodic to cathodic peak current ratio was close to 1, which indicated a reversible electron transfer process. In similar CV analysis for CT (Figure 3B), enhanced peak current response with small peak potential separation (0.243 V) was also observed at the modified electrode. The oxidation peak of CT also shifted towards negative potential, and the reduction peak shifted towards a positive potential value. A small peak potential separation indicates that Co3O4NR can reduce the over potential and gives an oxidation peak at a lower potential value.
The electrocatalytic activity of Co3O4NR-GCE was also studied for the simultaneous determination of HQ and CT by performing CV and DPV in a homogenous 0.5 mM mixture of HQ and CT in 0.1 M PBS (pH = 7). Figure 4A shows the CV results for bare GCE; a broad oxidation peak appeared, which indicates that bare GCE could not resolve the mixture of HQ and CT, whereas Co3O4NR-GCE showed well-defined and enhanced oxidation and reduction peaks for HQ and CT. The anodic peak currents were observed at 0.152 V (HQ) and 0.254 V (CT). The results of simultaneous CV analysis also implied enhanced electrocatalytic properties of modified electrode toward the oxidation of HQ and CT. DPV analysis was also carried out (Figure 4B) for the same mixture of HQ and CT. Similar to CV, enhanced and well-defined peak current responses for HQ and CT were observed at 0.113 V and 0.214 V. This study further indicated improved electrocatalytic properties of the Co3O4NR-GCE surface for the oxidation of HQ and CT.

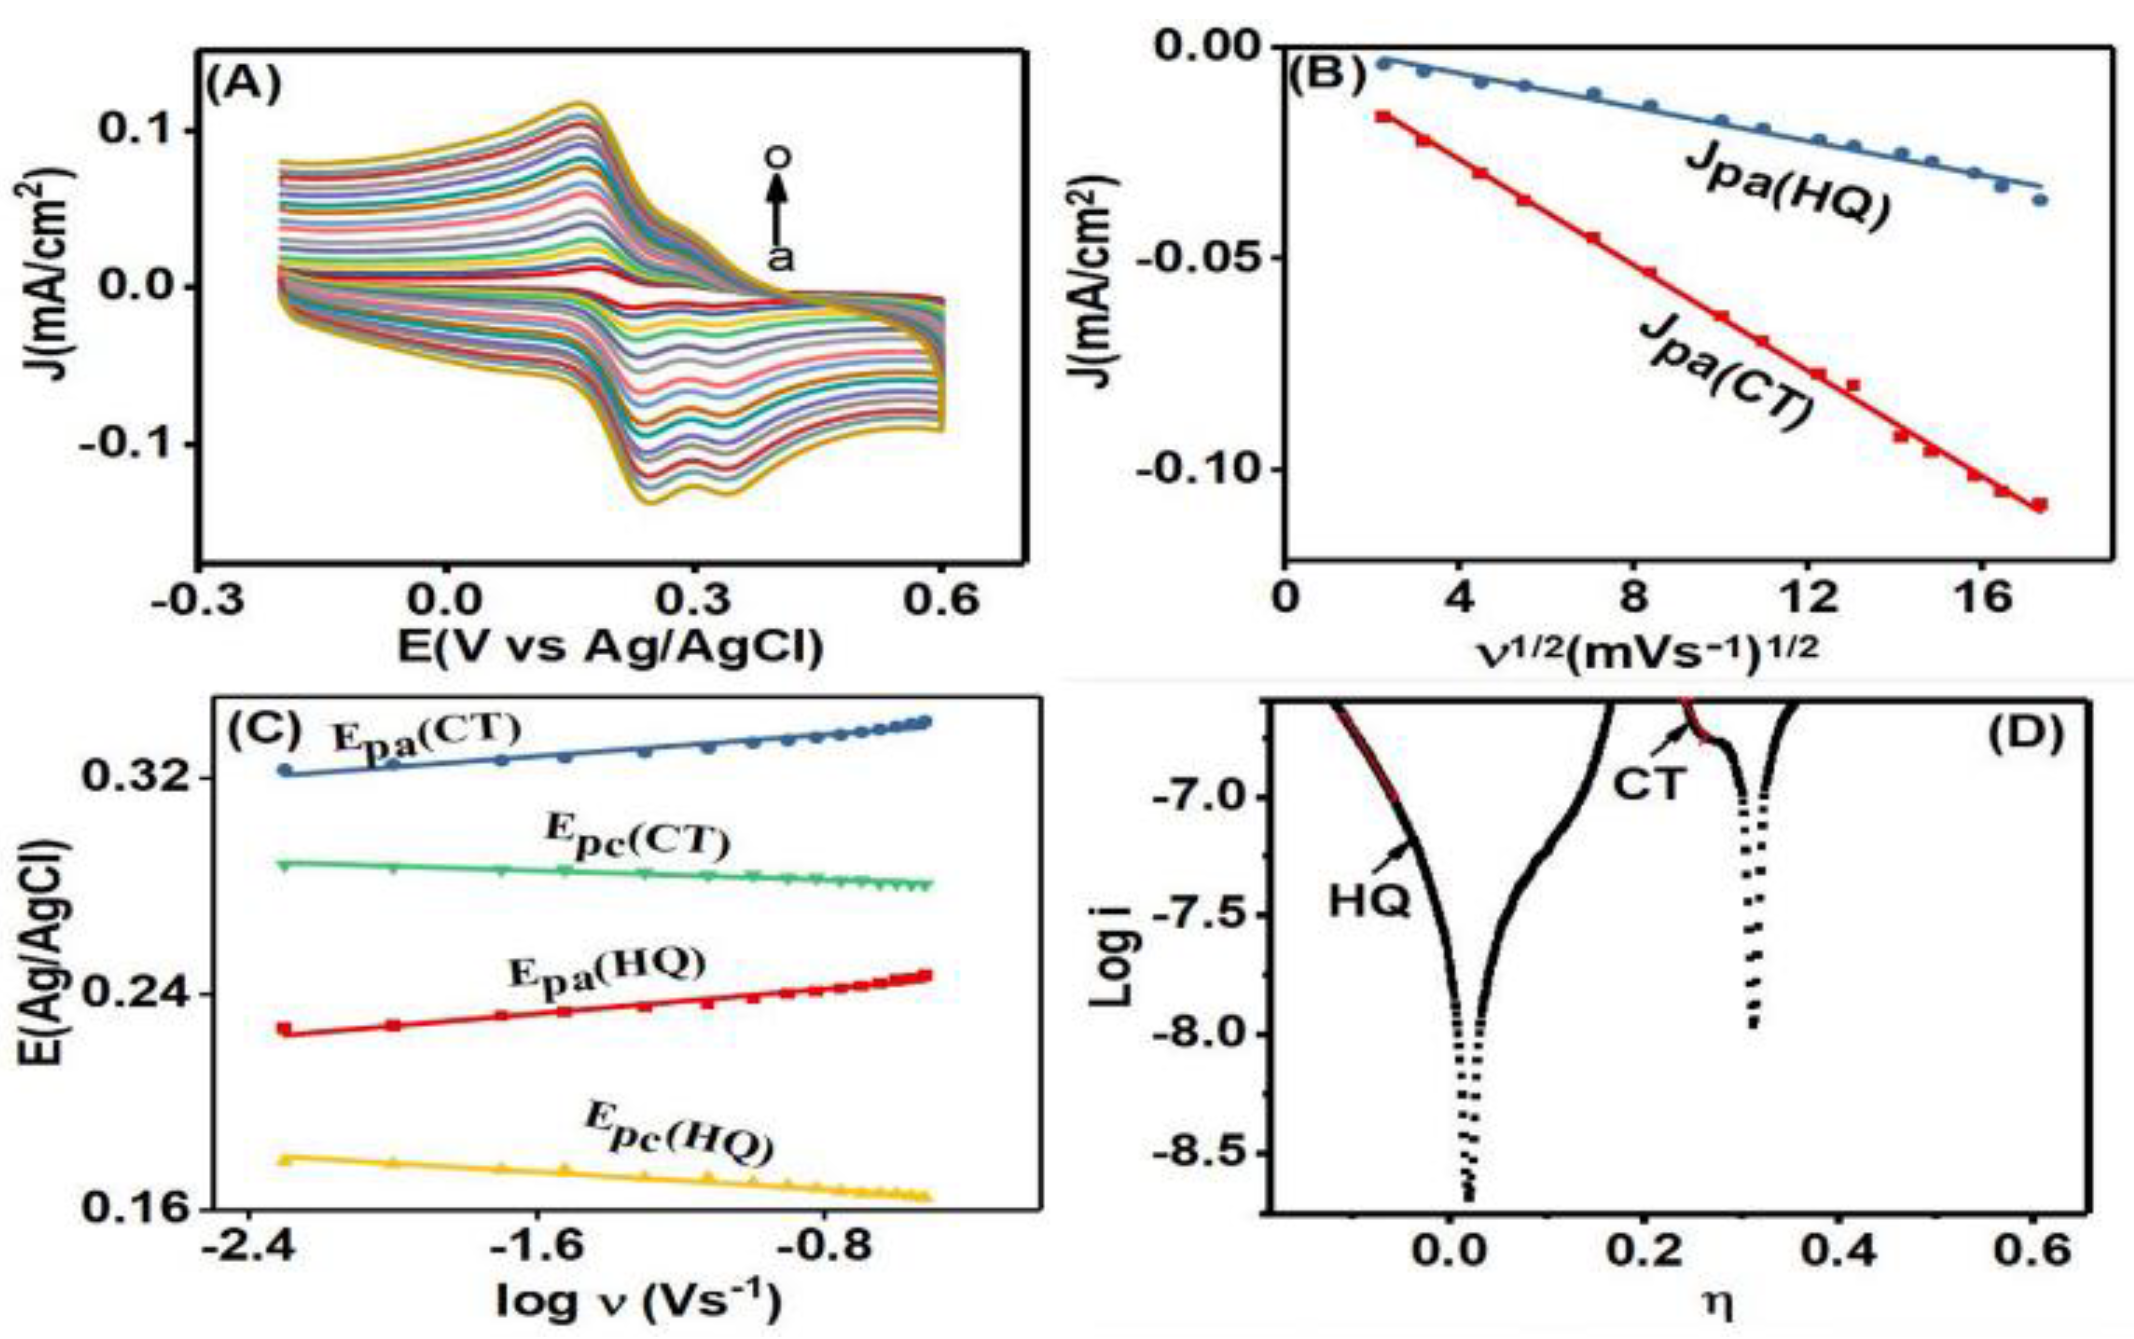
3.4. Evaluation of Kinetic Parameters of HQ and CT Oxidation at Co3O4NR-GCE

CV was performed at different scan rate values (5–300 mV/s) in the mixture of 75 µM HQ and 30 µM CT (in 0.1 M PBS, pH = 7) to study the effect of scan rate on the electrochemical response of HQ and CT at Co3O4NR-GCE and to elucidate the kinetics involved in the oxidation reaction of HQ and CT. Figure 5A shows the CVs for scan rate variations. Here, the redox peak currents of both HQ and CT showed proportional relations with the ascending order of scan rate varying from 5 mV to 300 mV. The anodic peak positions of HQ and CT slightly moved towards positive potentials, and cathodic peak positions moved towards negative potentials of small values with increasing scan rates. Figure 5B displays linear change in charge density of HQ and CT as a function of square root of the scan rates (ν1/2). The linearity in oxidation peak current density (J) could be expressed with regression equations Jpa (mA/cm2) = −0.396ν1/2 + 0.6347 (R2 = 0.99) for HQ and Jpa (mA/cm2) = −0.42569ν1/2 + 0.60085 (R2 = 0.96) for CT, which suggests that the oxidation reactions of HQ and CT were diffusion control processes [4]. Again, a linearity was also observed (Figure 5C) between anodic and cathodic peak potential (Epa and Epc), and log of scan rate (logν). These linear relationships could be expressed as Epa (V) = 0.00391 logν (V/s) + 0.246821 (R2 = 0.97) and Epc (V) = −(V) = 76 logν (V/s) + 0.2842 (R2 = 0.96) for HQ and Epa (V) = 0.00412 logν (V/s) + 0.29323 (R2 = 0.97) and Epc (V) = −0.00789 logν (V/s) + 0.14635 (R2 = 0.97) for CT. Therefore, for the redox process we could apply the following equations [38]:
E p a = E 0 + 2.3 R T ( 1 α ) n F log ν      
E p a = E 0 + 2.3 R T ( 1 α ) n F log ν        
l o g   k s = α   l o g   ( 1 α ) + ( 1 α ) l o g   α l o g   R T n F ν ( 1 α ) α n F Δ E p 2.3   R T      
Here, n, R, ks, α, F, and T are the number of transferred electrons, molar gas constant, heterogeneous rate constant, charge transfer coefficient, Faraday constant, and temperature in Kelvin, respectively. E0 is the corresponding standard potential of HQ and CT. From the ratio of slope values in Equations (3) and (4), we calculated the α values corresponding to HQ and CT oxidation. For HQ and CT, α values were found to be 0.56 and 0.66, respectively. These α values indicated that electron transfer through the interface occurred easily by overcoming comparatively lower activation energy.
Experimentally obtained taffel plots were also evaluated for both HQ and CT oxidation processes at a low scan rate value of 5 mV/s. The slope value was used to further calculate the number of electrons (n) involved in the redox process. Figure 5D shows the obtained taffel plots for oxidation of HQ and CT, which follow the equation
ɳ = α + 1 b   l o g   i    
where,
1 b = α n F 2.3 R T    
The slope values of taffel plots (marked region) for HQ and CT oxidation processes were found to be 18.06 and 20.87, respectively. In addition, the n value was calculated to be about 2 for both HQ and CT, which revealed that oxidation of HQ and CT is a multielectron transfer process. Finally, the ks value was found to be 56 for HQ and 72 for CT using Equation (5).
In order to understand the effect of proton concentration on the peak current response of HQ and CT, a pH variation experiment was carried out. CV was performed in 0.1 M different pH value PBS solutions (pH = 4 to 9) containing 75 µM HQ and 30 µM CT (Figure 6A). Figure 6B shows that initially the oxidation peak current density of HQ and CT increased with the increase of pH value from 4 to 7, and with further increases in pH value, the peak current density started to decrease. At low pH, hydroxyl groups of HQ and CT hardly ionized, which decreased the adsorption capacity of the species at the surface [39]. Decreases in peak current at higher pH value were observed, because both HQ and CT tended to deprotonate [40]. The deprotonation led to negative charge on HQ and CT, and thus repulsive forces could work between HQ and CT and Co3O4NR-GCE [41]. This phenomenon resulted in a decrease in anodic peak current.
It was also observed that with increasing pH values, both cathodic and anodic peak positions of HQ and CT shifted toward lower potential values (Figure 6A), which suggested the involvement of protons in the electrode reaction. The anodic peak potentials of HQ and CT exhibited a linear response with the variation of pH (Figure 6C) and followed the linear relations Epa (V) = −0.051 pH + 0.46607 (R2 = 0.99) for HQ and Epa (V) = −0.052 pH + 0.57226 (R2 = 0.98) for CT. The slopes of the two equations (0.051 for HQ and 0.052 for CT) were close to the slope value of 0.059 obtained from the Nernst equation, which implies that the number of electrons and protons participating in the oxidation reaction were equal [42]. In addition, taffel plot analysis revealed that two electrons participate in the oxidation of HQ and CT. Hence oxidation of HQ and CT at Co3O4NR-GCE is a two proton and two electron transfer process [6].

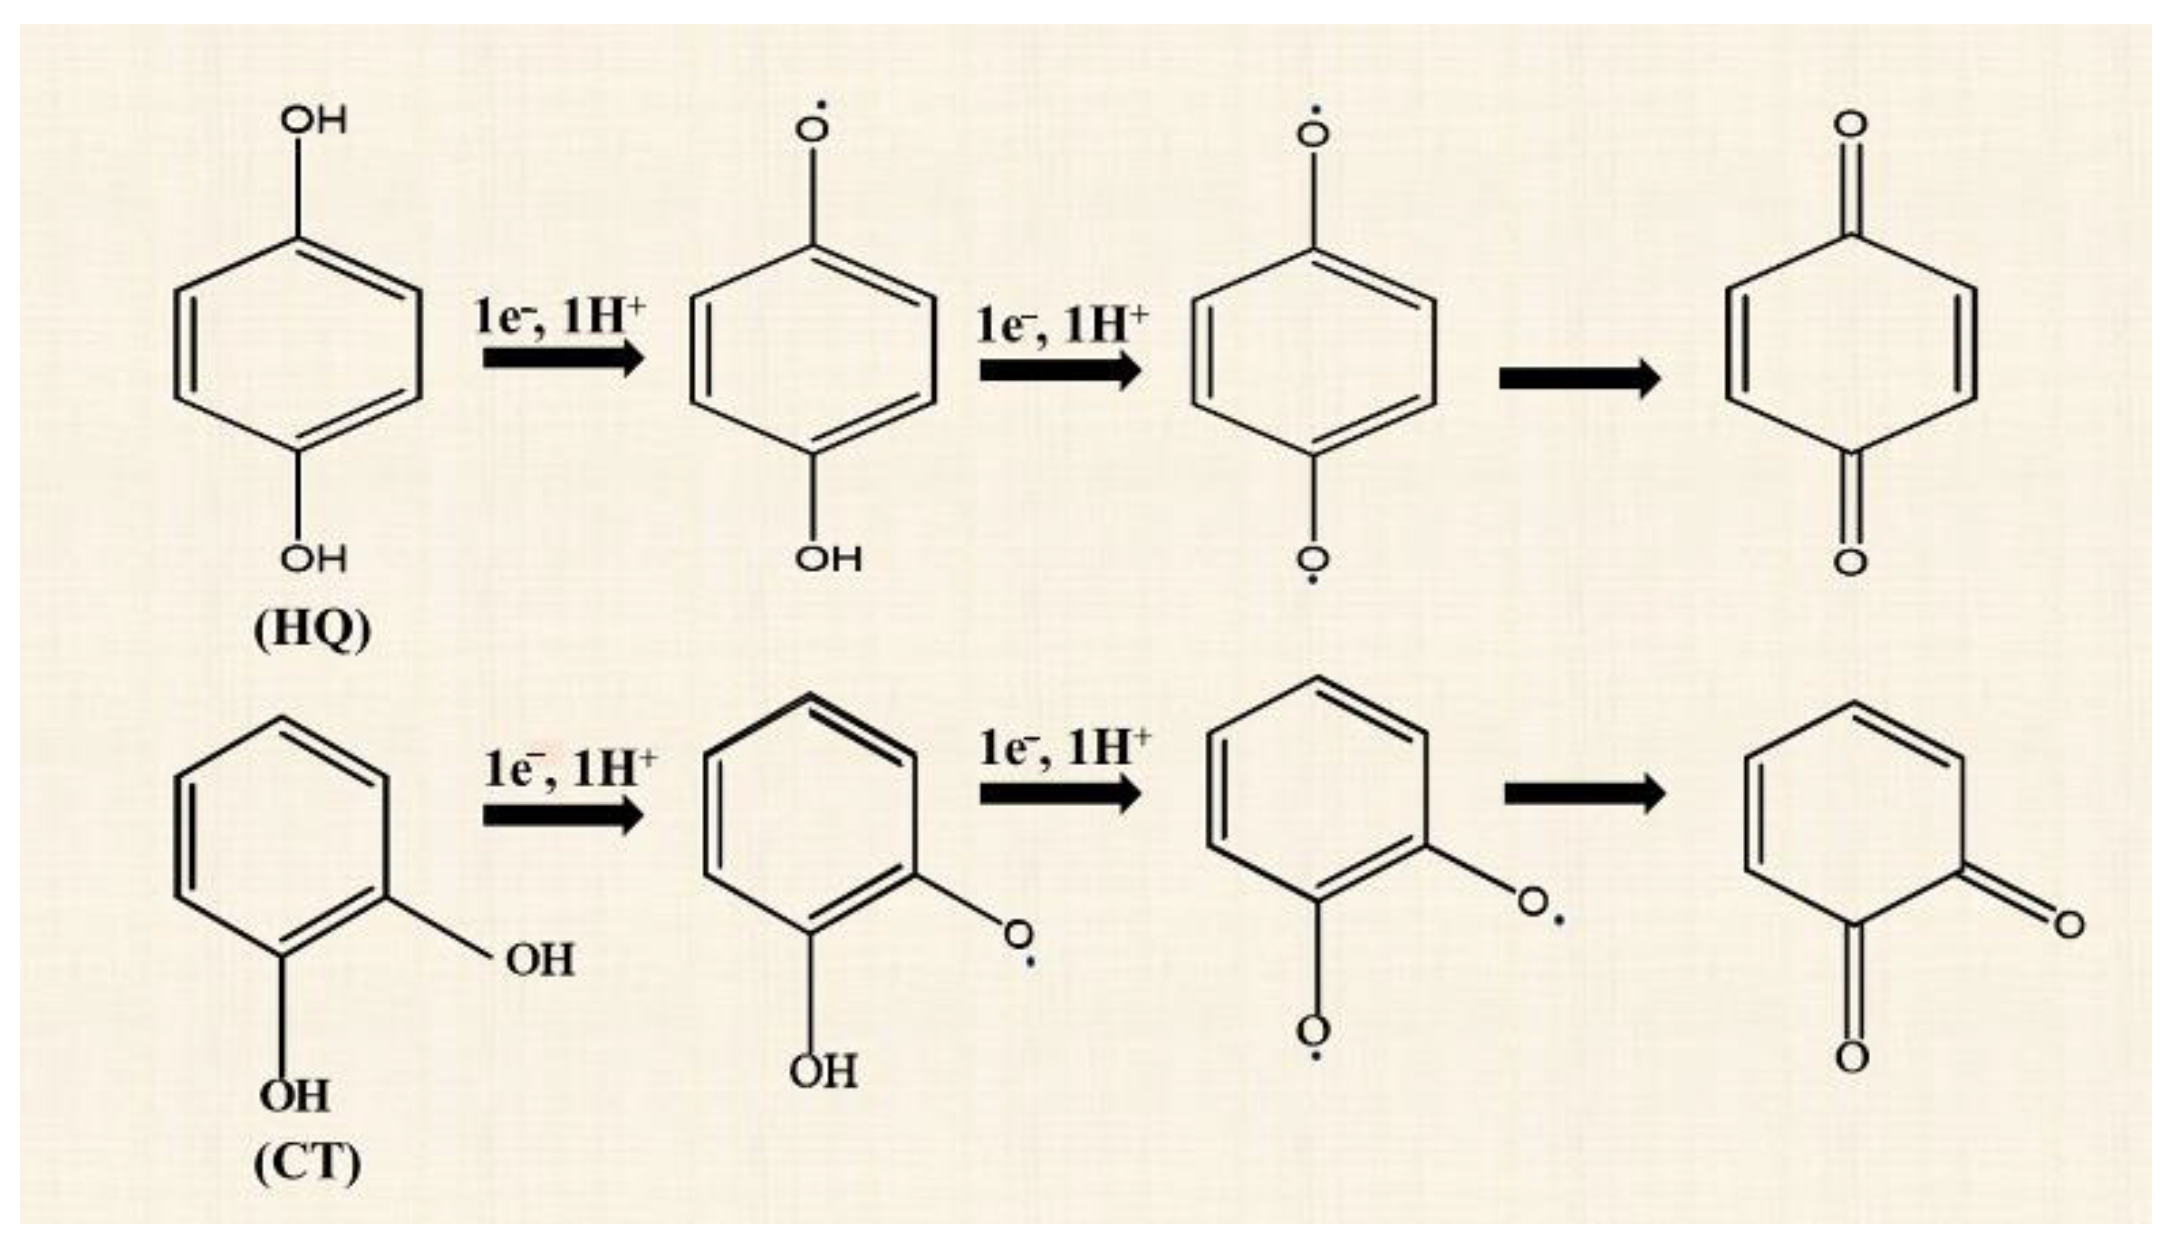
3.5. Probable Oxidation Mechanism of HQ and CT at Co3O4NR-GCE

In an earlier section, scan rate analysis revealed that oxidation of HQ and CT is a diffusion control process. Hence diffusion of the analytes (HQ and CT) towards the modified electrode is a slow process, and once the HQ and CT reached the inner Helmholtz plane (IHP), electron transfer took place quickly. From the ratio of cathodic and anodic current values it was observed that the HQ and CT redox reaction is a reversible process. Taffel plot analysis revealed that two electrons participated in the oxidation process of HQ and CT. It was also found in the pH study that an identical number of protons were engaged in the oxidation reaction of HQ and CT. For this multielectron transfer process, we used the Bockris and Reddy equation to elucidate the consecutive steps involved in the oxidation of HQ and CT [43].
i = i o e x p ( ( n Υ ν r β ) F ɳ R T )
where,
α = n Υ ν r β
where n is the total electron number transferred within the interface, α is the electron transfer coefficient in the multistep process, γ is the number of electrons transferred before the rate determining step (RDS), ν is the number of RDSs in the overall electrochemical reaction, β is the symmetry factor, and r represents the number of electrons that transferred during the RDS. For both HQ and CT, Equation (9) was solved using n = 2, γ = 1, ν = 1, and r = 1, and β = 0.44 for HQ and β = 0.33 for CT. The calculated α was substituted in Equation (7) to determine the taffel slope value. The same slope values for HQ and CT indicated that oxidation of HQ and CT can be in two steps without forming any reaction intermediate, and the second electron transfer step is the RDS (Scheme 2) [11,36].
On the other hand, the nanorod structure of Co3O4 provides a large effective surface area for interaction of HQ and CT, which can accelerate the electron transfer process. Such catalytic activity reflects the voltametric response of HQ and CT. In addition, Co3O4 contains Co2+ and Co3+ ions, and here, highly charged Co3+ can interact strongly with HQ and CT and accept the electrons during the oxidation reaction occurring at the interface of Co3O4NR-GCE [35].

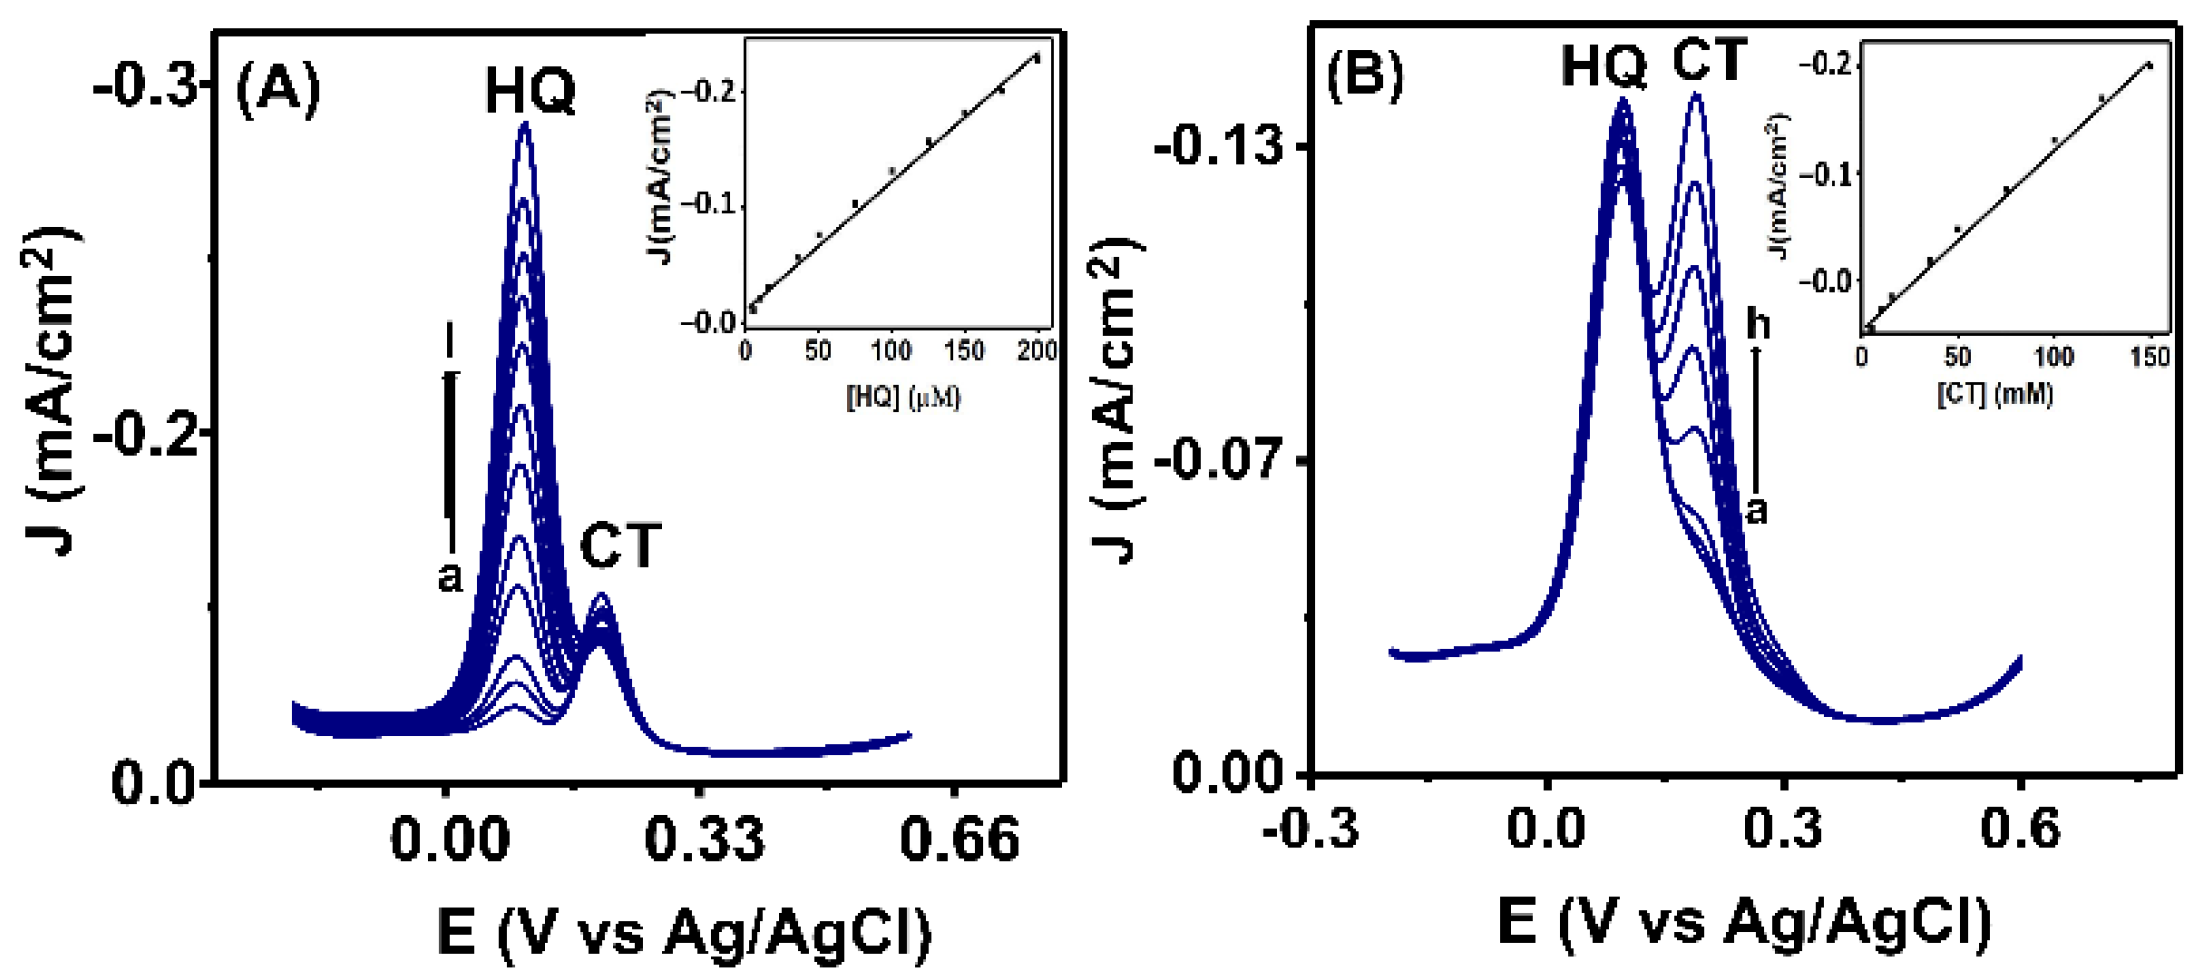
3.6. Simultaneous Determination of HQ and CT

During their simultaneous determination, the effect of concentration variation on the electrochemical response of HQ and CT at Co3O4NR-GCE was investigated by performing DPV. This process proceeded by altering the amount of one species while the amount of the counter species was kept constant. The results obtained in DPV analysis are shown in Figure 7A for different concentration (5–200 µM) of HQ while the concentration of CT (30 µM) was kept constant, and Figure 7B for different concentration (5–150 µM) of CT while the concentration of HQ (150 µM) was kept constant. It was observed in both cases that peak current increased with increasing concentration of HQ and CT, and for the constant species, a stable peak current was obtained throughout the experiment. In addition, the increased peak currents showed a linear relationship with increasing concentration. The insets of Figure 7A,B show a calibration curve obtained by plotting charge density (J) vs. concentration of HQ and CT. The linear plot was observed for HQ with a regression coefficient (R2) value of 0.98 in a concentration range of 5–200 µM, and for CT with a regression coefficient (R2) value of 0.97 in a concentration range of 5–150 µM. At the proposed modified Co3O4NR-GCE, the limits of detection were found to be 0.2 µM for HQ and 0.4 µM for CT. A comparative study of our modified electrode with other reported sensors is shown in Table 1.

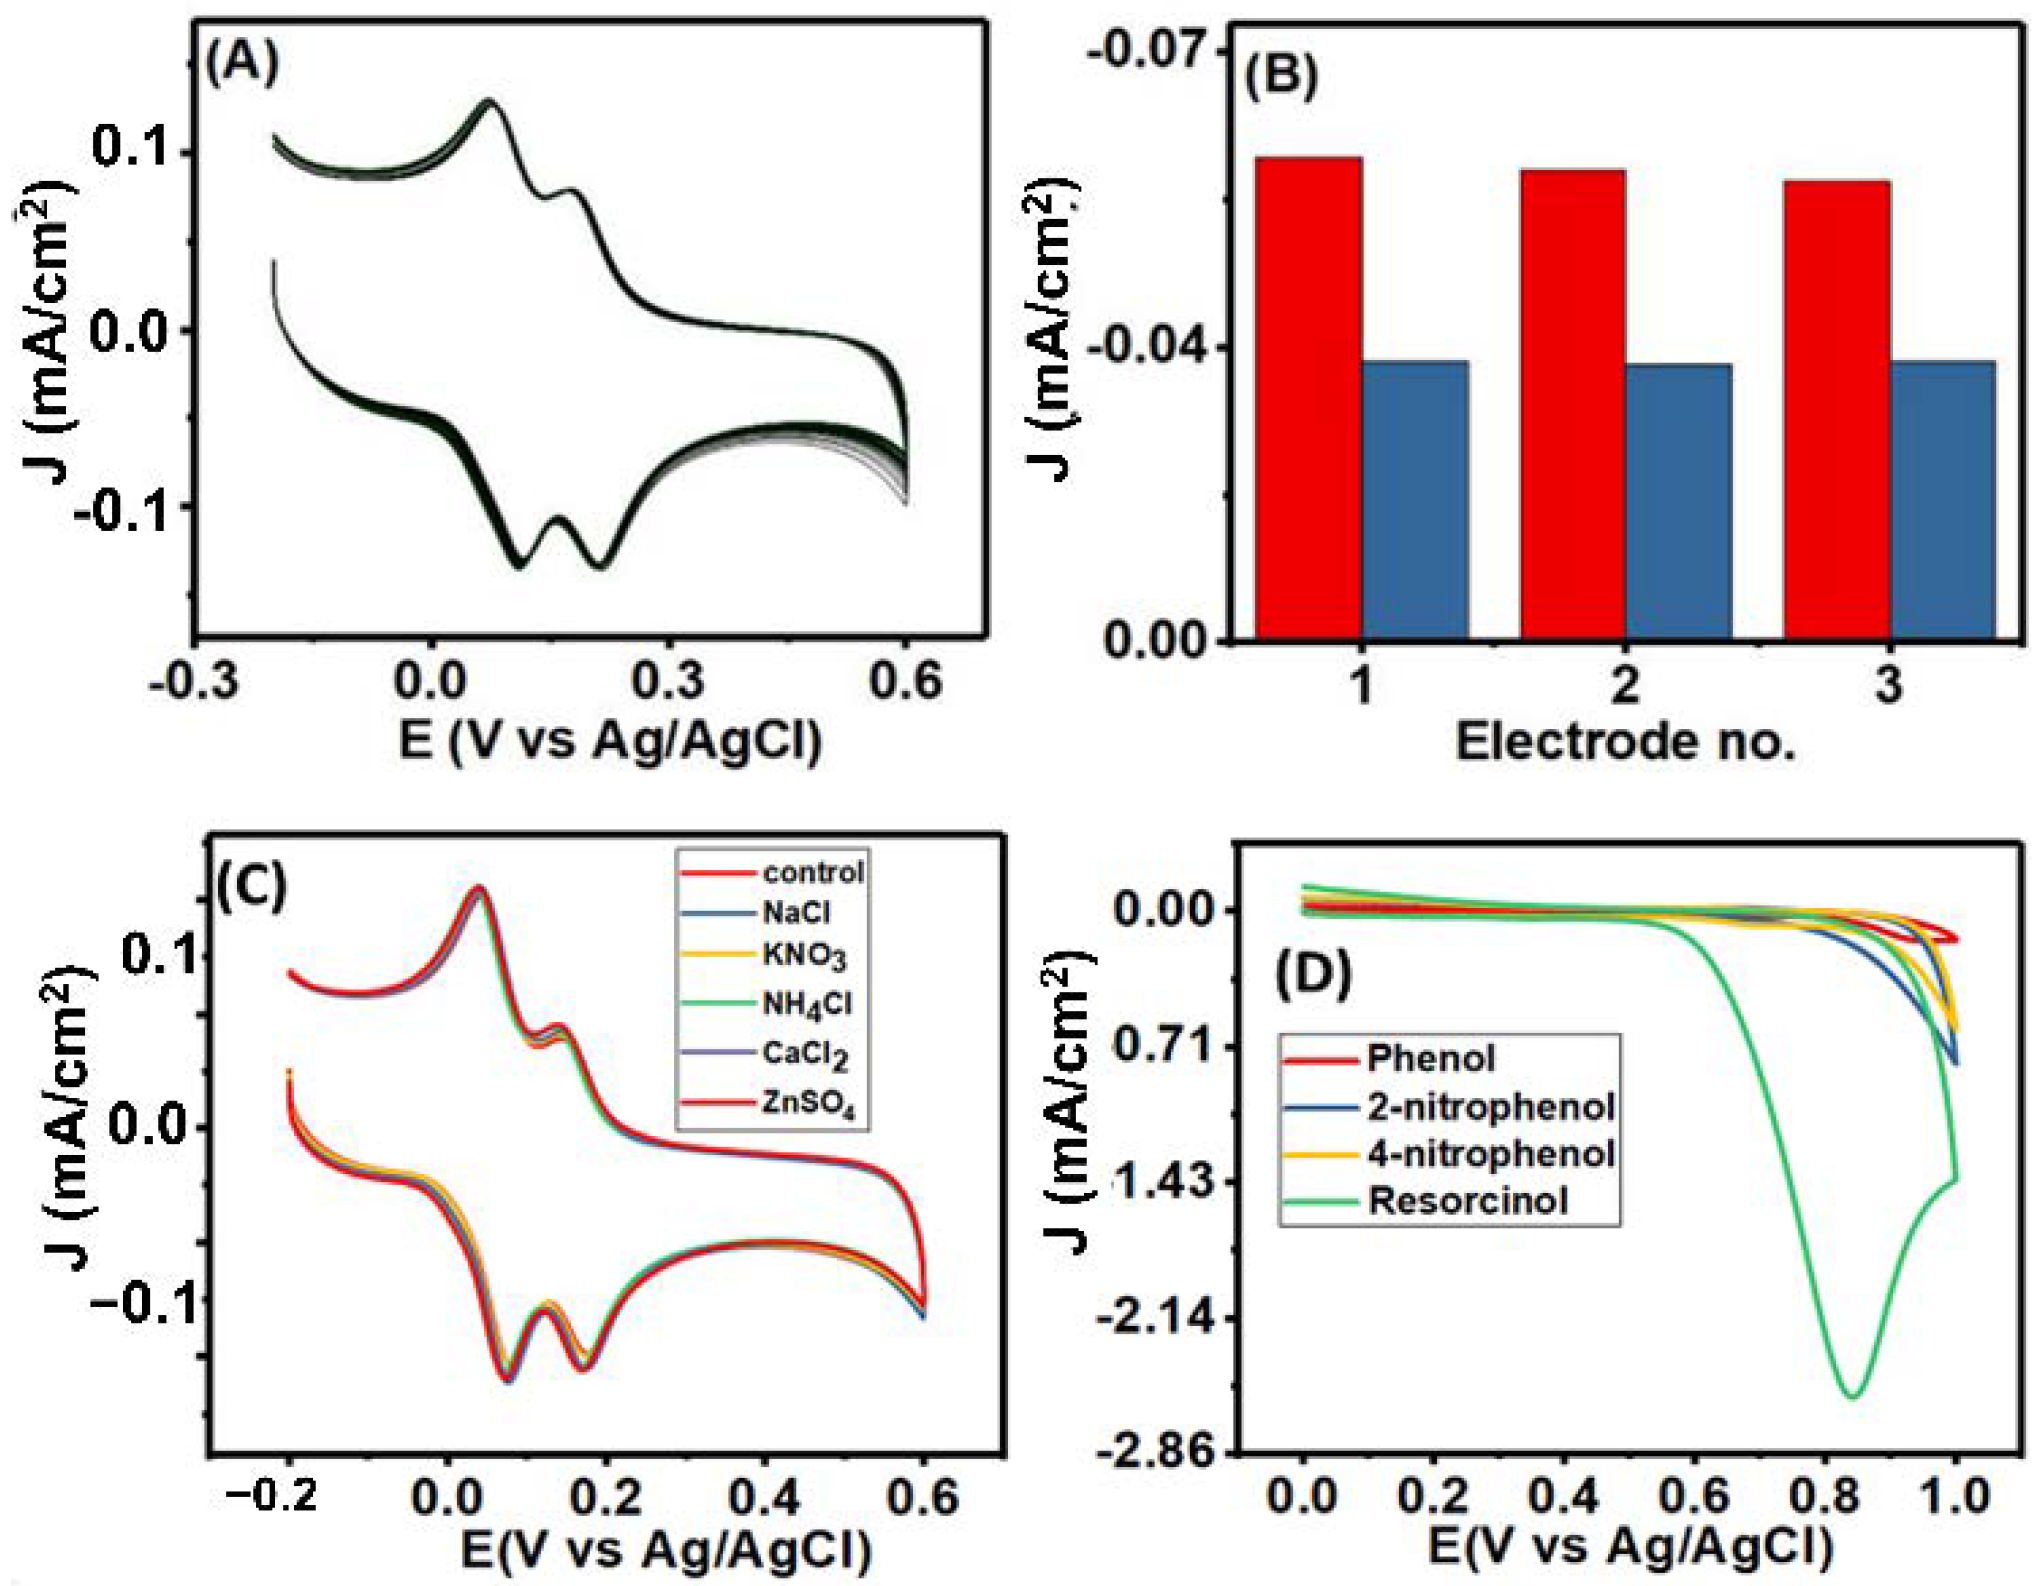
3.7. Repeatability, Stability, and Interference Studies

The repeatability of the electrochemical performance of the Co3O4NR-GCE sensor was studied by taking 40 successive CV (Figure 8A) in a mixture of 75 µM HQ and 30 µM CT within a potential window of −0.2 to 0.6 V. The oxidation peak current for both the analytes was observed at the same potential in each CV scan, and decreases in oxidation peak current were found of about 2.6% and 3.6% for HQ and CT, respectively, which indicates greater performance repeatability of Co3O4NR-GCE. The peak current was reduced to 4.45% for HQ and 4.66% for CT after storing the Co3O4NR-GCE sensor in a refrigerator at 4 °C in PBS for 7 days. The good storage performance of the modified sensor with poor relative standard deviation indicated a stable chemical composition of the Co3O4NR-GCE sensor. Three electrodes were prepared maintaining the same condition to study the reproducibility of the modified electrode. Nearly similar responses were observed for the three electrodes, as shown in Figure 8B, which indicated excellent reproducibility of the modified electrode.
In reality, different organic and inorganic compounds can exist with them in the environment, which may interfere during simultaneous determination and quantification of HQ and CT. As HQ and CT are the isomers of dihydroxy benzene, resorcinol and other phenolic compounds are considered as top interferers. In this experiment, we observed the peak response of HQ and CT at Co3O4NR-GCE in a mixture of 75 µM HQ and 30 µM CT containing a 100-fold excess (then HQ concentration) of metal ions (Na+, Ca2+, Zn2+) and also some common ions (NH4+, NO3, CO3, SO42−, Cl) as common interferers. There was no significant effect on the electrochemical response of HQ and CT for the metal ions and common ions. In cases of other similar structure of HQ and CT (phenol, 2-nitrophenol, 4-nitrophenol, resorcinol), CV was performed in 0.5 mM individual solutions in potential windows of 0–1 V, following reported procedures [6,44]. Phenol, 2-nitrophenol, and 4-nitrophenol did not respond at the modified electrode, while resorcinol showed an oxidation peak at 0.842 V, which was out of our potential window. Results of CV for the interferent study are shown in Figure 8C,D. Such results indicated the selectivity and reliability of the proposed sensor.

3.8. Real Sample Analysis

Using the standard addition method, practical applicability of the Co3O4NR-GCE sensor was investigated. Here, known amounts of HQ and CT were added in 0.1 M PBS (prepared using tap water). The recovery analysis of HQ and CT was performed by measuring current responses of DPV in sample solutions. The concentrations of two analytes in tap water were calculated, and the results are shown in Table 2. The Co3O4NR-GCE recovered 96.43–100.2% of HQ and 97.23–100.4% of CT.

4. Conclusions

The proposed Co3O4NR-GCE sensor can effectively resolve the redox peak of HQ and CT during simultaneous analysis. The detection limit was found to be 0.2 µM for HQ over a concentration range of 5–200 µM, and 0.4 µM for CT over a concentration range of 5–150 µM. Scan rate analysis revealed that oxidation of HQ and CT at Co3O4NR-GCE is diffusion controlled, and it is a multielectron transfer process without forming reaction intermediates. A pH study showed that two electrons and two protons were involved in the oxidation process of HQ and CT, and two electrons were transferred in the two consecutive steps, in which the second step was found to be the probable rate determining step. The sensor showed excellent selectivity, repeatability, and good recovery of HQ and CT from tap water. Therefore, the proposed modified electrode can be considered as a potential and reliable sensor for the detection of HQ and CT.

Author Contributions

Conceptualization, N.S. and S.D.S.; investigation, N.S., S.D.S., S.M.A.N., M.M.H., T.I.; writing—original draft preparation, N.S. and S.D.S.; writing—review and editing, S.M.A.N., M.M.H., T.I. and S.S.S.; supervision, M.M.R., M.A.A. and A.J.S.A.; funding acquisition, A.J.S.A. All authors have read and agreed to the published version of the manuscript.

Funding

This work was supported by the University Grants Commission of Bangladesh under the project 37.01.0000.073.07.008.20.76/1(3).

Institutional Review Board Statement

Not applicable.

Informed Consent Statement

Not applicable.

Conflicts of Interest

The authors declare no conflict of interest.

References

  1. Shen, X.; Xia, X.; Du, Y.; Wang, C. Electroless deposition of Au nanoparticles on reduced graphene oxide/polyimide film for electrochemical detection of hydroquinone and catechol. Front. Mater. Sci. 2017, 11, 262–270. [Google Scholar] [CrossRef]
  2. Kumar, A.A.; Swamy, B.E.K.; Ganesh, P.S.; Rani, T.S.; Reddy, G.V. Voltammetric determination of catechol and hydroquinone at poly(niacinamide) modified glassy carbon electrode. J. Electroanal. Chem. 2017, 799, 505–511. [Google Scholar] [CrossRef]
  3. Coroş, M.; Pogăcean, F.; Măgeruşan, L.; Roşu, M.; Porav, A.S.; Socaci, C.; Bende, A.; Staden, R.S. Graphene-porphyrin composite synthesis through graphite exfoliation: The electrochemical sensing of catechol. Sens. Actuators B Chem. 2018, 256, 665–673. [Google Scholar] [CrossRef]
  4. Xiang, Y.; Li, L.; Liu, H.; Shi, Z.; Tan, Y.; Wu, C.; Liu, Y.; Wang, J.; Zhang, S. One-step synthesis of three-dimensional interconnected porous carbon and their modified electrode for simultaneous determination of hydroquinone and catechol. Sens. Actuators B Chem. 2018, 267, 302–311. [Google Scholar] [CrossRef]
  5. Huang, W.; Zhang, T.; Hu, X.; Wang, Y.; Wang, J. Amperometric determination of hydroquinone and catechol using a glassy carbon electrode modified with a porous carbon material doped with an iron species. Mikrochim. Acta 2017, 185, 37. [Google Scholar] [CrossRef] [PubMed]
  6. Nayem, S.M.A.; Sultana, N.; Islam, T.; Hasan, M.M.; Awal, A.; Roy, S.C.; Aziz, M.A.; Ahammad, A.J.S. Porous tal palm carbon nanosheets as a sensing material for simultaneous detection of hydroquinone and catechol. Electrochem. Sci. Adv. 2021, e2100046. [Google Scholar] [CrossRef]
  7. Zhao, L.; Yu, J.; Yue, S.; Zhang, L.; Wang, Z.; Guo, P.; Liu, Q. Nickel oxide/carbon nanotube nanocomposites prepared by atomic layer deposition for electrochemical sensing of hydroquinone and catechol. J. Electroanal. Chem. 2018, 808, 245–251. [Google Scholar] [CrossRef]
  8. Kuskur, C.M.; Swamy, B.; Jayadevappa, H. Poly (naphthol green B) modified carbon paste electrode sensor for catechol and hydroquinone. J. Electroanal. Chem. 2017, 804, 99–106. [Google Scholar] [CrossRef]
  9. Harisha, K.; Swamy, B.; Ebenso, E.E. Poly (glycine) modified carbon paste electrode for simultaneous determination of catechol and hydroquinone: A voltammetric study. J. Electroanal. Chem. 2018, 823, 730–736. [Google Scholar] [CrossRef]
  10. Nayem, S.M.A.; Shah, S.S.; Sultana, N.; Aziz, M.A.; Ahammad, A.J.S. Sensing Platforms of Dihydroxybenzene: Part 1—Carbon Nanotubes, Graphene, and their Derivatives. Chem. Rec. 2021, 21, 1039–1072. [Google Scholar] [CrossRef]
  11. Nayem, S.M.A.; Shah, S.S.; Sultana, N.; Aziz, M.A.; Ahammad, A.J.S. Electrochemical Sensing Platforms of Dihydroxybenzene: Part 2—Nanomaterials Excluding Carbon Nanotubes and Graphene. Chem. Rec. 2021, 21, 1073–1097. [Google Scholar] [CrossRef] [PubMed]
  12. Ruengsitagoon, W.; Liawruangrath, S.; Townshend, A. Flow injection chemiluminescence determination of paracetamol. Talanta 2006, 69, 976–983. [Google Scholar] [CrossRef] [PubMed]
  13. Lin, C.; Sheu, J.; Wu, H.; Huang, Y. Determination of hydroquinone in cosmetic emulsion using microdialysis sampling coupled with high-performance liquid chromatography. J. Pharm. Biomed. Anal. 2005, 38, 414–419. [Google Scholar] [CrossRef]
  14. Sirajuddin, B.M.; Bhanger, A.; Niaz, A.; Shah, A.; Rauf, A. Ultra-trace level determination of hydroquinone in waste photographic solutions by UV–vis spectrophotometry. Talanta 2007, 72, 546–553. [Google Scholar] [CrossRef] [PubMed]
  15. Pistonesi, M.F.; Nezio, M.S.D.; Centurión, M.E.; Palomeque, M.E.; Lista, A.G.; Band, B.S.F. Determination of phenol, resorcinol and hydroquinone in air samples by synchronous fluorescence using partial least-squares (PLS). Talanta 2006, 69, 1265–1268. [Google Scholar] [CrossRef]
  16. Garcia-Mesa, J.A.; Mateos, R. Direct Automatic Determination of Bitterness and Total Phenolic Compounds in Virgin Olive Oil Using a pH-Based Flow-Injection Analysis System. J. Agric. Food Chem. 2007, 55, 3863–3868. [Google Scholar] [CrossRef]
  17. Ahammad, A.J.S.; Akter, T.; Mamun, A.A.; Islam, T.; Hasan, M.M.; Mamun, M.A.; Faraezi, S.; Monira, F.Z.; Saha, J.K. Cost-Effective Electrochemical Sensor Based on Carbon Nanotube Modified-Pencil Electrode for the Simultaneous Determination of Hydroquinone and Catechol. J. Electrochem. Soc. 2018, 165, B390–B397. [Google Scholar] [CrossRef]
  18. Jayakumar, C.; Magdalane, C.M.; Kaviyarasu, K.; Kulandainathan, M.A.; Jeyaraj, B.; Maaza, M. Direct Electrodeposition of Gold Nanoparticles on Glassy Carbon Electrode for Selective Determination Catechol in the Presence of Hydroquinone. J. Nanosci. Nanotechnol. 2018, 18, 4544–4550. [Google Scholar] [CrossRef]
  19. Sharma, V.V.; Gualandi, I.; Vlamidis, Y.; Tonelli, D. Electrochemical behavior of reduced graphene oxide and multi-walled carbon nanotubes composites for catechol and dopamine oxidation. Electrochim. Acta 2017, 246, 415–423. [Google Scholar] [CrossRef]
  20. Zheng, S.; Liu, J.; Liu, R.; Hui, Z.; Tang, J.; Wang, X. Electrochemical Determination of Hydroquinone and Catechol Using Multi-walled Carbon Nanotubes/ eosin Y Modified Glassy Carbon Electrode. J. Electrochem. Sci. 2019, 14, 6234–6246. [Google Scholar] [CrossRef]
  21. Nazari, M.; Kashanian, S.; Moradipour, P.; Maleki, N. A novel fabrication of sensor using ZnO-Al2O3 ceramic nanofibers to simultaneously detect catechol and hydroquinone. J. Electroanal. Chem. 2018, 812, 122–131. [Google Scholar] [CrossRef]
  22. Zhang, Y.; Xie, Q.; Xia, Z.; Gui, G.; Deng, F. Fulvic Acid Reduced GO and Phthalocyanine Nanorods as Reaction Platform for Simultaneous Determination of Catechol, Hydroquinone, Phenol and p-nitrophenol. J. Electrochem. Soc. 2019, 166, B1293–B1299. [Google Scholar] [CrossRef]
  23. Mohanadas, D.; Tukimin, N.; Sulaiman, Y. Simultaneous electrochemical detection of hydroquinone and catechol using poly(3,4-ethylenedioxythiophene)/reduced graphene oxide/manganese dioxide. Synth. Met. 2019, 252, 76–81. [Google Scholar] [CrossRef]
  24. Yuan, X.; Yuan, D.; Zeng, F.; Zou, W.; Tzorbatzoglou, F.; Tsiakaras, P.; Wang, Y. Preparation of graphitic mesoporous carbon for the simultaneous detection of hydroquinone and catechol. Appl. Catal. B Environ. 2013, 129, 367–374. [Google Scholar] [CrossRef]
  25. Si, W.; Lei, W.; Han, Z.; Hao, Q.; Zhang, Y.; Xia, M. Selective sensing of catechol and hydroquinone based on poly(3,4-ethylenedioxythiophene)/nitrogen-doped graphene composites. Sens. Actuators B Chem. 2014, 199, 154–160. [Google Scholar] [CrossRef]
  26. He, K.; Wang, X.; Meng, X.; Zheng, H.; Suye, S.-I. Amperometric determination of hydroquinone and catechol on gold electrode modified by direct electrodeposition of poly(3,4-ethylenedioxythiophene). Sens. Actuators B Chem. 2014, 193, 212–219. [Google Scholar] [CrossRef]
  27. Zuo, Y.; Xu, J.; Jiang, F.; Duan, X.; Lu, L.; Xing, H.; Yang, T.; Zhang, Y.; Ye, G.; Yu, Y. Voltammetric sensing of Pb(II) using a glassy carbon electrode modified with composites consisting of Co3O4 nanoparticles, reduced graphene oxide and chitosan. J. Electroanal. Chem. 2017, 801, 146–152. [Google Scholar] [CrossRef]
  28. Shinde, V.; Mahadik, S.; Gujar, T.; Lokhande, C. Supercapacitive cobalt oxide (Co3O4) thin films by spray pyrolysis. Appl. Surf. Sci. 2006, 252, 7487–7492. [Google Scholar] [CrossRef]
  29. Chen, J.; Wu, X.; Selloni, A. Electronic structure and bonding properties of cobalt oxide in the spinel structure. Phys. Rev. B 2011, 83, 245204. [Google Scholar] [CrossRef] [Green Version]
  30. Numan, A.; Shahid, M.M.; Omar, F.S.; Ramesh, K.; Ramesh, S. Facile fabrication of cobalt oxide nanograin-decorated reduced graphene oxide composite as ultrasensitive platform for dopamine detection. Sens. Actuators B Chem. 2017, 238, 1043–1051. [Google Scholar] [CrossRef]
  31. Alburquenque, D.; Vargas, E.; Denardin, J.; Escrig, J.; Marco, J.; Ortiz, J.; Gautier, J. Physical and electrochemical study of cobalt oxide nano- and microparticles. Mater. Charact. 2014, 93, 191–197. [Google Scholar] [CrossRef]
  32. Madhu, R.; Veeramani, V.; Chen, S.; Manikandan, A.; Lo, A.; Chueh, Y. Honeycomb-like Porous Carbon–Cobalt Oxide Nano-composite for High-Performance Enzymeless Glucose Sensor and Supercapacitor Applications. ACS Appl. Mater. Interfaces 2015, 7, 15812–15820. [Google Scholar] [CrossRef] [PubMed]
  33. Kang, L.; He, D.; Bie, L.; Jiang, P. Nanoporous cobalt oxide nanowires for non-enzymatic electrochemical glucose detection. Sens. Actuators B Chem. 2015, 220, 888–894. [Google Scholar] [CrossRef]
  34. Qasem, M.A.A.; Khan, A.; Onaizi, S.A.; Mohamed, H.D.; Helal, A.; Aziz, M.A. Effect of Co(NO3)2·6H2O thermal decomposition temperature on the nano-Co3O4 product morphology and electrocatalysis of water oxidation. J. Appl. Electrochem. 2019, 49, 251–259. [Google Scholar] [CrossRef]
  35. Qasem, M.A.A.; Aziz, M.A.; Hakeem, A.S.; Onaizi, S.A. Preparation of Nano-Co3O4 by Direct Thermal Decomposition of Cobalt(II) Nitrate Hexahydrate for Electrochemical Water Oxidation. Curr. Nanosci. 2017, 14, 154–159. [Google Scholar] [CrossRef]
  36. Hasan, M.M.; Islam, T.; Imran, A.; Alqahtani, B.; Shah, S.S.; Mahfoz, W.; Karim, M.R.; Alharbi, H.F.; Aziz, M.A.; Ahammad, A.J.S. Mechanistic insights of the oxidation of bisphenol A at ultrasonication assisted polyaniline-Au nanoparticles composite for highly sensitive electrochemical sensor. Electrochim. Acta 2021, 374, 137968. [Google Scholar] [CrossRef]
  37. Wang, X.; Xi, M.; Guo, M.; Sheng, F.; Xiao, G.; Wu, S.; Uchiyama, S.; Matsuura, H. An electrochemically aminated glassy carbon electrode for simultaneous determination of hydroquinone and catechol. Analyst 2016, 141, 1077–1082. [Google Scholar] [CrossRef]
  38. Dang, Y.; Wang, X.; Cui, R.; Chen, S.; Zhou, Y. A novel electrochemical sensor for the selective determination of hydroquinone and catechol using synergic effect of electropolymerized nicotinic acid film and Cd-doped ZnWO4 nanoneedle. J. Electroanal. Chem. 2019, 834, 196–205. [Google Scholar] [CrossRef]
  39. Gu, C.C.; Li, X.P.; Liu, H.Y. Simultaneous Determination of Hydroquinone, and Catechol Using a Multi-Walled Carbon Nanotube/GC Electrode Modified by Electrodeposition of Carbon Nanodots. J. Nano Res. 2018, 540, 42–53. [Google Scholar] [CrossRef]
  40. Nagarajan, S.; Vairamuthu, R.; Angamuthu, R.; Venkatachalam, G. Electrochemical fabrication of reusable pencil graphite electrodes for highly sensitive, selective and simultaneous determination of hydroquinone and catechol. J. Electroanal. Chem. 2019, 846, 113156. [Google Scholar] [CrossRef]
  41. Huang, R.; Chen, S.; Yu, J.; Jiang, X. Self-assembled Ti3C2 /MWCNTs nanocomposites modified glassy carbon electrode for electrochemical simultaneous detection of hydroquinone and catechol. Ecotoxicol. Environ. Saf. 2019, 184, 109619. [Google Scholar] [CrossRef] [PubMed]
  42. Ganesh, P.S.; Swamy, B.K.E. Simultaneous electroanalysis of hydroquinone and catechol at poly(brilliant blue) modified carbon paste electrode: A voltammetric study. J. Electroanal. Chem. 2015, 756, 193–200. [Google Scholar] [CrossRef]
  43. Skavås, E.; Hemmingsen, T. Kinetics and mechanism of sulphite oxidation on a rotating platinum disc electrode in an alkaline solution. Electrochim. Acta 2007, 52, 3510–3517. [Google Scholar] [CrossRef]
  44. Ahammad, A.J.S.; Rahman, M.M.; Xu, G.; Kim, S.; Lee, J. Highly sensitive and simultaneous determination of hydroquinone and catechol at poly(thionine) modified glassy carbon electrode. Electrochim. Acta 2011, 56, 5266–5271. [Google Scholar] [CrossRef]
Scheme 1. Schematic representation of modification of GCE using Co3O4NR and electrochemical response of HQ and CT at bare GCE and Co3O4NR-GCE.
Processes 10 00390 sch001
Figure 1. (A) FESEM images and (B) XRD pattern of Co3O4NR-GCE.
Processes 10 00390 g001
Figure 2. The results of CV (A) and Nyquist plot (B) at bare GCE (a) and Co3O4NR-GCE (b) in a 5.0 mM K3[Fe(CN)6] (in 1 M KCl).
Processes 10 00390 g002
Figure 3. (A) The results of CV at bare GCE in blank (a) and 0.5 mM HQ containing 0.1 M PBS (c) and at modified Co3O4NR-GCE in blank (b) and 0.5 mM HQ containing 0.1 M PBS (d). (B) The results of CVs at bare GCE blank (a) and 0.5 mM CT containing 0.1 M PBS (c) and at modified Co3O4NR-GCE in blank (b) and 0.5 mM CT containing 0.1 M PBS (d).
Processes 10 00390 g003
Figure 4. (A) The results of CV and (B) DPV at GCE (a) and Co3O4NR-GCE (b) in a 0.5 mM mixture of HQ and CT (0.1 M PBS pH = 7).
Processes 10 00390 g004
Figure 5. (A) The CVs at different scan rate values (a–o; 5, 10, 20, 30, 50, 70, 10, 120, 150, 170, 200, 220, 250, 270, 300 mV/s) in mixtures of 75 µM HQ and 30 µM CT in 0.1 M PBS (pH = 7). (B) The linear relationship between charge density (J) and square root of scan rate (ν−1/2). (C) The proportionality relation between peak potential (E) and logν. (D) The taffel plots related to the oxidation of HQ and CT at 5 mV/s.
Processes 10 00390 g005
Figure 6. (A) The CVs obtained at various pH values (pH = 4, 5, 6, 7, 8, 9). (B) The charge density response at various pH values. (C) The oxidation peak potentials of HQ and CT at different pH values.
Processes 10 00390 g006
Scheme 2. The probable reaction steps involved in the oxidation reaction of HQ and CT at Co3O4NR-GCE.
Processes 10 00390 sch002
Figure 7. (A) The DPV responses at different concentrations (1, 5, 10, 15, 35, 50, 75, 100, 125, 150, 175, 200 µM) of HQ; the inset figure shows the calibration plots of current density (J) vs. conc. of HQ. (B) The DPV response at different concentrations (1, 5, 15, 35, 50, 75, 100, 125, 150 µM) of CT; the inset figure shows the calibration plot of charge density (J) vs. conc. of CT.
Processes 10 00390 g007
Figure 8. (A) The consecutive 40 CVs in a mixture of 75 µM HQ and 30 µM CT (in PBS, pH = 7). (B) Current response at three different modified Co3O4NR-GCE. (C) The CV results in interference analysis against some common ions (Na+, Ca2+, Zn2+, NH4+, NO3, CO3, SO42−, and Cl in mixtures of 75 µM HQ and 30 µM CT (control = mixture of 75 µM HQ and 30 µM CT). (D) CV in 0.5 mM phenol, 2-nitrophenol, 4-nitrophenol, and resorcinol (in 0.1 M PBS).
Processes 10 00390 g008
Table 1. Comparative study of our modified electrode with other previously reported.
Modified ElectrodeTechniqueLinear Range (µM)LOD (µM)Reference
HQCTHQCT
PPGEDPV2–2002–2001.171.32[36]
PEDOT/rGO/MnO2DPV0.5–1500.25–1500.050.07[42]
AuNPs/ZnO-Al2O3/GO,chit/GCEDPV0.13–10.5–400.193.1[21]
1.5–56.6 15.0
N-GCEDPV5–2605–2600.20.2[37]
PE/CNTsDPV5–3005–3001.50.7[17]
MWCNTs/EY/GCEDPV0.4–500.4–500.010.15[20]
Co3O4NR-GCEDPV5–2005–1500.20.4This work
PPGE (pretreated pencil graphite electrode), PEDOT/rGO/MnO (2poly(3,4-ethylenedioxythiophene) reduced graphene oxide/manganese dioxide), AuNPs/ZnO-Al2O3/GO (chit/GCE Gold nanoparticles ZnO-Al2O3 ceramic nanofibers graphene oxide (GO) chitosan glassy carbon electrode), N-GCE (aminated glassy carbon electrode), PE/CNTs (carbon nanotubes pencil electrode), MWCNTs/EY/GCE (multiwalled carbon nanotubes eosin Y glassy carbon electrode).
Table 2. Recovery of HQ and CT from local tap water.
Percentage of Recovery Amount of HQ from Tap Water Containing Fixed Amount of CT
SampleTap Water Containing CT (µM)HQ Added (µM)HQ Found (µM)Recovery (%)
1203028.9396.43
2203635.9599.86
3204040.08100.2
Percentage of Recovery Amount of CT from Tap Water Containing Fixed Amount of HQ
SampleTap Water Containing HQ (µM)CT Added (µM)CT Found (µM)Recovery (%)
1203029.4798.24
2203636.14100.4
3204040.08100.2
Publisher’s Note: MDPI stays neutral with regard to jurisdictional claims in published maps and institutional affiliations.

