Abstract
Polycystic ovarian syndrome (PCOS) is an endocrine disorder that is characterized by hyperandrogenism. Therefore, information about androgen-induced molecular changes can be obtained using the tissues of patients with PCOS. We analyzed two microarray datasets of normal and PCOS muscle samples (GSE8157 and GSE6798) to identify androgen-responsive genes (ARGs). Differentially expressed genes were determined using the t-test and a meta-analysis of the datasets. The overlap between significant results of the meta-analysis and ARGs predicted from an external database was determined, and differential coexpression analysis was then applied between these genes and the other genes. We found 313 significant genes in the meta-analysis using the Benjamini–Hochberg multiple testing correction. Of these genes, 61 were in the list of predicted ARGs. When the differential coexpression between these 61 genes and 13,545 genes filtered by variance was analyzed, 540 significant gene pairs were obtained using the Benjamini–Hochberg correction. While no significant results were obtained regarding the functional enrichment of the differentially expressed genes, top-level gene ontology terms were significantly enriched in the list of differentially coexpressed genes, which indicates that a broad range of cellular processes is affected by androgen administration. Our findings provide valuable information for the identification of ARGs.
1. Introduction
Androgens are hormones that play a role in maintaining masculine characteristics in humans and other vertebrates [1]. Since androgens are necessary for the development of secondary sexual characteristics and male reproductive organs, they are also related to the development of prostate cancer and the prognosis of breast cancer [2,3]. Therefore, it is important to identify the molecular and cellular effects of androgens for the treatment of such diseases.
It is well known that the cellular effects of androgens are mediated via the DNA-binding domain of androgen receptors (ARs) [4]. When an androgen binds to the AR, an androgen–AR complex is formed. This complex, in turn, binds to the transcription initiation region of the target genes, and transcription is initiated via the corresponding polymerase enzymes. In addition to their DNA-binding activity, the ARs can activate genes via non-DNA binding-dependent actions [5].
Molecular and genomic analyses have identified androgen-responsive genes (ARGs) that are transcriptionally activated by androgens. The DNA motifs to which the androgen–AR complexes bind have been determined using gel shift assays [6,7,8,9]. In these previous studies, electrophoretic mobility shift assays were applied to identify the DNA fragments that interact with the androgen–AR complexes. With the advent of omics technologies, such as microarray and next-generation sequencing (NGS), whole-genome searches for ARGs have been performed. A previous study used the gene expression microarray data of LNCaP cells, which are androgen-sensitive human prostate adenocarcinoma cells. In total, 28 ARGs were found using an analysis of differentially expressed genes (DEGs) and DNA motifs of androgen-response elements (AREs) [10]. In another study, 692 ARGs were identified with a meta-analysis of three microarray datasets [11]. Bolton et al. performed microarray and quantitative polymerase chain reaction analyses and confirmed 108 androgen-responsive DEGs. They also performed a chromatin immunoprecipitation (ChIP)-on-chip microarray analysis to identify AREs that are located at the transcriptional start site of the ARGs. These ARGs were found to be related to the proliferation, communication, and differentiation of prostate cancer cells [12]. The ChIP microarray experiment also identified novel ARGs that were involved in prostate cancer cell growth and survival [13]. In another study, the AREs were determined using ChIP sequencing, which involves a combination of ChIP and NGS experiments. The transcriptional activities of the identified sequence motifs were validated using microarray data. Moreover, the motifs were found to be degenerated in an androgen-resistant prostate cancer cell line, compared with an androgen-sensitive one [14]. In addition to the ChIP-seq, ChIP followed by selective isolation of chromatin-associated proteins (ChIP-SICAP) was used for the identification of nuclear proteins that are involved in androgen-receptor coregulation in the castration-resistant prostate cancer cell line [15].
Several studies have been performed to identify ARGs, but most of them used prostate cancer cell lines. However, two gene expression microarray datasets of muscle samples from patients with polycystic ovarian syndrome (PCOS) were used in this study. PCOS is an endocrine disorder that is characterized by insulin resistance and hyperandrogenism [16]. As hyperandrogenism is one of the diagnostic criteria for PCOS, patients have the same condition of higher androgen exposure than the normal population. Thus, muscle samples from patients with PCOS may have transcriptional signatures that represent androgenic effects on muscle gene expression. Using DEG and differentially coexpressed gene (DCE) analyses, combined with previous knowledge, tentative ARGs were determined in this study.
2. Materials and Methods
Figure 1 shows the overall analysis flow of the current study. For the identification of muscle genes that are affected by the hyperandrogenic status of patients with PCOS, gene expression microarray data were collected from the Gene Expression Omnibus database [17]. When the search terms “polycystic ovarian syndrome”, “human”, “muscle”, and “GSE” were applied to the database, seven datasets were retrieved. The term “GSE” indicates all of the gene expression data used in a study. Of the datasets, only two microarray datasets, GSE8157 and GSE6798, included the gene expression profiles of human vastus lateralis muscles from controls and patients with PCOS. The findings of the analyses of these datasets were published previously [18,19]. The dataset GSE8157 consists of 43 muscle samples of obese patients with PCOS [18]. Thirteen of the samples were obtained from the normal control population, and 10 from obese patients with PCOS. The remaining 20 samples of this dataset were obtained from 10 patients with and 10 patients without pioglitazone treatment. These samples were excluded from the present study. In this study, PCOS was diagnosed based on the following criteria: (1) irregular periods with a cycle length > 35 days during the last year; (2) free testosterone level above the reference interval (>0.035 nmol/L); and/or (3) hirsutism. The dataset GSE6798 comprised microarray gene expression data from 13 controls and 16 patients with PCOS [19]. The diagnostic criteria for PCOS for this dataset were the same as those for the GSE8157. The controls of both datasets had obesity.
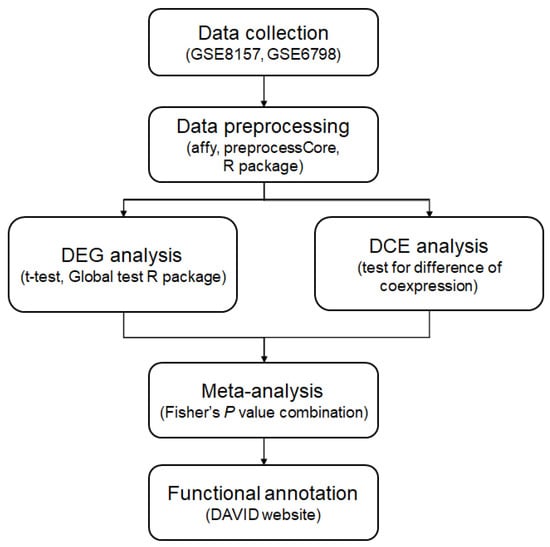
Figure 1.
Flowchart of analysis. Two PCOS datasets were collected from the GEO database. After data preprocessing and normalization, differentially expressed gene (DEG) and differentially coexpressed gene (DCE) analysis were performed. Using the p values from the DEG and DCE analysis, a meta-analysis was performed with the p value combination. For identification of biological mechanisms underlying the analysis results, functional annotation was applied.
The microarray data analysis included normalization, identification of DEGs and DCEs, and meta-analysis. The normalization was performed to extract true signals of gene expression by subtracting background signals of the microarray platform and removing possible technical biases between samples. For adjusting the background signals, the robust multichip average (RMA) method was applied [20]. Quantile normalization was then used for eliminating bias between samples [21]. After normalization, the t-test was applied to identify DEGs. The Bonferroni and Benjamini–Hochberg (BH) methods were used for multiple testing correction [22]. The p-values from the DEG analysis of the two datasets were combined using Fisher’s p-value summation method [23].
In the above equation, Pi indicates the p-value of the t-test in the i-th study, and k indicates the number of studies. The statistics of the p-value summation were tested using chi-square distribution with 2k degrees of freedom.
The differential coexpression was computed using Pearson’s correlation coefficient (PCC) and tested with the difference of the correlations between conditions [24]. The PCC between two genes was obtained from samples of each condition (Equation (2)).
In the above equation, x and y indicate gene expressions, and i is the number of samples. The transformation of the PCCs was then performed according to Equation (3), and the difference between the PCCs was tested using the statistics estimated by Equation (4) and standard normal distribution. In Equation (4), z and n indicate the transformation of the PCC and the number of samples in a condition, respectively. The subscripts of z and n represent different conditions.
In addition to single gene-wise DEG analysis, the global test was applied to determine the differentially expressed gene sets between normal and PCOS [25]. The global test modified the generalized linear model to test the differential expression of gene sets having more genes than samples. The KEGG pathway information was used for the gene set analysis [26]. The p-values from the global test were applied to the meta-analysis of the p-value combination.
To determine whether the number of ARGs in the DEGs was a random event or not, enrichment analysis using Fisher’s exact test was performed.
In Equation (5), a indicates the number of probes that are both DEGs and ARGs; b indicates the number of overlaps between DEGs and non-ARGs; c indicates the number of overlaps between non-DEGs and ARGs; and d indicates the number of remaining probes. All computations are performed with in-house scripts of the R statistical program [27].
3. Results
3.1. Normalization and Idetnficiation of DEGs
The U133 Plus 2.0 Array platform (Affymetrix®, Santa Clara, CA, USA) has 54,675 probes in total. The signals of these probes were processed to compare between the PCOS and control groups without the technical biases that occurred during experiments. The “justRMA” function of the “affy” R package was applied for RMA normalization [20]. Once gene expression signals were extracted, the “normalize.quantiles” function of the preprocessCore package was used to apply the quantile normalization method [21].
After normalization, single-linkage hierarchical clustering was applied to the datasets to determine the overall proportions of DEGs in the total number of probes of the platform. In both datasets, there was a tendency that the control and PCOS samples were separated. However, when the total population was divided into two clusters, the control and PCOS muscle samples were mixed in the clusters (Supplementary Figure S1). These findings indicate that the number of genes showing substantial expression changes was low in each expression dataset, which possibly results from the small sample sizes of the datasets.
In the DEG analysis of the GSE8157 data, two significant results were obtained using the Bonferroni correction (Figure 2 and Supplementary Table S1, adjusted p-value < 9.14 × 10⁻⁷). When the BH correction was applied, 15 significant results were obtained (Supplementary Table S1). The proline/arginine-rich end leucine-rich repeat protein (PRELP) gene expression showed the most significant difference between controls and patients with PCOS. The mean expression value for the controls was 7.16, and for the patients with PCOS, it was 7.36 (p-value = 3.90 × 10⁻⁷). In the GSE6798 data, no significant results were obtained using the same methods.
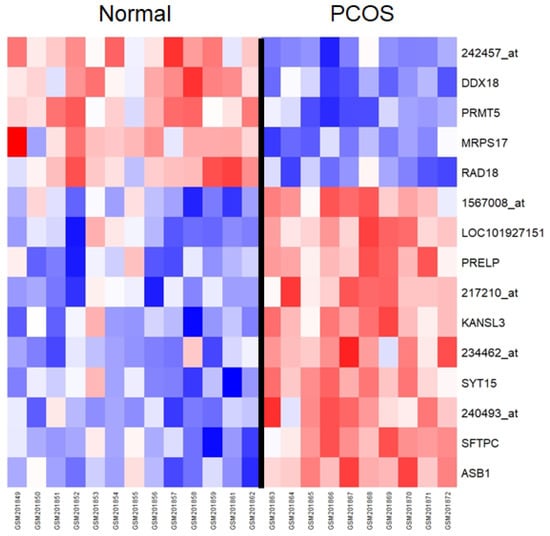
Figure 2.
Heatmap of significant genes from the differentially expressed gene (DEG) analysis of the GSE8157 dataset. Probe names are used for annotation in cases where no genes were mapped to the probes. The genes are ordered according to the ascending order of t-statistics. Normal and PCOS groups are divided using a black line. PCOS—polycystic ovarian syndrome.
3.2. Meta-Analysis of DEG Analysis
For the meta-analysis of the DEG analysis data, p-values were extracted from the t-test results and summed using Equation (1). In this analysis, the results were considered significant when the differences between the means of the two datasets had the same sign, which indicated the consistency of the results for each dataset. When the BH correction was applied, a total of 1598 probes were determined to be significant. Considering the p-value threshold of 0.05, the number of false-positive results was expected to be approximately 80 (≈1598 × 0.05). To reduce the number of possible false-positive results, the p-value cutoff was decreased to 0.01. Consequently, 313 genes were determined to be significant, which indicated that the number of false-positive results was expected to be approximately 3 (≈313 × 10−2). When the Bonferroni correction was applied, 26 probes were found to be significant (Figure 3, adjusted p-value < 9.14 × 10⁻⁷).
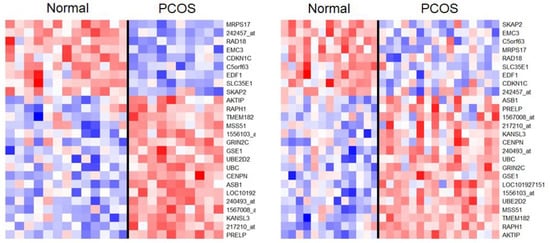
Figure 3.
Heatmaps of DEGs that were found to be significant upon using the Bonferroni correction of the meta-analysis results. As in Figure 2, probe names are used for annotation in cases where no genes were mapped to the probes. The genes are ordered according to t-statistics and the gene orders are different between the datasets (left: GSE8157, right: GSE6798). Normal and PCOS groups are divided using black lines.
Table 1 presents the highly significant results of the meta-analysis. The probe 218982_s_at for mitochondrial ribosomal protein S17 (MRPS17) showed the most significant result (meta-analysis p-value = 2.62 × 10⁻⁹). The result for MRPS17 was significant after multiple testing correction in the GSE8175 data (p-value = 4.77 × 10⁻⁷), while it was only marginally significant in the GSE6798 data (p-value = 2.30 × 10⁻⁴). The mean expression value of MRPS17 was higher in the normal group than in the PCOS group for both datasets (Table 1). The gene LOC10192715 showed the second most significant result. It showed marginal significance in both datasets (p-value = 8.65 × 10⁻⁶ in GSE8175 and 9.08 × 10⁻⁵ in GSE6798) but showed an augmented significance in the meta-analysis (p-value = 1.73 × 10⁻⁸).

Table 1.
Top 10 significant results in the meta-analysis of differentially expressed genes.
When the significant genes were compared with the predicted ARGs, 61 DEGs were found in the list of predicted ARGs (Supplementary Table S2). The ARGs were defined using information from a previous database, and 2502 genes were included in the list of ARGs [28]. The current microarray platform has the 6504 probes that were mapped to the ARGs, and the probes were used for the ARGs in the enrichment analysis. The results of the enrichment analysis indicated that the ARGs were significantly enriched in the DEGs (odds ratio = 1.8, p-value = 1.03 × 10⁻⁴).
3.3. Results of Differential Coexpression Analysis
In the gene expression microarray data, a large number of probes were present that represented the expression abundance of the corresponding transcripts (n = 54,675). Therefore, when the coexpression analysis between the probes was performed, a large number of statistical tests were required, which required higher statistical significance than the nominal p-value of <0.05. Thus, two inclusion criteria were used for the differential coexpression analysis to reduce the number of the statistical tests, which led to a relaxation of the significant p-value threshold for the multiple testing correction. First, among the transcripts that were found to be significant in the DEG meta-analysis, the 61 genes that were also found in the list of the ARGs from the external database were used for the differential coexpression analysis. Then, the transcripts other than these 61 DEGs were filtered according to the degree of variance. The probes with variances > 75th percentile of total probes, except the 61 DEGs, were selected from each dataset. The overlapping probes between the two datasets were then determined, and 13,654 probes were selected. Finally, differential coexpression analysis was performed for the 61 × 13,654 gene pairs.
When the differential coexpression analysis was independently applied to the PCOS muscle data, few significant results were obtained using the Bonferroni correction (adjusted p-value = 6.00 × 10⁻⁸). In the GSE8157 dataset, the pair of genes encoding glycerol-3-phosphate dehydrogenase 1 (GDP1; probe 213706_at) and popeye domain-containing 2 (POPDC2; probe 219647_at) showed the most significant result (Figure 4 and Supplementary Table S3, p-value = 2.84 × 10⁻⁸). In the GSE6798 dataset, the pair of genes encoding Ras homolog family member A (RHOA; probe 200059_s_at) and OTUD6B antisense RNA 1 (OTUD6B-AS1; probe 227765_at) showed the most significant result upon using the Bonferroni correction (Figure 5 and Supplementary Table S3, p-value = 1.44 × 10⁻¹⁰). OTUD6B-AS1 encodes a long non-coding RNA.
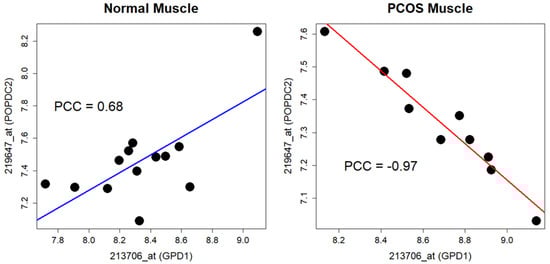
Figure 4.
Differential coexpression of GPD1 and POPDC2 in GSE8157. Note that signs of the correlations between the genes are opposite. PCOS—polycystic ovarian syndrome; PCC—Pearson’s correlation coefficient.
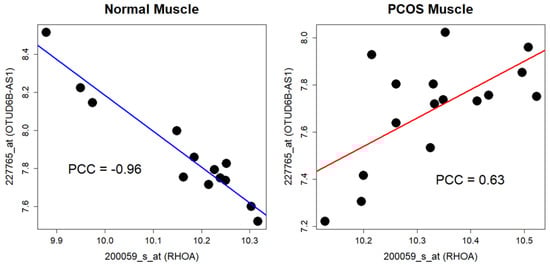
Figure 5.
Differential coexpression of RHOA and OTUD6B-AS1 in GSE6798. A negative correlation between the genes is observed in the control group, but the correlation turns positive in PCOS group, respectively. PCOS—polycystic ovarian syndrome; PCC—Pearson’s correlation coefficient.
On applying Fisher’s method to the results of the differential coexpression analyses, 31 gene pairs were found to be significant upon using the Bonferroni correction (Table 2 and Supplementary Table S3). For the identification of more gene pairs that were likely to be involved in androgen-responsive biological processes (BPs), the p-value threshold was relaxed using the BH correction, as in the DEG meta-analysis. When the adjusted p-value threshold was set to 0.05, a total of 3513 significant gene pairs were obtained. Considering the methodology of BH correction, the number of false-positive results in the list of gene pairs was expected to be approximately 176 (≈0.05 × 3513). Therefore, to decrease the number of possible false-positive results, the p-value threshold was set to 0.01. With this threshold, 540 gene pairs were found to be significant (Supplementary Table S3), and the number of possible false-positive results could be reduced to approximately 5 (≈540 × 0.01). The 540 gene pairs were used in the functional annotation. In the meta-analysis of the differential coexpression analysis data (differential coexpression meta-analysis), the RHOA–OTUD6B-AS1 pair showed the most significant result, as in the GSE6798 dataset (Table 2).
Table 2.
Top 10 Significant results of differentially coexpressed genes in meta-analysis.
Notably, in the results of the differential coexpression analysis, some ARGs showed more interactions than others, which resulted in an increased number of DCEs with a single ARG (Supplementary Figure S2). Among the 61 ARGs that showed differential expression in the meta-analysis, PTPN21 had the greatest number of degrees (n = 278), which means that over half of the significant DCE pairs included PTPN21. GSTO1 was the second most-included gene in the significant DCE pairs (n = 114). The top five genes that were most included in the significant DCE pairs together comprised 451 degrees, which is 83.5% of the total degrees.
3.4. Functional Enrichment Analysis of Significant Results
For the identification of biological implications of the DEGs, the Database for Annotation, Visualization and Integrated Discovery (DAVID) was used [29]. Among the gene sets in the DAVID, BP terms of gene ontology (GO) and transcription-factor binding site (TFBS) were used for functional annotation of the significant results. After the application of the significant probes obtained from the DEG meta-analysis into the DAVID, no significant GO BP terms were obtained. However, marginally significant GO BP terms were found that appeared to be consistent with the underlying biology. For example, BP terms that were related to the cellular physiology of muscles were listed in the top 10 results when the BP terms were sorted in the ascending order of enrichment p-values (Supplementary Table S4). Such BP terms included “actomyosin structure organization”, “muscle contraction”, “myofibril assembly”, “striated muscle contraction”, and “sarcoplasmic reticulum calcium-ion transport.” This indicated that the DEGs were closely related to the androgen-induced pathophysiology of muscles in PCOS. While no significant results were obtained on the enrichment of the GO BP terms, many significant results were obtained on the enrichment of TFBS BP terms (n = 41; Supplementary Table S5).
While the enrichment analysis showed no significant BP terms, the global test identified the biological pathways that seems to be related to the pathophysiology of PCOS. In total, five KEGG pathways were significant in the meta-analysis of the global test (Table 3). The propanoate metabolism pathway was the most significant (p-value = 2.39 × 10⁻⁷), and the pathways were related to metabolism.
Table 3.
Result of global test with KEGG pathways.
The functional enrichment test was also applied to the results of the differential coexpression meta-analysis. For the enrichment analysis, the 540 gene pairs that were identified using the BH correction were used. In the 540 pairs, there were 515 unique probes, except the 61 ARGs, and these probes were applied to the enrichment test. In the result with the GO BP terms, 94 terms were significantly enriched using the BH correction (Figure 6 and Supplementary Table S6). Interestingly, certain strong tendencies were observed in the results. First, BP terms that described a broad range of BPs, such as protein modification processes and negative regulation of cellular and metabolic processes, frequently occurred in the significant results. Second, BP terms having opposite meanings occurred concomitantly. For example, “negative regulation of biological process” and “positive regulation of biological process” terms were highly ranked by their enrichment p-values in the result. Third, muscle-related BP terms including “muscle cell differentiation”, “muscle structure development”, and “cardiac septum morphogenesis” were significant in the results upon using multiple testing correction, while they were only marginally significant in the functional enrichment analysis of the DEG analysis results. In the TFBS enrichment analysis, 137 significantly enriched TFBSs were identified, and they included the 16 TFBSs of the ARGs from the ARG database (Supplementary Table S7).
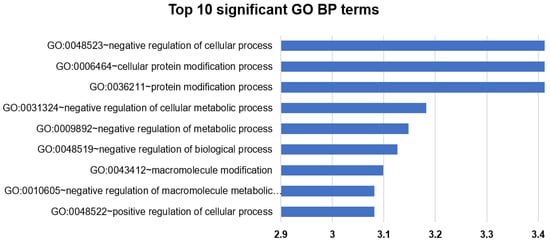
Figure 6.
Functional enrichment analysis of differentially coexpressed genes with gene ontology (GO) biological process (BP) terms. The bar indicates -log (enrichment p-values). In the figure, top 10 most significant GO BP terms are listed. See Supplementary Table S6 for the total results.
4. Discussion
In this study, ARGs in muscles were identified using the muscle gene expression data of controls and patients with PCOS. As PCOS is diagnosed based on whether hyperandrogenism is present or not, muscle samples of patients with PCOS have molecular signatures similar to those after androgen administration to muscles. Practically, muscle samples are difficult to collect. Therefore, fewer datasets with data from muscle samples are available in the Gene Expression Omnibus database. Thus, a meta-analysis is necessary to improve the statistical power that is required for the identification of genes associated with hyperandrogenism.
ARs are transcription factors that affect gene expression. In general, even a single transcription factor can modulate the expression of a large number of genes. Androgen administration to human tissues can induce many genes by the binding of the androgen–AR complex to the TFBSs in these genes. Thus, it was hypothesized that DEG analysis could provide information about the ARGs. The findings of the enrichment analysis of the meta-analysis results supported this hypothesis. The odds ratio and significance of the enrichment were high, which indicated that the occurrence of DEGs in the list of ARGs was not a random event. The other genes that were not included in the list of ARGs might also be ARGs, and this can be validated using other experimental techniques such as ChIP. In addition to such genes, other genes that were related to the enriched TFBSs in the functional annotation can be used as supportive clues to classify the ARGs in future studies.
In the functional enrichment analysis of results from the DEG analysis, only the marginal results were identified. However, the global test showed five significant pathways that are related to metabolic processes. It is well known that PCOS has abnormal metabolic pathways. Higher incidence of abnormal glucose intolerance and diabetes are one of the main features of PCOS [30], and the glycolysis/gluconeogenesis pathway was significant in the global test. Moreover, the resting pathways are related to PCOS [31,32]. Therefore, the pathways seem to be associated with androgen effects to the muscles of PCOS patients, and a regulatory mechanism between the pathways will provide integral information for the development of treatment strategies.
Of the genes that were found to be significant in the DEG meta-analysis, some genes were closely related to the pathophysiology of PCOS. For example, PTPN21 expression was found to be upregulated in the PCOS muscle samples (Table 1). PTPN21 was defined as one of the ARGs based on sequence analysis. It is a member of the protein tyrosine phosphatase (PTP) family, and some of the PTPs are known to have a role in the regulation of insulin signaling [33,34]. Therefore, PTPN21 may be one of the effector genes for insulin resistance that are activated by androgen stimulation, which is a major symptom of PCOS. In addition, the gene encoding iron-responsive element-binding protein 2 (IREB2) or iron-regulatory protein 2 (IRP2) can be related to insulin resistance. This protein is known to control the cellular metabolism of iron [35], disruption of which can cause diabetes through the induction of abnormal proinsulin processing and reduction in insulin secretion [36]. Although IREB2 was not defined as an ARG based on the sequence analysis, this gene may be responsible for impaired insulin secretion in PCOS [37], which is initiated by hyperandrogenism. In the enrichment analysis, no significant result was obtained using multiple testing correction. However, GO BP terms related to muscle differentiation and myofibril assembly were found to be marginally significant in the enrichment analysis. This finding indicates that genes that are overexpressed in the muscles of patients with PCOS might be involved in the muscle cell remodeling and lean muscle mass that are observed in PCOS [38,39].
The result of differential coexpression meta-analysis reveals a tentative regulatory relationship with ARGs. In the 515 genes that are uniquely present in the significant gene pairs excluding the ARGs, 61 genes are in the list of ARGs from the database. The proportion of previously identified ARGs in the genes is very low (OR = 0.90) compared to that of the DEG meta-analysis, and it seems that the results of differential coexpression analysis provide less information than DEG analysis in the determination of ARGs. Given the previous research indicating the potency of differential coexpression analysis in the estimation of the genetic regulatory relationship [40], the differential coexpression rather provides information about genes that are possibly regulated by ARGs.
In the differential coexpression analysis, several ARGs showed significant relationships with many genes. In particular, PTPN21 (n = 278) and GSTO1 (n = 114) were included in most of the gene pairs showing significant differential coexpression. As discussed earlier, PTPN21 is a protein-tyrosine phosphatase, and it is well known that such phosphatases regulate various molecular processes in cells, such as cell growth, differentiation, and oncogenic transformation [41,42,43]. Therefore, it is reasonable for PTPN21 to be included in many gene pairs that were found to be significant in the differential coexpression analysis. In particular, the gene encoding the abhydrolase domain, containing 18 proteins (ABHD18) and UNC5B, showed significant differential coexpression even upon using the Bonferroni correction, which uses the most stringent p-value threshold. ABHD18 is related to the increased prevalence of vaginal yeast infection [44]. Its role in PCOS has not yet been identified, but it appears to be involved in fatty acid metabolism [45]. UNC5B encodes a receptor protein that is a member of the netrin family [46]. The intracellular domain of UNC5B affects the proliferation and metastasis of bladder tumor cells by binding to several ribosomal proteins [47]. As PTPN21 is one of the ARGs, the PTPN21–UNC5B pair appears to be involved in the pathophysiology of bladder cancer. Although the role of this gene pair has not yet been elucidated in the muscles of patients with PCOS, it appears to be related to muscle cell proliferation considering the findings of previous studies. GSTO1 encodes glutathione S-transferase omega 1, which is involved in the metabolism of chemical substances, such as arsenic and α-haloketone [48]. GSTO1 is known to inhibit the apoptotic response in lung cancer cells [49], and has an anti-apoptotic role in cell resistance to cisplatin toxicity [50]. In addition, GSTO1 and GSTO2 polymorphisms are found to be associated with PCOS [51]. GSTO1 is also one of the ARGs that was defined based on sequence analysis, and had the second greatest number of significantly differential coexpressions with other genes (n = 114). Thus, it might be one of the major effector genes for molecular changes in the muscles of patients with PCOS.
In the functional enrichment analysis, top-level terms in the GO hierarchy, such as “protein modification process”, “negative regulation of cellular process”, and “negative regulation of metabolic process” were found to be significant. This finding implies that the hyperandrogenic status of PCOS has an impact on the expression of a wide range of genes, which results in significant top-level GO terms in the enrichment analysis, i.e., the androgen stimulation has an impact on a variety of cellular processes. On the contrary, specific BP terms were also found to be significant. In particular, while muscle-related GO terms were not significant in the gene list obtained via the DEG meta-analysis, terms such as “muscle cell differentiation”, “muscle structure development”, and “cardiac septum morphogenesis” were significant upon using the BH correction. These terms are relevant to PCOS muscle conditions based on the findings of previous studies [38,39,52].
5. Conclusions
In this study, tentative ARGs in muscles were determined using the gene expression data of normal and PCOS muscle samples. The DEG meta-analysis identified muscle-specific ARGs, and the differential coexpression meta-analysis determined genes that have possible regulatory relationships with the muscle-specific ARGs. The present study’s findings provide valuable information for the identification of ARGs, and these will be used in the further studies.
Supplementary Materials
The following supporting information can be downloaded at: https://www.mdpi.com/article/10.3390/pr10020387/s1, Figure S1: Dendrograms of GSE8157 and GSE679, Figure S2: Number of differentially coexpressed genes per single gene, Table S1: Significant result of DEG analysis of GSE8157, Table S2: Significant result of DEG meta-analysis, Table S3: Significant result of DCE meta-analysis, Table S4: GO enrichment analysis with significant result of DEG meta-analysis, Table S5: TFBS enrichment analysis with significant result of DEG meta-analysis, Table S6: GO enrichment analysis with significant result of DCE meta-analysis, Table S7: TFBS enrichment analysis with significant result of DCE meta-analysis.
Funding
This research was supported by Gachon University research fund (grant number: GCU-202002150001) and the National Research Foundation of Korea (NRF) grant funded by the Korea government (MSIT) (grant number: No.2021M3I2A1077405).
Institutional Review Board Statement
Not applicable.
Informed Consent Statement
Not applicable.
Conflicts of Interest
The author declares no conflict of interest.
References
- Becerra-Diaz, M.; Song, M.; Heller, N. Androgen and Androgen Receptors as Regulators of Monocyte and Macrophage Biology in the Healthy and Diseased Lung. Front. Immunol. 2020, 11, 1698. [Google Scholar] [CrossRef] [PubMed]
- Anestis, A.; Zoi, I.; Papavassiliou, A.G.; Karamouzis, M.V. Androgen Receptor in Breast Cancer-Clinical and Preclinical Research Insights. Molecules 2020, 25, 358. [Google Scholar] [CrossRef] [PubMed]
- Dai, C.; Heemers, H.; Sharifi, N. Androgen Signaling in Prostate Cancer. Cold Spring Harb. Perspect. Med. 2017, 7, a030452. [Google Scholar] [CrossRef] [PubMed]
- Tan, M.H.; Li, J.; Xu, H.E.; Melcher, K.; Yong, E.L. Androgen receptor: Structure, role in prostate cancer and drug discovery. Acta Pharmacol. Sin. 2015, 36, 3–23. [Google Scholar] [CrossRef]
- Davey, R.A.; Grossmann, M. Androgen Receptor Structure, Function and Biology: From Bench to Bedside. Clin. Biochem. Rev. 2016, 37, 3–15. [Google Scholar]
- Nelson, C.C.; Hendy, S.C.; Shukin, R.J.; Cheng, H.; Bruchovsky, N.; Koop, B.F.; Rennie, P.S. Determinants of DNA sequence specificity of the androgen, progesterone, and glucocorticoid receptors: Evidence for differential steroid receptor response elements. Mol. Endocrinol. 1999, 13, 2090–2107. [Google Scholar] [CrossRef]
- Denayer, S.; Helsen, C.; Thorrez, L.; Haelens, A.; Claessens, F. The rules of DNA recognition by the androgen receptor. Mol. Endocrinol. 2010, 24, 898–913. [Google Scholar] [CrossRef]
- Haelens, A.; Verrijdt, G.; Callewaert, L.; Peeters, B.; Rombauts, W.; Claessens, F. Androgen-receptor-specific DNA binding to an element in the first exon of the human secretory component gene. Biochem. J. 2001, 353, 611–620. [Google Scholar] [CrossRef]
- Zhou, Z.; Corden, J.L.; Brown, T.R. Identification and characterization of a novel androgen response element composed of a direct repeat. J. Biol. Chem. 1997, 272, 8227–8235. [Google Scholar] [CrossRef]
- Nelson, P.S.; Clegg, N.; Arnold, H.; Ferguson, C.; Bonham, M.; White, J.; Hood, L.; Lin, B. The program of androgen-responsive genes in neoplastic prostate epithelium. Proc. Natl. Acad. Sci. USA 2002, 99, 11890–11895. [Google Scholar] [CrossRef]
- Velasco, A.M.; Gillis, K.A.; Li, Y.; Brown, E.L.; Sadler, T.M.; Achilleos, M.; Greenberger, L.M.; Frost, P.; Bai, W.; Zhang, Y. Identification and validation of novel androgen-regulated genes in prostate cancer. Endocrinology 2004, 145, 3913–3924. [Google Scholar] [CrossRef] [PubMed]
- Bolton, E.C.; So, A.Y.; Chaivorapol, C.; Haqq, C.M.; Li, H.; Yamamoto, K.R. Cell- and gene-specific regulation of primary target genes by the androgen receptor. Genes Dev. 2007, 21, 2005–2017. [Google Scholar] [CrossRef] [PubMed]
- Jariwala, U.; Prescott, J.; Jia, L.; Barski, A.; Pregizer, S.; Cogan, J.P.; Arasheben, A.; Tilley, W.D.; Scher, H.I.; Gerald, W.L.; et al. Identification of novel androgen receptor target genes in prostate cancer. Mol. Cancer 2007, 6, 39. [Google Scholar] [CrossRef]
- Wilson, S.; Qi, J.; Filipp, F.V. Refinement of the androgen response element based on ChIP-Seq in androgen-insensitive and androgen-responsive prostate cancer cell lines. Sci. Rep. 2016, 6, 32611. [Google Scholar] [CrossRef] [PubMed]
- Launonen, K.M.; Paakinaho, V.; Sigismondo, G.; Malinen, M.; Sironen, R.; Hartikainen, J.M.; Laakso, H.; Visakorpi, T.; Krijgsveld, J.; Niskanen, E.A.; et al. Chromatin-directed proteomics-identified network of endogenous androgen receptor in prostate cancer cells. Oncogene 2021, 40, 4567–4579. [Google Scholar] [CrossRef] [PubMed]
- Anonymous. Screening and Management of the Hyperandrogenic Adolescent: ACOG Committee Opinion, Number 789. Obstet. Gynecol. 2019, 134, e106–e114. [Google Scholar] [CrossRef]
- Clough, E.; Barrett, T. The Gene Expression Omnibus Database. Methods Mol. Biol. 2016, 1418, 93–110. [Google Scholar] [CrossRef]
- Skov, V.; Glintborg, D.; Knudsen, S.; Tan, Q.; Jensen, T.; Kruse, T.A.; Beck-Nielsen, H.; Hojlund, K. Pioglitazone enhances mitochondrial biogenesis and ribosomal protein biosynthesis in skeletal muscle in polycystic ovary syndrome. PLoS ONE 2008, 3, e2466. [Google Scholar] [CrossRef]
- Skov, V.; Glintborg, D.; Knudsen, S.; Jensen, T.; Kruse, T.A.; Tan, Q.; Brusgaard, K.; Beck-Nielsen, H.; Hojlund, K. Reduced expression of nuclear-encoded genes involved in mitochondrial oxidative metabolism in skeletal muscle of insulin-resistant women with polycystic ovary syndrome. Diabetes 2007, 56, 2349–2355. [Google Scholar] [CrossRef]
- Irizarry, R.A.; Hobbs, B.; Collin, F.; Beazer-Barclay, Y.D.; Antonellis, K.J.; Scherf, U.; Speed, T.P. Exploration, normalization, and summaries of high density oligonucleotide array probe level data. Biostatistics 2003, 4, 249–264. [Google Scholar] [CrossRef]
- Bolstad, B.M.; Irizarry, R.A.; Astrand, M.; Speed, T.P. A comparison of normalization methods for high density oligonucleotide array data based on variance and bias. Bioinformatics 2003, 19, 185–193. [Google Scholar] [CrossRef]
- Korthauer, K.; Kimes, P.K.; Duvallet, C.; Reyes, A.; Subramanian, A.; Teng, M.; Shukla, C.; Alm, E.J.; Hicks, S.C. A practical guide to methods controlling false discoveries in computational biology. Genome Biol. 2019, 20, 118. [Google Scholar] [CrossRef] [PubMed]
- Poole, W.; Gibbs, D.L.; Shmulevich, I.; Bernard, B.; Knijnenburg, T.A. Combining dependent P-values with an empirical adaptation of Brown’s method. Bioinformatics 2016, 32, i430–i436. [Google Scholar] [CrossRef]
- Chowdhury, H.A.; Bhattacharyya, D.K.; Kalita, J.K. (Differential) Co-Expression Analysis of Gene Expression: A Survey of Best Practices. IEEE/ACM Trans. Comput. Biol. Bioinform. 2020, 17, 1154–1173. [Google Scholar] [CrossRef] [PubMed]
- Goeman, J.J.; van de Geer, S.A.; de Kort, F.; van Houwelingen, H.C. A global test for groups of genes: Testing association with a clinical outcome. Bioinformatics 2004, 20, 93–99. [Google Scholar] [CrossRef] [PubMed]
- Kanehisa, M.; Sato, Y.; Kawashima, M.; Furumichi, M.; Tanabe, M. KEGG as a reference resource for gene and protein annotation. Nucleic Acids Res. 2016, 44, D457–D462. [Google Scholar] [CrossRef] [PubMed]
- R Core Team. R: A Language and Environment for Statistical Computing; The R Foundation: Vienna, Austria, 2020. [Google Scholar]
- Jiang, M.; Ma, Y.; Chen, C.; Fu, X.; Yang, S.; Li, X.; Yu, G.; Mao, Y.; Xie, Y.; Li, Y. Androgen-responsive gene database: Integrated knowledge on androgen-responsive genes. Mol. Endocrinol. 2009, 23, 1927–1933. [Google Scholar] [CrossRef]
- Jiao, X.; Sherman, B.T.; Huang, D.W.; Stephens, R.; Baseler, M.W.; Lane, H.C.; Lempicki, R.A. DAVID-WS: A stateful web service to facilitate gene/protein list analysis. Bioinformatics 2012, 28, 1805–1806. [Google Scholar] [CrossRef]
- Diamanti-Kandarakis, E.; Dunaif, A. Insulin resistance and the polycystic ovary syndrome revisited: An update on mechanisms and implications. Endocr. Rev. 2012, 33, 981–1030. [Google Scholar] [CrossRef]
- Atiomo, W.; Daykin, C.A. Metabolomic biomarkers in women with polycystic ovary syndrome: A pilot study. Mol. Hum. Reprod. 2012, 18, 546–553. [Google Scholar] [CrossRef][Green Version]
- Huang, P.; Du, S.; Lin, Y.; Huang, Z.; Li, H.; Chen, G.; Chen, S.; Chen, Q.; Da, L.; Shi, H.; et al. Identification of Three Potential circRNA Biomarkers of Polycystic Ovary Syndrome by Bioinformatics Analysis and Validation. Int. J. Gen. Med. 2021, 14, 5959–5968. [Google Scholar] [CrossRef] [PubMed]
- Sevillano, J.; Sanchez-Alonso, M.G.; Pizarro-Delgado, J.; Ramos-Alvarez, M.D.P. Role of Receptor Protein Tyrosine Phosphatases (RPTPs) in Insulin Signaling and Secretion. Int. J. Mol. Sci. 2021, 22, 5812. [Google Scholar] [CrossRef] [PubMed]
- Abdelsalam, S.S.; Korashy, H.M.; Zeidan, A.; Agouni, A. The Role of Protein Tyrosine Phosphatase (PTP)-1B in Cardiovascular Disease and Its Interplay with Insulin Resistance. Biomolecules 2019, 9, 286. [Google Scholar] [CrossRef] [PubMed]
- Rouault, T.A. The role of iron regulatory proteins in mammalian iron homeostasis and disease. Nat. Chem. Biol. 2006, 2, 406–414. [Google Scholar] [CrossRef]
- Santos, M.; Anderson, C.P.; Neschen, S.; Zumbrennen-Bullough, K.B.; Romney, S.J.; Kahle-Stephan, M.; Rathkolb, B.; Gailus-Durner, V.; Fuchs, H.; Wolf, E.; et al. Irp2 regulates insulin production through iron-mediated Cdkal1-catalyzed tRNA modification. Nat. Commun. 2020, 11, 296. [Google Scholar] [CrossRef]
- Malin, S.K.; Kirwan, J.P.; Sia, C.L.; Gonzalez, F. Pancreatic beta-cell dysfunction in polycystic ovary syndrome: Role of hyperglycemia-induced nuclear factor-kappaB activation and systemic inflammation. Am. J. Physiol. Endocrinol. Metab. 2015, 308, E770–E777. [Google Scholar] [CrossRef]
- Carmina, E.; Guastella, E.; Longo, R.A.; Rini, G.B.; Lobo, R.A. Correlates of increased lean muscle mass in women with polycystic ovary syndrome. Eur. J. Endocrinol. 2009, 161, 583–589. [Google Scholar] [CrossRef]
- Mario, F.M.; do Amarante, F.; Toscani, M.K.; Spritzer, P.M. Lean muscle mass in classic or ovulatory PCOS: Association with central obesity and insulin resistance. Exp. Clin. Endocrinol. Diabetes 2012, 120, 511–516. [Google Scholar] [CrossRef]
- Bhuva, D.D.; Cursons, J.; Smyth, G.K.; Davis, M.J. Differential co-expression-based detection of conditional relationships in transcriptional data: Comparative analysis and application to breast cancer. Genome Biol. 2019, 20, 236. [Google Scholar] [CrossRef]
- Wang, H.; Ye, X.; Xiao, H.; Zhu, N.; Wei, C.; Sun, X.; Wang, L.; Wang, B.; Yu, X.; Lai, X.; et al. PTPN21 Overexpression Promotes Osteogenic and Adipogenic Differentiation of Bone Marrow-Derived Mesenchymal Stem Cells but Inhibits the Immunosuppressive Function. Stem Cells Int. 2019, 2019, 4686132. [Google Scholar] [CrossRef]
- Liu, S.; Xie, F.; Gan, L.; Peng, T.; Xu, X.; Guo, S.; Fu, W.; Wang, Y.; Ouyang, Y.; Yang, J.; et al. Integration of transcriptome and cistrome analysis identifies RUNX1-target genes involved in pancreatic cancer proliferation. Genomics 2020, 112, 5343–5355. [Google Scholar] [CrossRef] [PubMed]
- Lee, H.S.; Kim, M.W.; Jin, K.S.; Shin, H.C.; Kim, W.K.; Lee, S.C.; Kim, S.J.; Lee, E.W.; Ku, B. Molecular Analysis of the Interaction between Human PTPN21 and the Oncoprotein E7 from Human Papillomavirus Genotype 18. Mol. Cells 2021, 44, 26–37. [Google Scholar] [CrossRef]
- Tian, C.; Hromatka, B.S.; Kiefer, A.K.; Eriksson, N.; Noble, S.M.; Tung, J.Y.; Hinds, D.A. Genome-wide association and HLA region fine-mapping studies identify susceptibility loci for multiple common infections. Nat. Commun. 2017, 8, 599. [Google Scholar] [CrossRef] [PubMed]
- Bononi, G.; Tuccinardi, T.; Rizzolio, F.; Granchi, C. alpha/beta-Hydrolase Domain (ABHD) Inhibitors as New Potential Therapeutic Options against Lipid-Related Diseases. J. Med. Chem. 2021, 64, 9759–9785. [Google Scholar] [CrossRef] [PubMed]
- Pradella, D.; Deflorian, G.; Pezzotta, A.; Di Matteo, A.; Belloni, E.; Campolungo, D.; Paradisi, A.; Bugatti, M.; Vermi, W.; Campioni, M.; et al. A ligand-insensitive UNC5B splicing isoform regulates angiogenesis by promoting apoptosis. Nat. Commun. 2021, 12, 4872. [Google Scholar] [CrossRef] [PubMed]
- Huang, Y.; Zhang, Z.; Miao, M.; Kong, C. The intracellular domain of UNC5B facilities proliferation and metastasis of bladder cancer cells. J. Cell Mol. Med. 2021, 25, 2121–2135. [Google Scholar] [CrossRef]
- Board, P.G. The omega-class glutathione transferases: Structure, function, and genetics. Drug Metab. Rev. 2011, 43, 226–235. [Google Scholar] [CrossRef]
- Wang, K.; Zhang, F.L.; Jia, W. Glutathione Stransferase omega 1 promotes the proliferation, migration and invasion, and inhibits the apoptosis of nonsmall cell lung cancer cells, via the JAK/STAT3 signaling pathway. Mol. Med. Rep. 2021, 23, 71. [Google Scholar] [CrossRef]
- Piaggi, S.; Raggi, C.; Corti, A.; Pitzalis, E.; Mascherpa, M.C.; Saviozzi, M.; Pompella, A.; Casini, A.F. Glutathione transferase omega 1-1 (GSTO1-1) plays an anti-apoptotic role in cell resistance to cisplatin toxicity. Carcinogenesis 2010, 31, 804–811. [Google Scholar] [CrossRef]
- Miraghaee, S.S.; Sohrabi, M.; Jalili, C.; Bahrehmand, F. Assessment of GSTO1 (A140D) and GSTO2 (N142D) Gene Polymorphisms in Iranian Women with Polycystic Ovarian Syndrome. Rep. Biochem. Mol. Biol. 2020, 9, 8–13. [Google Scholar] [CrossRef]
- Sakakibara, I.; Yanagihara, Y.; Himori, K.; Yamada, T.; Sakai, H.; Sawada, Y.; Takahashi, H.; Saeki, N.; Hirakawa, H.; Yokoyama, A.; et al. Myofiber androgen receptor increases muscle strength mediated by a skeletal muscle splicing variant of Mylk4. iScience 2021, 24, 102303. [Google Scholar] [CrossRef] [PubMed]
Publisher’s Note: MDPI stays neutral with regard to jurisdictional claims in published maps and institutional affiliations. |
© 2022 by the author. Licensee MDPI, Basel, Switzerland. This article is an open access article distributed under the terms and conditions of the Creative Commons Attribution (CC BY) license (https://creativecommons.org/licenses/by/4.0/).