Article

Temperature Effects of MD on Municipal Wastewater Treatment in an Integrated Forward Osmosis and Membrane Distillation Process

Faculty of Engineering and Physical Sciences, University of Southampton, Southampton SO17 1BJ, UK
*
Author to whom correspondence should be addressed.
Processes 2022, 10(2), 355; https://doi.org/10.3390/pr10020355
Submission received: 13 January 2022 / Revised: 4 February 2022 / Accepted: 4 February 2022 / Published: 12 February 2022
(This article belongs to the Special Issue New Frontiers in Membrane Separation)

Abstract

:
An integrated forward osmosis (FO)-membrane distillation (MD) process is promising for the treatment and resource recovery from municipal wastewater. As higher temperature is applied in MD, it could affect the performance of both FO and MD units. This study aimed to investigate the effects of the type of draw solution (DS) and feed solution (FS) such as ammonium solution or municipal wastewater containing ammonium at higher temperatures on membrane treatment performance. It is found that higher FS and DS temperatures resulted in a higher water flux and a higher RSF with either NaCl or glucose as DS due to the increased diffusivity and reduced viscosity of DS. However, the water flux increased by 23–35% at elevated temperatures with glucose as DS, higher than that with NaCl as DS (8–19%), while the reverse solute flux (RSF) increase rate with NaCl as DS was two times higher than that with glucose as DS. In addition, the use of NaCl as DS at higher temperatures such as 50 and FS at 42 °C resulted in increased forward ammonium permeation from the FS to the DS, whereas ammonium was completely rejected with glucose as DS at all operating temperatures. Reducing pH or lowering the temperature of DS could improve ammonium rejection and minimize ammonia escape to the recovered water, but extra cost or reduced MD performance could be led to. Therefore, the results suggest that in an integrated FO-MD process with DS at higher temperatures such as 50 °C, glucose is better than NaCl as DS. Furthermore, a simplified heat balance estimation suggests that internal heat recovery in the FO-MD system is very necessary for treating municipal wastewater treatment. This study sheds light on the selection of DS in an integrated FO-MD process with elevated temperature of both FS and DS for the treatment of wastewater containing ammonium. In addition, this study highlights the necessity of internal heat recovery in the integrated FO-MD system.

1. Introduction

The increasing demand for fresh water with the growth of the world’s population and industrialisation means that around 1.8 billion people would be in water shortage by 2025 [1]. To address this issue, alternative water sources such as seawater or treated wastewater are being explored. Desalination could pose serious brine discharge problem and also has higher cost [2] while recovery of fresh water from treated wastewater looks more economically promising. Currently, reverse osmosis (RO) has been implemented in a few of areas to recover fresh water from treated municipal wastewater. However, RO process is usually used as the part of the tertiary treatment, which complicates the whole wastewater treatment process. Secondly, RO usually demands high energy because it is a pressure-driven membrane filtration process [3]. By contrast, forward osmosis (FO) as a osmotic pressure driven process is attractive with the potential to replace conventional energy-intensive processes [4]. FO has been reported to have the high rejection rates of nearly all contaminants from municipal wastewater, which could be directly used to treat municipal wastewater by concentrating pollutants for direct nutrient recovery through precipitation and direct energy recovery through anaerobic digestion (AD) [5]. FO process usually cannot be used standalone, and another process is needed to regenerate draw solution (DS) unless diluted DS could be directly used for other purposes. Membrane distillation (MD) is believed to be one of the most promising technologies to be integrated with FO for the regeneration of DS and water recovery given the fact that low-grade waste heat from power plants or other industrial processes could be used to provide the heat demanded in MD. Furthermore, MD has high rejection rates of contaminants (almost 100% rejection of non-volatile contaminants), less capital cost and a smaller footprint [6].
To regenerate DS from FO and recover water from DS in an integrated FO-MD process, the DS stream has to be heated to a higher temperature, such as 50 °C, to produce a water vapour pressure difference between DS and permeate as a driving force [6]. Once the temperature of DS is increased, the contact between DS and FS in the FO module via membrane unavoidably results in a heat transfer between hot (DS) and cold (FS) streams, leading to an increased temperature of FS. In the vast majority of cases, to achieve a certain level of concentration of pollutants for wastewater treatment purpose, FS and DS have to be recirculated, which results in more heat transfer between FS and DS, more heat loss to FS and a higher temperature of FS.
The FS temperature in the integrated FO-MD process in previous studies was usually set at 25 °C or lower without considering the heat transfer between DS and FS [6,7,8]. Additionally, a better contaminate rejection by FO was found at lower temperatures. For example, when the FS temperature increased from 20 to 40 °C, the rejection of neutral trace organic compounds (TrOCs) decreased significantly due to increased diffusivity of TrOCs at a higher FS temperature [9]. The increase in the DS temperature results in higher reverse inorganic solute flux as well, due to the higher diffusivity of DS [10]. Thus, from perspectives of contaminate rejection and of reverse solute flux in FO, the increase in temperature might exert negative effects. However, the previous studies were restricted to limited types of DS, and it is unclear if the negative temperature effects are applicable to a wide range of DS with different physico-chemical properties.
Another potential impact from higher temperature for FO is on ammonium. As reported, ammonium rejection by FO is usually poor due to the negatively charged membrane surface of thin film composite (TFC) FO [11,12], leading to a higher ammonium concentration in DS. This ammonium in DS could permeate to a clean water stream during the filtration process by MD, affecting the quality of recovered water. Thus, understanding the effects of both FS and DS temperature on ammonium rejection is important for the improvement of ammonium rejection in the integrated FO-MD process for the treatment of municipal wastewater or other types of wastewater containing a higher ammonium concentration. In our previous study, we found that the use of non-ionic DSs, such as glucose, improved ammonium rejection to almost 100% at 20 °C. However, it is still unclear whether an increase in FS and DS temperatures can affect ammonium rejection using a non-ionic DS.
Temperature also affects FO membrane fouling, which is more complicated. Kim et al. [3] reported that the increase in the FS temperature from 20 to 35 °C resulted in lower organic fouling of the FO membrane due to an increase in organic solubility as well as enhanced organic back diffusion from the membrane surface when using 3 M NaCl as DS. However, a temperature increase of FS would be beneficial for the precipitation of calcium phosphate, as the dissolvability of calcium phosphate is lower at high temperatures [13], resulting in more severe inorganic fouling.
Apart from the above-mentioned potential impacts from temperature, water flux would be increased due to the increased diffusivity and decreased viscosity of both FS and DS at a higher temperature. However, so far there are no clear studies yet on the systematic evaluation of positive and negative effects that higher temperature might exert on municipal wastewater treatment in an integrated FO-MD process.
This study aimed to investigate temperature effects on FO and MD with three different types of DSs, i.e., NaCl, MgCl2 and glucose for wastewater treatment. Water flux, ammonium rejection, contaminates rejection (i.e., COD, phosphate, Ca2+, Mg2+ and K+) and membrane fouling in short periods were compared at different FO temperatures. Lastly, a simplified heat balance was conducted to discuss the practicality of an integrated FO-MD from the perspective of heat demand for municipal wastewater treatment.

2. Materials and Methods

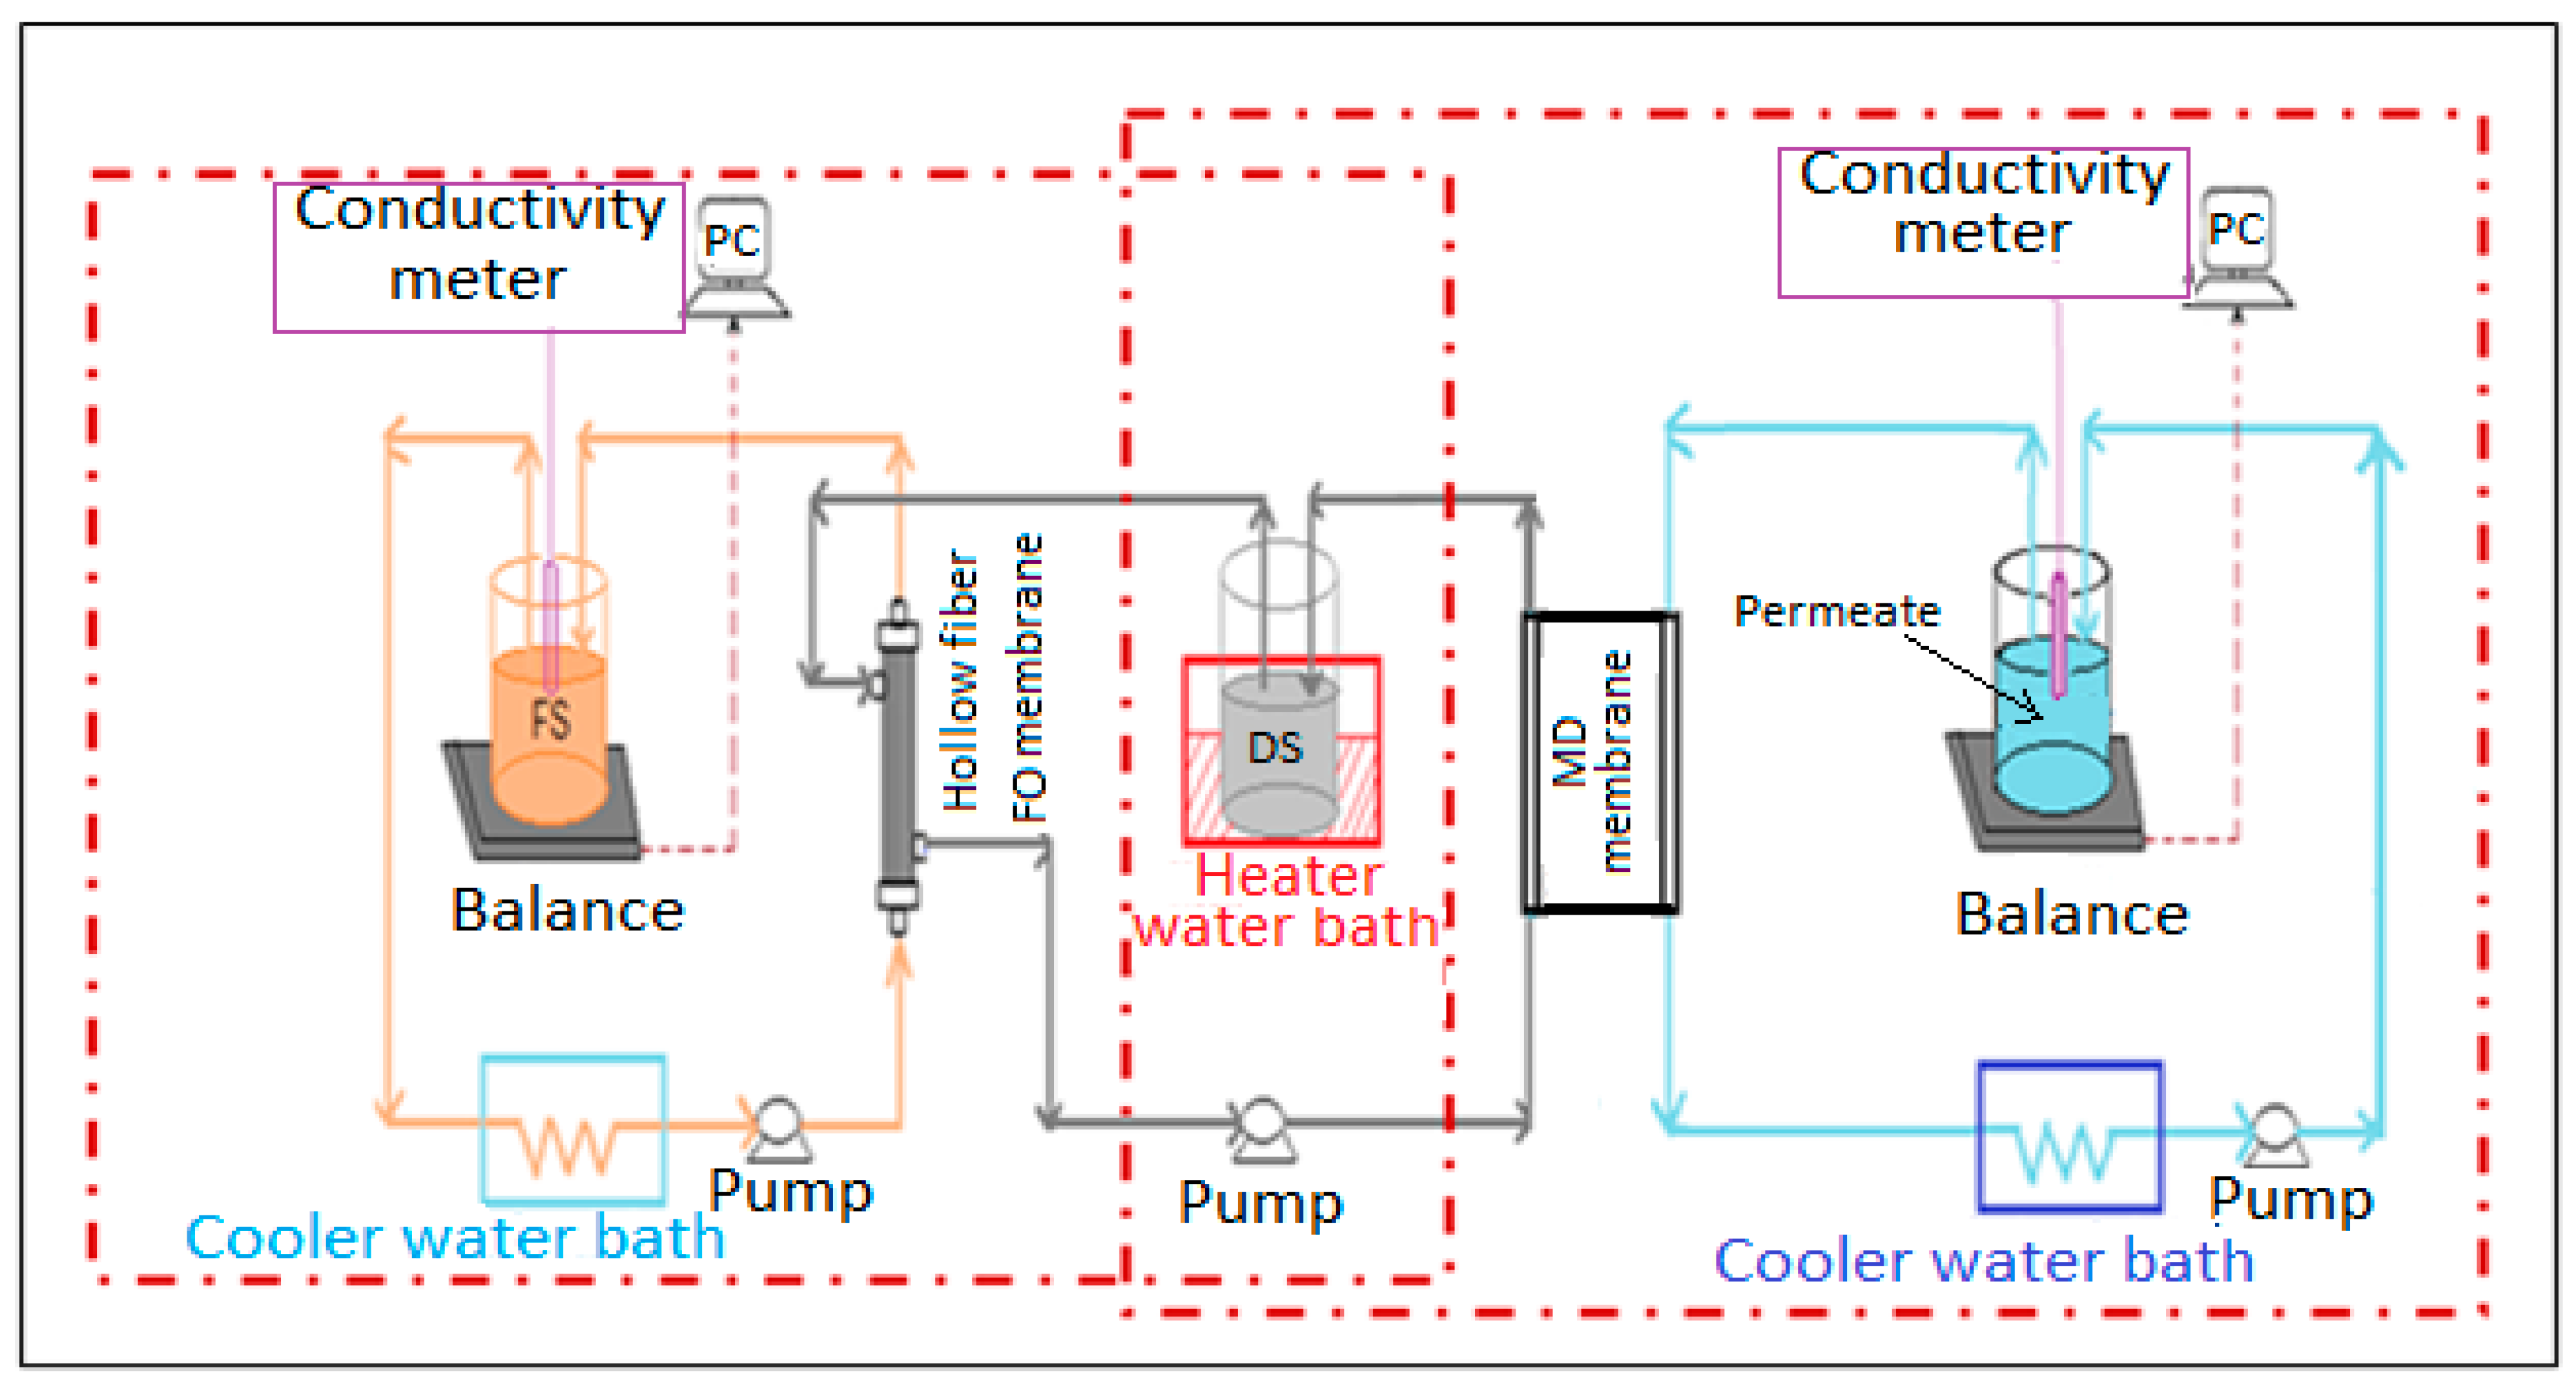
2.1. FO and MD Membranes and the Experimental Setup

Hollow fiber TFC membranes developed by the Singapore Membrane Technology Centre (Singapore) were used in this study, and details of this FO membrane can be found in our previous publication [14]. A polytetrafluoroethylene (PTFE) flat-sheet hydrophobic membrane (Sterlitech, Auburn, WA, USA) was used for a direct contact MD with a membrane pore size of 0.2 µm, a thickness of 76–152 µm and an active area of 42 cm2. The PTFE membrane can be operated at a pH range of 1–14 and a maximum operating temperature of 82 °C.
Lab-scale FO and MD experiments were conducted separately to study each individual processes. FO membrane experiments were run with the orientation of the active layer facing FS (AL-FS). In the MD experiments, a membrane cell (Sterlitech CF042D-FO Cell, Auburn, WA, USA) was used that consists of structured rectangular channels, with outer dimensions of 12.7 cm long, 10 cm wide and 8.3 cm deep. In the FO process, the FS and DS temperatures were set as follows: (i) both FS and DS at 25 °C to simulate an ambient temperature; (ii) FS at 25 °C and DS at 50 °C for simulating FS at an ambient temperature and high temperature of DS and (iii) the DS at 50 °C while FS without the control of temperature, which increases simply due to the heat gained by contacting the FO membrane with a high temperature DS. The FS temperature was controlled by going through a helical polyvinylchloride (PVC) tube coil immersed into a water bath with a pre-set temperature (Julabo, Stamford, UK) before recirculating, while the DS temperature was controlled by directly placing the DS tank into a water bath with a constant temperature (PolyScience, Niles, MI, USA), as shown in Figure 1.
In both FO and MD rigs, counter-current recirculation of the FS and DS was applied on each side of the FO and MD membranes using two peristaltic pumps at flowrates of 0.6 L/min. The FS tank in the FO system and the permeate tank in the MD system were placed on a digital balance each (Kern, Kassel, Germany) connected to a PC, and the water flux was calculated based on the recorded weight changes from the balances during experimental periods.

2.2. Feed Solution and Draw Solution

Synthetic municipal wastewater was prepared to simulate municipal wastewater reported by Metcalf [15] with measured values as 460.66 ± 32.54 mg/L COD (with NaAc∙3H2O as COD with 1041 mg/L), 7.90 ± 0.15 mg/L PO43--P (with KH2PO4 for P), 53.96 ± 0.66 mg/L ammonium-N (with (NH4)2SO4 for N), 37.25 ± 0.73 mg/L Ca2+, 6.28 ± 0.35 mg/L Mg2+ and 20.27 ± 1.36 mg/L K+ to investigate the effects of FS and DS temperatures on the FO membrane filtration. In addition, synthetic water containing only 50 mg/L ammonium-N (with (NH4)2SO4 for N) was used to study effects of the DS type on ammonium rejection by MD.
Two DSs with the same osmotic pressure, i.e., 0.6 M NaCl as an ionic DS and 1.2 M glucose as a non-ionic DS, were used to examine effects of FS and DS temperatures on FO filtration. For ammonium rejection in the MD study, NaCl, MgCl2 and glucose as DSs at 35 g/L were used to study DS regeneration and possible ammonium contamination on recovered clean water.

2.3. Operation of the Experimental Rigs

To test effects of FS and DS temperatures on water flux and RSF in the FO membrane filtration process, experiments were firstly conducted using deionized (DI) water as FS and 0.6 M NaCl or 1.2 M glucose as DSs with initial volumes of 1 L for both FS and DS. To determine the RSF of the DS during the FO process, the conductivity (Hanna HI700 instrument, HI7639 probe, Bedfordshire, UK) of the FS was measured every 15 min when using NaCl as the DS, while a 10 mL sample was taken from the FS tank every 15 min for COD analysis to determine the reverse glucose flux from DS to FS. All FO experiments to determine the water flux and RSF in this study lasted for at least 2 h. When synthetic municipal wastewater was used, FO experiments at different FS and DS temperatures were conducted until a 70% water recovery rate was obtained. FO membrane fouling with synthetic municipal wastewater FS and 0.6 M NaCl DS was further investigated by applying three consecutive cycles with a 70% water recovery.
To test the effects of the DS type on MD membrane flux and ammonium rejection, the MD membrane was placed in a flat-sheet configuration. The initial volume for the permeate and DSs was 1 L, and the pH of both the permeate and DS was adjusted to 7. A sample of 15 mL was taken every 1 h from the permeate solution for analysis of the permeated ammonium. All MD experiments on ammonium rejection lasted for 6 h.

2.4. Analytical Methods

COD, ammonium and phosphate were measured in accordance with standard methods (APHA 1998). The concentration of soluble elements (Ca2+, Mg2+ and K+) was analysed using ion chromatography (882 Compact IC plus, Metrohm, Herisau, Switzerland) by a Metrosep C4-250/4.0 column with eluent containing 1.7 Mm/L nitric acid and 0.7 mM/L dipicolinic acid.

2.5. Calculations

2.5.1. Water Flux and Reverse Solute Flux

Water flux across the FO and MD membranes was calculated from the volume change of the FS or the permeate using Equation (1):
J w = Δ V Δ t   ×   A m
where Jw (L/m2·h) is the water flux across the membrane; ΔV (L) is the volume change in the FS or the permeate; Δt (h) is the duration of the test; and Am (m2) is the active membrane area.
The RSF (Js) was calculated using Equation (2):
Js = V Ft 2 . C Ft 2   V Ft 1 . C Ft 1 Δ t   ×   A m
where Js (g/m2·h) is the RSF; VFt2 (L) and VFt1 (L) are the volume of the FS at the recorded time t2 and t1, respectively; and CFt2 (g/L) and CFt1 (g/L) are the solute mass concentrations in the FS at recorded times t2 and t1, respectively. The concentration of reverse salt was obtained by measuring the conductivity of FS at different times according to the calibration curve built between different NaCl concentrations and the conductivity of the NaCl solution. The concentration of reverse glucose flux was obtained by measuring the COD of FS at different times according to the calibration curve between glucose concentration and COD.
The osmotic pressures of the NaCl and glucose DSs were calculated using the van’t Hoff equation [16,17,18,19,20]:
Π = iMRT
where Π (atm) is the osmotic pressure; i is the van’t Hoff factor of the solute, M (mol/L) is the molar concentration; R is the universal gas constant (0.08206 L.atm/mol.l); and T is the absolute temperature in K.

2.5.2. Concentration Factor and Rejection Rate of Contaminates in FS

The concentration factor (CF) was calculated as the ratio between the FS concentration at time t (Ct) and the initial FS concentration (C0) (Equation (4)):
CF = C t C 0
The rejection rate (R) of the contaminants was calculated based on the mass balance between the FS and the DS:
R = ( 1 V df *   C df V fi *   C fi )   ×   100 %
where Vdf (L) is the final volume of the DS; Cdf (mg/L) is the final contaminate concentration in the DS; Vfi (L) is the initial FS volume; and Cfi (mg/L) is the initial contaminate concentration in the FS.

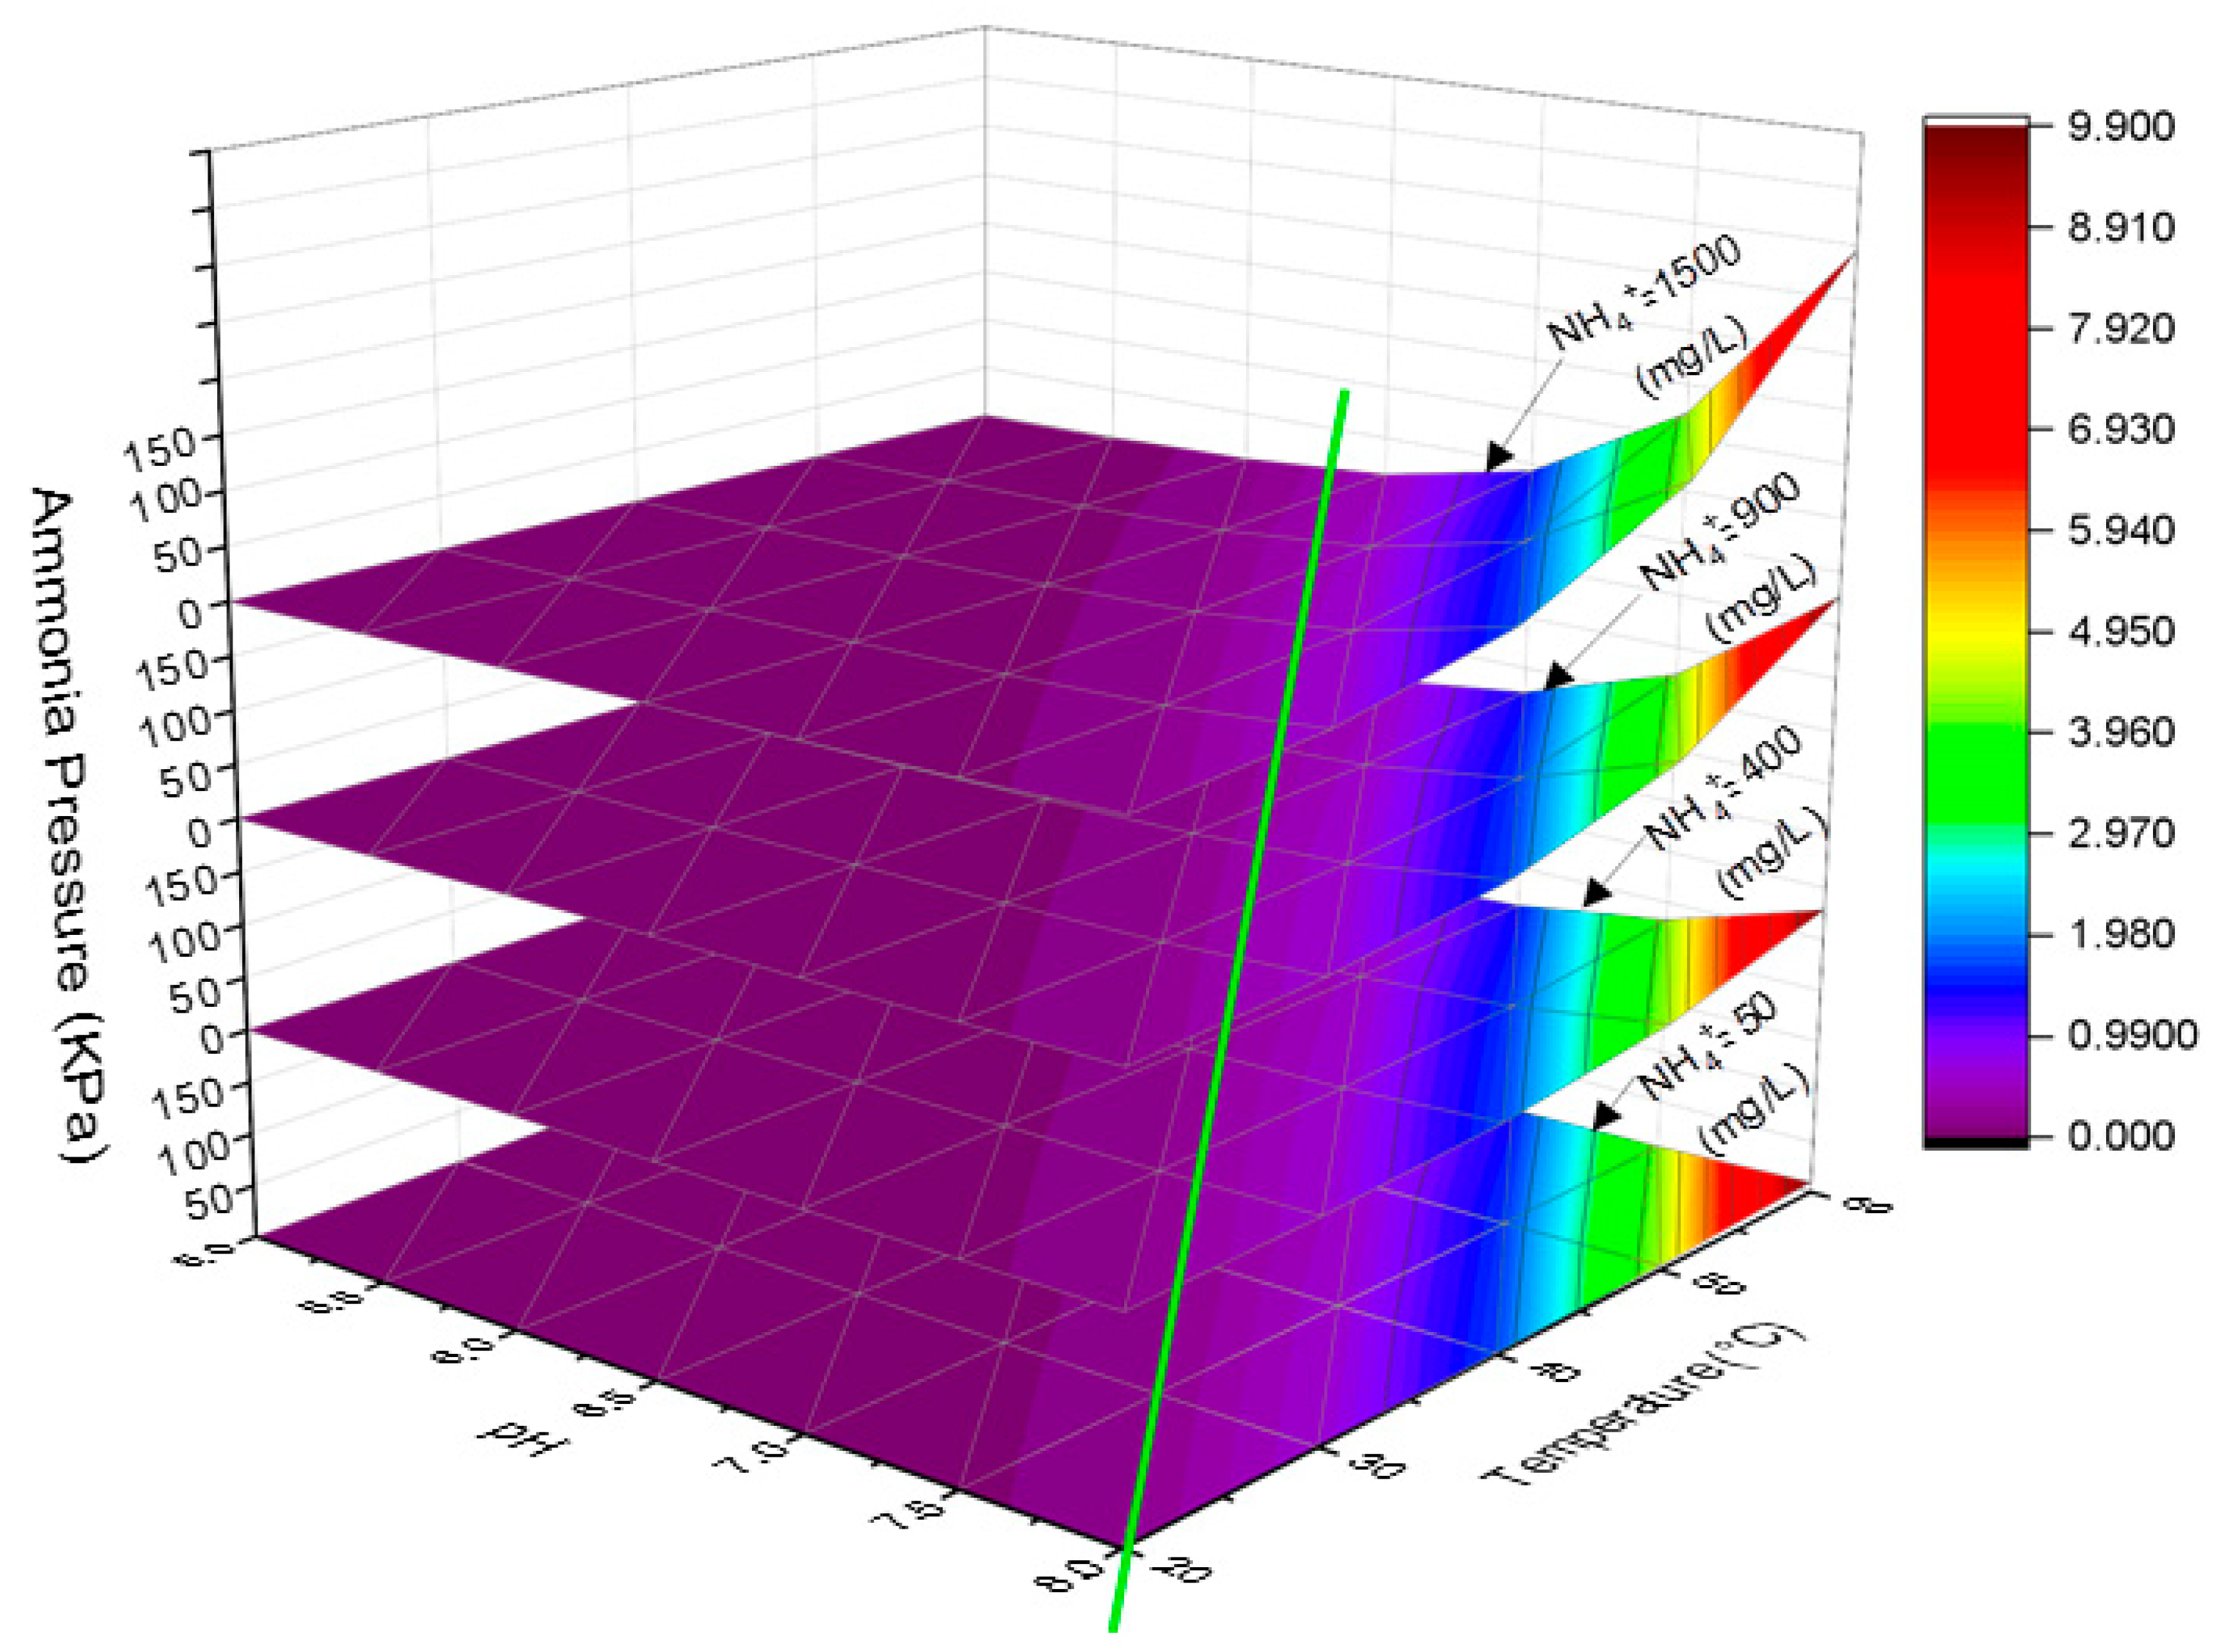
2.5.3. Ammonia Pressure in the MD

The water vapour pressure in DS was calculated using the following formula [21,22]:
PA = XA PA*
where PA (kPa) is the vapour pressure of the solution; XA is the mole fraction of the solvent, and PA* (kPa) is the vapour pressure of the pure solvent.
The equilibrium between ammonium and ammonia in DS solution was affected by ammonium concentration, temperature and pH, which could be expressed using the following formula [23]:
FA = 17 14   ×   [ NH 4 + N ] × 10 pH   e ( 6334 T ) + 10 pH
where FA is the free ammonia concentration (mg/L) in aqueous solution; NH4+-N is the ammonium-nitrogen concentration (mg/L), and T is the temperature of the solution in K.
The vapour pressure of ammonia in DS is calculated using Henry’s law [24]:
C = H P
where P is the partial pressure of the ammonia (atm); H is Henry’s constant, and C is the concentration of ammonia in aqueous solution (M). Henry’s law constant (H) is roughly estimated by using the following formula [25]: H =   e ( 4341 T 10.47 ) with the assumption that ammonia solubility is not affected by solution salinity and pH. In addition, the equation neglects the autoprotolysis of water. By combining Equations (7) and (8), the pressure of ammonia could be estimated as below:
P ammonia = [ 1 14 × [ NH 4 + N ] × 10 pH   e ( 6334 T ) + 10 pH ] / [ e ( 4341 T 10.47 ) ]
where Pammonia is the ammonia vapour pressure in atm.

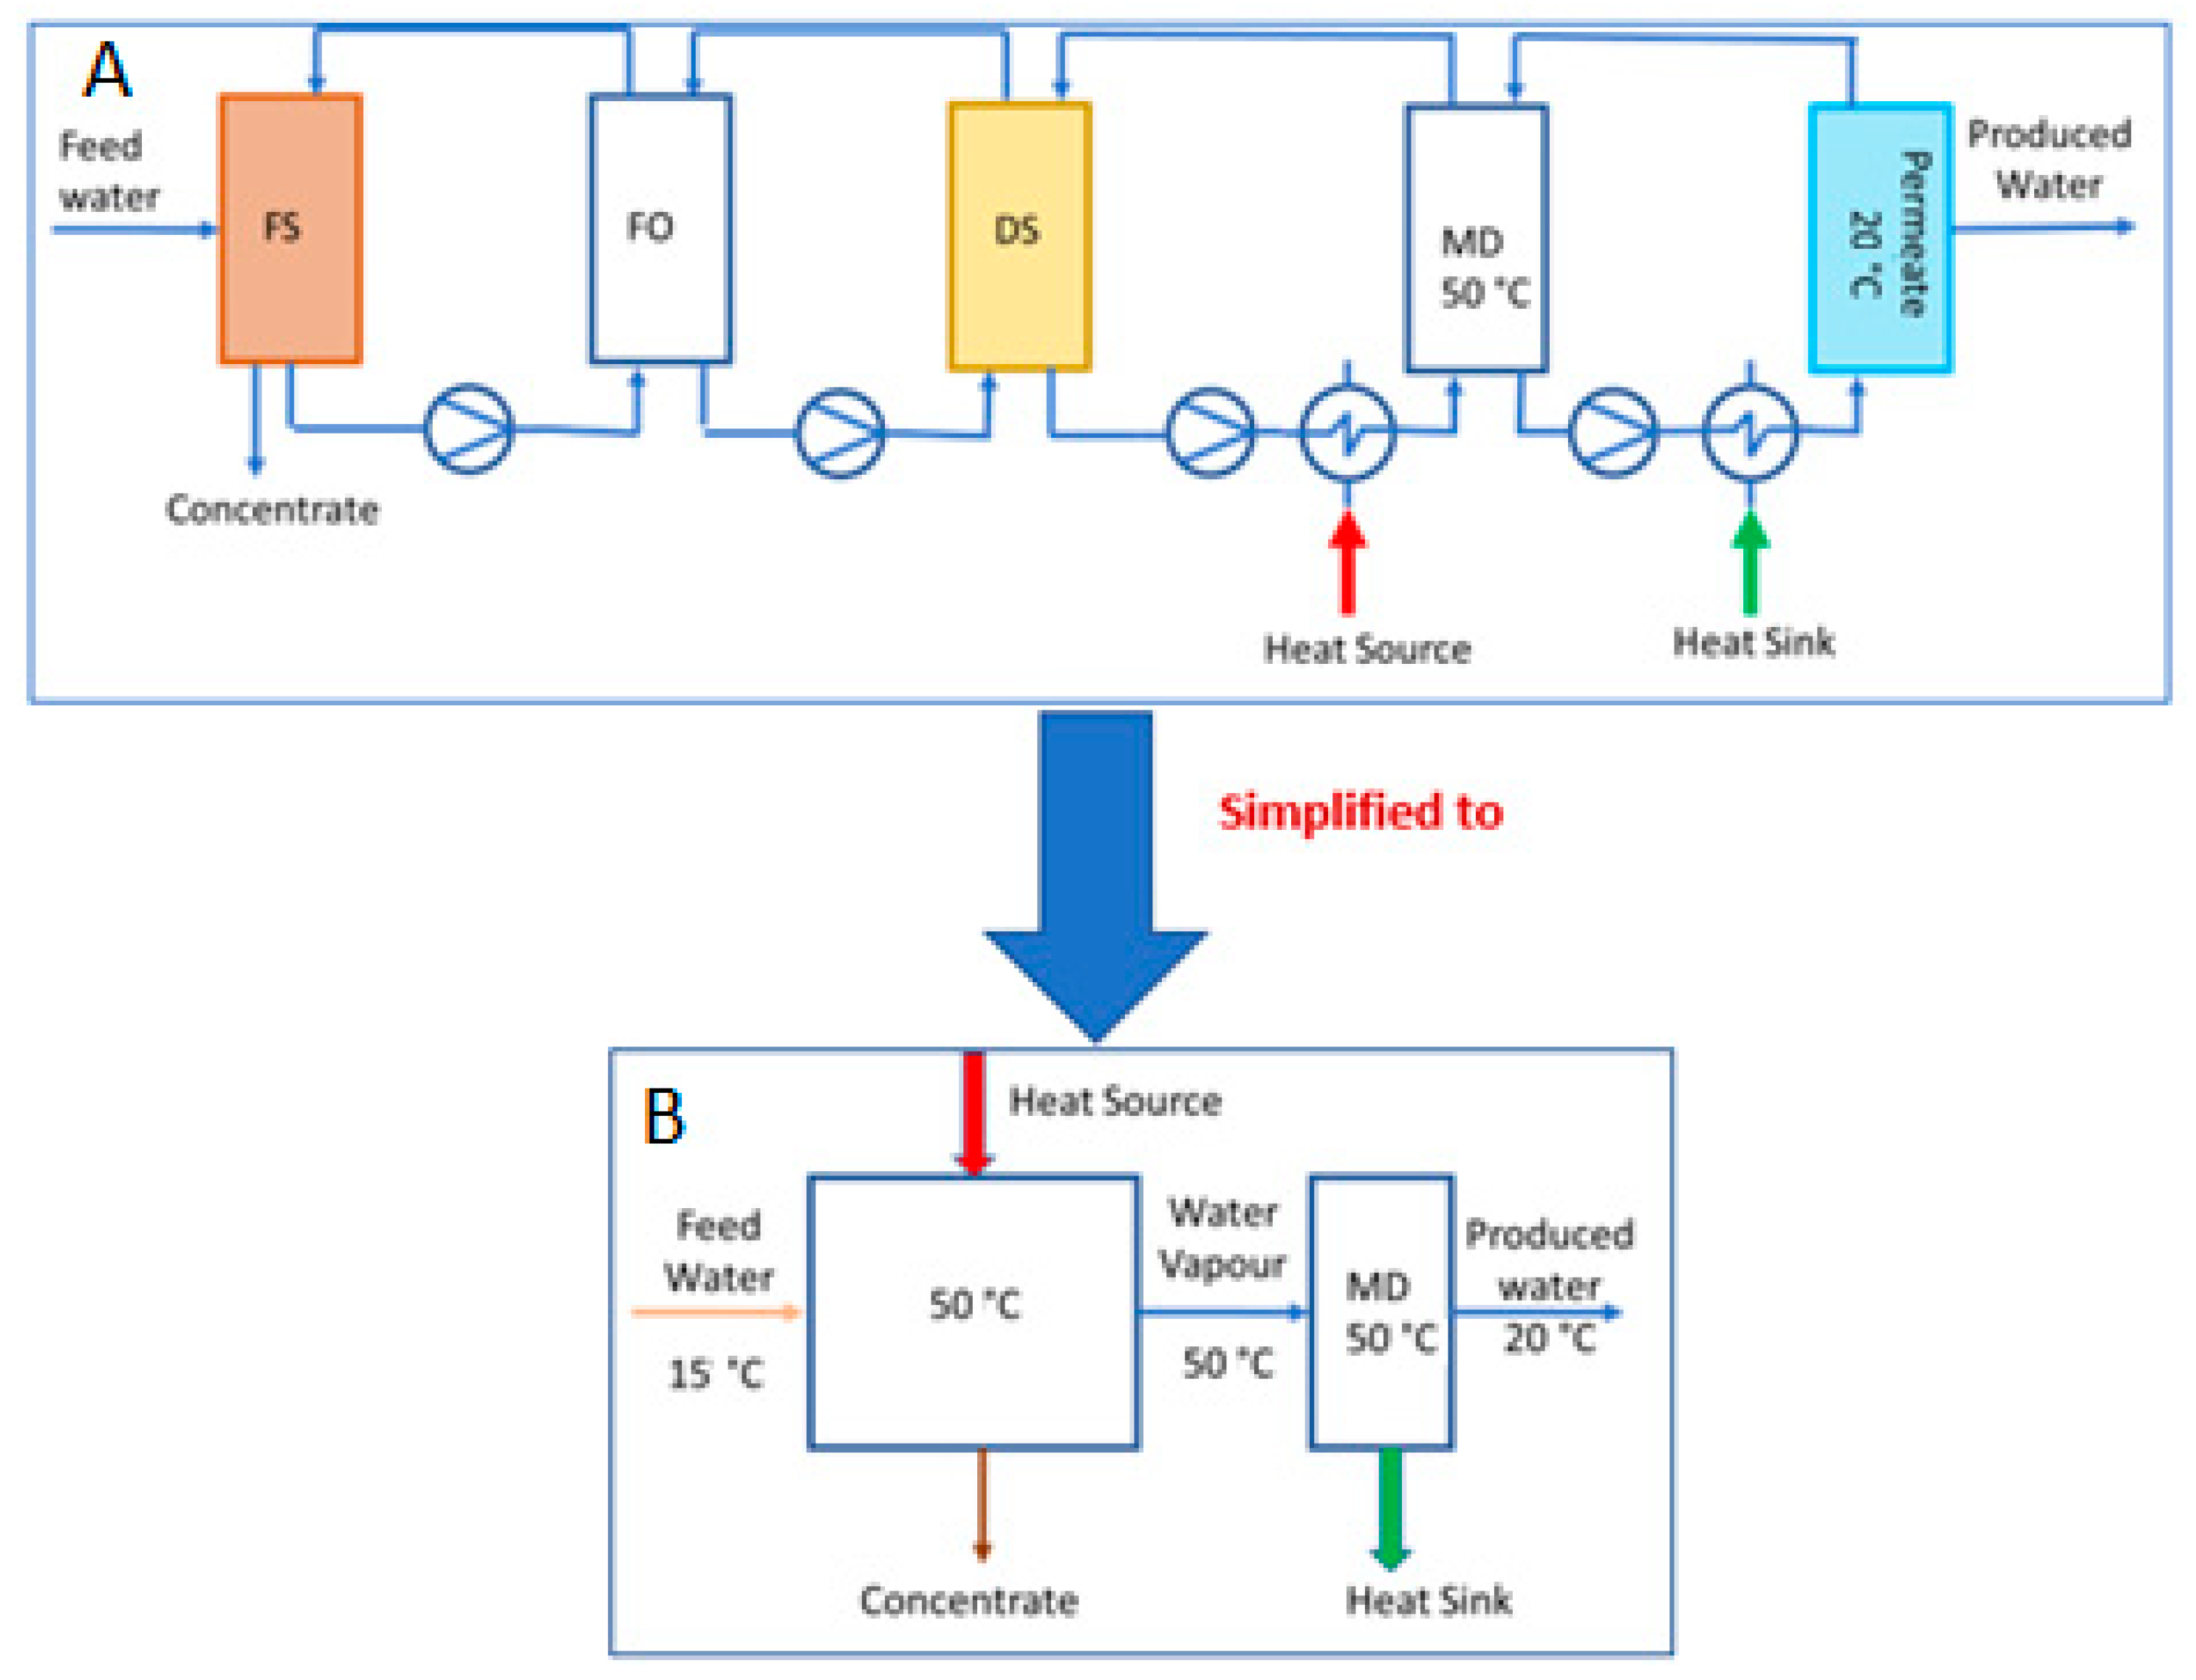
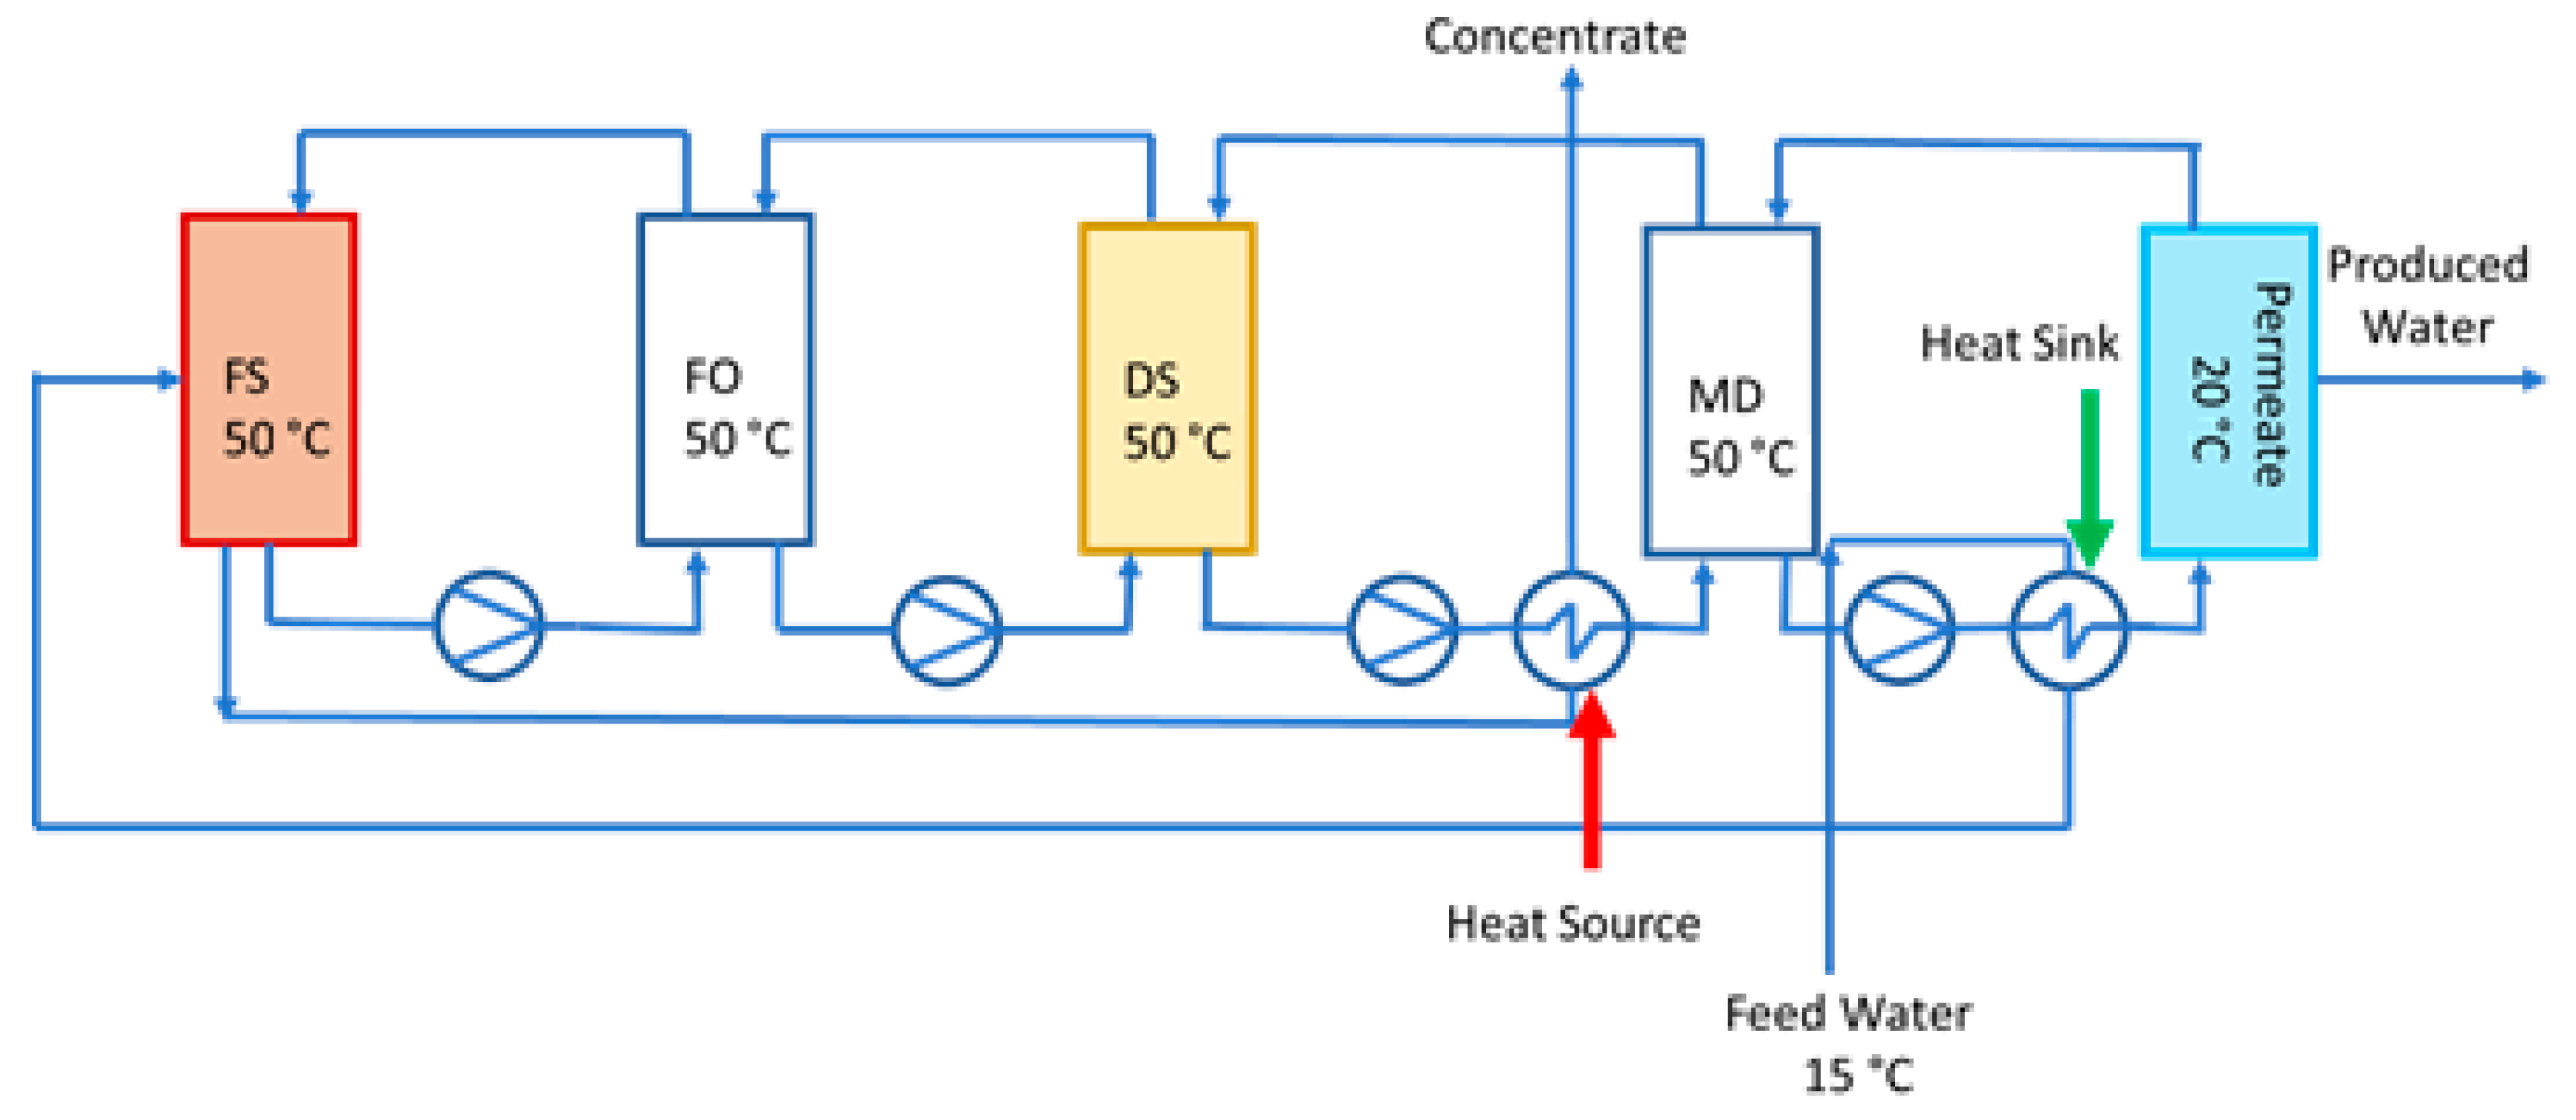
2.5.4. Heat Balance and Heat Demand in a FO-MD System without Internal Heat Recovery

Since single-pass water recovery in either FS or MD is very low, such as less than 10% [26,27], water has to be recirculated as shown in Figure 2A to achieve higher water recovery rate in an integrated FO-MD system. If it is assumed that no heat is lost in the whole system, the diagram of the FO-MD as shown in Figure 2A could be simplified to Figure 2B.
For water vaporisation in MD, the heat demand Q1 for the increase in the temperature of DS from T1 to a temperature T2 and water evaporation at T2 could be calculated by
Q 1 = m R Δ H + c m R ( T 2 T 1 ) = m R ( Δ H + c T 2 c T 1 )
The heat requirement Q2 for the increase in concentrate temperature to 50 °C could be calculated by
Q 2 = c m ( 1 R ) ( T 2 T 1 )
where m is the feed water mass; R is the water recovery rate; Δ H is the latent heat of water vaporization; c is the specific heat capacity of water; T2 is the temperature of heat stream in the MD; and T1 is the temperature of feed water. Thus, we have the total heat requirement Q:
Q = Q1 + Q2

3. Results and Discussion

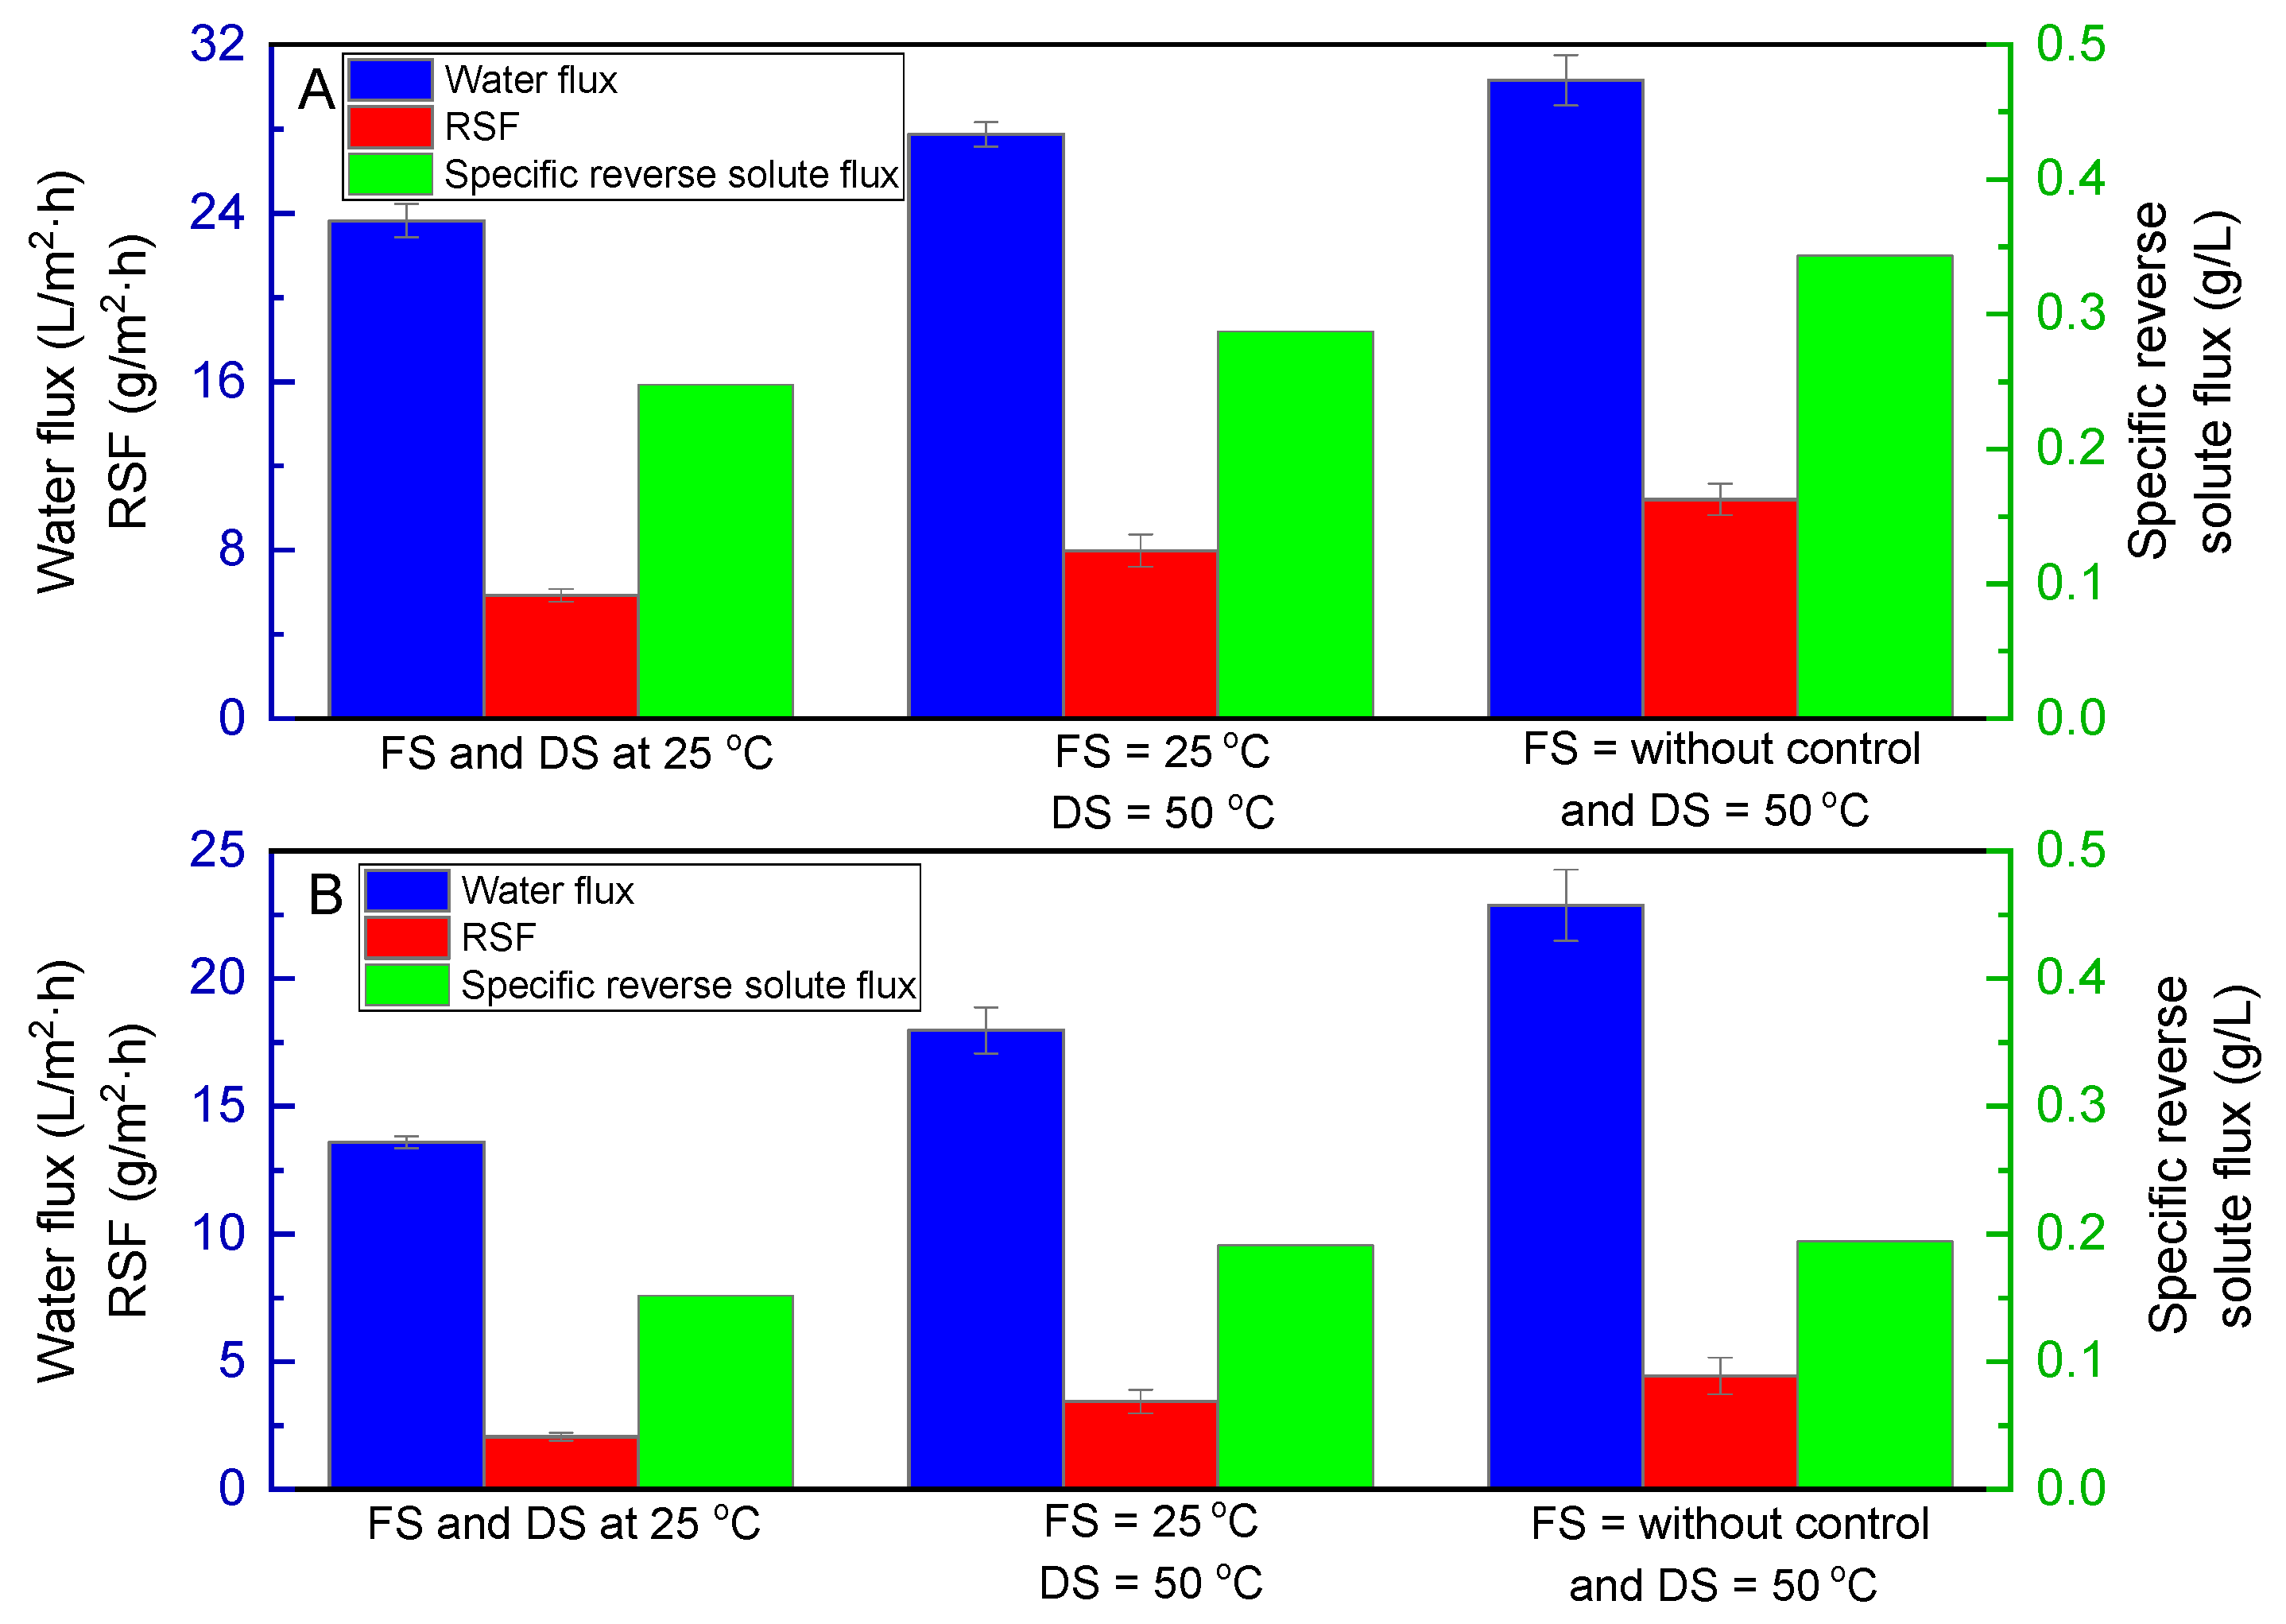
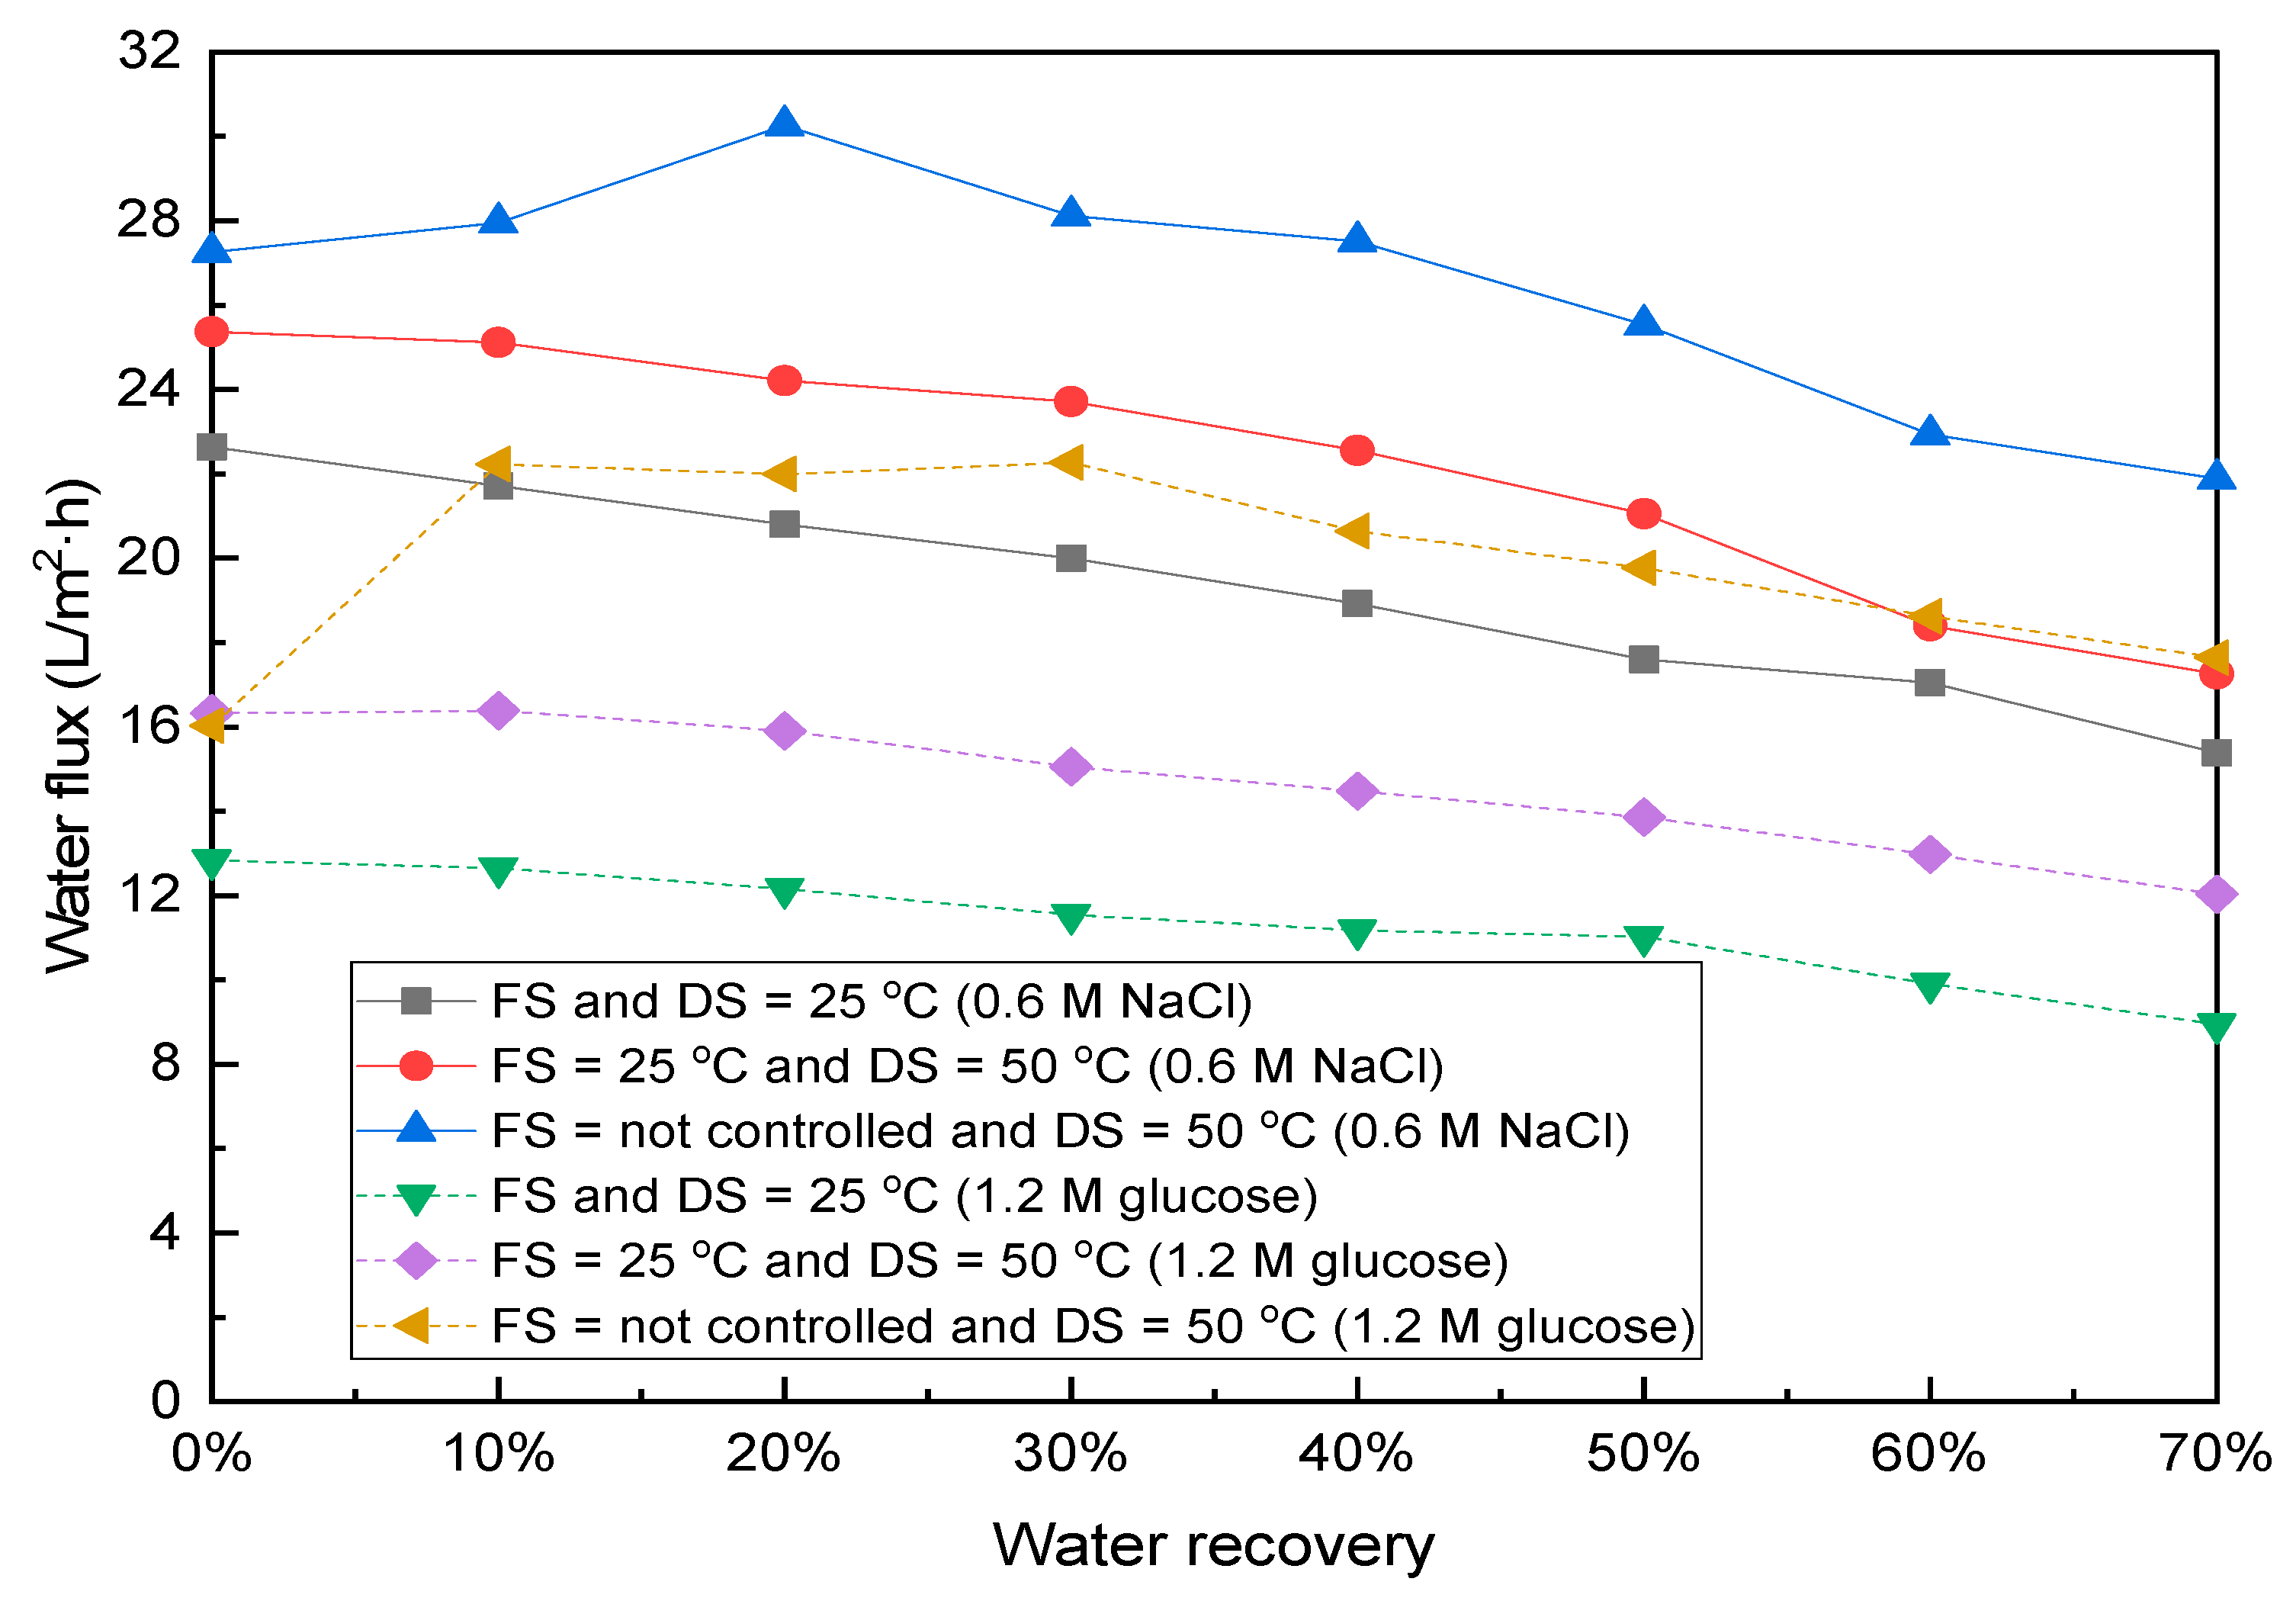
3.1. Effects of Temperature of Feed and Draw Solutions on Water Flux and RSF with NaCl and Glucose as Draw Solutions and DI Water as FS

Figure 3 shows the dependence of the water flux and RSF on different FS and DS temperatures with NaCl and glucose as DSs. It can be seen that the increased operating temperatures result in the increase in water flux and RSF for both DSs. These results are consistent with those from previous FO lab scale studies [5,28,29] with ionic DSs such as NaCl, KCl and Na2SO4 and by pilot scale FO study [30]. The increase in water flux and RSF is easy to understand because.
  • The osmotic pressure of DS is proportional to temperature according to Equation (3);
  • The diffusivity of both FS and DS increases with the increase in temperature, resulting in high water flux and reverse solute flux across the membrane [31];
  • The viscosity of the solutions decreases with the increase in the DS temperature, which is able to reduce both the internal (ICP) and external concentration polarization (ECP), enhancing the water flux [21,31,32].
Although water flux increased with either NaCl or glucose as DS at an elevated temperature, it can be seen from Figure 3 that the increasing extent of water flux with NaCl and glucose as DSs were different. The water flux with glucose as DS increased by 23% from 13.21 L/m2·hto 17.15 L/m2·h compared to 8.2% with NaCl as DS from 23.63 L/m2·h to 25.74 L/m2·h when the DS temperature increased from 25 to 50 °C with the FS temperature set at 25 °C. When the FS temperature was not controlled and the DS was set at 50 °C, the FS temperature increased from 18 °C and then stabilised at around 42.2 °C during a very short period, i.e., within the first 45 min, and the water flux increased by 25% from 17.15 L/m2·h to 22.87 L/m2·h with glucose as DS and by 15% from 25.74 L/m2·h to 30.30 L/m2·h with NaCl as DS. Although the previous studies have reported the increase of water flux and RSF of ionic DS at higher temperatures, this study is the first report to disclose that the difference of physico-chemical properties of NaCl and glucose could result in the different levels of increase in water flux and RSF when being used as DS. The difference in water flux between NaCl and glucose as DSs decreased when temperature was increased probably because the diffusivity and viscosity of glucose decreased more at elevated temperatures compared with NaCl. It was interesting to note that the RSF increased with glucose as DS at a rate of 0.07 g/m2·h for every °C rise compared to 0.14 g/m2·h for every °C rise for the NaCl as DS, even though both reverse solute fluxes from NaCl and glucose increased with temperature. In summary, the increase in the FS and DS temperatures enhanced the water flux with glucose as DS at a higher rate than with NaCl as DS, while the RSF increase rate was higher with NaCl as DS than with glucose as DS. In terms of water flux, glucose is inferior to NaCl as DS because of its high viscosity, low diffusivity and large molecule size with a higher corresponding ICP and ECP [33]. However, at an elevated temperature, glucose could be more suitable as DS especially when RSF is a big concern in FO. This conclusion could be applicable to other organic non-ionic chemicals with high viscosity, low diffusivity and large molecules, providing useful guidance for the selection of DS in a specific scenario.

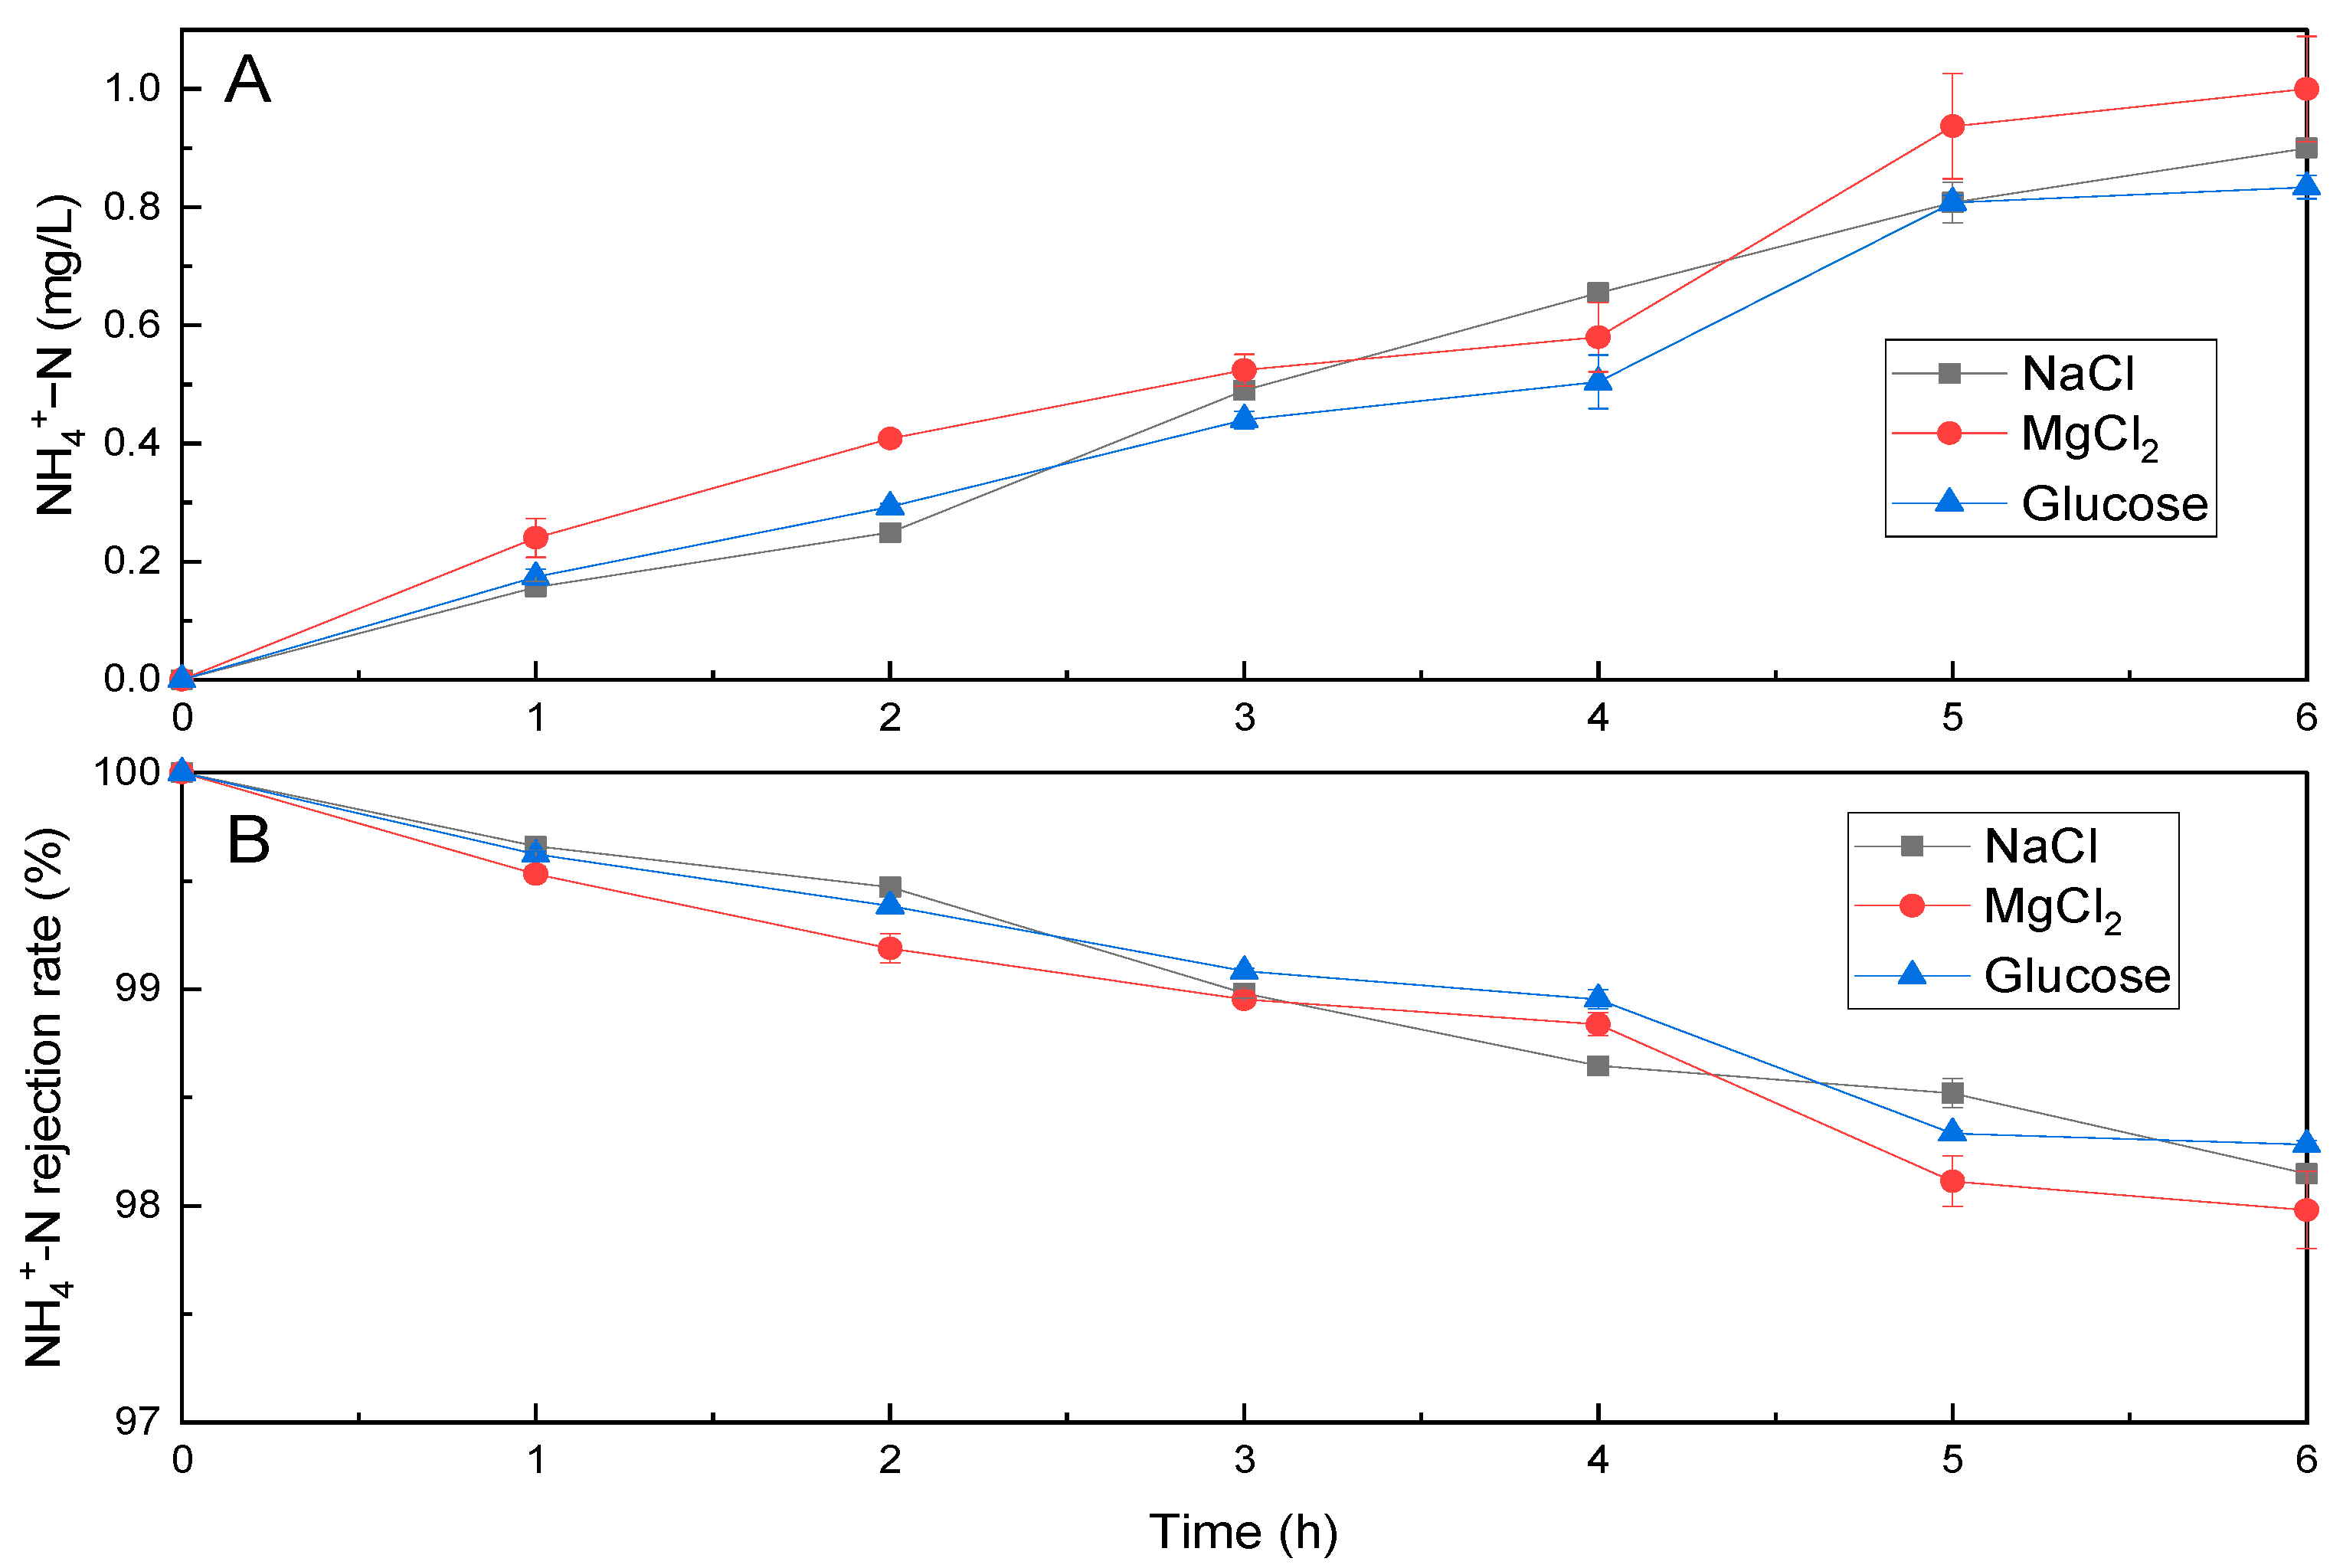
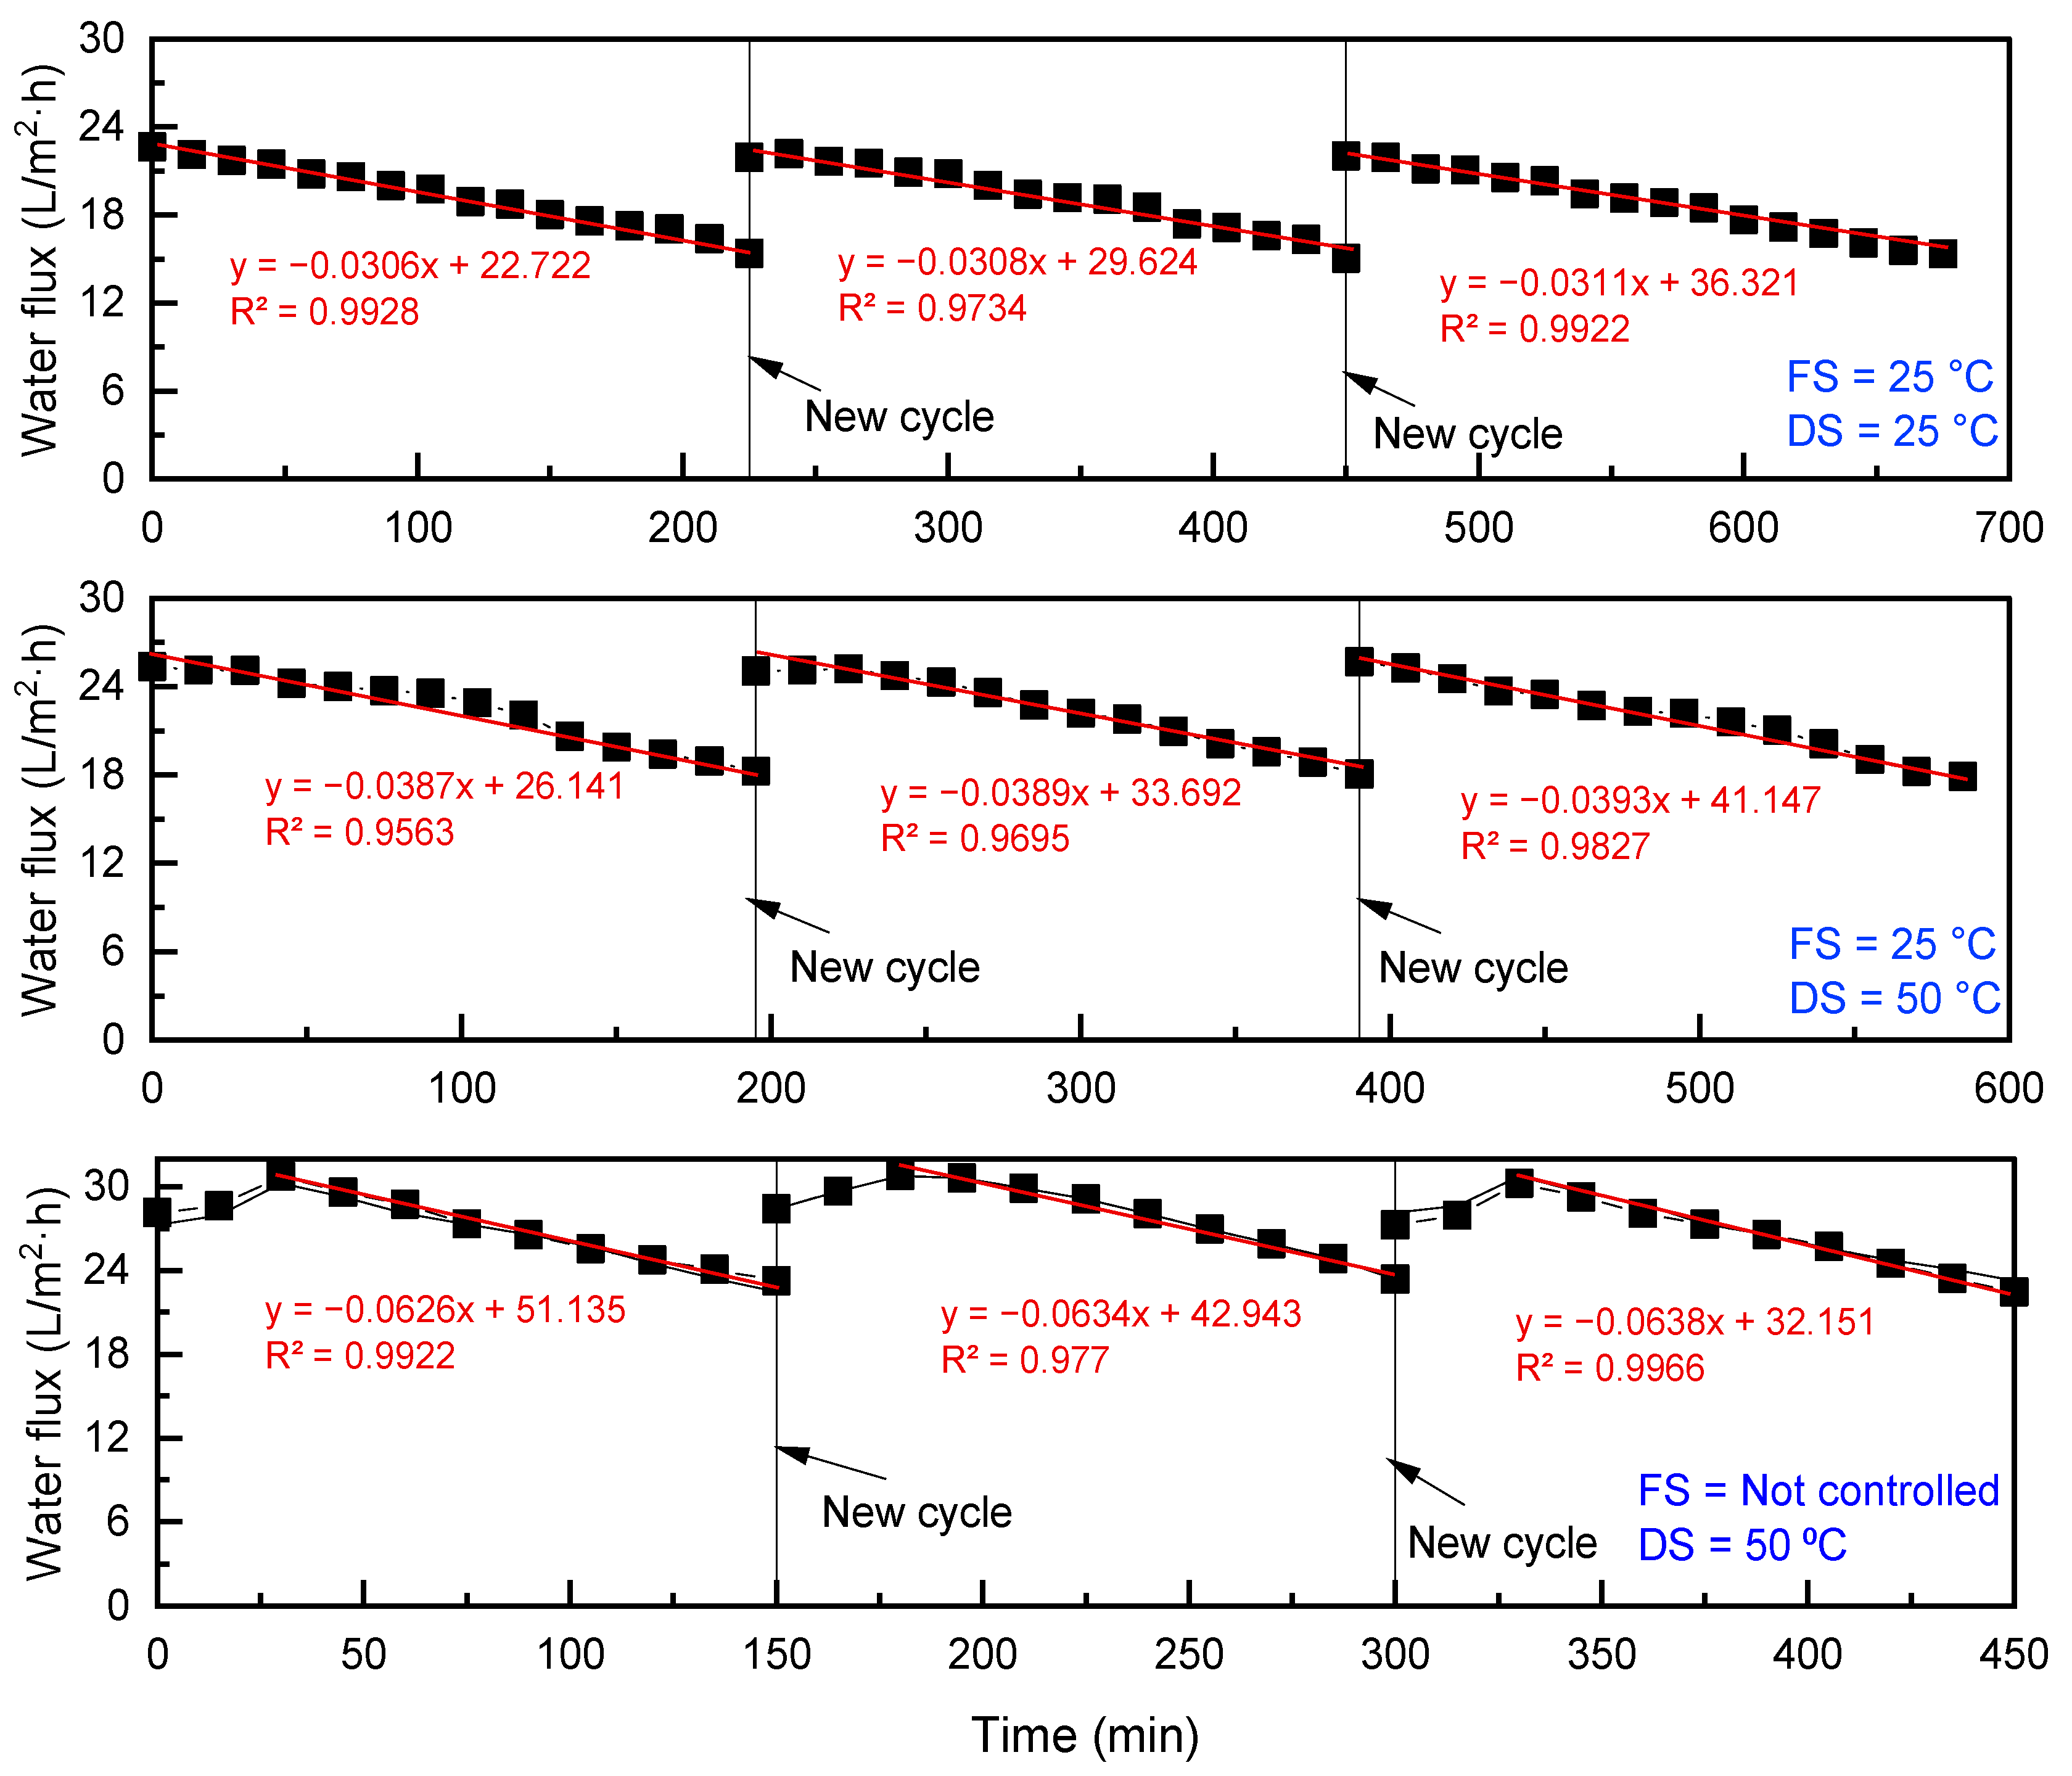
3.2. Effects of Temperature of Feed and Draw Solutions on FO Filtration with Synthetic Wastewater as FS

To understand FO filtration at an elevated temperature better, synthetic wastewater was used as FS to see how contaminates (i.e., COD, phosphate, ammonium, Ca2+, Mg2+ and K+) were rejected and water flux was increased at a higher temperature. As shown in Figure 4, the water flux with both DSs was proportional to the operating temperature. When the DS was set at 50 °C and the FS temperature was not controlled, the temperature of FS increased to 42 °C within the first 45 min due to the heat transferred from DS at 50 °C to FS, and then the temperature of FS stabilized at 42 °C during the remaining period of the filtration because of the heat balance between the heat loss to the surrounding environment and the heat gain from DS. After the FS temperature stabilised at 42 °C, the water flux with 0.6 M NaCl as DS increased by 19% from 25.36 L/m2·h to 30.25 L/m2·h and by 35% from 16.32 L/m2·h to 22.22 L/m2·h with 1.2 M glucose as DS. When the FS was set at 25 °C and the DS was set at 50 °C, the initial water flux with the NaCl as DS increased by 12% from 22.63 L/m2·h to 25.36 L/m2·h while it increased by 27% from 12.83 L/m2·h to 16.32 L/m2·h with glucose as DS compared to those with both FS and DS set at 25 °C. These increasing rates regarding water flux with temperatures for synthetic wastewater were very similar to those for DI as FS, indicating that contaminates in municipal wastewater do not affect heat balance obviously and temperature effects on water flux could be evaluated with DI water when the FO application is to municipal wastewater treatment.
From Figure 4, it can be seen that the water flux with glucose as DS at an elevated temperature falls within the range of water flux with NaCl as DS at an ambient temperature, suggesting a much more acceptable water flux with glucose as DS at elevated temperatures regarding water flux. In addition, the shortened total filtration time to achieve a 70% water recovery rate with either NaCl or glucose as DS indicates a higher treating capacity per unit of membrane surface, implying lower wastewater treatment and water production costs. For example, Valladares et al. [34] reported that when the water flux in FO increased from 10 to 20 L/m2·h, the water production cost of each m3 decreased from $0.637 to $0.611 for a production capacity of 100,000 m3/d of potable water by an integrated FO and low-pressure RO process.
Table 1 shows the up-concentration of municipal wastewater by FO at different temperatures with either NaCl or glucose as DS. When NaCl was used as DS, it can be seen that the FS and DS temperatures did not have a notable effect on the up-concentration of both COD and PO43−. Although it seems that CF of PO43− was lower than COD, no PO43− was detected in the DS after achieving a 70% water recovery rate, indicating that the TFC FO membrane used in this study had complete PO43− rejection at all operating temperatures, and the lower CF of PO43− was probably caused by precipitation in FS. These results showed that the TFC FO membrane had high stability to reject PO43− and COD at a relatively wide range of FS and DS temperatures. Conversely, ammonium was not concentrated in the FS with NaCl as DS at all operating temperatures. Even worse, the increase in FS and DS temperatures negatively affected NH4+ rejection when using 0.6 M NaCl as the DS. The NH4+ concentration factor was decreased from −1.59 with both FS and DS at 25 °C to −2.01 with FS at 25 °C and DS at 50 °C, and further to −2.96 with DS at 50 °C and FS at 42 °C. From our previous study and other studies [11,35,36,37], it was believed that low ammonium rejection was mainly caused by the cation exchange between Na+ from DS and NH4+ from FS initiated by reverse Na+ flux from DS. With the temperature increase of DS, as shown in Figure 3, the RSF of NaCl increased due to higher NaCl diffusivity, which enhanced the exchange between Na+ from DS and NH4+ from FS to maintain electroneutrality and thus deteriorated NH4+ rejection by FO.
When 1.2 M glucose was used as DS, as shown in Table 1, the increase in FS and DS temperatures improved the COD concentration factor CF. Given the fact that COD rejection at lower temperature was close to 100%, however, the increased CF was actually caused by high reverse glucose flux at a higher operating temperature. Both complete PO43− and NH4+ rejections were obtained at all operating temperatures as no PO43− and NH4+ could be detected in DS. The complete ammonium rejection rate by using non-ionic DS such as glucose in this study is significantly higher than previous studies with ionic DS [11,14,35,36]. The reduced concentration factors for NH4+-N in FS could be explained by the fact that ammonia vaporization was higher at a higher FS temperature and pH because the FS tank was not air-tight, resulting in the loss of ammonia during the FO filtration process. The controls validated this assumption that 0.65 mg N lost at 25 °C in the form NH3 from FS while the ammonia loss increased to 2.5 mg N at higher FS temperatures (i.e., 42 °C). The results shown here again proved that the cation exchange between Na+ from NaCl as DS and NH4+ in FS was the main reason for low ammonium rejection, which was enhanced by a higher temperature. Once no cation exchange is present due to the undissociated molecule nature, such as glucose, ammonium rejection is not affected by temperature at all. Undissociated chemical is thus favourable as the DS at higher temperatures, when ammonium rejection is a concern.
For the rejection of cations in FS, when NaCl was used as the DS, it was found that concentration factors of Ca2+, Mg2+ and K+ slightly decreased with the temperature increase in DS and FS, which could be related with the increased cation exchange as well as between cations in FS and Na+ in DS at higher temperatures due to the higher diffusivity of both cations in FS and Na+ in DS. K+ is much smaller than Ca2+ and Mg2+; thus, it is easier to exchange with Na+ in DS, leading to a lower CF of K+ than those of Ca2+ and Mg2+ in FS. When glucose was used as DS, although higher concentration factors of Ca2+, Mg2+ and K+ were obtained compared to NaCl as DS at all operating temperatures, CFs of Ca2+, Mg2+ and K+ decreased slightly with the increase in temperature, probably due to the increased diffusivity of cations in FS. Due to the reverse salt permeation to FS and concentration of ions in FS over time in FO treatment with NaCl as DS, the salinity of the concentrate increased. From Table 1, it can be seen that salinity in FS increased with temperature.
The increase in pH from the initial value of 6.98 in FS to 7.08–7.19 (Table 1) at the end of filtration indicates the ion exchange between DS and FS. The pH increase in the concentrated FS is beneficial for the phosphate precipitation with Ca2+, Mg2+, NH4+ and other ions over the filtration time with increased ion concentrations, which explains the lower final concentration factors for these ions compared to the theoretical concentration factors (i.e., 3.33) in the FS. The saturation index (SI), which is used as an indicator of possible mineral precipitation of the concentrated FS at a 70% water recovery rate, was higher than 0, showing the oversaturation of phosphate precipitates. The formation of inorganic precipitates over FO membrane filtration time implies a fouling potential on membranes from inorganics. Thus, membrane fouling was further investigated in this study.

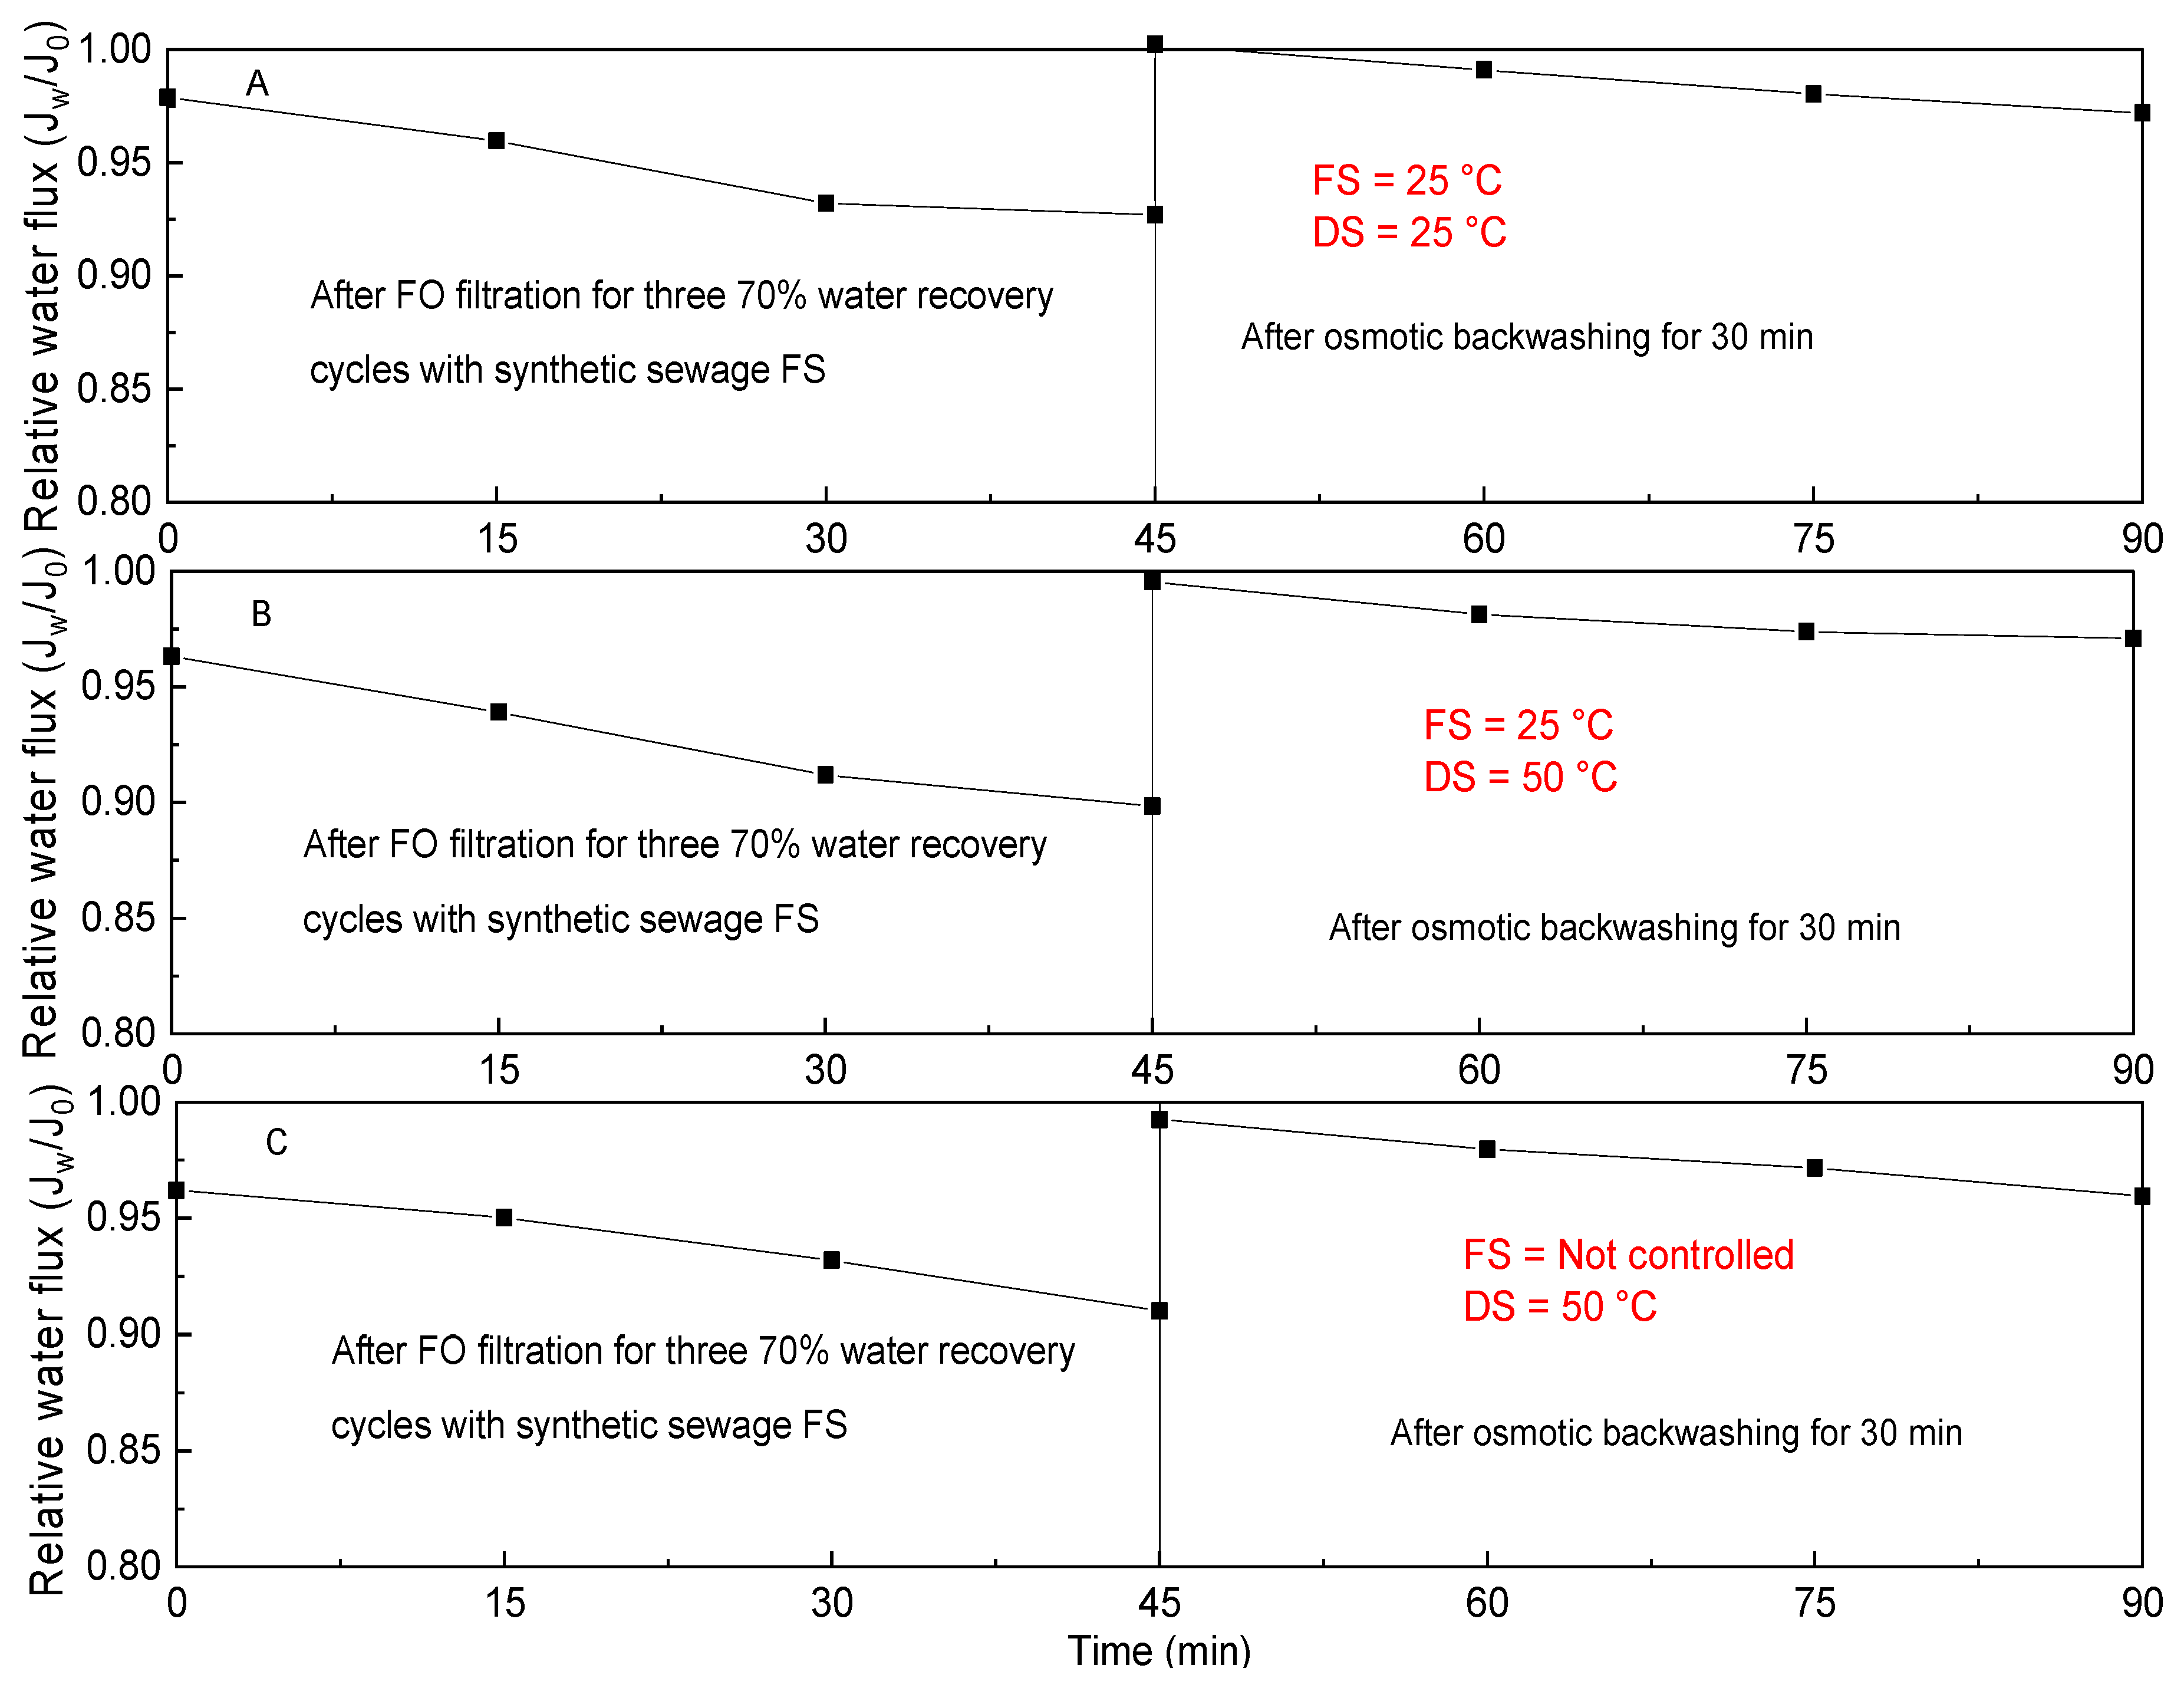
3.3. Membrane Fouling and Cleaning at Different Feed and Draw Solutions Temperatures in the TFC FO Filtration Process with Synthetic Municipal Wastewater

In practice, water recovery from RO filtration is usually not over 70% to alleviate membrane fouling [38]. Although FO could be able to be operated with a higher water recovery rate than 70%, a 70% water recovery rate was used in three consecutive cycles in this study at different FS and DS temperatures to study FO fouling from inorganic precipitates in treating synthetic municipal wastewater. As shown in Figure 5, under an isothermal condition (i.e., both FS and DS at 25 °C), three filtration cycles were finished after 675 min, while it took 585 min with FS at 25 °C and the DS at 50 °C and 450 min with FS stabilised at 42 °C and DS at 50 °C. Only a slight decline in initial water flux was observed after each cycle at all operating temperatures, indicating that the decrease in the water flux in each individual cycle was mainly caused by the reduced driving force between the FS and DS due to the concentration of ions and organics in the FS and the dilution of the DS, and membrane fouling only contributed slightly to the flux decline.
The water flux decline rate was 0.031 L/m2·h per min under an isothermal condition, 0.039 L/m2·h per min with the FS at 25 °C and the DS at 50 °C and 0.063 L/m2·h with the FS temperature at 42 °C and the DS at 50 °C. The higher water flux decline at higher FS and DS temperatures could be attributed to higher water flux and a quick decrease in driving force between FS and DS instead of fouling.
As shown in Figure 6, the water flux declined after three consecutive cycles by only 2.2% with the FS and DS at 25 °C, by 3.7% with the FS temperature at 25 °C and the DS at 50 °C and 3.8% with the FS at 42 °C and the DS at 50 °C. This indicates that membrane fouling was slightly more serious at higher FS and DS temperatures due to probably more inorganic phosphate precipitates at higher temperature. It has been reported that the dissolvability of hydroxyapatite is lower at higher temperatures [13]. The initial water flux of membranes was fully recovered after normal flushing with DI water for 30 min at all operating temperatures, suggesting that the inorganic precipitates deposited loosely on the membrane surface and could be easily removed. Based on these results, operating an FO process until 70% water recovery at different FS and DS temperatures did not cause obvious membrane fouling in treating synthetic municipal wastewater. However, it is necessary to study membrane fouling and cleaning after multiple cycles with long-term fouling durations by the use of synthetic or real municipal wastewater with higher initial contaminant concentrations.

3.4. Ammonia Vaporisation in a Direct Contact MD Membrane Filtration Process for Simultaneous DS Regeneration and Water Recovery

As mentioned before, an integrated FO-MD process could be promising for simultaneous DS regeneration and water recovery. The regeneration of different types of DSs, i.e., NaCl, MgCl2 and glucose, in a direct contact MD process, was conducted. It was found that with 50 mg/L NH4+ in 1 L and 35 g/L NaCl, MgCl2 or glucose as DS, the water flux was 5.72, 5.85 and 6.23 L/m2·h, respectively, and the concentration of DS after 6 h of filtration was 40.65, 41.10 and 41.28 g/L, respectively, with a water recovery rate of around 14–15%. Since the initial concentration of all three types of DSs are the same, i.e., at 35 g/L, water flux from different types of DSs were supposed to be the same. It is thus believed that the slight difference in terms of water flux and water recovery rate might be due to errors, which are negligible.
Since FO has a low rejection of ammonium from FS with NaCl as DS, most ammonium in FS is permeated to DS. When DS containing ammonium is regenerated by MD, ammonium in DS could be converted to ammonia at equilibrium and vaporise and pass through MD membrane into the water side. As shown in Figure 7A, the final NH4+-N concentration in the permeate of MD for all DSs was less than 1 mg/L after 6 h of operation. No effects from DS type were observed regarding ammonia permeation through MD to the clean water stream and ammonium rejection rate (Figure 7B), indicating that solute type in DS does not affect ammonium–ammonia equilibrium and ammonia vapour pressure obviously.
In addition, no variation of conductivity and COD was detected in the permeate side of the MD for NaCl, MgCl2 and glucose as DSs, indicating that the MD membrane had a complete rejection of all solutes of DSs due to the non-volatility of solutes. The complete rejection of all types of solutes in DSs by the MD membrane used in this study is consistent with previous studies [39,40,41] because of the unique vapour transfer mechanism of the MD membrane, which almost completely rejects all non-volatile compounds. Ammonium, however, due to its volatility nature, did result in the escape of ammonium from DS to the permeate through the MD membrane by vaporisation, thus imposing the potential risk to contaminate clean water. In this study, since 1 L of permeate and 50 mg/L NH4+-N in 1 L of DS were used to start MD experiment, ammonium concentration in the permeate after 6 h seems low. However, for per L water recovered, 7.7 mg NH4+-N was escaped from DS to clean water with the initial NH4+-N concentration of 50 mg/L in DS. When NH4+-N concentration in DS is higher due to a higher NH4+-N concentration in FS for FO filtration and the accumulation of ammonium in DS over time through a continuous FO-MD process, a more serious escape of ammonia from DS to the permeate side with reduced water quality would result.
Figure 8 shows ammonia vapour pressure at different temperatures, pH and aqueous ammonium concentrations. It has to be pointed out that the Henry constant is affected by solution salinity, pH and other factors. In this part, the estimation of the Henry constant was significantly simplified with the purpose of getting an idea on how ammonia pressure varies with pH, temperature and aqueous ammonium concentration. It can be seen that the pH of DS, NH4+-N concentration in DS and temperature are three important factors that significantly affect ammonia pressure. Ammonia pressure increases with pH and temperature more steeply at higher aqueous ammonium concentrations than at lower ammonium concentrations. The suitable operating pH and temperature ranges (shown in deep and light purple area) are narrower at higher aqueous ammonium concentrations if a similar and low ammonia pressure needs to be maintained to minimize gaseous ammonia permeation from DS to a water side in MD. To avoid high ammonia pressure, the pH of DS could be reduced to a low level such as 5 or 6, but adjusting the pH of DS implies extra chemical costs and would affect the pH of FS as well. Alternatively, temperature could be reduced to less than 50 °C, but a lower temperature means a lower vapour driving force for water permeation through MD, with a reduced water flux and treating capacity of per unit membrane surface. Therefore, for an integrated FO-MD process, when the ammonium concentration in FS is high, such as in sludge digestate with a NH4+-N concentration of 1500 mg/L [42], the best solution could be selecting non-ionic DS such as glucose to avoid ammonium escape from FS to DS in the first place and minimize ammonium contamination to the recovered water.

3.5. Heat Evaluation for an Integrated FO-MD Process in Treating Wastewater

Based on the diagram shown in Figure 2 without internal heat recovery, for the treatment of 1 m3 municipal wastewater with water recovery rates varying from 50% to 90%, the total heat requirement is varying accordingly from 1277–2181 MJ. When waste heat from power plant is used with an electricity generation efficiency of 40% and heat recovery efficiency of 50%, 1277–2181 MJ heat is equivalent to the heat from the generation of electricity of 283–485 kWh.
The Marchwood Power Plant in Southampton generates approximately 895 MW of electricity, which is equivalent to the needs of Southampton, the New Forest and Winchester, with a population of 456,500. If all the heat after electricity generation is recovered to provide heat sources for an integrated FO-MD system treating municipal wastewater, the water that could be treated is around 1845–3162 m3/h. This is only equivalent to a population of 9225–15,810 with domestic wastewater generation. Obviously, even with the waste heat available from power plants, the heat is far less than the heat demanded for an integrated FO-MD system to treat municipal wastewater. Thus, heat recovery from FO-MD systems should be considered. Given that the condensation of water vapour into water in MD releases a similar amount of heat demanded for vaporisation, the heat could be recovered from the produced water. The internal heat recovery was proposed as shown in Figure 9 for an integrated FO-MD process, in which the discharged concentrate with a high temperature could be used to heat the stream that comes into the MD module while the heat in the permeate could be recovered by heating feed water. In this way, the external heat demand could be significantly reduced. However, how to maximize the internal heat recovery still needs further investigation.

4. Conclusions

The effect of FS and DS temperatures on the performance of the FO process was compared between ionic DS such as NaCl and non-ionic DS such as glucose, and the implications of ammonia escape and heat demand in an integrated FO-MD process were estimated for the first time. The results showed, at the elevated temperatures of FS and DS in FO, that a non-ionic DS such as glucose with a higher viscosity, lower diffusivity and larger molecules results in a much higher water flux increase (i.e., 23–35% vs. 8–19% by NaCl) but lower RSF increase compared with an ionic DS such as NaCl. The water flux at the elevated temperature with glucose as DS falls within the range of NaCl at ambient temperatures. Ammonium rejection with NaCl as DS for municipal wastewater was very low, and deteriorated at an elevated temperature, while there was not any forward ammonium permeation to DS at all operating temperatures with glucose as DS. The slightly higher water flux decline of the FO membrane at higher FS and DS temperatures could be due to the formation of inorganic precipitates. A normal flushing for 30 min was able to recover the water flux of FO membrane completely after three consecutive filtration cycles treating synthetic municipal wastewater with a 70% water recovery rate. The accumulation of ammonium in a DS such as NaCl, with a low ammonium rejection rate, imposes the risk of ammonium vaporization and escape to the recovered clean water stream in the MD process with reduced water quality, which is independent of the DS type. For treating DS with a 50 mg/L initial ammonium concentration, 7.7 mg ammonium permeated through the MD membrane for per liter clean water recovered. Thus, a non-ionic DS such as glucose is recommended to avoid ammonium contamination, especially for FS containing higher ammonium concentrations. From the perspective of heat demand, only with internal heat recovery, it is economically feasible to treat municipal wastewater in an integrated FO-MD process.
In summary, we can conclude from the new findings above that temperature effects on FO greatly depend on the physico-chemical properties of DS. Ammonia permeation to recovered water side is decided by the pH, temperature and aqueous ammonium solution in wastewater when the ionic chemical NaCl is used as DS, making the operation control more difficult. However, non-ionic DS glucose shows better performance in terms of reverse solute flux, ammonium rejection and acceptable water flux in the FO unit at elevated temperatures and better quality of water recovered from the MD unit. The results could provide meaningful guidance for the selection of DS in an integrated FO-MD process with elevated temperature treating wastewater streams containing ammonium and suggest the necessity of internal heat recovery in FO-MD processes.

Author Contributions

Formal analysis and investigation, K.A.; writing—original draft preparation, K.A.; writing—review and editing, Y.-Q.L.; supervision, Y.-Q.L.; contribution to formal analysis, investigation and writing of the heat evaluation section, A.B. and S.H. All authors have read and agreed to the published version of the manuscript.

Funding

This research received no external funding.

Acknowledgments

The authors thanks EBNet, BBSRC, UK, for funding the APC and Aerobic Granules Working Group, EBNet for supporting the work. The King Saud University is also thanked for sponsoring Khaled Almoalimi for his PhD study at the University of Southampton, UK.

Conflicts of Interest

The authors declare no conflict of interest.

References

  1. Zohrabian, L.; Hankins, N.P.; Field, R.W. Hybrid forward osmosis-membrane distillation system: Demonstration of technical feasibility. J. Water Process Eng. 2020, 33, 101042. [Google Scholar] [CrossRef]
  2. Panagopoulos, A. Energetic, economic and environmental assessment of zero liquid discharge (ZLD) brackish water and seawater desalination systems. Energy Convers. Manag. 2021, 235, 113957. [Google Scholar] [CrossRef]
  3. Kim, Y.; Lee, S.; Kyong, H.; Hong, S. Organic fouling mechanisms in forward osmosis membrane process under elevated feed and draw solution temperatures. Desalination 2015, 355, 169–177. [Google Scholar] [CrossRef]
  4. Ali, S.M.; Kim, J.E.; Phuntsho, S.; Jang, A.; Choi, J.Y.; Shon, H.K. Forward osmosis system analysis for optimum design and operating conditions. Water Res. 2018, 145, 429–441. [Google Scholar] [CrossRef]
  5. Wang, W.; Zhang, Y.; Esparra-Alvarado, M.; Wang, X.; Yang, H.; Xie, Y. Effects of pH and temperature on forward osmosis membrane flux using rainwater as the makeup for cooling water dilution. Desalination 2014, 351, 70–76. [Google Scholar] [CrossRef]
  6. Wang, K.Y.; Teoh, M.M.; Nugroho, A.; Chung, T.S. Integrated forward osmosis-membrane distillation (FO-MD) hybrid system for the concentration of protein solutions. Chem. Eng. Sci. 2011, 66, 2421–2430. [Google Scholar] [CrossRef]
  7. Zhang, S.; Wang, P.; Fu, X.; Chung, T.S. Sustainable water recovery from oily wastewater via forward osmosis-membrane distillation (FO-MD). Water Res. 2014, 52, 112–121. [Google Scholar] [CrossRef]
  8. Lu, D.; Liu, Q.; Zhao, Y.; Liu, H.; Ma, J. Treatment and energy utilization of oily water via integrated ultrafiltration-forward osmosis–membrane distillation (UF-FO-MD) system. J. Membr. Sci. 2018, 548, 275–287. [Google Scholar] [CrossRef]
  9. Xie, M.; Price, W.E.; Nghiem, L.D.; Elimelech, M. Effects of feed and draw solution temperature and transmembrane temperature difference on the rejection of trace organic contaminants by forward osmosis. J. Membr. Sci. 2013, 438, 57–64. [Google Scholar] [CrossRef] [Green Version]
  10. Wang, C.; Li, Y.; Wang, Y. Treatment of greywater by forward osmosis technology: Role of the operating temperature. Environ. Technol. 2019, 40, 3434. [Google Scholar] [CrossRef]
  11. Arena, J.T.; Manickam, S.S.; Reimund, K.K.; Freeman, B.D.; Mccutcheon, J.R. Solute and water transport in forward osmosis using polydopamine modified thin film composite membranes. Desalination 2014, 343, 8–16. [Google Scholar] [CrossRef]
  12. Xue, W.; Tobino, T.; Nakajima, F.; Yamamoto, K. Seawater-driven forward osmosis for enriching nitrogen and phosphorous in treated municipal wastewater: Effect of membrane properties and feed solution chemistry. Water Res. 2015, 69, 120–130. [Google Scholar] [CrossRef] [PubMed]
  13. Song, Y.; Hahn, H.H.; Hoffmann, E. Effects of solution conditions on the precipitation of phosphate for recovery A thermodynamic evaluation. Chemosphere 2002, 48, 1029–1034. [Google Scholar] [CrossRef]
  14. Almoalimi, K.; Liu, Y. Fouling and cleaning of thin film composite forward osmosis membrane treating municipal wastewater for resource recovery. Chemosphere 2022, 288, 132507. [Google Scholar] [CrossRef]
  15. Metcalf, E. Water Reuse Issues, Technologies, and Applications; McGraw-Hill Professional Publishing: New York, NY, USA, 2007. [Google Scholar]
  16. Altaee, A.; Mabrouk, A.; Bourouni, K. A novel Forward osmosis membrane pretreatment of seawater for thermal desalination processes. Desalination 2013, 326, 19–29. [Google Scholar] [CrossRef]
  17. Altaee, A.; Hilal, N. Dual-stage forward osmosis/pressure retarded osmosis process for hypersaline solutions and fracking wastewater treatment. Desalination 2014, 350, 79–85. [Google Scholar] [CrossRef]
  18. Cornelissen, E.R.; Harmsen, D.; Korte KFDe Ruiken, C.J.; Qin, J.; Oo, H.; Wessels, L.P. Membrane fouling and process performance of forward osmosis membranes on activated sludge. J. Membr. Sci. 2008, 319, 158–168. [Google Scholar] [CrossRef]
  19. Corzo, B.; de la Torre, T.; Sans, C.; Ferrero, E.; Malfeito, J.J. Evaluation of draw solutions and commercially available forward osmosis membrane modules for wastewater reclamation at pilot scale. Chem. Eng. J. 2017, 326, 1–8. [Google Scholar] [CrossRef]
  20. Devia, Y.P.; Imai, T.; Higuchi, T.; Kanno, A.; Yamamoto, K.; Sekine, M.; Van Le, T. Potential of Magnesium Chloride for Nutrient Rejection in Forward Osmosis. J. Water Resour. Prot. 2015, 7, 730. [Google Scholar] [CrossRef] [Green Version]
  21. Ray, S.S.; Chen, S.S.; Sangeetha, D.; Chang, H.M.; Thanh, C.N.D.; Le, Q.H.; Ku, H.M. Developments in forward osmosis and membrane distillation for desalination of waters. Environ. Chem. Lett. 2018, 16, 1247–1265. [Google Scholar] [CrossRef]
  22. Alkhudhiri, A.; Darwish, N.; Hilal, N. Membrane distillation: A comprehensive review. Desalination 2012, 287, 2–18. [Google Scholar] [CrossRef]
  23. Anthonisen, A.C.; Loehr, R.C.; Prakasam, T.B.S.; Srinath, E.G. Inhibition of nitrification by ammonia and nitrous acid. J. Water Pollut. Control. Fed. 1976, 48, 835–852. [Google Scholar] [CrossRef] [PubMed]
  24. Poullis, M.; Cth, F. Exploring the Boundaries of Perfusion. Left Field: Square Tubes and Current Changes! J. Extracorpor. Technol. 2009, 41, P21. [Google Scholar]
  25. Dasgupta, P.K.; Dong, S. Solubility of Ammonia in Liquid Water and Generation of Trace Levels of Standard Gaseous Ammonia. Atmos. Environ. 1985, 20, 565–570. [Google Scholar] [CrossRef]
  26. Criscuoli, A. Thermal Performance of Integrated Direct Contact and Vacuum Membrane Distillation Units. Engergies 2021, 14, 7405. [Google Scholar] [CrossRef]
  27. Swaminathan, J.; Lienhard, J.H. Design and operation of membrane distillation with feed recirculation for high recovery brine concentration. Desalination 2018, 445, 51–62. [Google Scholar] [CrossRef] [Green Version]
  28. Phuntsho, S.; Vigneswaran, S.; Kandasamy, J.; Hong, S.; Lee, S.; Shon, H.K. Influence of temperature and temperature difference in the performance of forward osmosis desalination process. J. Membr. Sci. 2012, 415–416, 734–744. [Google Scholar] [CrossRef]
  29. Zhao, S.; Zou, L. Effects of working temperature on separation performance, membrane scaling and cleaning in forward osmosis desalination. Desalination 2011, 278, 157–164. [Google Scholar] [CrossRef]
  30. Jalab, R.; Awad, A.M.; Nasser, M.S.; Minier-matar, J.; Adham, S. Pilot-scale investigation of flowrate and temperature influence on the performance of hollow fiber forward osmosis membrane in osmotic concentration process. J. Environ. Chem. Eng. 2020, 8, 104494. [Google Scholar] [CrossRef]
  31. Chowdhury, M.R.; Mccutcheon, R. Elucidating the impact of temperature gradients across membranes during forward osmosis: Coupling heat and mass transfer models for better prediction of real osmotic systems. J. Membr. Sci. 2018, 553, 189–199. [Google Scholar] [CrossRef]
  32. Lutchmiah, K.; Verliefde, A.R.D.; Roest, K.; Rietveld, L.C.; Cornelissen, E.R. Forward osmosis for application in wastewater treatment: A review. Water Res. 2014, 58, 179–197. [Google Scholar] [CrossRef]
  33. Ansari, A.J.; Hai, F.I.; Guo, W.; Ngo, H.H.; Price, W.E.; Nghiem, L.D. Selection of forward osmosis draw solutes for subsequent integration with anaerobic treatment to facilitate resource recovery from wastewater. Bioresour. Technol. 2015, 191, 30–36. [Google Scholar] [CrossRef] [Green Version]
  34. Valladares Linares, R.; Li, Z.; Yangali-Quintanilla, V.; Ghaffour, N.; Amy, G.; Leiknes, T.; Vrouwenvelder, J.S. Life cycle cost of a hybrid forward osmosis-low pressure reverse osmosis system for seawater desalination and wastewater recovery. Water Res. 2016, 88, 225–234. [Google Scholar] [CrossRef] [Green Version]
  35. Lu, X.; Boo, C.; Ma, J.; Elimelech, M. Bidirectional diffusion of ammonium and sodium cations in forward osmosis: Role of membrane active layer surface chemistry and charge. Environ. Sci. Technol. 2014, 48, 14369–14376. [Google Scholar] [CrossRef]
  36. Cath, T.Y. Solute Coupled Diffusion in Osmotically Driven Membrane Processes. Environ. Sci. Technol. 2009, 43, 6769–6775. [Google Scholar] [CrossRef]
  37. Ansari, A.J.; Hai, F.I.; Price, W.E.; Drewes, J.E.; Nghiem, L.D. Forward osmosis as a platform for resource recovery from municipal wastewater—A critical assessment of the literature. J. Membr. Sci. 2017, 529, 195–206. [Google Scholar] [CrossRef] [Green Version]
  38. Matin, A.; Laoui, T.; Falath, W.; Farooque, M. Fouling control in reverse osmosis for water desalination & reuse: Current practices & emerging environment-friendly technologies. Sci. Total Environ. 2021, 765, 142721. [Google Scholar] [CrossRef]
  39. Ge, Q.; Wang, P.; Wan, C.; Chung, T.S. Polyelectrolyte-promoted Forward Osmosis-Membrane Distillation (FO-MD) hybrid process for dye wastewater treatment. Environ. Sci. Technol. 2012, 46, 6236–6243. [Google Scholar] [CrossRef]
  40. Nguyen, N.C.; Chen, S.S.; Jain, S.; Nguyen, H.T.; Ray, S.S.; Ngo, H.H.; Guo, W.; Lam, N.T.; Duong, H.C. Exploration of an innovative draw solution for a forward osmosis-membrane distillation desalination process. Environ. Sci. Pollut. Res. 2018, 25, 5203–5211. [Google Scholar] [CrossRef]
  41. Husnain, T.; Liu, Y.; Riffat, R.; Mi, B. Integration of forward osmosis and membrane distillation for sustainable wastewater reuse. Sep. Purif. Technol. 2015, 156, 424–431. [Google Scholar] [CrossRef] [Green Version]
  42. Husnain, T.; Mi, B.; Riffat, R. A Combined Forward Osmosis and Membrane Distillation System for Sidestream Treatment. J. Water Resour. Prot. 2015, 7, 1111–1120. [Google Scholar] [CrossRef] [Green Version]
Figure 1. Schematic diagram of the individual FO membrane process and MD membrane process in dashed rectangles and the integrated FO-MD process as a whole.
Processes 10 00355 g001
Figure 2. An integrated FO-MD process for wastewater treatment and water production with external heat source and heat sink: (A) detailed and (B) simplified process flow diagram.
Processes 10 00355 g002
Figure 3. Water flux, reverse solute flux and specific reverse solute flux at different operating temperatures with DI water as the FS and (A) 0.6 M NaCl and (B) 1.2 M glucose as DS (note: temperature varying from 18 °C to 42.2 °C in FS without temperature control due to the heat transfer from DS to FS).
Processes 10 00355 g003
Figure 4. Water flux at different FS and DS temperatures during the TFC hollow fiber FO filtration of synthetic municipal wastewater until a 70% water recovery rate.
Processes 10 00355 g004
Figure 5. The decline in water flux in three consecutive cycles of FO membrane filtration with a 70% water recovery rate when treating synthetic municipal wastewater at different FS and DS temperatures.
Processes 10 00355 g005
Figure 6. Comparing the water flux recoverability after fouling test of three consecutive cycles with a 70% water recovery rate treating synthetic municipal wastewater in the TFC FO process: (A) FS and DS = 25 °C, (B) FS = 25 °C and DS = 50 °C and (C) FS = not controlled (42 °C) and DS = 50 °C.
Processes 10 00355 g006
Figure 7. Effects of NaCl, MgCl2 and glucose DSs in the MD process at a permeate temperature of 20 °C and a DS temperature of 50 °C with 1L of permeate and DS, respectively, at the beginning of MD, on (A) the NH4+-N concentration on the permeate side and (B) the NH4+-N rejection rate.
Processes 10 00355 g007
Figure 8. Ammonia pressure profiles with temperature and pH at different aqueous ammonium concentrations in DS.
Processes 10 00355 g008
Figure 9. The proposed integrated FO-MD process for wastewater treatment and water production with internal heat recovery.
Processes 10 00355 g009
Table 1. Summary of the initial and final concentrations of pollutants in the synthetic municipal wastewater FS with 0.6 M and 1.2 M glucose as the DS, respectively, and the concentration factors of each pollutant at a 70% water recovery rate after the TFC hollow fiber FO membrane filtration at different FS and DS temperatures.
CODPO43−-PNH4+-NCa2+Mg2+K+SalinitypH
mg/L
Initial460.66 ± 32.547.90 ± 0.1553.96 ± 0.6637.25 ± 0.736.28 ± 0.3520.27 ± 1.36-6.98 ± 0.02
NaClFS and DS = 25 °CFinal (FS)1427.55 ± 16.9723.33 ± 0.0634.66 ± 0.23101.04 ± 1.7719.97 ± 0.5034.66 ± 0.931724.44 ± 77.847.10
CF
Final (DS)
3.10
-
2.95
Not detected
−1.56
25.29 ± 0.43
2.71
-
3.17
-
1.71
-
-
-
-
-
FS = 25 °C and DS = 50 °CFinal (FS)1415.56 ± 101.7922.71 ± 0.0326.89 ± 0.26100.45 ± 1.8119.67 ± 0.3429.24 ± 1.461953.33 ± 23.097.16
CF
Final (DS)
3.07
-
2.88
Not detected
−2.01
26.89 ± 0.37
2.70
-
3.13
-
1.44
-
-
-
-
-
FS = Not controlled and DS = 50 °CFinal (FS)1439.55 ± 67.8622.14 ± 0.1518.21 ± 0.1097.06 ± 1.3618.89 ± 0.7623.33 ± 0.482400 ± 72.117.19
CF
Final (DS)
3.12
-
2.80
Not detected
−2.96
27.06 ± 0.49
2.61
-
3.00
-
1.15
-
-
-
-
-
GlucoseFS and DS = 25 °CFinal (FS)1736.68 ± 33.9323.63 ± 0.30164.34 ± 1110.16 ± 1.0320.35 ± 1.0463.44 ± 0.98-7.08
CF
Final (DS)
3.77
-
2.99
Not detected
3.05
Not detected
2.96
-
3.24
-
3.13
-
-
-
-
-
FS = 25 °C and DS = 50 °CFinal (FS)1847.25 ± 16.9722.91 ± 0.49160.70 ± 0.50107.22 ± 2.0819.89 ± 0.7663.65 ± 2.11-7.15
CF
Final (DS)
4.01
-
2.90
Not detected
2.98
Not detected
2.88
-
3.17
-
3.14
-
-
-
-
-
FS = Not controlled and DS = 50 °CFinal (FS)1870.28 ± 33.9322.68 ± 0.08151.11 ± 0.37104.30 ± 0.9819.18 ± 0.2362 ± 1.07-7.16
CF
Final (DS)
4.06
-
2.87
Not detected
2.80
Not detected
2.80
-
3.05
-
3.06
-
-
-
-
-
Publisher’s Note: MDPI stays neutral with regard to jurisdictional claims in published maps and institutional affiliations.

