
Vigna subterranea (L.) Verdc Starch-Soluble Dietary Fibre Potential Nanocomposite: Thermal Behaviour, Morphology and Crystallinity


Abstract
:1. Introduction
2. Materials and Methods
2.1. Source of Materials
2.2. Extraction of BGN Soluble Dietary Fibre and Starch
2.3. Phase Behaviour Study of BGNS and BGN-SDF
2.4. Production of Starch-Soluble Dietary Fibre Nanocomposite
2.5. Chemical Analysis of BGNS, BGN-SDF and STASOL
2.6. Conductivity and Particle Size Determination of BGNS, BGN-SDF and STASOL
2.7. Functional Groups of BGNS, BGN-SDF and STASOL
2.8. Crystallinity of BGNS, BGN-SDF and STASOL
2.9. Morphology and Microstructure of BGNS, BGN-SDF and STASOL
2.10. Fluorescence Analysis of BGNS, BGN-SDF and STASOL
2.11. Thermal Analysis of BGNS, BGN-SDF and STASOL
2.12. Data Analysis
3. Results and Discussion
3.1. Phase Behaviour of Bambara Groundnut Starch and Soluble Dietary Fibre Concentrations in Solution
3.2. Yield and Chemical Composition of Bambara Groundnut Soluble Dietary Fibre and Bambara Groundnut Starch–Fibre Nanocomposite
3.3. Particle Size and Conductivity of Bambara Groundnut Starch, Soluble Dietary Fibre and Starch-Soluble Dietary Fibre Nanocomposite
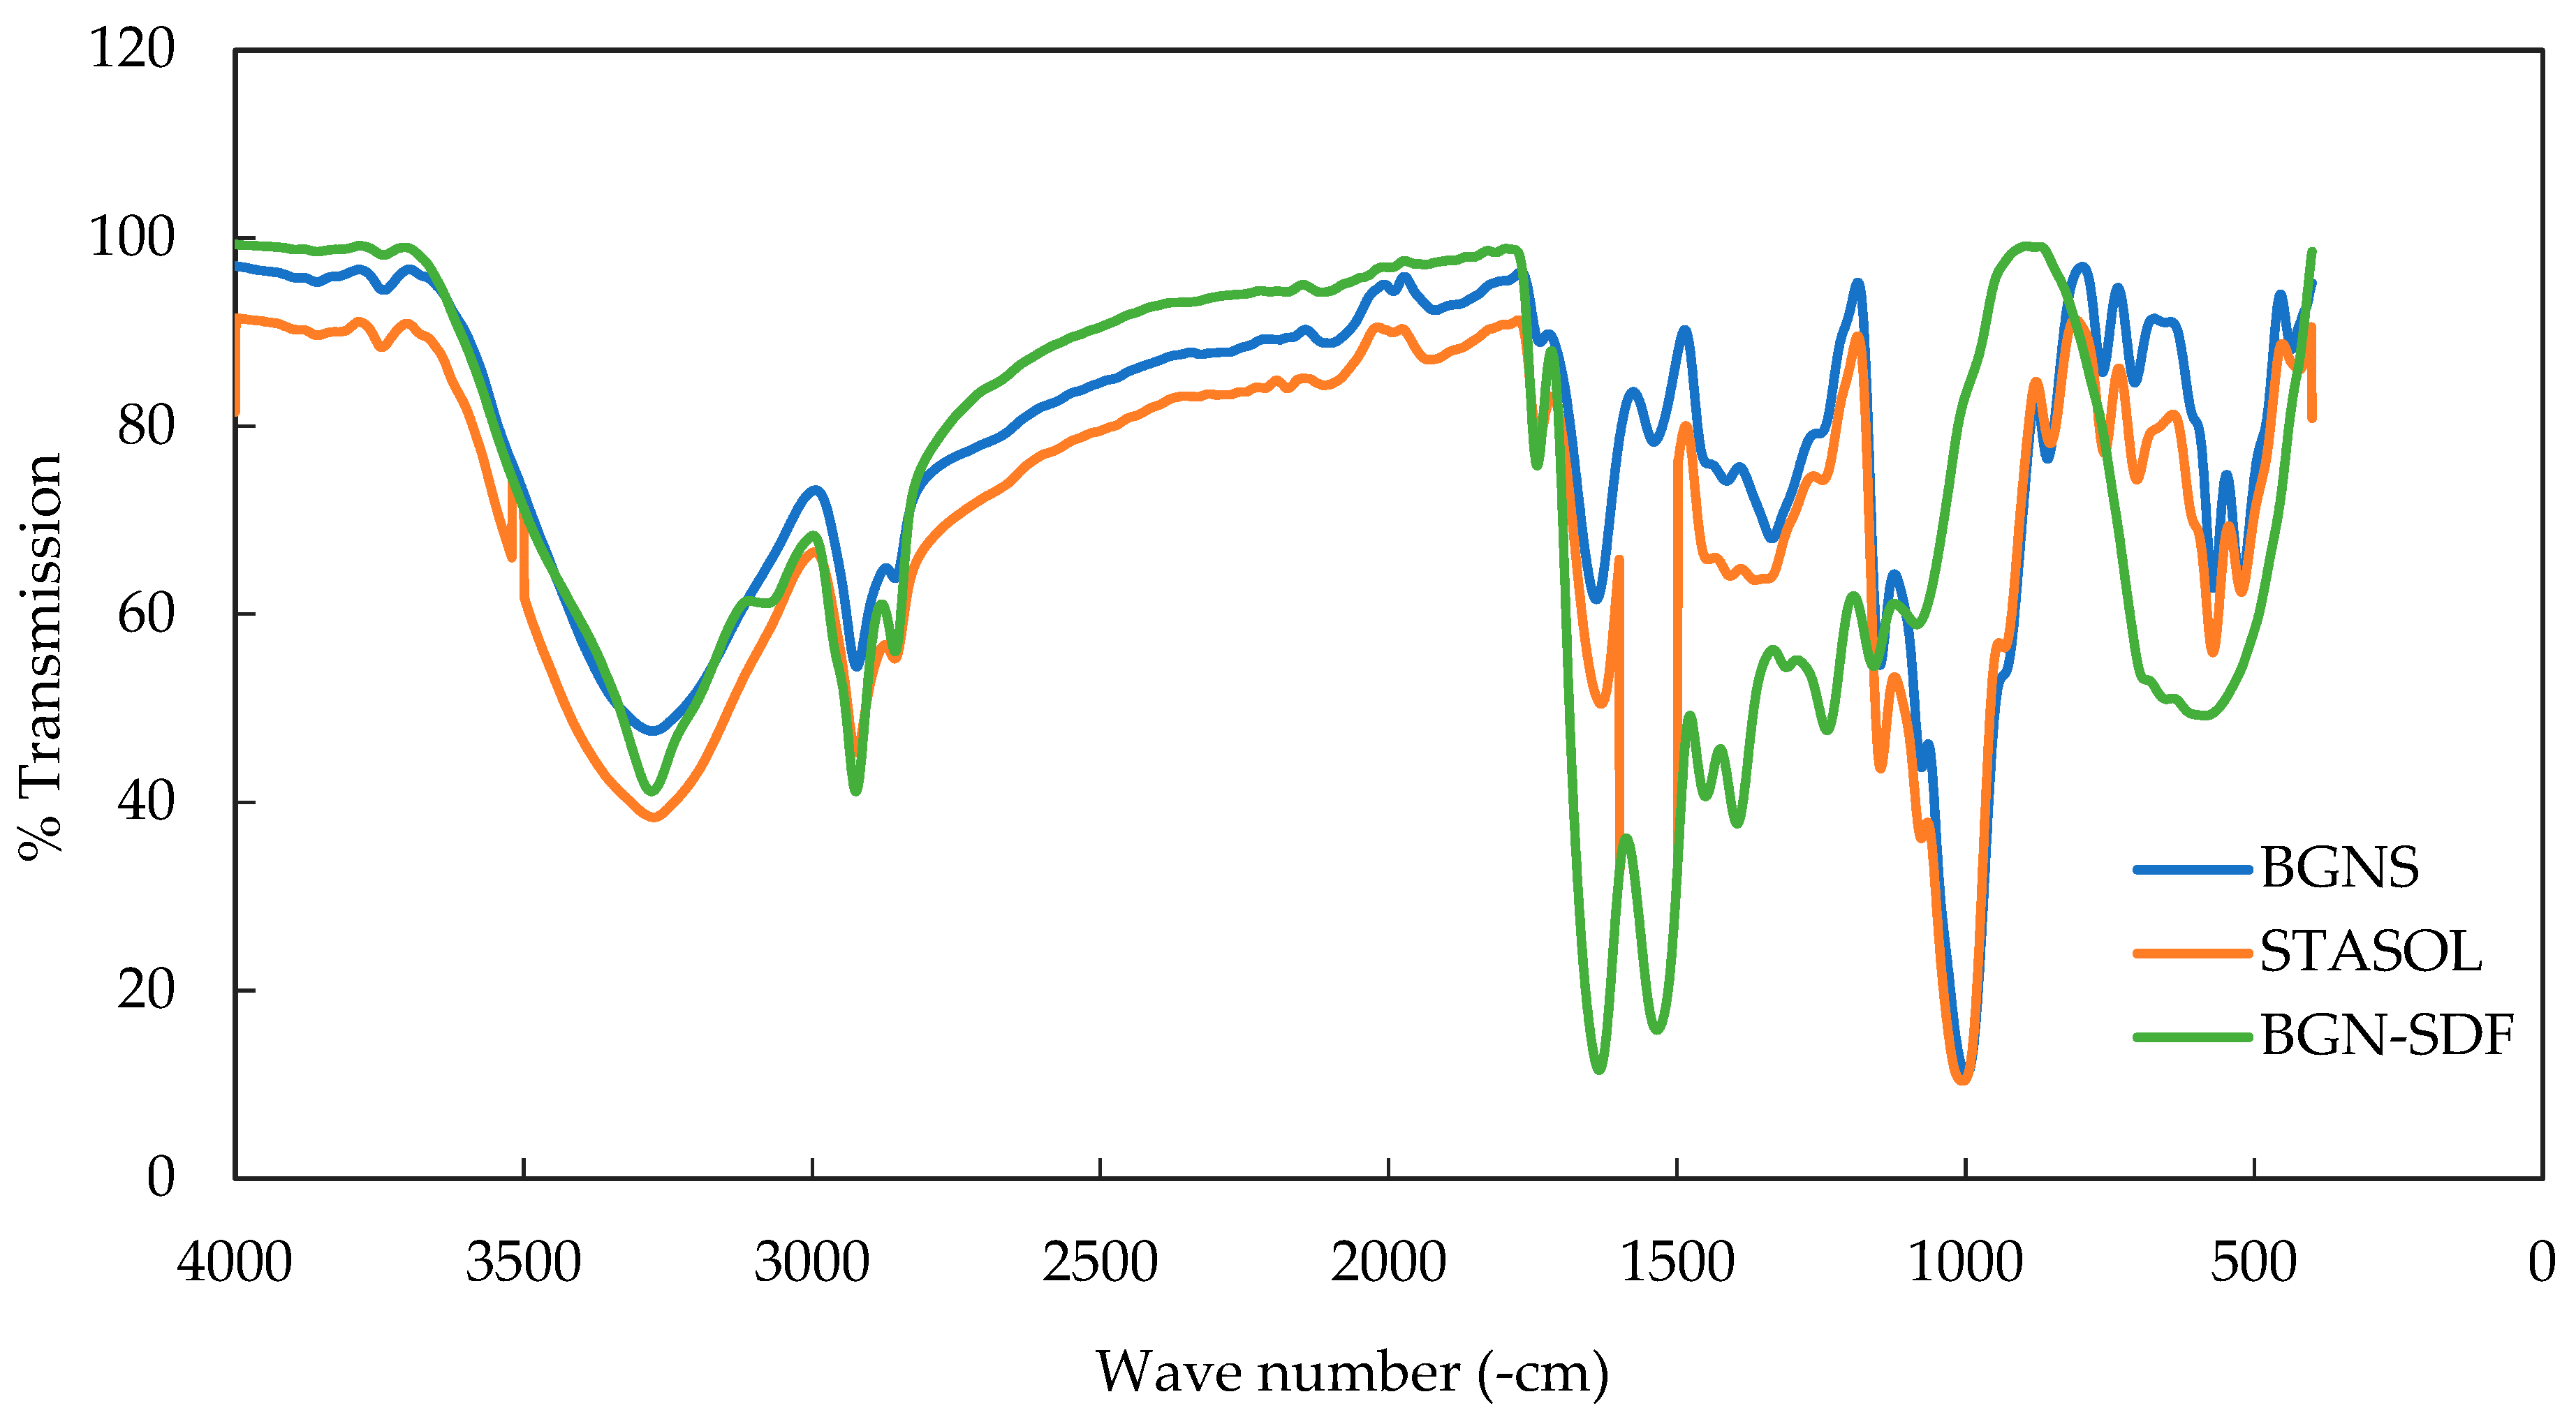
3.4. Functional Groups of Bambara Groundnut Starch, Soluble Dietary Fibre and Starch-Soluble Dietary Fibre Nanocomposite
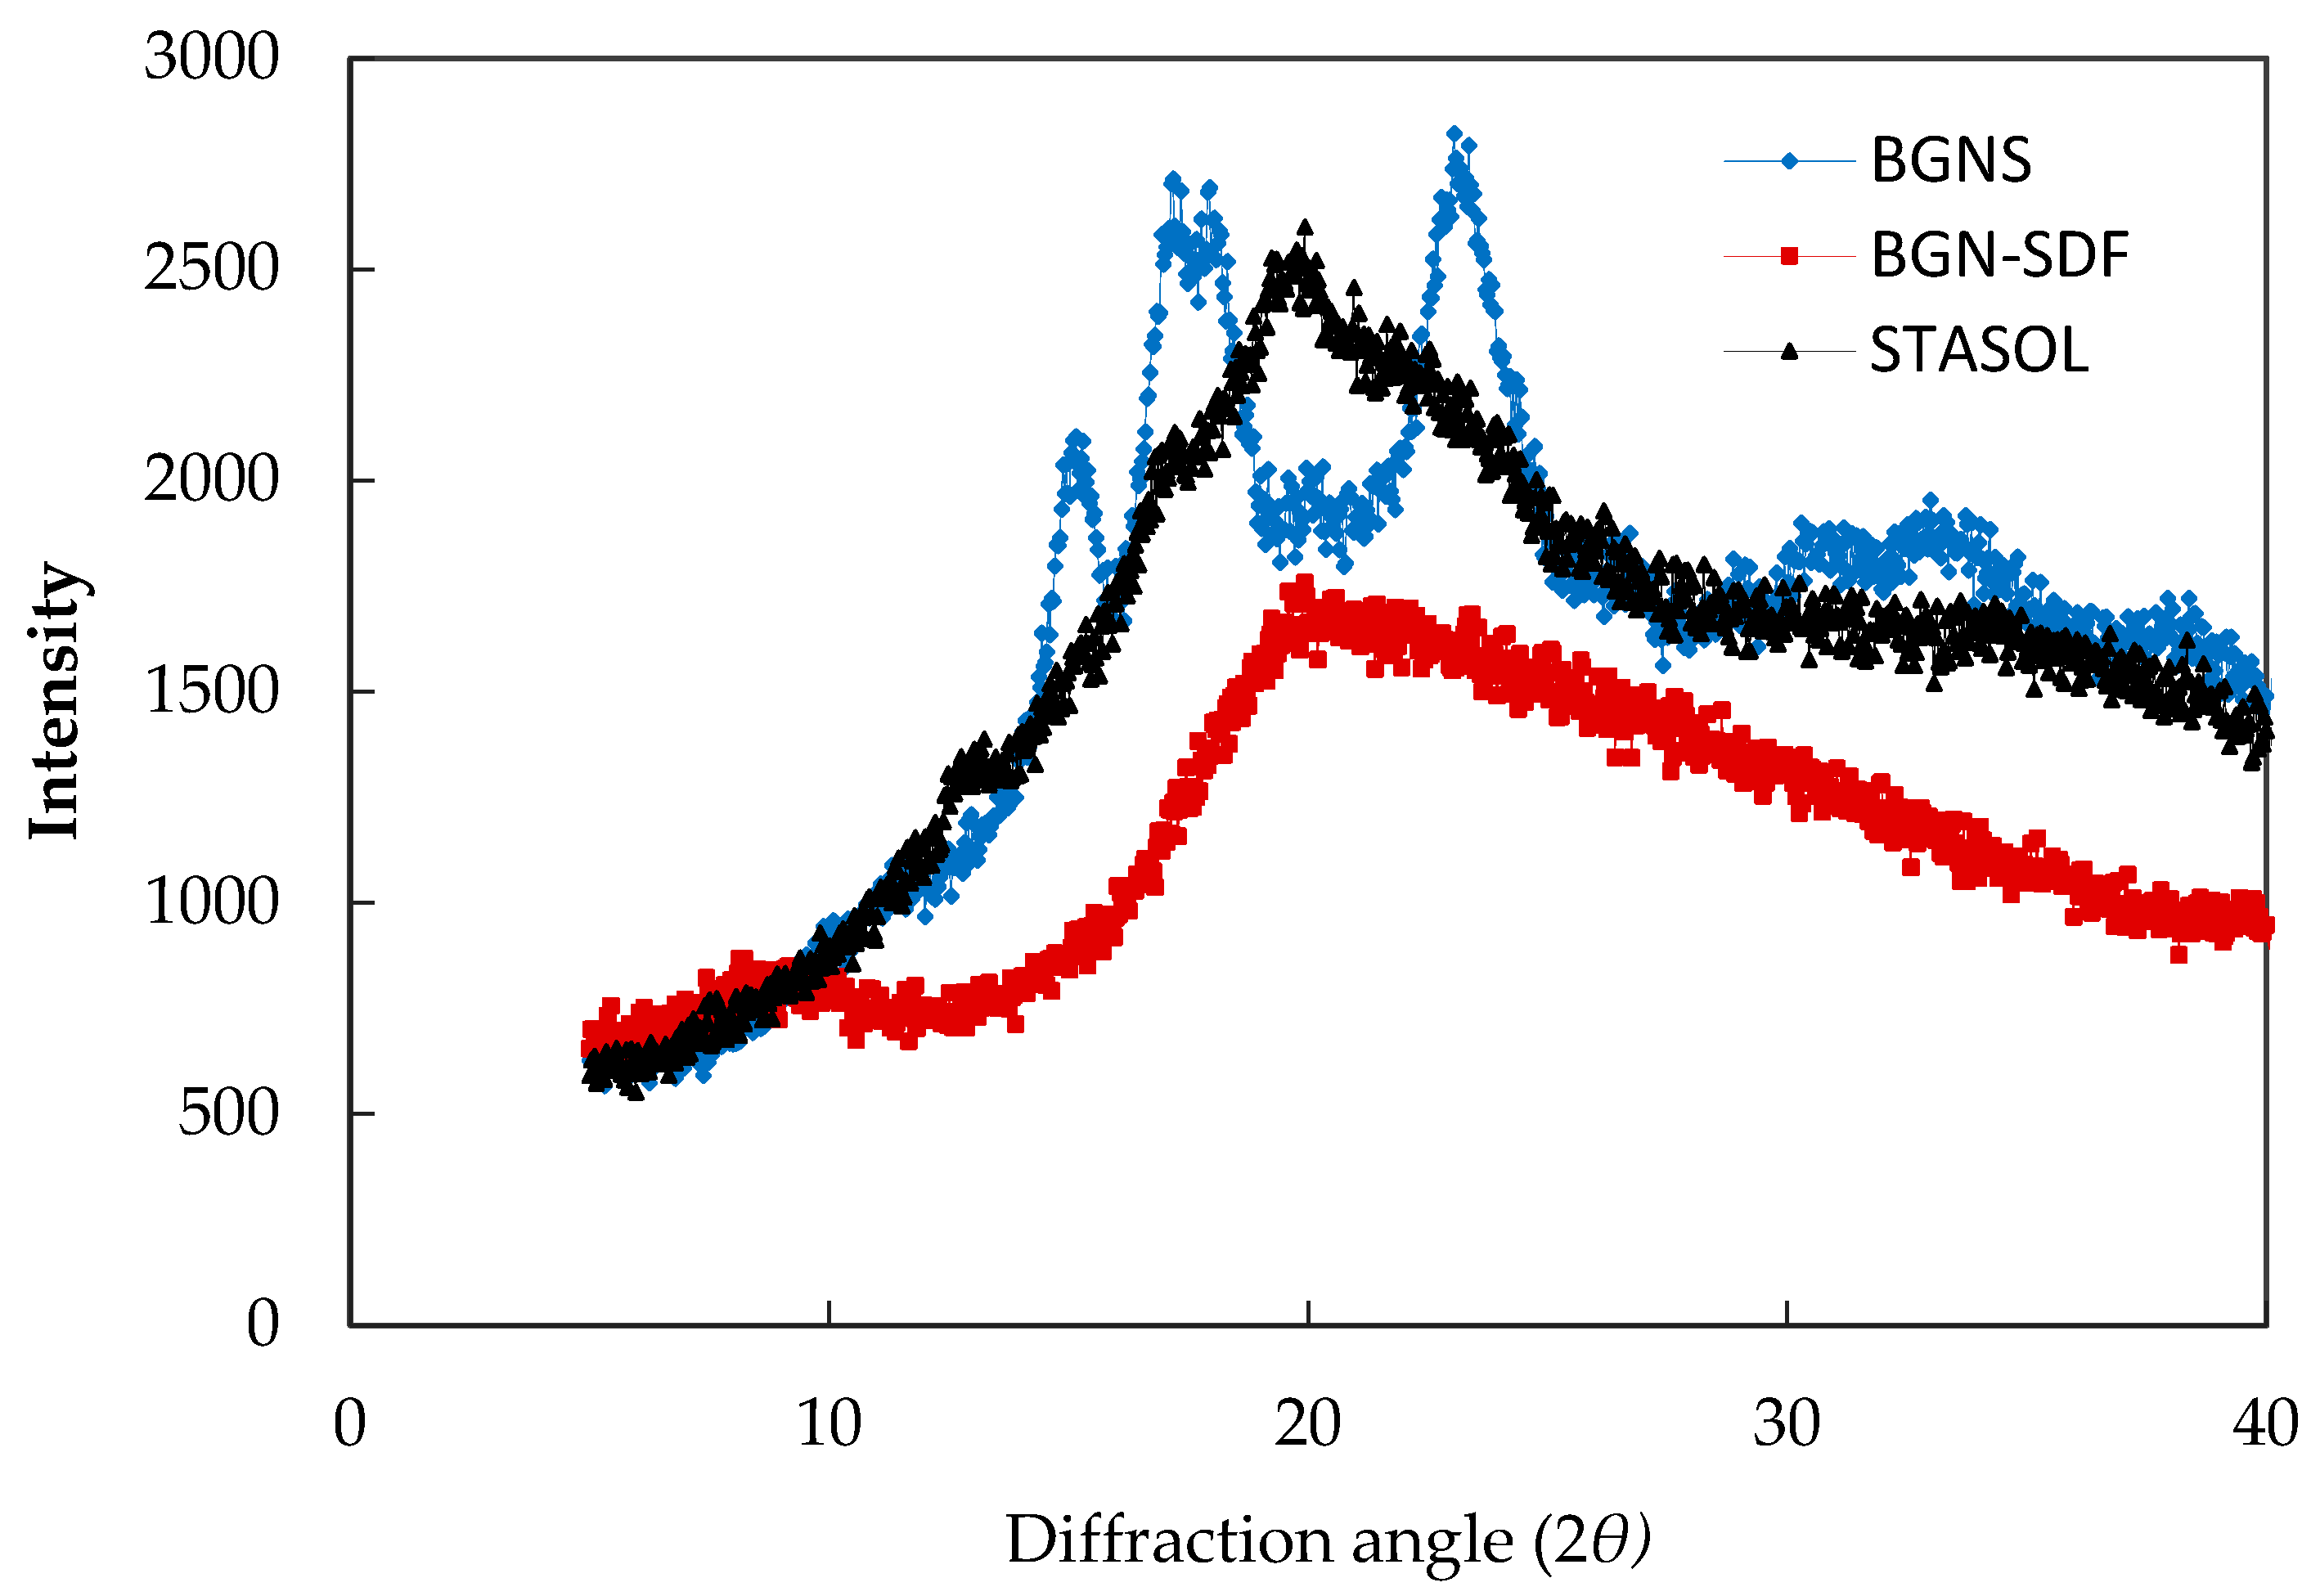
3.5. Crystallinity of Bambara Groundnut Starch, Soluble Dietary Fibre and Starch-Soluble Dietary Fibre Nanocomposite
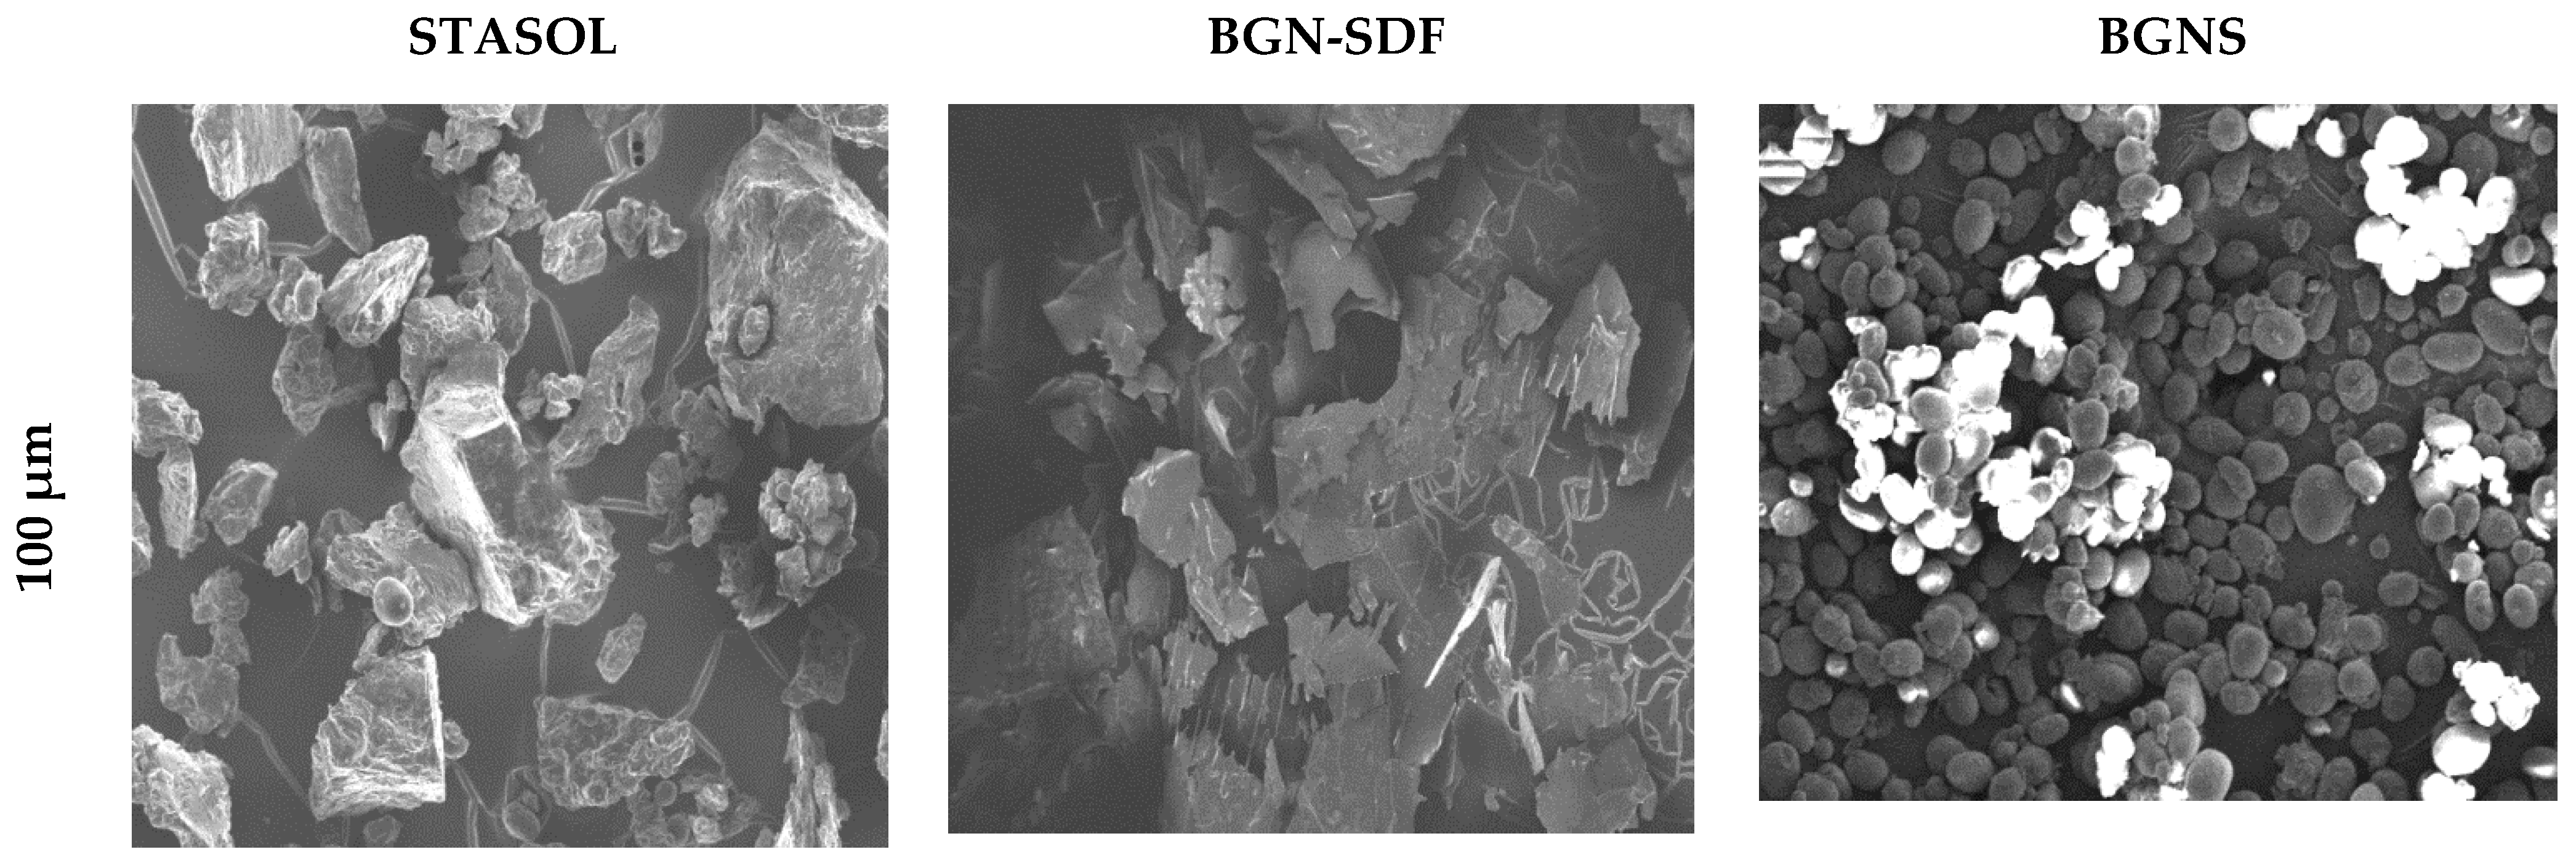
3.6. Microstructure and Morphology of Bambara Groundnut Starch, Soluble Dietary Fibre and Starch-Soluble Dietary Fibre Nanocomposite
3.7. Fluorescence Spectra of Bambara Groundnut Starch, Soluble Dietary Fibre and Starch-Soluble Dietary Fibre Nanocomposite
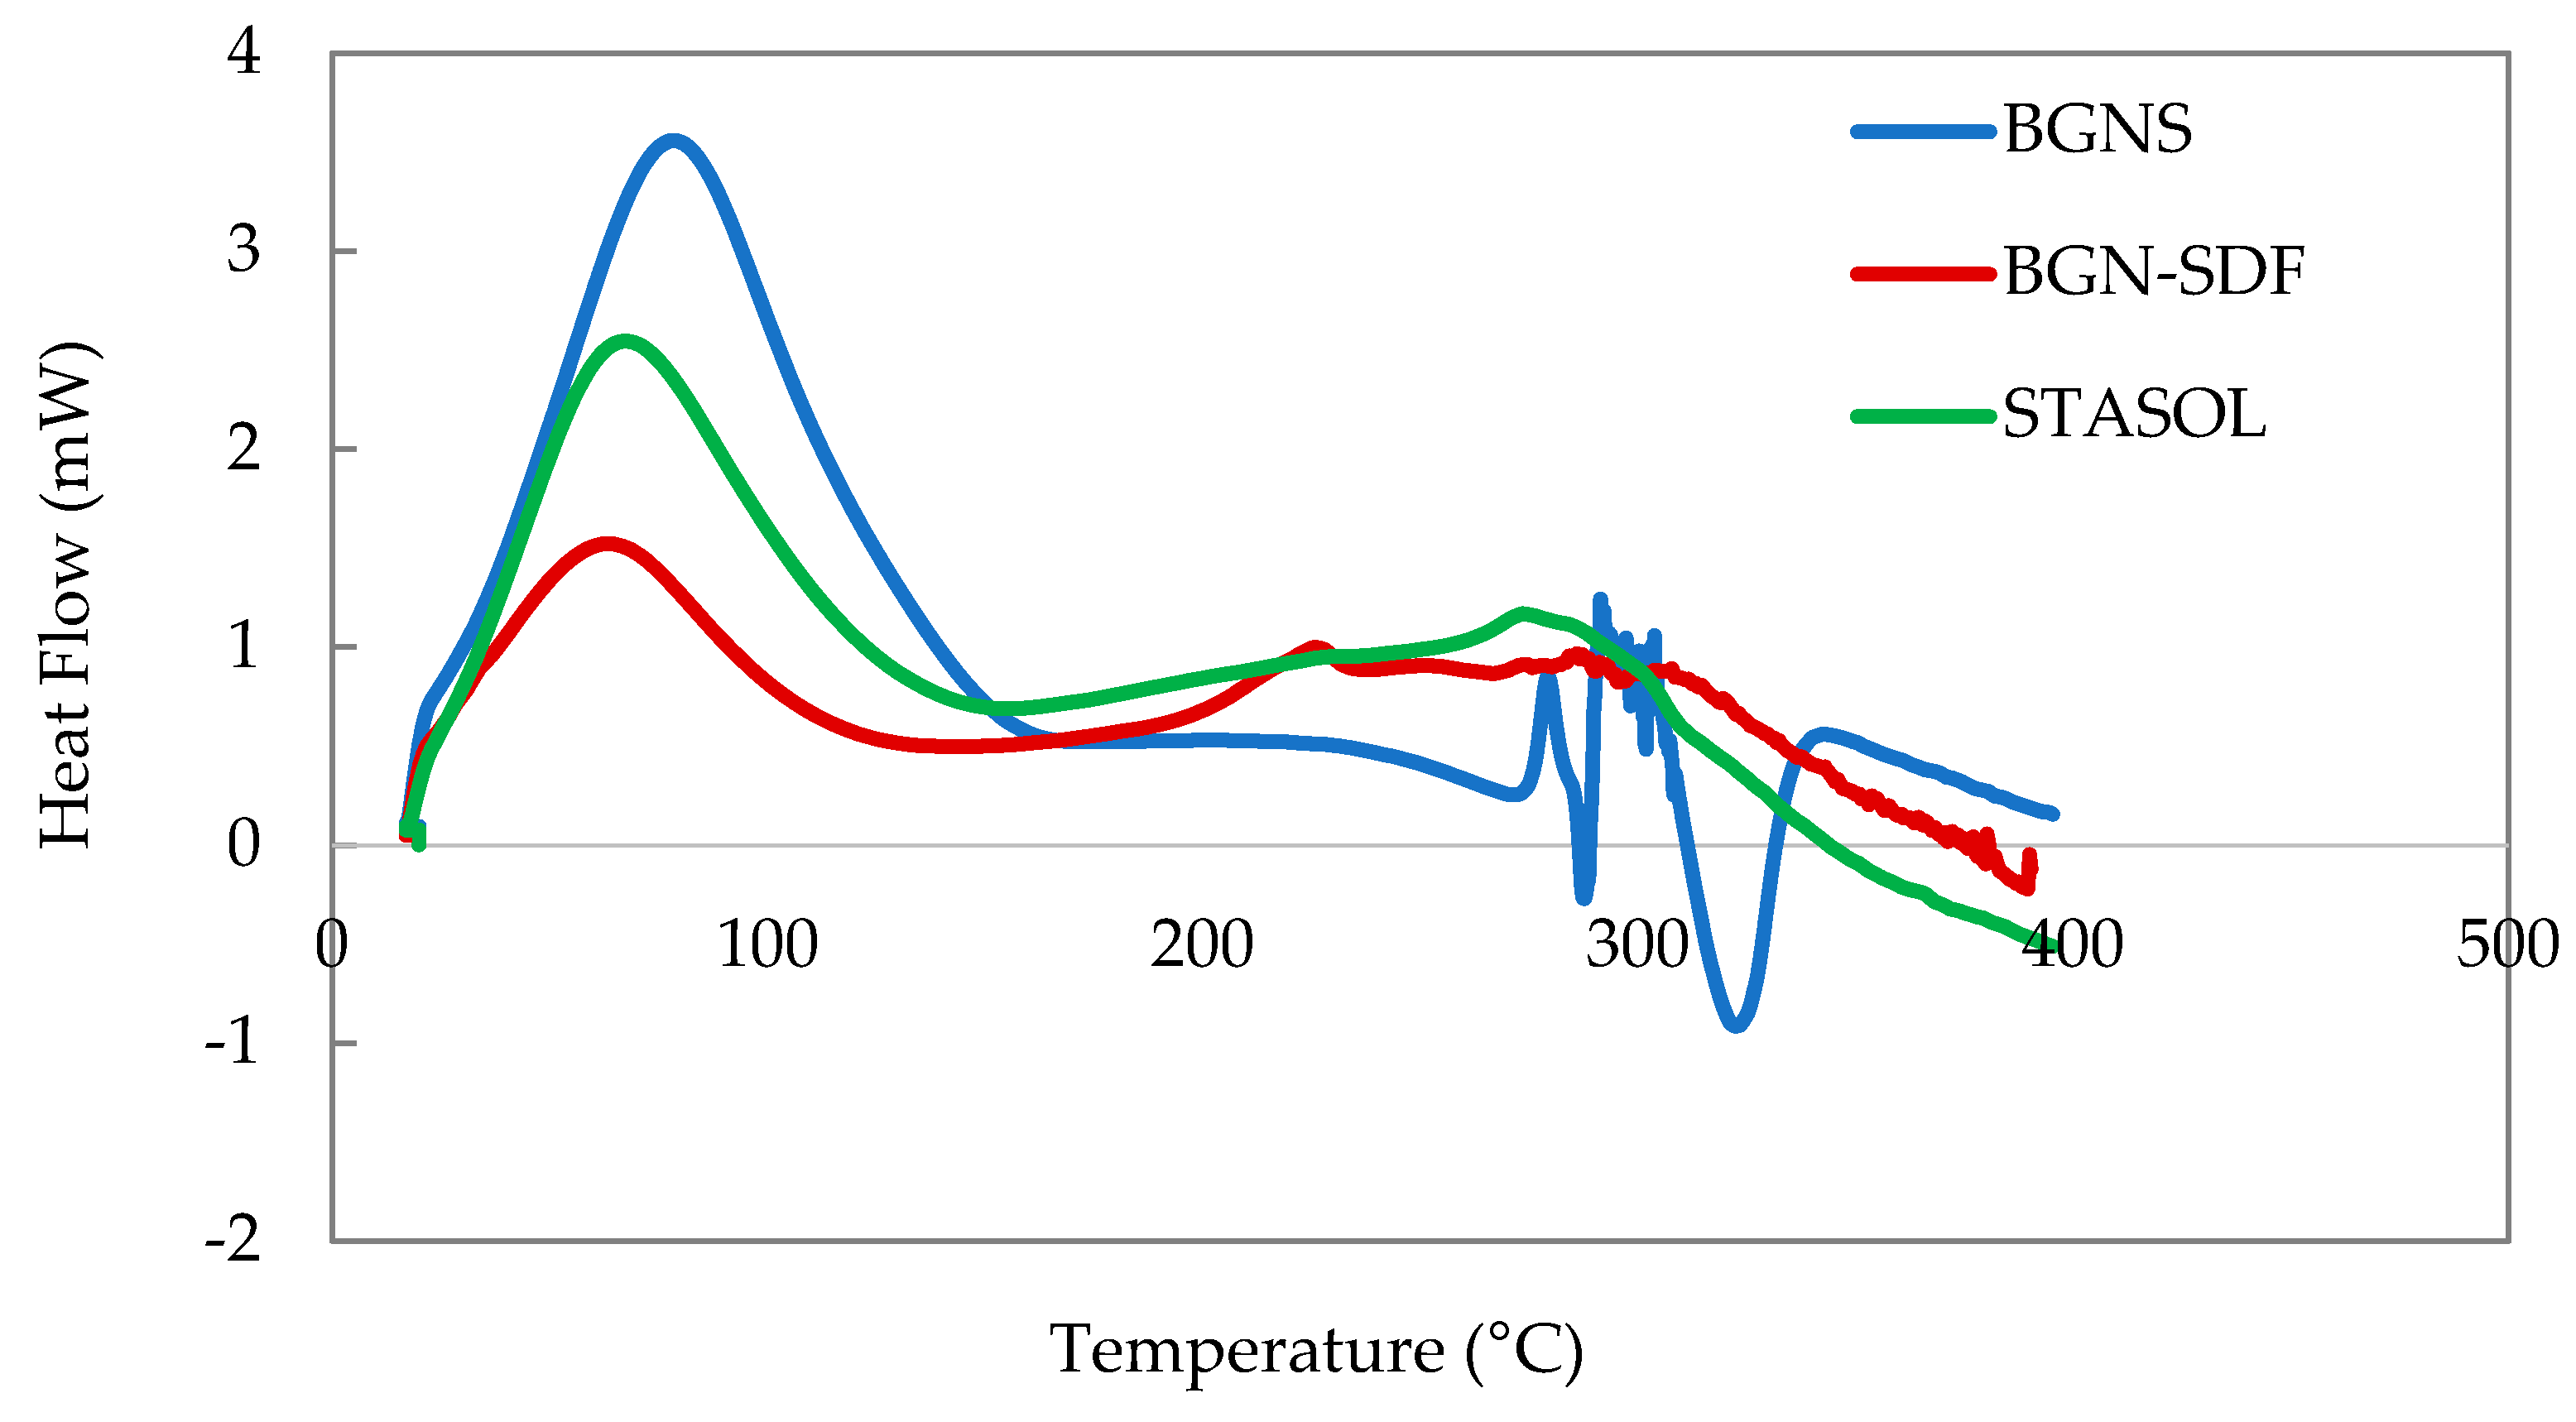
3.8. Thermal Properties of Bambara Groundnut Starch, Soluble Dietary Fibre and Starch-Soluble Dietary Fibre Nanocomposite
4. Conclusions
Author Contributions
Funding
Institutional Review Board Statement
Informed Consent Statement
Data Availability Statement
Conflicts of Interest
References
- Jideani, V.A.; Mpotokwana, S.M. Modelling of water absorption of Botswana Bambara varieties using Peleg’s equation. J. Food Eng. 2009, 92, 182–188. [Google Scholar] [CrossRef]
- Diedericks, C.F.; Jideani, V.A. Nutritional, Therapeutic and Prophylactic Properties of Vigna subterranea and Moringa Oleifera. J. Food Sci. Technol. 2014, 52, 4078–4089. [Google Scholar] [CrossRef] [Green Version]
- Murevanhema, Y.Y.; Jideani, V.A. Potential of Bambara groundnut (Vigna subterranea (L.) Verdc) milk as a probiotic beverage: A review. Crit. Rev. Food Sci. Nutr. 2013, 53, 954–967. [Google Scholar] [CrossRef] [PubMed]
- Ye, A. Complexation between milk proteins and polysaccharides via electrostatic interaction: Principles and applications: A review. Int. J. Food Sci. Technol. 2008, 43, 406–415. [Google Scholar] [CrossRef]
- Oyeyinka, S.A.; Singh, S.; Ma, Y.; Amonsou, E.O. Effect of high-pressure homogenization on structural, thermal and rheological properties of Bambara starch complexed with different fatty acids. R. Soc. Chem. 2016, 6, 80174–80180. [Google Scholar] [CrossRef]
- Gammans, M.; Merel, P.; Ortiz-Bobea, A. Negative impacts of climate change on cereal yields: Statistical evidence from France. Environ. Res. Lett. 2017, 12, 054007. [Google Scholar] [CrossRef]
- Gulu, N.B. Functional and Rheological Properties of Bambara Groundnut Starch-Catechin Complex Obtained by Chemical Grafting. Master’s Thesis, Cape Peninsula University of Technology, Cape Town, South Africa, 2018. Available online: http://etd.cput.ac.za/handle/20.500.11838/2806 (accessed on 20 November 2021).
- Winarti, C.; Sunarti, T.; Mangunwidjaja, D.; Richana, N. Preparation of arrowroot starch nanoparticles by butanol-complex precipitation, and as bioactive encapsulation matrix. Int. Food Res. J. 2014, 21, 2207–2213. [Google Scholar]
- Wang, S.; Wang, J.; Zhang, W.; Li, C.; Yu, J.; Wang, S. Molecular order and functional properties of starches from three waxy wheat varieties grown in China. Food Chem. 2015, 181, 43–50. [Google Scholar] [CrossRef]
- Ashogbon, A.O.; Akintayo, E.T. Morphological and functional properties of starches from cereal and legume: A comparative study. Int. J. Biotechnol. Food Sci. 2013, 1, 72–83. [Google Scholar]
- Maphosa, Y. Characterisation of Bambara Groundnut (Vigna Subterranea (L) Verdc.) Non-Starch Polysaccharides from Wet Milling as Prebiotics. Master’s Thesis, Cape Peninsula University of Technology, Cape Town, South Africa, 2016. Available online: http://etd.cput.ac.za/handle/20.500.11838/2342 (accessed on 20 November 2021).
- Maphosa, Y.; Jideani, V.A. Physicochemical characteristics of Bambara groundnut dietary fibres extracted using wet milling. S. Afr. J. Sci. 2016, 112, 1–8. [Google Scholar] [CrossRef] [Green Version]
- Spizzirri, U.G.; Altimari, I.; Puoci, F.; Parisi, O.I.; Iemma, F.; Picci, N. Innovative antioxidant thermo-responsive hydrogels by radical grafting of catechin on inulin chain. Carbohydr. Polym. 2011, 84, 517–523. [Google Scholar] [CrossRef]
- Liu, Y.; Chen, W.; Chen, C.; Zhang, J. Physicochemical Property of Starch-Soluble Dietary Fiber Conjugates and Their Resistance to Enzymatic Hydrolysis. Int. J. Food Prop. 2015, 18, 2457–2471. [Google Scholar] [CrossRef]
- Singh, S.; D’Sa, E.; Swenson, E. Seasonal variability in CDOM absorption and fluorescence properties in the Barataria Basin, Louisiana, USA. J. Environ. Sci. 2010, 22, 1481–1490. [Google Scholar] [CrossRef]
- Fama, L.; Gerschenson, L.; Goyanes, S. Starch-vegetable fibre composites to protect food products. Carbohydr. Polym. 2009, 75, 230–235. [Google Scholar] [CrossRef]
- Spizzirri, U.G.; Parisi, O.I.; Iemma, F.; Cirillo, G.; Puoci, F.; Curcio, M.; Picci, N. Antioxidant-polysaccharide conjugates for food application by eco-friendly grafting. Carbohydr. Polym. 2010, 79, 333–340. [Google Scholar] [CrossRef]
- Adeyi, O.; Ikhu-Omoregbe, D.; Jideani, V. Emulsion stability and steady shear characteristics of concentrated oil-in-water emulsion stabilized by gelatinized bambara groundnut flour. Asian J. Chem. 2014, 26, 4995–5002. [Google Scholar] [CrossRef]
- Ramirez-Sanchez, I.; Maya, L.; Ceballos, G.; Villarreal, F. Fluorescent detection of (-)-epicatechin in microsamples from cacao seeds and cocoa products: Comparison with Folin-Ciocalteu method. J. Food Compos. Anal. 2010, 23, 790–793. [Google Scholar] [CrossRef] [Green Version]
- Afolabi, T.A. Synthesis and physicochemical properties of carboxymethylated bambara groundnut (Voandzeia subterranea) starch. Int. J. Food Sci. Technol. 2012, 47, 445–451. [Google Scholar] [CrossRef]
- Rosell, C.M.; Santos, E.; Collar, C. Physico-chemical properties of commercial fibres from different sources: A comparative approach. Food Res. Int. 2009, 42, 176–184. [Google Scholar] [CrossRef] [Green Version]
- Adeyi, O. Effect of Bambara Groundnut Flour on the Stability and Rheological Properties of Oil-In-Water Emulsion. Ph.D. Thesis, Cape Peninsula University of Technology, Cape Town, South Africa, 2014. Available online: http://hdl.handle.net/11189/1889 (accessed on 18 November 2021).
- Maphosa, Y.; Jideani, V.A. The Role of Legumes in Human Nutrition. In Functional Food-Improve Health through Adequate Food; Hueda, M.C., Ed.; InTech: London, UK, 2017. [Google Scholar] [CrossRef] [Green Version]
- Jha, P.K.; Desai, P.S.; Li, J.; Larson, R.G. pH and salt effects on the associative phase separation of oppositely charged polyelectrolytes. Polymer 2014, 6, 1414–1436. [Google Scholar] [CrossRef]
- Tolstoguzov, V. Food Polysaccharides and Their Applications. In Food Science and Technology, 2nd ed.; Alistair, M., Stephen, G.O., Phillips, P., Williams, A., Eds.; CRC Press, Taylor & Francis: New York, NY, USA, 2006; p. 589. [Google Scholar]
- Sirivongpaisal, P. Structure and functional properties of starch and flour from bambarra groundnut. Songklanakarin J. Sci. Technol. 2008, 30, 51–56. [Google Scholar] [CrossRef]
- Adebowale, K.O.; Afolabi, T.; Lawal, O.S. Isolation, chemical modification and physicochemical characterisation of Bambarra groundnut (Voandzeia subterranea) starch and flour. Food Chem. 2002, 78, 305–311. [Google Scholar] [CrossRef]
- Rauscher, H.; Rasmussen, K.; Sokull-Klüttgen, B. Regulatory Aspects of Nanomaterials in the EU. Chem. Ing. Tech. 2017, 89, 224–231. [Google Scholar] [CrossRef]
- Kaptso, K.G.; Njintang, Y.N.; Nguemtchouin, M.M.G.; Scher, J.; Hounhouigan, J.; Mbofung, C.M. Physicochemical and micro-structural properties of flours, starch and proteins from two varieties of legumes: Bambara groundnut (Vigna subterranea). J. Food Sci. Technol. 2015, 52, 4915–4924. [Google Scholar] [CrossRef] [PubMed] [Green Version]
- Ferraris, S.; Cazzola, M.; Peretti, V.; Stella, B.; Spriano, S. Zeta Potential Measurements on Solid Surfaces for in vitro Biomaterials Testing: Surface Charge, Reactivity upon Contact with Fluids and Protein Absorption. Front. Bioeng. Biotechnol. 2018, 6, 60. [Google Scholar] [CrossRef] [PubMed]
- Oyeyinka, S.A.; Singha, S.; Adebola, P.; Amonsou, E. Physicochemical properties of starches with variable amylose contents extracted from bambara groundnut genotypes. Carbohydr. Polym. 2015, 133, 171–178. [Google Scholar] [CrossRef] [PubMed]
- Zhang, J.; Wang, Z.W. Soluble dietary fibre from Canna edulis Ker by-product and its physicochemical properties. Carbohydr. Polym. 2013, 92, 289–296. [Google Scholar] [CrossRef]
- Oyeyinka, S.A.; Oyeyinka, A.T. A review on isolation, composition, physicochemical properties and modification of Bambara groundnut starch. Food Hydrocolloid 2017, 75, 62–71. [Google Scholar] [CrossRef]
- Sandhu, K.S.; Lim, S.T. Digestibility of legume starches as influenced by their physical and structural properties. Carbohydr. Polym. 2008, 71, 245–252. [Google Scholar] [CrossRef]
- Parri, E.; Santinami, G.; Domenici, V. Front-Face Fluorescence of Honey of Different Botanic Origin: A Case Study from Tuscany (Italy). Appl. Sci. 2020, 10, 1776. [Google Scholar] [CrossRef] [Green Version]
- Skoog, A.; Wedborg, M.; Fogelqvist, E. Photobleaching of fluorescence and the organic carbon concentration in a coastal environment. Mar. Chem. 1996, 55, 333–345. [Google Scholar] [CrossRef]
- Therdthai, N.; Zhou, W.; Adamczak, T. Optimisation of the temperature profile in bread baking. J. Food Eng. 2002, 55, 41–48. [Google Scholar] [CrossRef]
- Wahyuningtiyas, N.E.; Suryanto, H. Analysis of Biodegradation of Bioplastics Made of Cassava Starch. J. Mech. Eng. Sci. Technol. 2017, 1, 41–54. [Google Scholar] [CrossRef] [Green Version]


| BGNS:BGN-SDF | Visual Observation | Initial BS (%) | Pictorial Representation |
|---|---|---|---|
| 5:0.65 | Visible separation of polymer phases Syneresis | 78.4 | 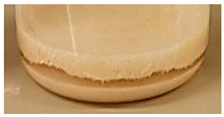 |
| 10:1.3 | A thin layer of SDF observed on the top No syneresis observed Two layers of polymers observed | 79.8 |  |
| 15:1.95 | No separation observed | 82.9 |  |
| 15:0.65 | No separation observed | 77.1 | 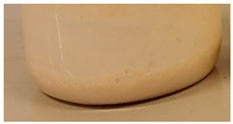 |
| 5:1.95 | A thin layer of SDF observed on the top No syneresis observed Two layers of polymers observed | 80.9 | 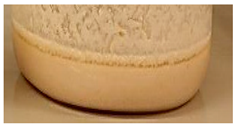 |
| Moisture (%) | Ash (%) | Protein (%) | Fat (%) | Carbohydrates (%) | |
|---|---|---|---|---|---|
| BGNS | 10.84 ± 0.0436 a | 0.07 ± 0.0100 a | 1.74 ± 0.3487 a | 0.56 ± 0.0222 a | 86.79 ± 0.3134 a |
| BGN-SDF | 10.82 ± 0.0839 a | 4.90 ± 0.0900 b | 15.54 ± 0.3029 b | 0.54 ± 0.0162 a | 68.20 ± 0.1811 b |
| STASOL | 8.63 ± 0.2500 b | 4.88 ± 0.0666 b | 6.96 ± 0.6749 c | 0.84 ± 0.0100 b | 78.69 ± 0.5500 c |
| Peak 1 | Peak 2 | |||||
|---|---|---|---|---|---|---|
| Peak (°C) | Area (mJ) | ∆H (J/g) | Peak (°C) | Area (mJ) | ∆H (J/g) | |
| BGNS | 77.19 ± 0.4 a | 1420.91 ± 49 a | 458.36 ± 16 a | 279.52 ± 0.3 a | 18.10 ± 6 a | 5.84 ± 1.9 a |
| BGN-SDF | 68.84 ± 2.3 ab | 397.79 ± 127 b | 297.54 ± 110 b | 230.30 ± 0.2 a | 18.70 ± 2 a | 13.9 ± 1.8 ab |
| STASOL | 65.50 ± 1.4 b | 875.01 ± 33 b | 261.36 ± 15 b | 293.14 ± 12 a | 83.98 ± 6 b | 25.09 ± 2.3 b |
Publisher’s Note: MDPI stays neutral with regard to jurisdictional claims in published maps and institutional affiliations. |
© 2022 by the authors. Licensee MDPI, Basel, Switzerland. This article is an open access article distributed under the terms and conditions of the Creative Commons Attribution (CC BY) license (https://creativecommons.org/licenses/by/4.0/).
Share and Cite
Maphosa, Y.; Jideani, V.A.; Ikhu-Omoregbe, D.I. Vigna subterranea (L.) Verdc Starch-Soluble Dietary Fibre Potential Nanocomposite: Thermal Behaviour, Morphology and Crystallinity. Processes 2022, 10, 299. https://doi.org/10.3390/pr10020299
Maphosa Y, Jideani VA, Ikhu-Omoregbe DI. Vigna subterranea (L.) Verdc Starch-Soluble Dietary Fibre Potential Nanocomposite: Thermal Behaviour, Morphology and Crystallinity. Processes. 2022; 10(2):299. https://doi.org/10.3390/pr10020299
Chicago/Turabian StyleMaphosa, Yvonne, Victoria Adaora Jideani, and Daniel Imwansi Ikhu-Omoregbe. 2022. "Vigna subterranea (L.) Verdc Starch-Soluble Dietary Fibre Potential Nanocomposite: Thermal Behaviour, Morphology and Crystallinity" Processes 10, no. 2: 299. https://doi.org/10.3390/pr10020299
APA StyleMaphosa, Y., Jideani, V. A., & Ikhu-Omoregbe, D. I. (2022). Vigna subterranea (L.) Verdc Starch-Soluble Dietary Fibre Potential Nanocomposite: Thermal Behaviour, Morphology and Crystallinity. Processes, 10(2), 299. https://doi.org/10.3390/pr10020299