Article

Molecular Simulation Comparison of Two Ultrafine Coal-Based Activated Carbons for the Removal of Methylene Blue from Water

1
School of Materials Science and Engineering Anhui University of Science and Technology, Huainan 232001, China
2
School of Resources and Environmental Engineering, Shandong University of Technology, Zibo 255049, China
*
Authors to whom correspondence should be addressed.
Processes 2022, 10(2), 290; https://doi.org/10.3390/pr10020290
Submission received: 10 January 2022 / Revised: 23 January 2022 / Accepted: 28 January 2022 / Published: 31 January 2022

Abstract

:
Coal-based activated carbons (CACs) have excellent valuable applications, and have been industrially produced. However, ultra-fine coal-based activated carbons (UCACs) and their removal of methylene blue (MB) have rarely been reported in the present literature. Two kinds of UCACs were obtained in this paper and the adsorption test of MB was carried out. The adsorption performance of MB on UCAC was simulated by Grand Canonical Monte Carlo (GC-MC) method. The experimental results were validated by molecular simulation, and the adsorption mechanism was investigated. The adsorption amount of MB, the d50, and specific surface area values of the UCACnew (obtained by the new method) and UCACcm (obtained by the conventional chemical method) were 746.95 mg/g, 12.54 μm, 1225.36 m2/g and 652.77 mg/g, 12.10 μm, 713.76 m2/g, respectively. The results of the molecular simulation calculations were consistent with the pattern of magnitude of the experimental results. The peak of the adsorption concentration occurred near 6 Å on the pore surface. The interaction energy of MB molecules with carboxyl groups was much larger than with hydroxyl groups. Van der Waals forces dominated the adsorption process, with a contribution of >60% in both cases.

1. Introduction

In addition to the conventional applications of activated carbon, such as adsorbent materials [1,2,3], removal of heavy metals [4,5], electrochemical capacitors [6,7], energy storage [8,9] and catalyst carriers [10,11], ultrafine activated carbon can be applied in the pharmaceutical field as a negative carrier for the slow release of drugs [12,13], or removing facial impurities, detoxifying, and relieving inflammation [14,15]. Xu [16] used ultra-fine coal-based activated carbon (UCAC) obtained by grinding granular coal-based activated carbon with filter water, and achieved a total organic carbon removal rate of 82%, which was a 50% increase over coal-based activated carbon (CAC). Granular activated carbon (40 μm) was ball-milled to produce ultra-fine activated carbon with a particle size of about 0.72 μm, which was used to adsorb endocrine disruptors, pharmaceuticals, and personal care products in the drinking water [17]. Yener et al. [18] obtained a powdered activated carbon and applied it to eradicate MB with maximum removal capacities of 91 mg/g. Li et al. [19] obtained an innovative coal-based mesoporous activated carbon and adsorption capacities (120 min) of MB was 251.8 mg/g.
With the rapid development of computer technology, molecular simulation (MS) has become a powerful tool for studying the structure and behavior of molecules. In recent years, quantum mechanics methods and molecular dynamics methods have been widely used in chemistry, biology, materials, medicine, food, and other fields [20,21,22,23]. Furthermore, the interaction mechanism between the adsorbent and adsorbate [24], the analysis of experimental results at the molecular level, and the forces acting on the adsorption mechanism [25] could be revealed by MS. The adsorption of acetone on modified activated carbon by setting different molar ratios of carbonyl, carboxyl, and hydroxyl groups were calculated using MS, and the results showed the diffusion coefficient of acetone molecules in the pore gradually decreased with the increase of carbonyl and carboxyl groups [26]. Huang et al. [27] reported that the adsorption of methylene blue (MB) molecules on the coal surface was due to the polar interaction between the methyl group of MB and the hydrophilic sites on the coal surface by using MS. Bergaoui et al. [28] investigated that the van der Waals forces played an important role in the adsorption process of MB on organic bentonite using MS. Moreover, the single-layer graphite sheets or multi-layer graphite sheets models were used to simulate activated carbon [29,30].
Nowadays, there are fewer studies on the adsorption of MB by UCACs using MS. In this paper, two UCACs were obtained by two different methods, which were used to adsorb MB from water. The UCAC molecular models were constructed to simulate the adsorption of MB in water. In order to simplify the simulation process, two oxygen-containing functional groups-hydroxyl and carboxyl groups, were added. The results could provide useful references for the development of new-type coal-based carbon adsorbent materials as well as for the insights of the adsorption mechanism of MB on UCAC.

2. Materials and Methods

2.1. Materials

Granulated anthracite (0.2–0.3 mm) obtained from Ningxia province were used as raw materials for preparing UCACnew and UCACcm. The UCACcm was obtained by grinding granular activated carbon according to the conventional chemical method [31]. The UCACnew was obtained by carbonized and activated ultrafine precursor under nitrogen, which was prepared first by planetary ball mill grinding and blending the anthracite and KOH.
The UCACnew and UCACcm were prepared by tube furnace (tube diameter 20 mm, max. heating temperature 1100 °C) under the same charring and activation conditions, i.e., a heating rate of 7 °C/min, a charring temperature of 650 °C, a charring time of 2 h, an activation temperature of 850 °C, and an activation time of 1.5 h. The addition of KOH was also the same.

2.2. Particle Size Distribution and Pore Structure Measurement

Both of UCACnew and UCACcm were ground in an agate mortar and dispersed in the deionized water. The particle size distribution (PSD) tests were performed by particle size analyzer (SALD-7101, Shimadzu corporation, Japan) after water washing and acid washing for neutralization. The specific surface area (SSA), pore volume, and pore size distribution of UCACs were characterized by the BET surface area and porosity analyzer (V-Sorb X800, Gold APP Instruments Corporation, Beijing, China).

2.3. Preparation of MB Standard Solution and Adsorption Test

A certain amount of MB was placed in a vacuum oven (DGX-9073B-2, Fuma Laboratory Instrument Co., Ltd. Shanghai, China) for 24 h. The dried MB (0.500 g) was placed in a 1000 mL volumetric flask, while the volumetric flask was filled up by adding deionized water. Then the standard solution with a concentration of 0.5 mg/mL was prepared. The standard solution was oscillated at 200 rpm for about 1 h in the constant temperature (35 °C) incubator shaker (ZQTY-70, Zhichu Instrument Co., Ltd. Shanghai, China) to make the solution homogeneous.
The different concentrations (0, 1, 2.5, 5, 7.5, 10, 12.5, 15 mg/L) of MB solutions were prepared by the standard solution. The different concentration of MB was measured by UV-visible spectrophotometer (UV1800PC, Mapada Instruments Co., Ltd., Shanghai, China) at 664 nm [32], which is the maximum absorption peak of MB. The absorbance values of different concentrations of standard MB solutions at this point were plotted in Figure 1. The linear fitting was obtained with the correlation coefficient R2 = 0.9996 between the concentration ω of MB solution and the absorbance A as Equation (1).
ω = 14.2987 × A
The UCACnew and UCACcm (0.02 g) were added in two beakers, which captained the same MB solution (100 mL, 150 mg/L). Then, the beakers were swayed and placed in the constant temperature incubator shaker (35 °C), shaken at 200 rpm. After that, 5 mL of the obtained solutions were taken at the given time (20 min) interval, and were centrifuged at 2000 rpm for 3 min in the centrifugal machine. The absorbance of supernatant solutions was measured by UV-visible spectrophotometer, and the concentration was obtained by comparing the A values to the standard curve. Samples were taken and measured every 20 min for three times. Dilutions were performed where necessary to bring the analyte solutions within the calibration range. The adsorption amount (qe, mg MB/g UCAC) was calculated according to the Equation (2) [32,33].
q e = C 0 C t V M
where C0 and Ct (mg/L) are the MB concentration in the reaction solution before and after adsorption, respectively; V (L) is the solution volume; and M (g) is the amount of the adsorbent.

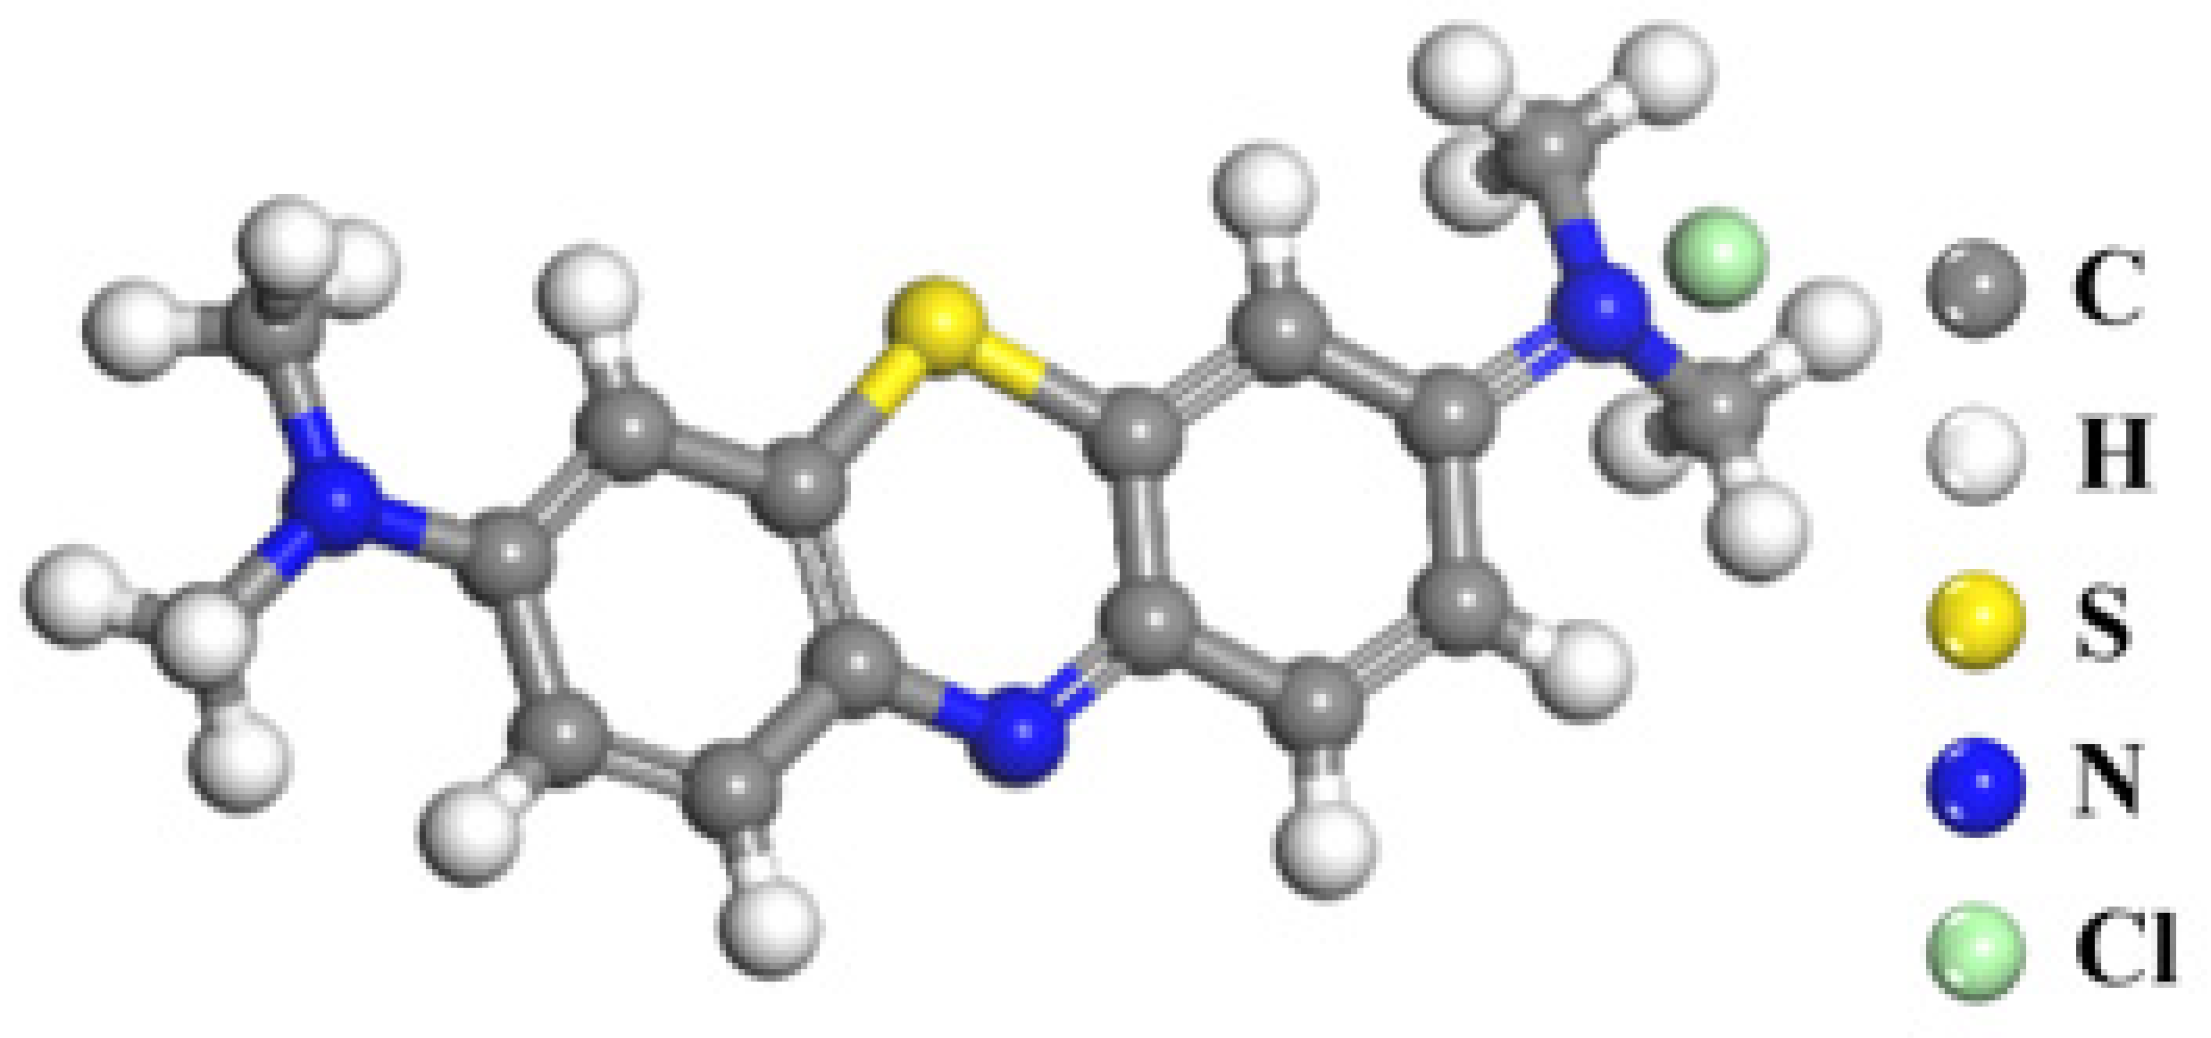
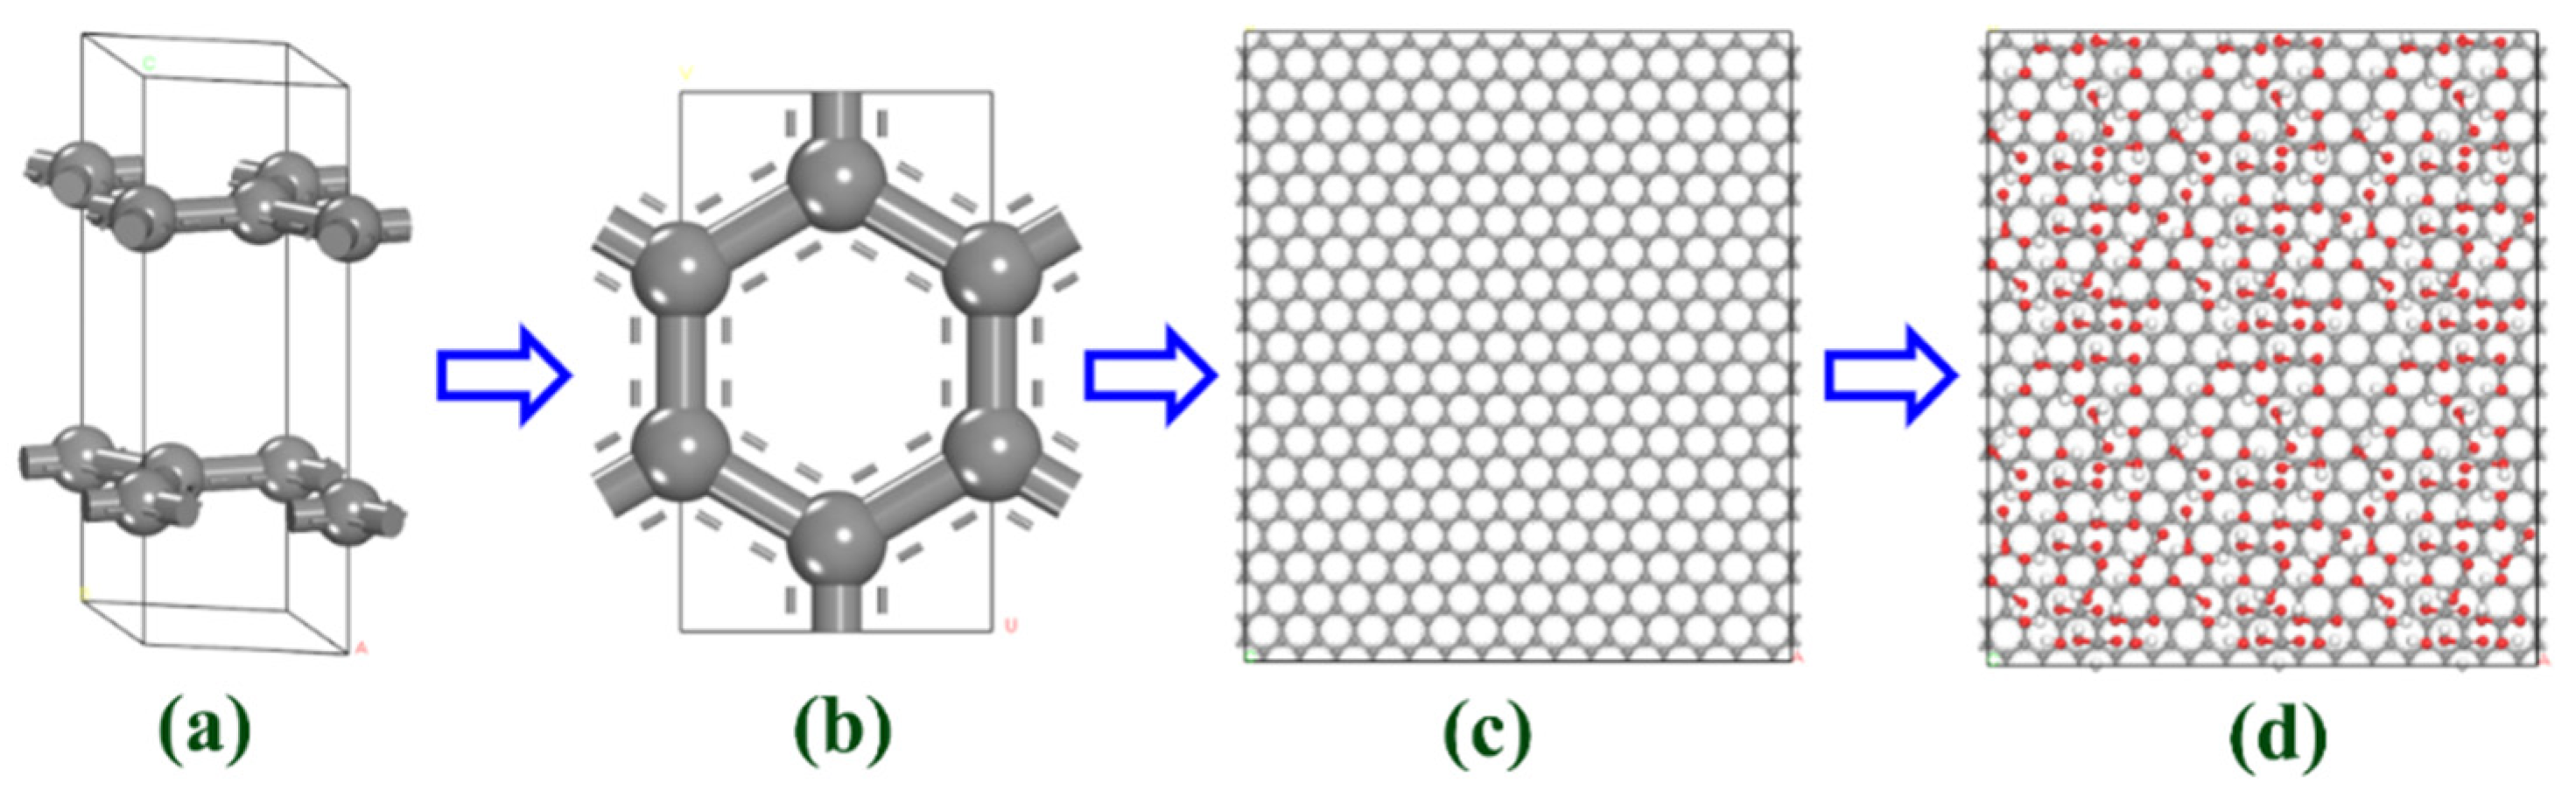
2.4. Molecular Simulation Methods

The MB and UCAC models were constructed using the Materials Visualizer module in MS 8.0. The UCAC model was simplified into a slit pore model [26] formed by parallel graphite sheets. The MB molecular model was constructed based on the molecular structural formula, as shown in Figure 2. MB was usually depicted as salt, with negative charge on chloride, and positive charge on =S− part of the molecule. The newly constructed model was geometrically optimized due to its high energy and unstable structure. Based on the energy minimization principle, the geometry optimization of MB molecules was performed using the DMol3 module.
The electron density was determined by the sum of squares of the individual atomic orbitals and was converted by the Schrödinger equation [34], where the potential energy term calculus has no way to get an exact solution mathematically. In this paper, the Generalized Gradient Approximation (GGA)–Perdew–Burke–Enzerhof (PBE) generalized function was chosen for the treatment. GGA–PBE has a strong physical background and is mainly used in solid state calculations [35]. Due to its reliable numerical computational performance, it is often used in density generalized theory (DFT) [36]. The relativistic effects of electrons inside the nucleus were important [37], and the calculations were corrected by the density functional theory semi-core pseudopots (DSPP). The relevant calculation parameters used are shown in Table 1 (Ha was the energy units, 1 Ha = 27.211396 eV).
Starting from graphite crystals [38], the UCAC model surface was first constructed. The construction process of UCAC model was shown in Figure 3.
The surfaces were constructed and combined. The total pore volumes were calculated to obtain different layer spacing by Equation (3) [39] (UCACcm: 13.80 Å; UACAnew: 26.80 Å). The bilayer models with different dc were used to simulate UCAC with different total pore volumes (as shown in Figure 4).
V t = L × H × d c × N a ÷ M e
where L is the length of the carbon atomic surface network, Å; H is the width, Å; dc is the layer spacing, Å; Na is the Avogadro constant, Na = 6.022 × 10²³ mol−1; Me is the molecular weight of a single cell, Da.
The geometry optimization, subsequent adsorption, and molecular dynamics simulations of UCAC model were based on molecular mechanics. The parameters related to the energy calculation involved in the molecular mechanics simulations in this paper are shown in Table 2. The COMPASS (condensed-phase optimized molecular potentials for atomistic simulation studies) force field is a molecular force field that can accurately predict molecular structure by ab initio algorithm calculation, which has the advantages of high accuracy, but only few types of atoms and functions can be calculated [40]. The COMPASS II force field combines the results of quantum mechanical calculations to further improve the COMPASS force field, which not only has higher accuracy but also covers a wider range [41]. Ewald Coulomb’s summation method is suitable for systems with large spatial potential differences.
Sorption module based on the GC-MC principle was used for the simulation of adsorption process. Geometrically optimized MB molecule was set as sorbate. Fixed pressure mode was used in the simulation, and the adsorption temperature and pressure were set to 308 K and 100 kPa, respectively (i.e., laboratory adsorption test temperature and pressure). The Monte Carlo sampling method was set to “Metropolis”. A total of 1 × 10⁶ steps were conducted for the simulation, and the parameters related to energy calculation are given in Table 2.
The hydroxyl and carboxyl groups were constructed as shown in Figure 5. The Forcite module of MS software was used to perform molecular dynamics simulations. The coefficient setting was constant-volume/constant-temperature dynamics (NVT), which is a simplified expression of the stability distribution and is most suitable for calculating the macroscopic properties of substances in adsorption equilibrium [39]. The initial velocity was Boltzmann random distribution. The simulation temperature was at 308 K. The time step was 1 fs. The total simulation time was 500 ps, and the resultant configuration was output every 1 ps for a total of 501 frames (including the first frame). For the molecular dynamics simulations, the relevant parameters for the energy calculations were set as described in Table 2. The system equilibrium was analyzed after the molecular dynamics calculation. The adsorption energy and its contribution were calculated by the equilibrium configuration.

3. Results and Discussion

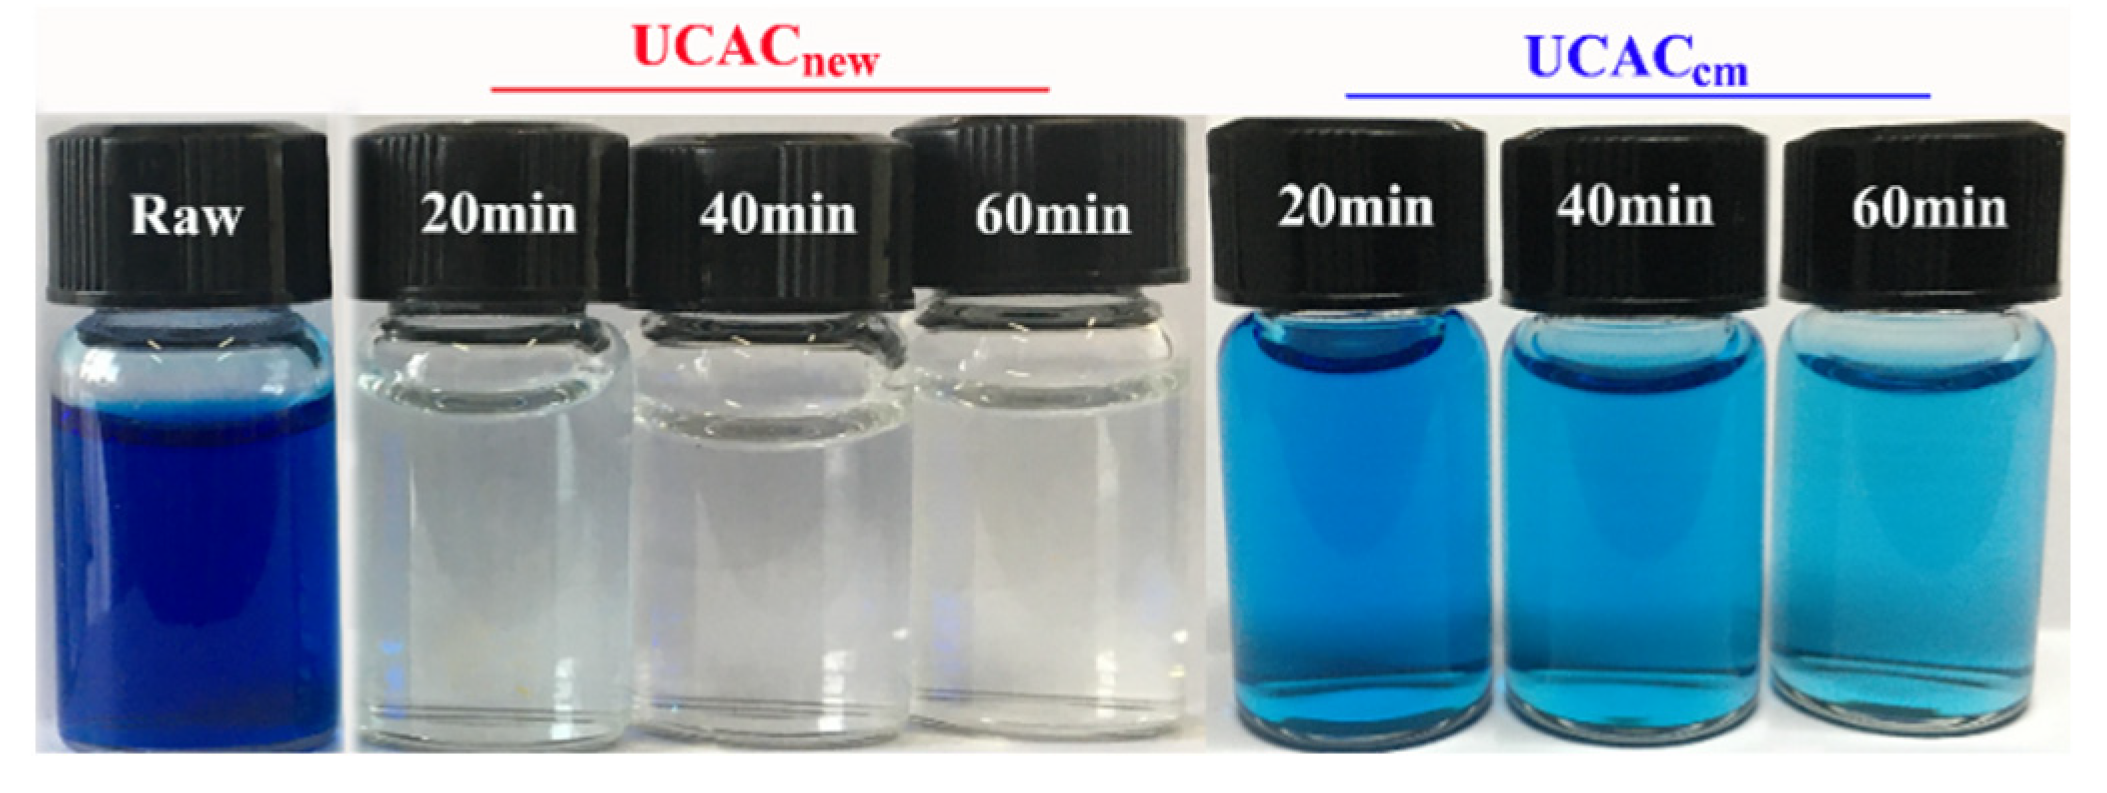
3.1. Adsorption Test Results

The MB adsorption results of UCACnew and UCACcm are shown in Figure 6. Most of the MB was removed in 20 min for the UCACnew. From 20 to 60 min, the adsorption amounts of the UCACnew were 740.63, 743.57, and 746.95 mg/g, and the removal rates were 98.75%, 99.14%, and 99.59%. The adsorption amounts of the UCACcm were 597.14, 623.88, and 652.77 mg/g, and the removal rates were 79.62%, 83.18%, and 87.04%, respectively. The adsorption amounts difference between UCACnew and UCACcm was 94.08 mg/g at 60 min. Thus, the adsorption capacity of UCACnew was larger than that of UCACcm.

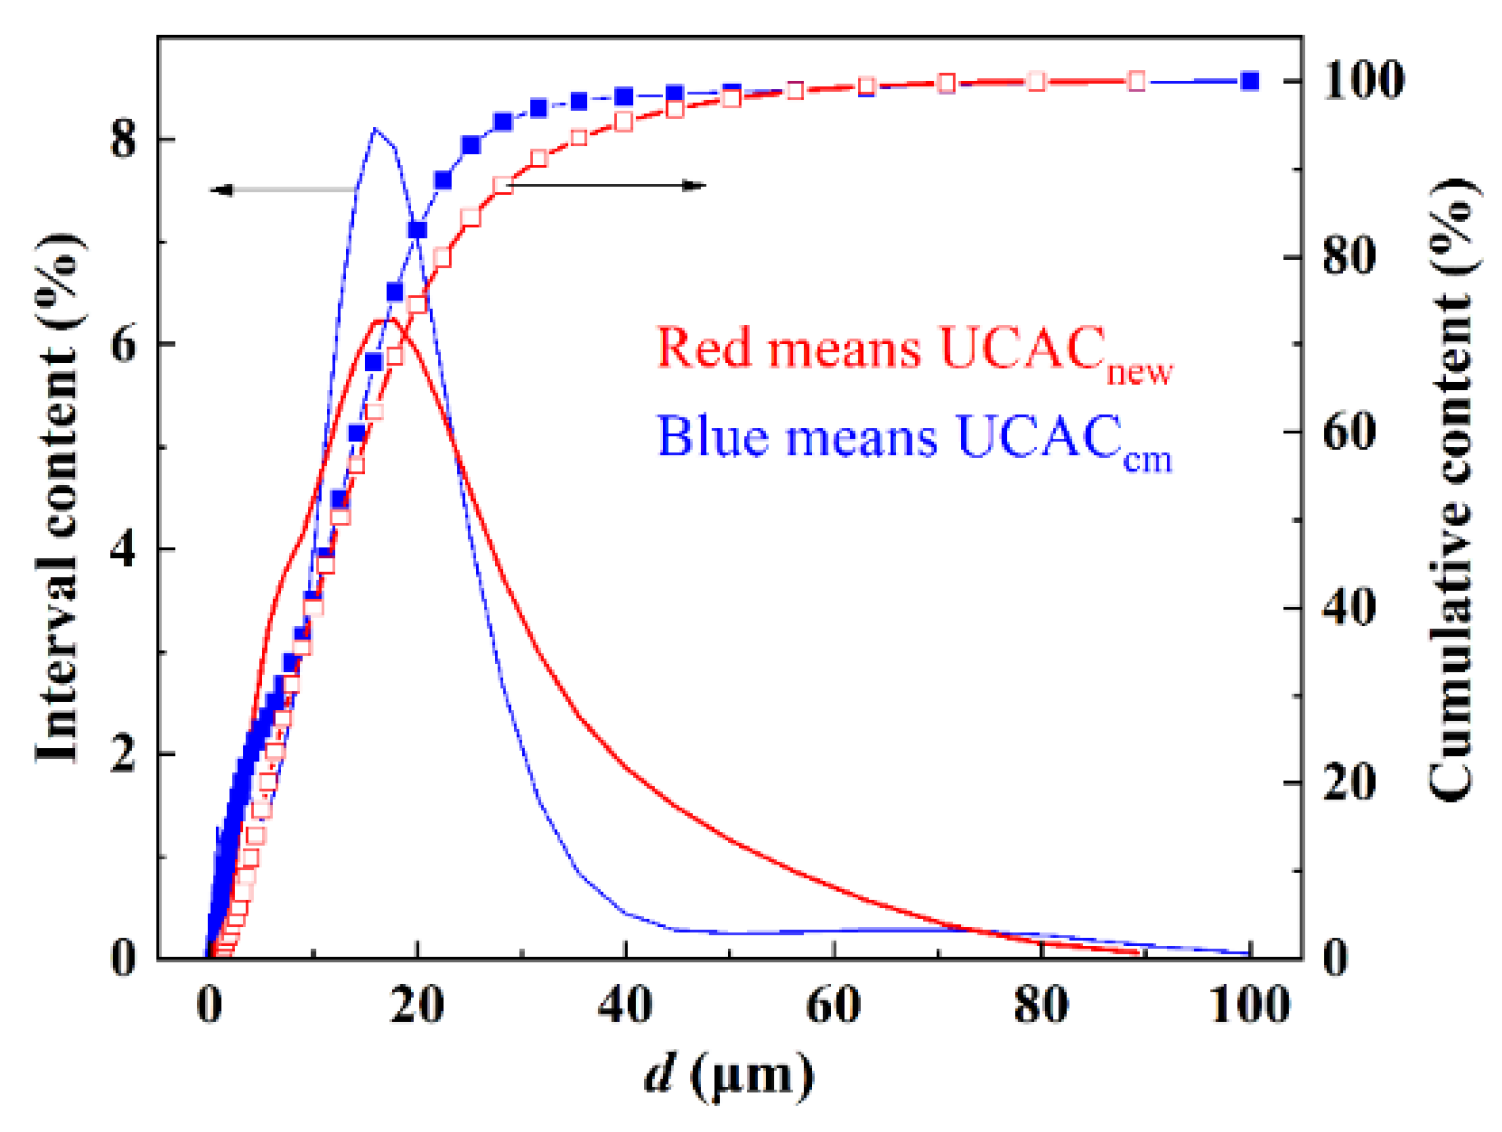
3.2. PSD and Pore Structure

The PSD of UCACnew and UCACcm is shown in Figure 7. It can be seen that the PSD of both UCACnew and UCACcm showed an overall eccentric distribution, with the majority of fine particle size. The d50 and dmax of the UCACnew were 12.54 μm and 89.22 μm, respectively. About 39.96% of the particles were below 10 μm. The d50 and dmax of the UCACcm was 12.10 μm and 100.1 μm, respectively. Moreover, 40.82% of the of particles were below 10 μm. Obviously, the PSD difference between UCACnew and UCACcm was negligible. The granular activated carbon prepared by conventional method was easy to be crushed because they were rich in pores. When the particles were crushed, a large number of ultrafine particles were produced by stripping. Due to the poor mobility and easy agglomeration of particles, some particles were not fully crushed, resulting in a high content of large particles.
The N2 adsorption–desorption isotherm of UCACnew and UCACcm at 77 K is shown in Figure 8a, and the corresponding pore size distribution of UCACnew and UCACcm displaced type IV isotherm from desorption according to the International Union of Pure and Applied Chemistry system [42]. The hysteresis loop area of UCACnew was larger than that of UCACcm, indicating the presence of a larger number of mesopores and micropores. As shown in Figure 8b,c, most of the pores in UCACnew had pore diameters in the range of 2–10 nm, and the integral pore area of mesopores of 2–10 nm accounted for the largest percentage. The differential pore volume of pores above 10 nm was smaller, but the integral pore volume share of this part of the pores was larger. UCACcm had a larger percentage of the integral pore area for mesopores below 5 nm and a larger percentage of the integral pore volume for pores below 4 nm. As can be seen in Figure 8d, the micropore pore size of UCACnew and UCACcm was mainly concentrated below 1 nm.
The observed SSA, total pore volume (Vt), total micropore volume (VSF), average pore size (P), average mesoporous pore size (PBJH), and average micropore pore size (PSF) of both UCACnew and UCACcm are given in Table 3.

3.3. Simulation Results

The energy changes during the optimization of the MB model are shown in Figure 9. It can be seen that by the 10th step of the optimization, the energy had basically ceased to change and gradually stabilized.
The adsorption process of MB molecules on the UCAC surface was necessarily sensitive to the charge nature of the surface, so the optimized electrostatic potential diagram of MB molecule was analyzed in Figure 10. It indicated the charge positivity and numerical magnitude of different regions with different colors, which could visualize the charge distribution characteristics on the MB molecule. The negative charge was concentrated on Cl ions. The positive charge was mostly concentrated on H ions of methyl. In addition, it was calculated that the MB molecule occupied a volume of 301.0 Å3 and a surface area of 307.4 Å2.
The model energy changed during the geometric optimization of the bilayer model are shown in Figure 11. The energy was basically stable after the 40th step of optimization. Probably because the initial placement of UCACnew functional groups was messy, which led to more steps of its final optimization.
The adsorption amounts of the UCACnew and UCACcm models obtained from GC-MC simulations are shown in Table 4. The GC-MC simulation method could qualitatively reflect the strength of the MB adsorption capacity of the UCACnew and UCACcm models. The size patterns presented by the simulation results matched well with the experimental measurements. Compared to the experimental values, the results of GC-MC simulations were all larger, because the UCAC models were constructed according to the total pore volume. In the actual adsorption process, due to the larger MB molecules, the pore channels with smaller pore size cannot provide enough space to accommodate the adsorbed MB molecules [43,44,45]. Thus, the measured values were smaller than the simulated values.
The adsorption density and adsorption sites are shown in Figure 12a,b. It can be seen that the adsorbed MB molecules distributed unevenly. The actual adsorption configuration is shown in Figure 12c,d. The density of MB near the functional groups of UCAC was higher, and the adsorption amount in this region was large. In the pore hollow region (as black dashed frame in the figure), the density of MB was small, and the adsorption amount in this region was small.
The relative concentration of adsorption is shown in Figure 13. The relative concentration of MB had a peak near 6 Å on the surface of UCACnew and UCACcm models, with smaller values in the pore hollow region. Compared to UCACcm, there was a step in the adsorption concentration of MB molecules on the UCACnew surface. The adsorption concentration in the pore hollow region of UCACcm was about 1/3 of the peak and that of UCACnew was 2/5.

3.4. Effect of Functional Groups

The introduction of oxygen-containing functional groups on the surface of UCAC changed its charge properties, so it is necessary to analyze the functional group charge distribution first. The charge distribution of hydroxyl and carboxyl groups is shown in Figure 14. The vicinity of H and O atom showed strong positive and negative charge, respectively, which was the largest region of positive and negative charge in the whole model. MB, a cationic dye, could be adsorbed by the electrostatic force interaction onto the negatively charged UCAC surface [46].
To ensure the reliability of the results, the equilibrium of the system was determined before the results. The forcite dynamics temperature and energies (potential energy, kinetic energy, non-bond energy and total energy) fluctuated within a narrow range after about 100 ps, indicating that the system had reached equilibrium. The configuration of the system after equilibrium could be used for the subsequent results analysis.
The calculated equilibrium adsorption configurations of different functional group models are shown in Figure 15. The adsorption energy was calculated by using the conformation of the last 100 frames after the adsorption equilibrium, and the energy contribution was analyzed. The adsorption energies and adsorption force contributions of the two functional groups to MB were shown in Table 5. The values of adsorption energy were both negative, indicating that both hydroxyl and carboxyl groups had adsorption on MB molecules and were spontaneous exothermic processes. The adsorption energy of the carboxyl model was more negative in value, which indicated that it had a stronger adsorption effect on MB molecules. The van der Waals forces were the dominant forces in the adsorption process, contributing more than 60% in both models. In comparison, the contribution of electrostatic force of the carboxyl model was greater. This was probably related to the presence of two O atoms in the carboxyl group, which carries a larger negative electric region.

4. Conclusions

UCACnew and UCACcm were obtained by two different methods. The differences in adsorption behavior of MB, PSD and pore structure of UCACnew and UCACcm were analyzed respectively, and the adsorption properties of UCACnew and UCACcm were verified by molecular simulation. The effect of hydroxyl and carboxyl functional groups on the MB molecules was explored at microcosmic level. The results showed that the MB adsorption amount by UCACnew was larger than that of UCACcm. The adsorption size pattern presented by the molecular simulation results was consistent with the experimental measurements. The peak adsorption concentration occurred near 6 Å on the pore surface for the UCACnew and UCACcm models. The adsorption concentration value was small in the hollow region of the pore, about 1/3 to 2/5 of the peak. Furthermore, both hydroxyl and carboxyl groups had effects on the adsorption of MB molecules, and the effect of carboxyl group was stronger. The van der Waals forces played a dominant role in the adsorption process. Compared with the hydroxyl model, the carboxyl model had a larger proportion of contribution of electrostatic force in the adsorption of MB molecules.

Author Contributions

Conceptualization, C.W. and H.Z.; data curation, Z.Z.; formal analysis, Z.Z.; investigation, Z.Z.; methodology, J.Z. and Y.L.; supervision, Z.Z.; validation, Z.Z.; visualization, Z.Z.; writing—original draft, Z.Z. and H.S.; writing—review and editing, L.S. and H.S. All authors have read and agreed to the published version of the manuscript.

Funding

This work was supported by the National Natural Science Foundation of China (No. 52074014); the National Natural Science Foundation of Anhui Province (No. 1708085QE128); the National Natural Science Foundation of Shandong Province (No. ZR2021ME100) and Foundation of State Key Laboratory of High-efficiency Utilization of Coal and Green Chemical Engineering (Grant No. 2021-K19).

Institutional Review Board Statement

Not applicable.

Informed Consent Statement

Not applicable.

Data Availability Statement

The data presented in this study are available on request from the corresponding author. The data are not publicly available due to privacy.

Acknowledgments

We are grateful to the Yuezhilan Studio for doing the numerical calculations in this paper.

Conflicts of Interest

The authors declare no conflict of interest.

References

  1. Ahmed, R.; Liu, G.; Yousaf, B.; Abbas, Q.; Ullah, H.; Ali, M.U. Recent advances in carbon-based renewable adsorbent for selective carbon dioxide capture and separation-A review. J. Clean. Prod. 2020, 242, 118409. [Google Scholar] [CrossRef]
  2. Kosek, K.; Luczkiewicz, A.; Fudala-Książek, S.; Jankowska, K.; Szopińska, M.; Svahn, O.; Tränckner, J.; Kaiser, A.; Langas, V.; Björklund, E. Implementation of advanced micropollutants removal technologies in wastewater treatment plants (WWTPs)—Examples and challenges based on selected EU countries. Environ. Sci. Policy 2020, 112, 213–226. [Google Scholar] [CrossRef]
  3. Rocha, L.S.; Pereira, D.; Sousa, É.; Otero, M.; Esteves, V.I.; Calisto, V. Recent advances on the development and application of magnetic activated carbon and char for the removal of pharmaceutical compounds from waters: A review. Sci. Total Environ. 2020, 718, 137272. [Google Scholar] [CrossRef]
  4. Mariana, M.; HPS, A.K.; Mistar, E.M.; Yahya, E.B.; Alfatah, T.; Danish, M.; Amayreh, M. Recent advances in activated carbon modification techniques for enhanced heavy metal adsorption. J. Water Process Eng. 2021, 43, 102221. [Google Scholar] [CrossRef]
  5. Sultana, M.; Rownok, M.H.; Sabrin, M.; Rahaman, M.H.; Alam, S.M.N. A review on experimental chemically modified activated carbon to enhance dye and heavy metals adsorption. Clean. Eng. Technol. 2022, 6, 100382. [Google Scholar] [CrossRef]
  6. Dubey, P.; Shrivastav, V.; Maheshwari, P.H.; Sundriyal, S. Recent advances in biomass derived activated carbon electrodes for hybrid electrochemical capacitor applications: Challenges and opportunities. Carbon 2020, 170, 1–29. [Google Scholar] [CrossRef]
  7. Yang, S.; Nahar Fatema, K.; Kim, I.J.; Ryu, J.; Eun Shim, S.; Oh, W.C. Novel preparation and high electrical performance effect of Mn-doped ultra-high surface area activated carbon (USAC) as an additive for Ni hybrid capacitors. Adv. Powder Technol. 2021, 32, 1116–1126. [Google Scholar] [CrossRef]
  8. Czarna-Juszkiewicz, D.; Cader, J.; Wdowin, M. From coal ashes to solid sorbents for hydrogen storage. J. Clean. Prod. 2020, 270, 122355. [Google Scholar] [CrossRef]
  9. Doğan, M.; Sabaz, P.; Bicil, Z.; Koçer Kizilduman, B.; Turhan, Y. Activated carbon synthesis from tangerine peel and its use in hydrogen storage. J. Energy Inst. 2020, 93, 2176–2185. [Google Scholar] [CrossRef]
  10. Matos, J.; Poon, P.S.; Montaña, R.; Romero, R.; Gonçalves, G.R.; Schettino, M.A.; Passamani, E.C.; Freitas, J.C.C. Photocatalytic activity of P-Fe/activated carbon nanocomposites under artificial solar irradiation. Catal. Today 2020, 356, 226–240. [Google Scholar] [CrossRef]
  11. Higai, D.; Lee, C.; Lang, J.; Qian, E.W. Saccharification of cellulose using biomass-derived activated carbon-based solid acid catalysts. Fuel Processing Technol. 2021, 215, 106738. [Google Scholar] [CrossRef]
  12. Jianyong, X.; Xiaofang, Z.; Lijuan, Z.; Ren, T. Clinical application of nano-carbon particles for radical gastrectomy. Pract. J. Cancer 2018, 33, 852–855. [Google Scholar]
  13. Jinbiao, W.; Jianchun, J.; Kang, S.; Xinping, X. Research progress on activated carbon as carriers for sustained release of pharmaceuticals. New Chem. Mater. 2014, 42, 4–7. [Google Scholar]
  14. Sanchez, N.; Fayne, R.; Burroway, B. Charcoal: An ancient material with a new face. Clin. Dermatol. 2020, 38, 262–264. [Google Scholar] [CrossRef]
  15. Hammani, H.; Laghrib, F.; Farahi, A.; Lahrich, S.; El Ouafy, T.; Aboulkas, A.; El Harfi, K.; El Mhammedi, M.A. Preparation of activated carbon from date stones as a catalyst to the reactivity of hydroquinone: Application in skin whitening cosmetics samples. J. Sci. Adv. Mater. Devices 2019, 4, 451–458. [Google Scholar] [CrossRef]
  16. Xu, J. Microfiltration Feed Water Pretreatment with Ultrafine Powdered Activated Carbon. Available online: https://xueshu.baidu.com/usercenter/paper/show?paperid=1g000gh03k180xa0j26d0pg0bs565049&site=xueshu_se (accessed on 9 January 2022).
  17. Wang, Y.; Rao, G.Y.; Hu, J.Y. Adsorption of EDCs/PPCPs from drinking water by submicron-sized powdered activated carbon. Water Sci. Technol. Water Supply 2011, 11, 711–718. [Google Scholar] [CrossRef]
  18. Yoo, J.; Winogradoff, D.; Aksimentiev, A. Molecular dynamics simulations of DNA–DNA and DNA–protein interactions. Curr. Opin. Struct. Biol. 2020, 64, 88–96. [Google Scholar] [CrossRef] [PubMed]
  19. Srivastava, I.; Kotia, A.; Ghosh, S.K.; Ali, M.K.A. Recent advances of molecular dynamics simulations in nanotribology. J. Mol. Liq. 2021, 335, 116154. [Google Scholar] [CrossRef]
  20. Yener, J.; Kopac, T.; Dogu, G.; Dogu, T. Dynamic analysis of sorption of Methylene Blue dye on granular and powdered activated carbon. Chem. Eng. J. 2008, 144, 400–406. [Google Scholar] [CrossRef]
  21. Li, W.-G.; Gong, X.-J.; Wang, K.; Zhang, X.-R.; Fan, W.-B. Adsorption characteristics of arsenic from micro-polluted water by an innovative coal-based mesoporous activated carbon. Bioresour. Technol. 2014, 165, 166–173. [Google Scholar] [CrossRef]
  22. Sohraby, F.; Aryapour, H. Rational drug repurposing for cancer by inclusion of the unbiased molecular dynamics simulation in the structure-based virtual screening approach: Challenges and breakthroughs. Semin. Cancer Biol. 2021, 68, 249–257. [Google Scholar] [CrossRef]
  23. Nian, B.; Xu, Y.J.; Liu, Y. Molecular dynamics simulation for mechanism revelation of the safety and nutrition of lipids and derivatives in food: State of the art. Food Res. Int. 2021, 145, 110399. [Google Scholar] [CrossRef] [PubMed]
  24. Xia, Y.; Yang, Z.; Zhang, R.; Xing, Y.; Gui, X. Enhancement of the surface hydrophobicity of low-rank coal by adsorbing DTAB: An experimental and molecular dynamics simulation study. Fuel 2019, 239, 145–152. [Google Scholar] [CrossRef]
  25. Mirzaee, S.A.; Bayati, B.; Valizadeh, M.R.; Gomes, H.T.; Noorimotlagh, Z. Adsorption of diclofenac on mesoporous activated carbons: Physical and chemical activation, modeling with genetic programming and molecular dynamic simulation. Chem. Eng. Res. Des. 2021, 167, 116–128. [Google Scholar] [CrossRef]
  26. Yikun, Z.; Xiaoyi, L.; Junjie, C.; Yuexing, L. The dynamics simulation of acetone adsorption in the modified activated carbon pore. J. At. Mol. Phys. 2018, 35, 147–153. [Google Scholar]
  27. Huang, B.; Zhao, R.; Xu, H.; Deng, J.; Li, W.; Wang, J.; Yang, H.; Zhang, L. Adsorption of Methylene Blue on Bituminous Coal: Adsorption Mechanism and Molecular Simulation. ACS Omega 2019, 4, 14032–14039. [Google Scholar] [CrossRef] [Green Version]
  28. Bergaoui, M.; Nakhli, A.; Benguerba, Y.; Khalfaoui, M.; Erto, A.; Soetaredjo, F.E.; Ismadji, S.; Ernst, B. Novel insights into the adsorption mechanism of methylene blue onto organo-bentonite: Adsorption isotherms modeling and molecular simulation. J. Mol. Liq. 2018, 272, 697–707. [Google Scholar] [CrossRef]
  29. An, Y.; Fu, Q.; Zhang, D.; Wang, Y.; Tang, Z. Performance evaluation of activated carbon with different pore sizes and functional groups for VOC adsorption by molecular simulation. Chemosphere 2019, 227, 9–16. [Google Scholar] [CrossRef]
  30. Fu, Q.; Tanaka, H.; Miyahara, M.T.; Qin, Y.; Shen, Y.; Zhang, D. CHF3–CHClF2 Binary Competitive Adsorption Equilibria in Graphitic Slit Pores: Monte Carlo Simulations and Breakthrough Curve Experiments. Ind. Eng. Chem. Res. 2018, 57, 6440–6450. [Google Scholar] [CrossRef]
  31. Chen, T.; Liu, H.; Bie, R. Temperature rise characteristics of coal-KOH adduct under microwave heating and the properties of resultant activated carbon for catalytic methane decomposition. J. Anal. Appl. Pyrolysis 2020, 145, 104739. [Google Scholar] [CrossRef]
  32. Liu, D.; Yuan, W.; Yuan, P.; Yu, W.; Tan, D.; Liu, H.; He, H. Physical activation of diatomite-templated carbons and its effect on the adsorption of methylene blue (MB). Appl. Surf. Sci. 2013, 282, 838–843. [Google Scholar] [CrossRef]
  33. Zhang, X.; Li, Y.; Li, M.; Zheng, H.; Du, Q.; Li, H.; Wang, Y.; Wang, D.; Wang, C.; Sui, K.; et al. Removal of methylene blue from aqueous solution using high performance calcium alginate/activated carbon membrane. Int. J. Cloth. Sci. Technol. 2020, 32, 307–321. [Google Scholar] [CrossRef]
  34. Mazzone, A.M.; Morandi, V. Solution of the time-dependent, multi-particle Schrödinger equation using Monte Carlo and numerical integration. Comput. Mater. Sci. 2006, 38, 231–239. [Google Scholar] [CrossRef]
  35. Li, S.; Huang, L.; Zhang, H.; Huang, Z.; Jia, Q.; Zhang, S. Adsorption mechanism of methylene blue on oxygen-containing functional groups modified graphitic carbon spheres: Experiment and DFT study. Appl. Surf. Sci. 2021, 540, 148386. [Google Scholar] [CrossRef]
  36. Niknam, P.; Jamehbozorgi, S.; Rezvani, M.; Izadkhah, V. Understanding delivery and adsorption of Flutamide drug with ZnONS based on: Dispersion-corrected DFT calculations and MD simulations. Phys. E Low-Dimens. Syst. Nanostruct. 2022, 135, 114937. [Google Scholar] [CrossRef]
  37. González-Jiménez, R.; Nikolakopoulos, A.; Jachowicz, N.; Udías, J.M. Nuclear effects in electron-nucleus and neutrino-nucleus scattering within a relativistic quantum mechanical framework. Phys. Rev. C 2019, 100, 45501. [Google Scholar] [CrossRef]
  38. Trucano, P.; Chen, R. Structure of graphite by neutron diffraction. Nature 1975, 258, 136–137. [Google Scholar] [CrossRef]
  39. Li, S.; Song, K.; Zhao, D.; Rugarabamu, J.R.; Diao, R.; Gu, Y. Molecular simulation of benzene adsorption on different activated carbon under different temperatures. Microporous Mesoporous Mater. 2020, 302, 110220. [Google Scholar] [CrossRef]
  40. Ou, X.; Han, Q.; Dai, H.H.; Wang, J. Molecular dynamic simulations of the water absorbency of hydrogels. J. Mol. Modeling 2015, 21, 231. [Google Scholar] [CrossRef] [PubMed]
  41. Qifang, Q.; Zhou, J.; Li, L. Accuracy prediction on glass transition temperature of polystyrene with molecular dynamics simulation and experimental studies. Polym. Bull. 2020, 258, 66–72. [Google Scholar]
  42. IUPAC. Manual of symbols and terminology: Appendix 2. Part I: Colloid and surface chemistry. Pure Appl. Chem. 1972, 31, 578. [Google Scholar]
  43. Qiang, X.; Xianglan, Z.; Dingcheng, L.; Junya, C.; Jinchang, L. Directional preparation of coal-based activated carbon principles, approaches and applications. Coal Sci. Technol. 2020, 48, 1–28. [Google Scholar]
  44. Pelekani, C.; Snoeyink, V.L. Competitive adsorption between atrazine and methylene blue on activated carbon: The importance of pore size distribution. Carbon 2000, 38, 1423–1436. [Google Scholar] [CrossRef]
  45. Christina, S.; Myroslav, M.; Ihor, B.; Fedir, I.; Anatoliy, B.; Yuriy, K. Structural, magnetic and adsorption characteristics of magnetically susceptible carbon sorbents based on natural raw materials. J. Water Land Dev. 2020, 47, 160–168. [Google Scholar] [CrossRef]
  46. Mariana, M.; Mistar, E.M.; Alfatah, T.; Supardan, M.D. High-porous activated carbon derived from Myristica fragrans shell using one-step KOH activation for methylene blue adsorption. Bioresour. Technol. Rep. 2021, 16, 100845. [Google Scholar] [CrossRef]
Figure 1. Relationship between MB concentration and absorbance.
Processes 10 00290 g001
Figure 2. Molecular model of MB.
Processes 10 00290 g002
Figure 3. The construction process of UCAC model (a) constructing graphite crystals according to the data (space group P63/MMC, a = b = 2.46 Å, c = 6.80 Å, α = β = 90°; γ = 120°); (b) performing crystallographic surface cutting; (c) extending the above carbon atomic surface network; (d) adding hydroxyl and carboxyl functional groups.
Processes 10 00290 g003
Figure 4. UCAC model diagram (a) Top view; (b) Side view.
Processes 10 00290 g004
Figure 5. Model of hydroxyl and carboxyl groups. (a) Top view of hydroxyl group; (b) side view of hydroxyl group; (c) top view of carboxyl group; (d) side view of carboxyl group.
Processes 10 00290 g005
Figure 6. The adsorption results of UCACnew and UCACcm.
Processes 10 00290 g006
Figure 7. The PSD UCACnew and UCACcm.
Processes 10 00290 g007
Figure 8. The correlation curve of the pore structure: (a) isothermal adsorption curve; (b) BJH pore size distribution curve; (c) BJH pore area distribution; (d) micropore distribution.
Processes 10 00290 g008
Figure 9. Energy change during optimization of MB molecular model.
Processes 10 00290 g009
Figure 10. Molecular electrostatic potential diagram of MB.
Processes 10 00290 g010
Figure 11. Energy change during optimization of UCACnew and UCACcm models.
Processes 10 00290 g011
Figure 12. Adsorption site map and conformation diagram of the actual adsorption (a,c) UCACcm (b,d) UCACnew.
Processes 10 00290 g012
Figure 13. Distribution of relative concentration in the axial direction (a) UCACcm (b) UCACnew.
Processes 10 00290 g013
Figure 14. Electrostatic potential diagram of two functional groups (a) Hydroxyl group; (b) Carboxyl group.
Processes 10 00290 g014
Figure 15. Equilibrium adsorption conformation. (a) Hydroxyl group-top view; (b) hydroxyl group-side view; (c) carboxyl group-top view; (d) carboxyl group-side view.
Processes 10 00290 g015
Table 1. Calculation parameters set in this paper.
ParametersParameter Value
XC functionalGGA-PBE
Core treatmentDSPP
Basis setDNP
SCF convergence accuracy (Ha)1.0 × 10⁻⁶
Energy convergence accuracy (Ha)1 × 10⁻⁵
Maximum force convergence accuracy (Ha/Å)0.002
Maximum displacement convergence accuracy (Å)5 × 10⁻³
Table 2. Setting of relevant parameters for energy calculation.
Calculated ParametersSetting Result
Force fieldCOMPASS II
Charge calculation methodForcefield assigned
Van der Waals force calculation methodAtom based
Van der Waals force calculation cut-off radius (Å)12.5
Calculation method of electrostatic forceEwald
Calculation accuracy of electrostatic force (kcal/mol)1 × 10−3
Table 3. Pore structural parameters of two types of UCACs.
Sample NameUCACnewUCACcm
SSA (m2/g)1225.36713.76
Vt (cm3/g)0.990.51
VSF (cm3/g)0.520.32
P (nm)3.242.77
PBJH (nm)2.282.10
PSF (nm)0.750.71
Table 4. Simulated adsorption amounts of UCACnew and UCACcm models.
Model NameAverage Number of Adsorbed MB MoleculesMB Molecular Simulated Adsorption Capacity (mmol/g)
Simulated ValueExperimental Value
UCACcm model34.942.732.04
UCACnew model57.004.462.34
Table 5. Adsorption energy and energy contribution of hydroxyl and carboxyl groups.
Model NameAdsorption Energy
(kcal/mol)
Standard Deviation
(kcal/mol)
Contribution of Electrostatic ForceContribution of Van der Waals’ Force
Hydroxyl model−43.641.8524.84%75.16%
Carboxyl model−49.772.1536.31%63.69%
Publisher’s Note: MDPI stays neutral with regard to jurisdictional claims in published maps and institutional affiliations.

