Article

Experimental Study on Deformation and Strength Characteristics of Interbedded Sandstone with Different Interlayer Thickness under Uniaxial and Triaxial Compression

1
College of Mining Engineering, Guizhou University of Engineering Science, Bijie 551700, China
2
School of Energy and Mining, China University of Mining and Technology (Beijing), Beijing 100083, China
3
School of Energy Science and Engineering, Henan University of Technology, Jiaozuo 454000, China
*
Author to whom correspondence should be addressed.
Processes 2022, 10(2), 285; https://doi.org/10.3390/pr10020285
Submission received: 4 January 2022 / Revised: 26 January 2022 / Accepted: 27 January 2022 / Published: 31 January 2022

Abstract

:
In order to study the effect of interlayer thickness on the deformation and strength characteristics of interbedded sandstone under load, uniaxial compression and conventional triaxial compression tests were carried out on four interbedded medium-grained sandstone samples with different interlayer thickness, accounting for different proportions of the total height of the sample (5%, 10%, 15%, and 20%). The samples were from the Shendong Mining Area and investigated using an RMT-150C rock mechanics test system. Then the stress–strain curve characteristics, strength characteristics, and failure characteristics of the interbedded medium-grained sandstone with different interlayer thickness were analyzed, and the applicability of Mohr–Coulomb strength criterion and Rocker criterion to interbedded medium-grained sandstone with different interlayer thickness was evaluated. The research results show that, as the thickness of the interlayer gradually increases, the uniaxial compressive strength of the sandstone containing the interlayer first decreases and then increases; as the thickness of the interlayer increases, the elastic modulus of the sandstone containing the interlayer gradually decreases, and the peak strain increases gradually; the thickness of the interlayer has little effect on the triaxial compressive strength of the sandstone containing the interlayer. When the thickness of the interlayer is small, the deviation of the fitted uniaxial compressive strength of the Rocker strength criterion is relatively small, and the applicability is good; the prediction result of the uniaxial compressive strength of the Mohr–Coulomb strength criterion is better; for the tensile strength of the interlayer rock, the Rocker strength criterion has good applicability. The existence of the interlayer hinders the development of medium-grained sandstone cracks, but this effect is weakened with the increasing thickness of the interlayer. The research results are helpful to further reveal the movement law of overlying rocks in Shendong mining area, and provide basic parameters for related research.

1. Introduction

There are a large number of weak planes, joints, and intercalations in the coal measure strata of Boertai Coal Mine, Daliuta Coal Mine, and Bulianta Coal Mine in the Shendong Mining Area. During the scientific research project, cores of about 1000 m were collected and their lithology was statistically analyzed. It was found that there were a large number of coal measures and coal-bearing interlayers of different thickness in sandstone [1,2,3,4]. The existence of such interlayers has a significant impact on the failure mode, motion law, and force transmission mode of the overlying strata. In order to accurately and effectively understand the mechanical properties of an intercalated rock mass, it is of significant engineering practical value to study the mechanical properties of the intercalated rock mass.
To study the influence of joints within a rock mass on the mechanical properties of the rock mass, many researchers have carried out much research on the deformation characteristics, compressive strength, and failure forms of jointed rock mass through rock mass test, numerical analysis, model test, and other methods [5,6,7,8]. Xiao Weimin et al. [9] simulated a columnar jointed rock mass and analyzed its deformation and strength characteristics under conventional triaxial compression, and summarized four typical failure types of columnar jointed rock mass under triaxial compression, and discussed its failure mechanism. Wang Zihua [10] studied the uniaxial compression test and numerical simulation of a rock mass with a single joint fissure, and analyzed the effects of joint plane inclination, thickness, and length on uniaxial compressive strength. Zhang Shifei et al. [11,12] analyzed the variation law of the macromechanical properties (strength and elastic modulus) of a jointed rock mass under uniaxial compression with joint inclination by using FLAC3D numerical simulation. They believed that with the increase of the joint inclination from 0° to 90°, the middle part of the prefabricated joint gradually changed from tensile stress concentration to compressive stress concentration, and the rock bridge part gradually changed from compressive stress concentration to tensile stress concentration. Li Jiangteng et al. [13,14] tested and simulated the fracture characteristics of sandstone under cyclic loading. They concluded that the radial displacement deformation process and microcrack propagation law of the sample were related to the upper limit load ratio. Li Hongzhe et al. [15] showed through triaxial compression tests and analysis that the failure form and deformation characteristics of marble samples with natural through-going joints under different confining pressures mainly depend on the angle between the joint plane and the maximum principal stress, and that the influence of confining pressure was not obvious. Deng Huafeng and Wang Peixin [16,17,18] studied the deformation and failure characteristics of sandstone with different joint dip angles on the basis of triaxial compression tests. They found that the joint inclination angle and confining pressure had a great influence on the failure mechanism of sandstone, and that different joint inclination angles and confining pressures resulted in different deformation and failure modes of the sandstone samples, which determined the anisotropy of the deformation and strength parameters of intermittent jointed sandstone. Yang Shengqi [19] conducted monotonic and cyclic loading tests on single-jointed sandstone under different confining pressures, and reported that the peak strength of jointed sandstone samples increased with the increase of confining pressure. The evolution of the elastic modulus of the sample experienced three stages: obvious increase, sharp decrease, and stabilization after the peak.
In summary, a large number of researchers have fully studied the deformation, strength, and failure characteristics of rock during compression, based on the parameters such as joint inclination, joint penetration, and joint number. However, there are relatively few studies on the influence of interlayer thickness on the deformation and strength characteristics of sandstone. Therefore, in this paper, five interbedded samples with interlayer thicknesses of 5, 10, 15, and 20 mm were prepared, and uniaxial and triaxial compression tests on the five samples were carried out by using an RMT-150C mechanical testing machine, manufactured by the Institute of Rock and Soil Mechanics. Then the influence of interlayer thickness on uniaxial and triaxial mechanical parameters together with failure characteristics was analyzed, and the applicability of five strength criteria was evaluated. This study can provide a basis for the engineering application of interbedded sandstone.

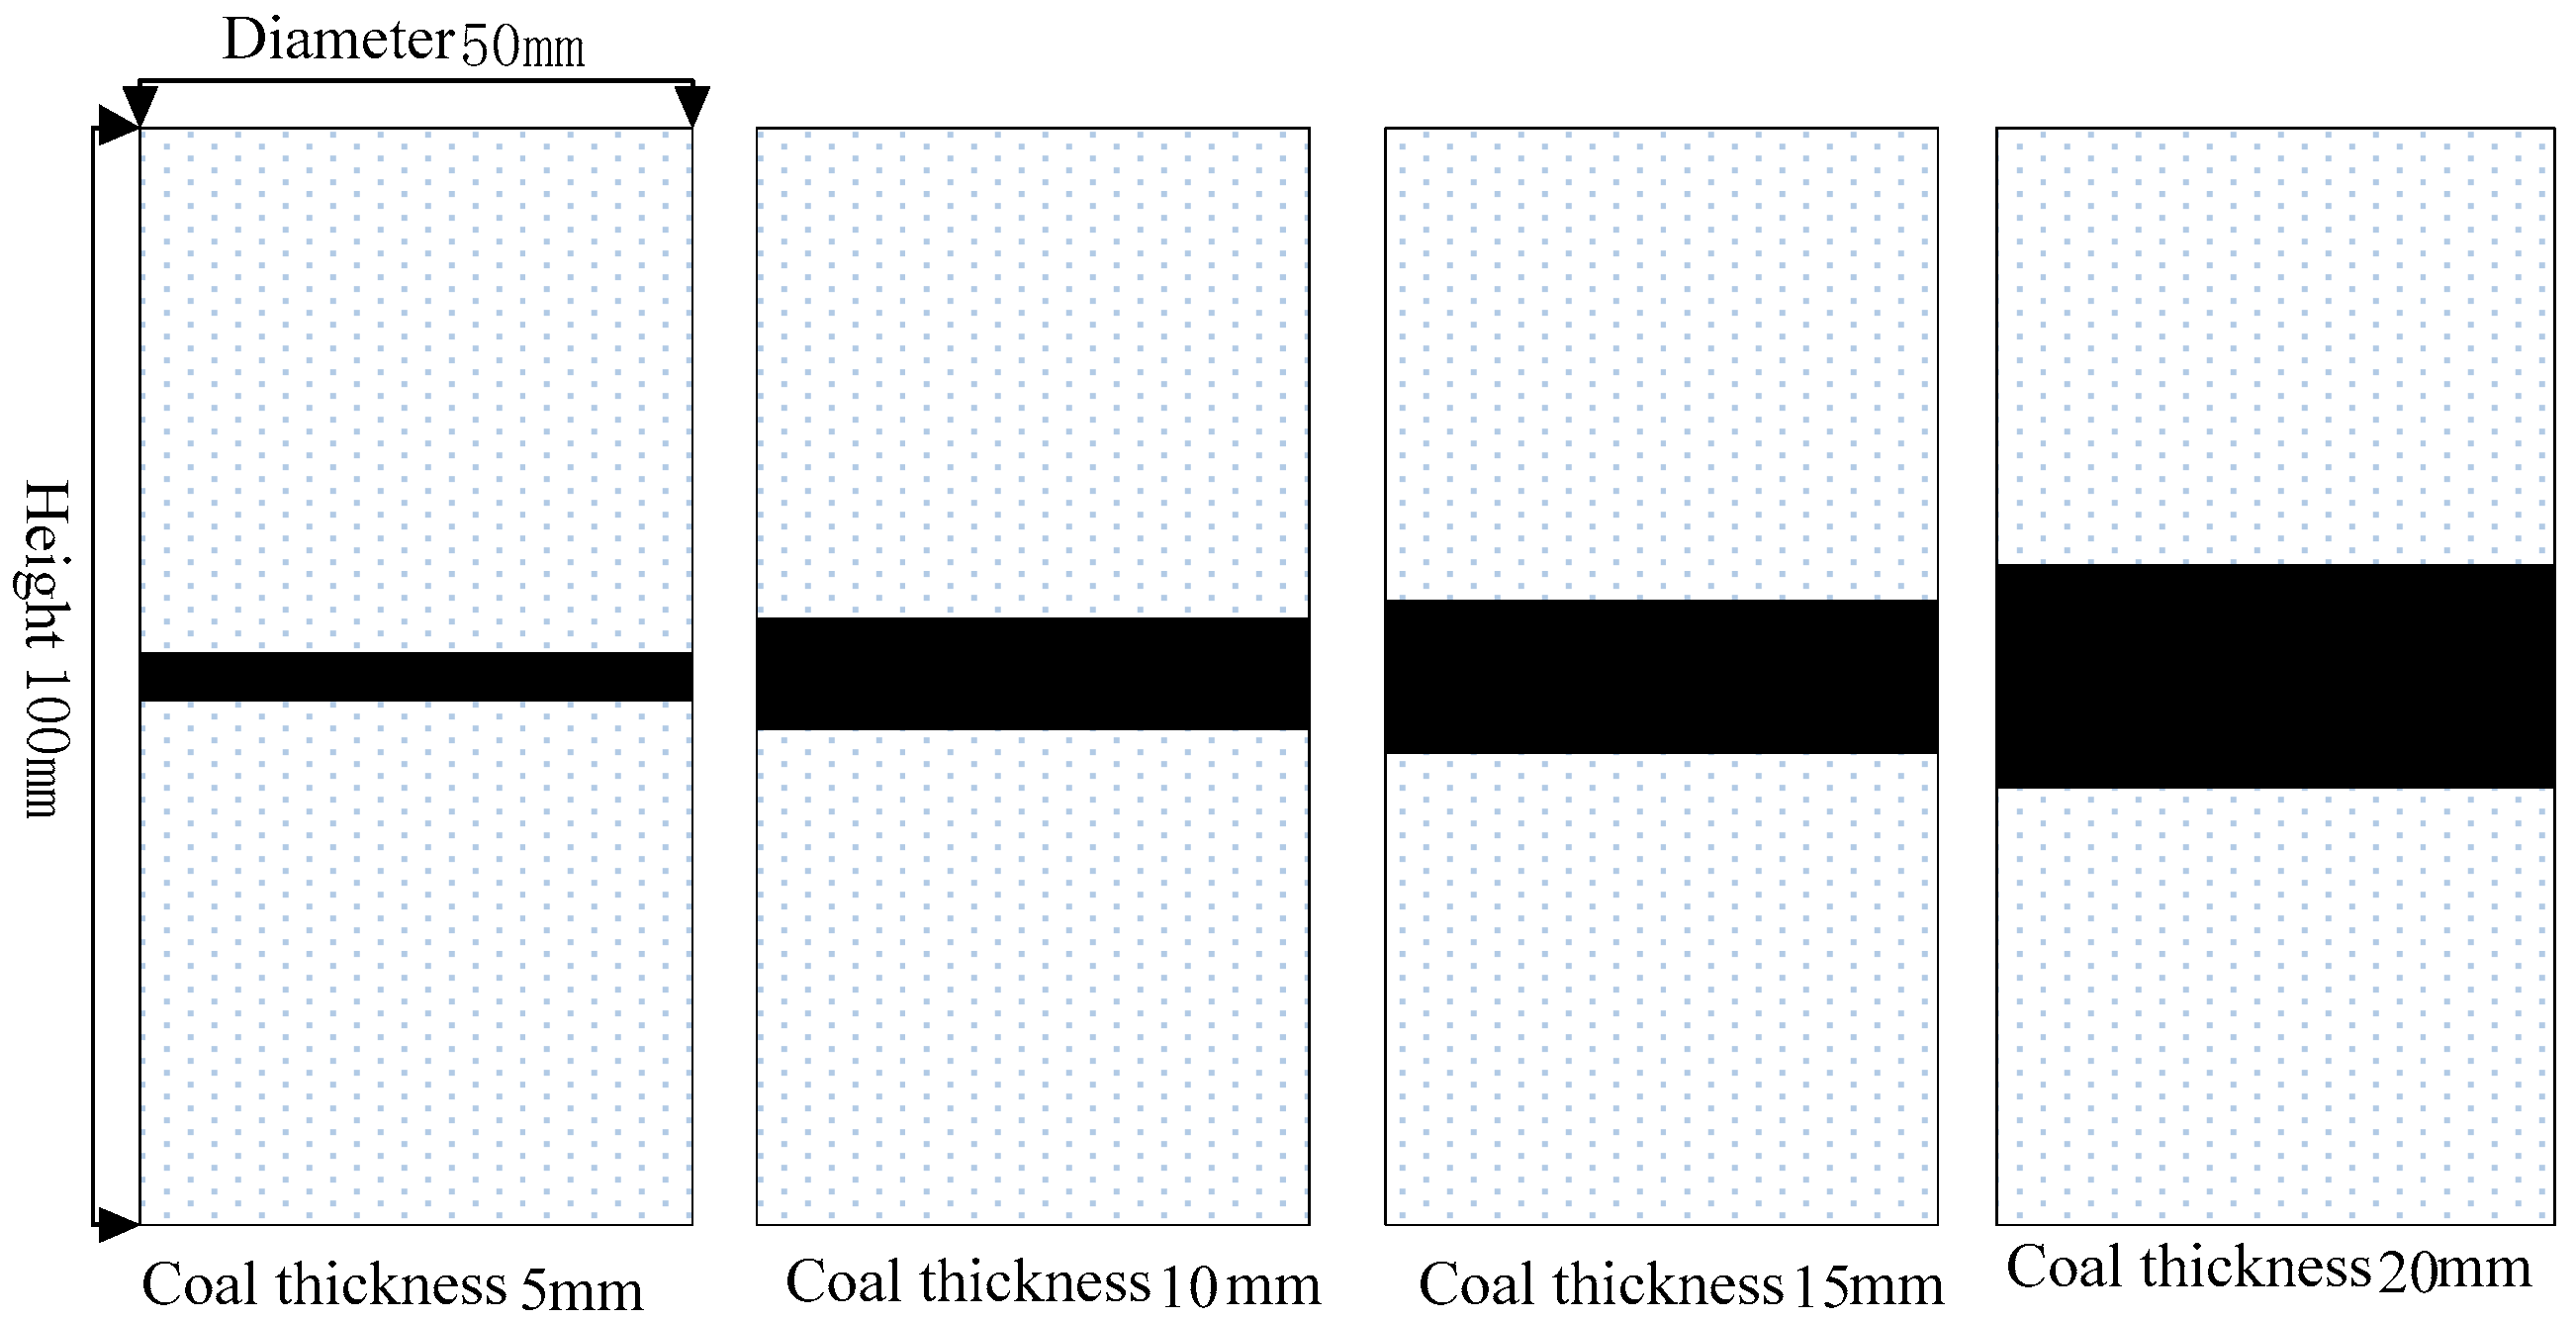
2. Characteristics of the Sandstone Samples

The medium-grained sandstone and coal samples were collected from the Bulianta Coal Mine and the Burtai Coal Mine in Ordos, Inner Mongolia. The samples were processed into standard samples with a diameter of 50 mm and a height of 100 mm according to the requirements of the specification [20]. The uniaxial compression test samples were divided into six groups, of which Group A (A1~A3) consisted of complete medium-grained sandstone samples, Group B (B1~B3), Group C (C1~C3), Group D (D1~D3), and Group E (E1~E3) were interbedded medium-grained sandstone samples with interlayer thickness accounting for 5%, 10%, 15%, and 20% of the total height of the sample, respectively. Group F (F1~F3) were coal samples. The triaxial compression samples were divided into four groups: Group SZA (SZA-1~SZA-5), Group SZB (SZB-1~SZB-5), Group SZC (SZC-1~SZC-5), and Group SZD (SZD-1~SZD-5) with five samples in each group. They were medium-grained sandstone samples with interlayer thickness accounting for 5%, 10%, 15%, and 20% of the total height of the sample, respectively. The sample scheme design is shown in Figure 1, and the physical picture is shown in Figure 2.

3. Test Method

The uniaxial and conventional triaxial compression tests of intercalated medium-grained sandstone were carried out by using an RMT-150C rock mechanics test system. Displacement control was adopted, with an axial loading rate of 0.002 mm/s and a confining pressure loading rate of 0.1 MPa/s. Conventional triaxial compression tests were carried out 20 times with the confining pressure in the range 5.0–25.0 MPa, in which 5 MPa was used for the SZA-1, SZB-1, SZC-1, and SZD-1 samples; 10 MPa was used for the SZA-2, SZB-2, SZC-2, and SZD-2 samples; 15 MPa was used for the SZA-3, SZB-3, SZC-3, and SZD-3 samples; 20 MPa was used for the SZA-4, SZB-4, SZC-4, and SZD-4 samples; and 25 MPa was used for the SZA-5, SZB-5, SZC-5, and SZD-5 samples. A hydrostatic pressure condition (σ1:σ2:σ3 = 1:1:1) was applied to the predetermined confining pressure value, and then the axial stress was continuously applied until the sample was completely destroyed. The uniaxial compression test was repeated three times, and the triaxial compression test was conducted five times for each group of samples.

4. Analysis of Uniaxial Compression Test Results

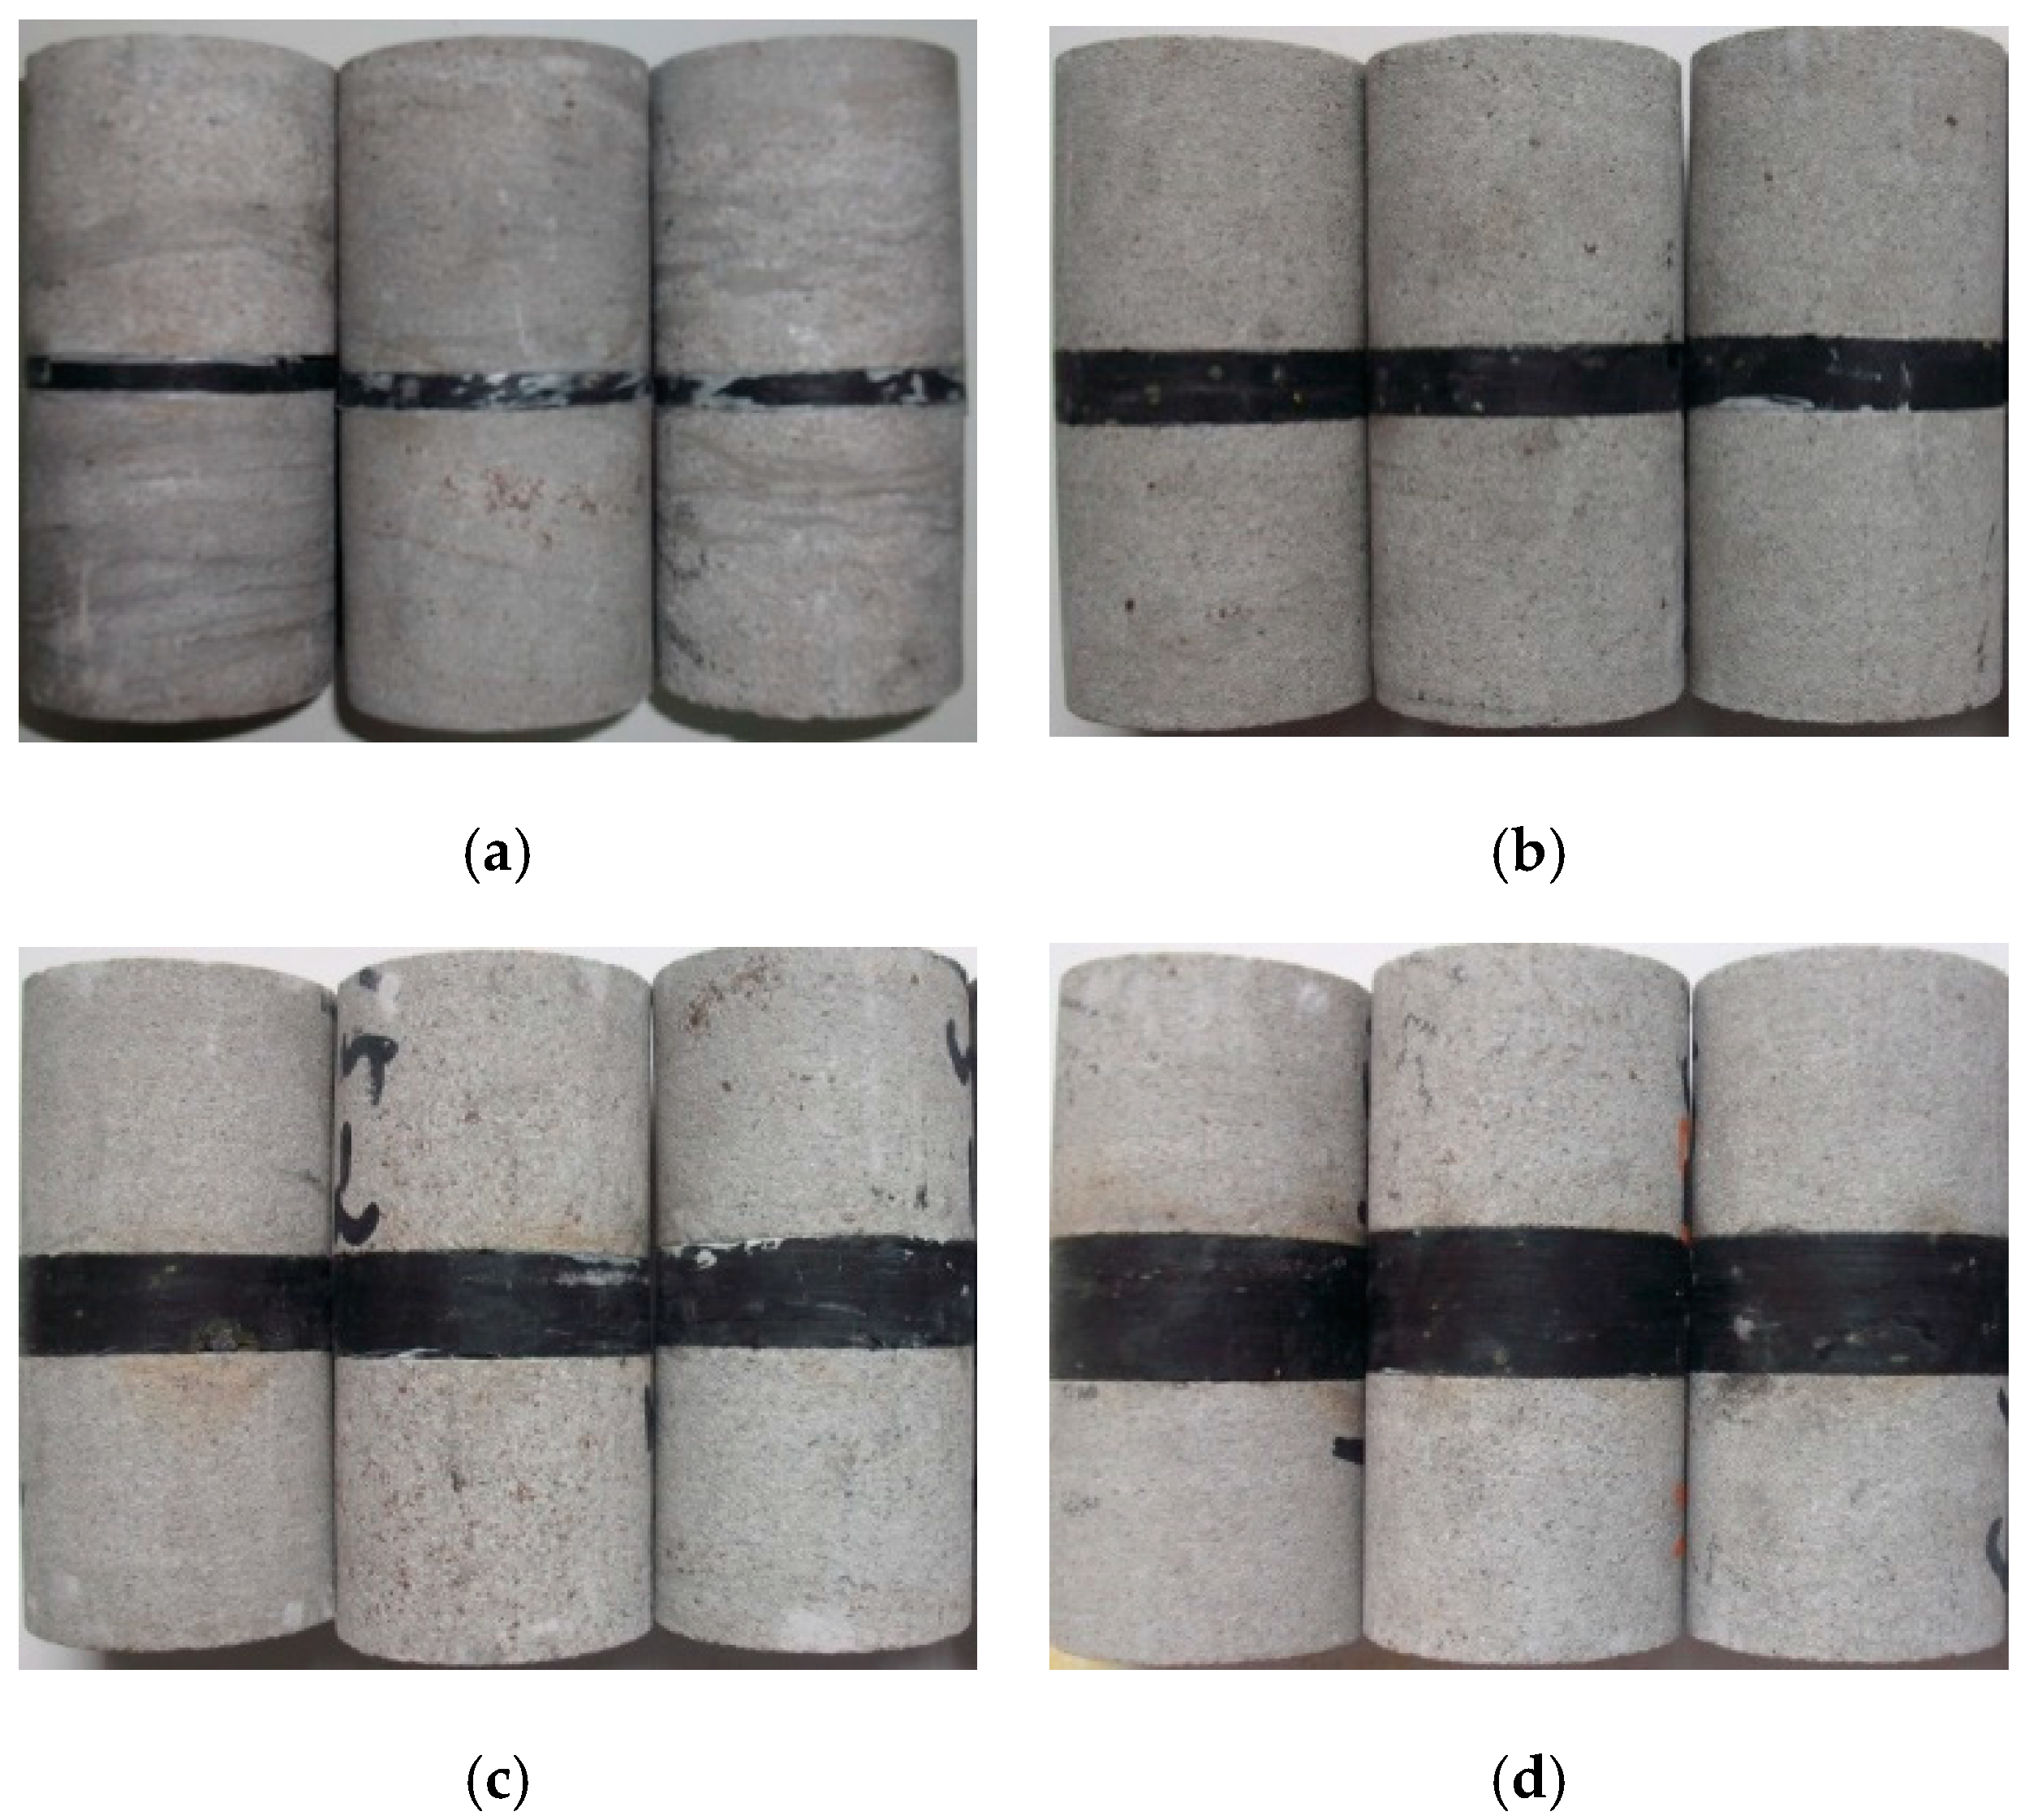
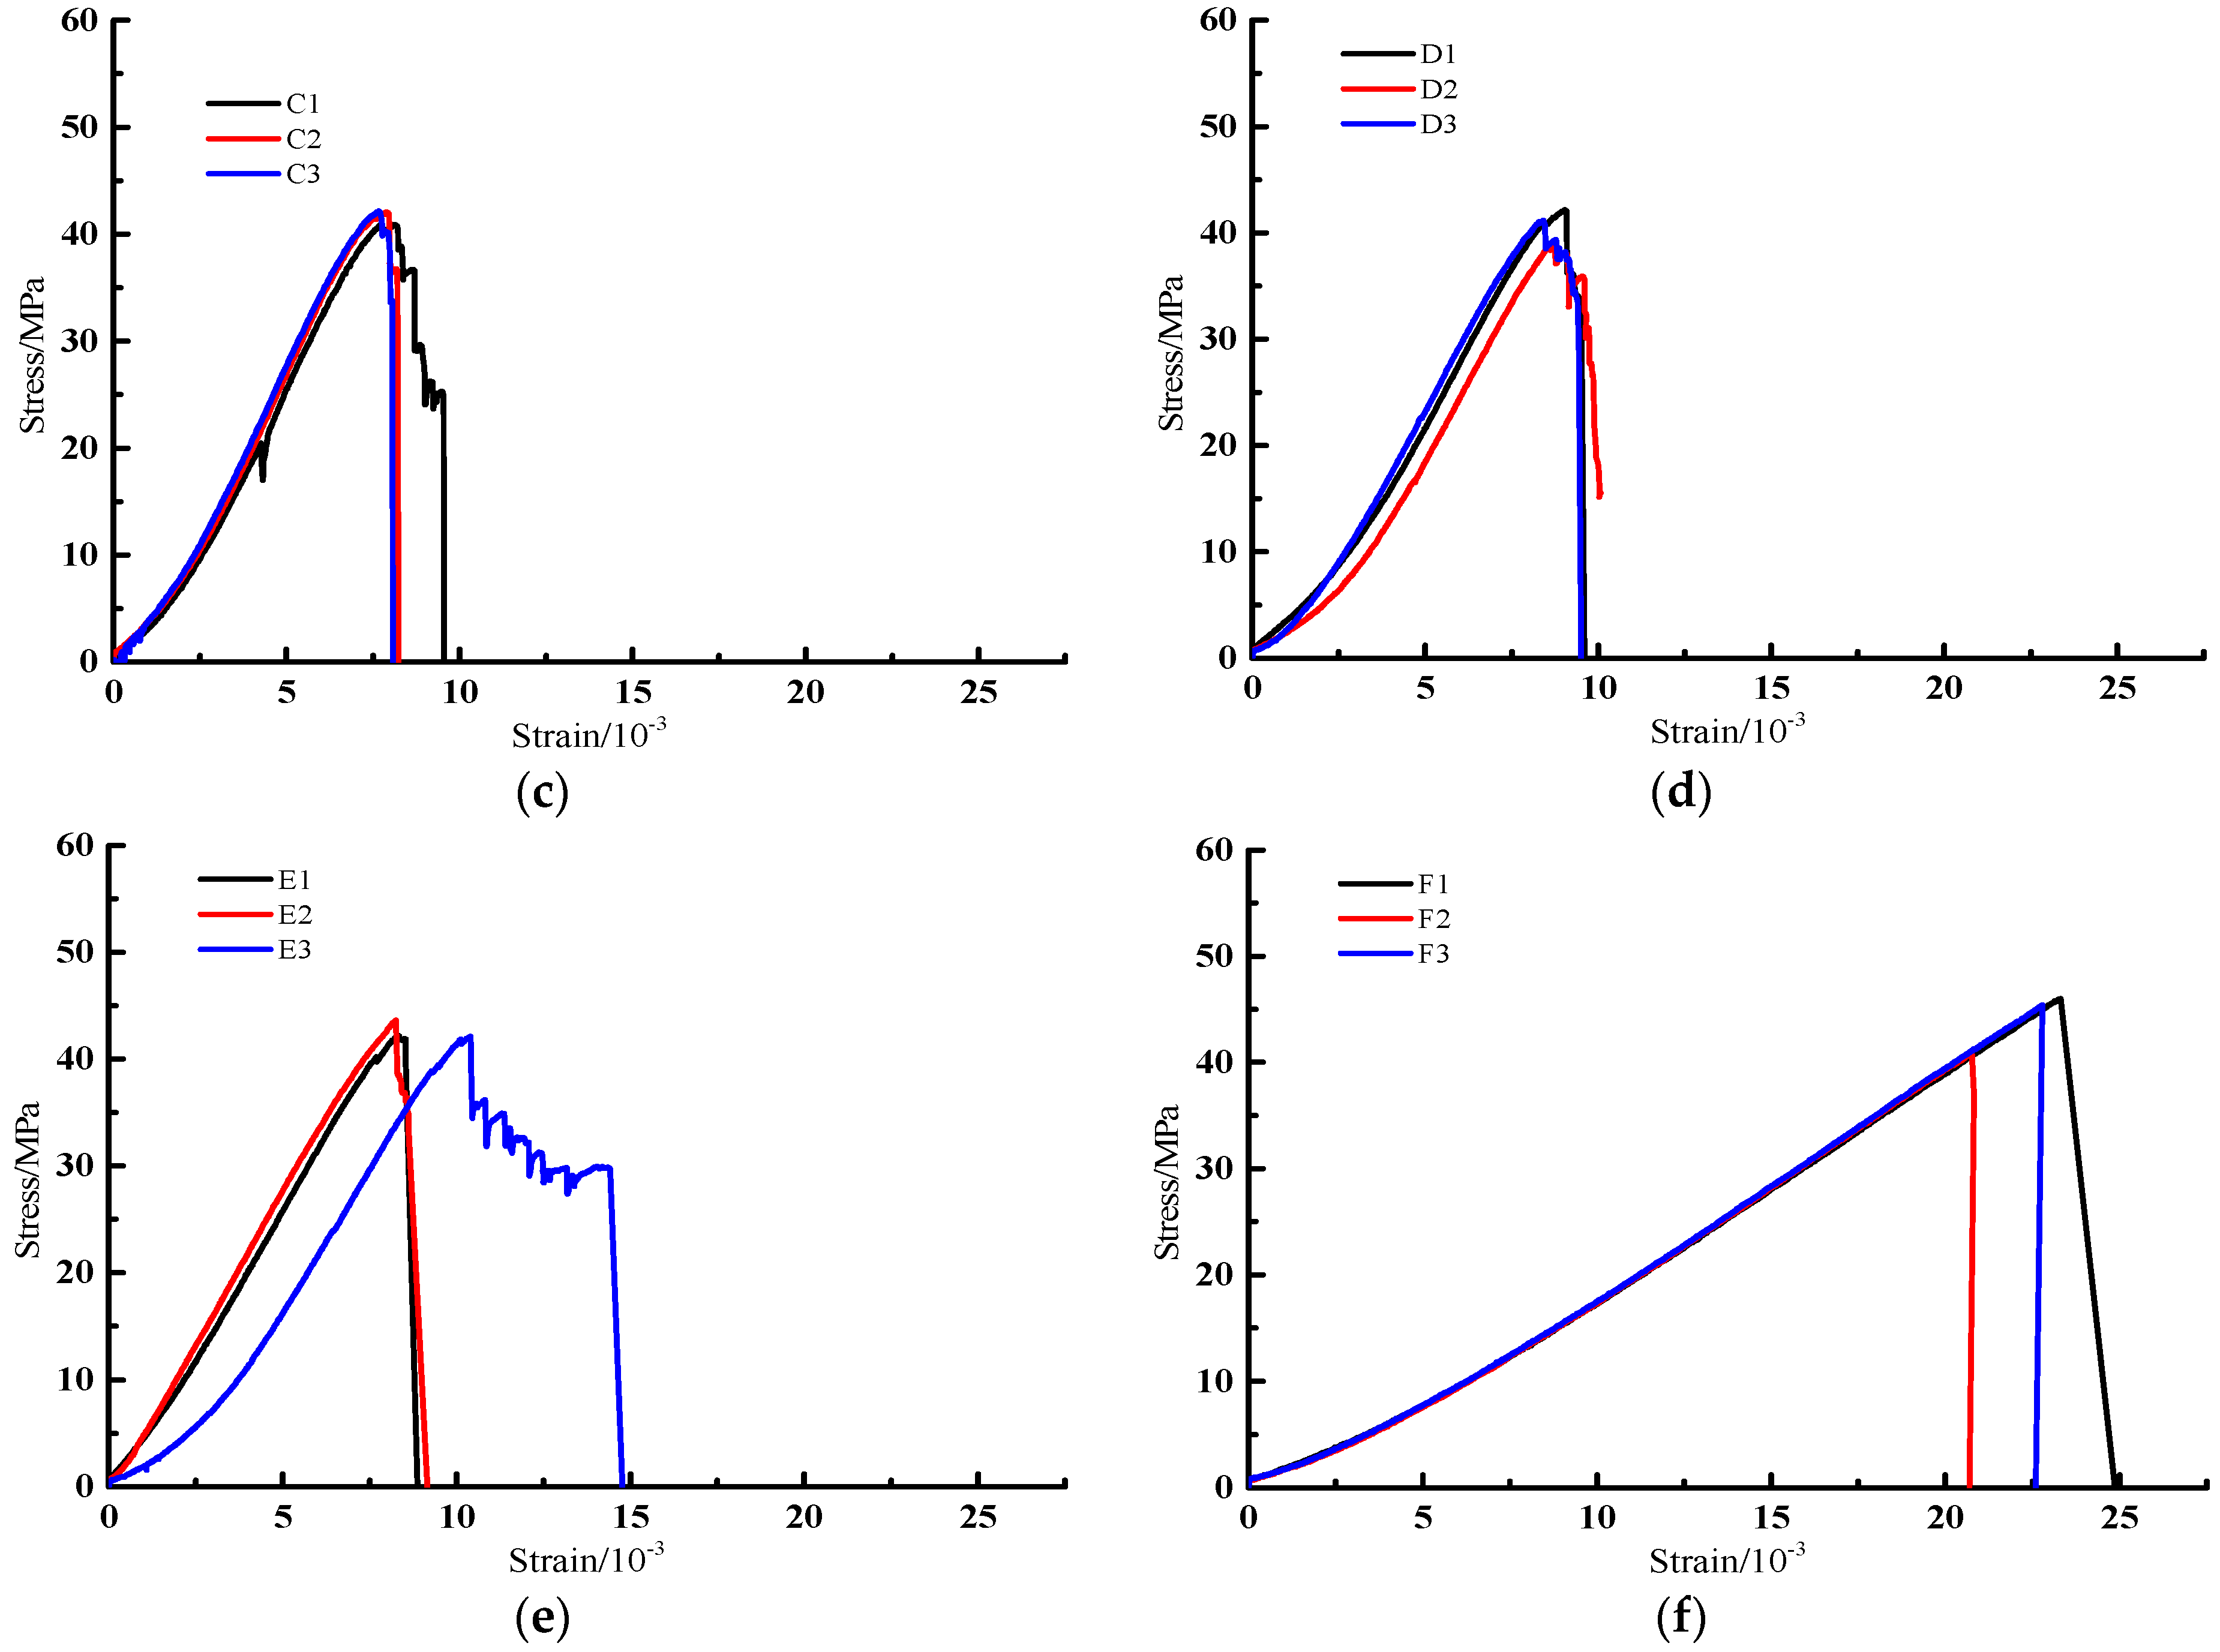
4.1. Characteristics of Stress–Strain Curves of Interbedded Sandstone with Different Interlayer Thickness

Figure 3 shows the stress–strain curves of the complete medium-grained sandstone, coal, and four interbedded medium-grained sandstone samples with different interlayer thickness. It is indicated in this figure that the stress–strain curves of the complete medium-grained sandstone and four interbedded medium-grained sandstone samples with different interlayer thickness can be basically divided into four stages, i.e., initial compaction stage, linear elastic stage, plastic deformation failure stage, and post-peak failure stage. However, the stress–strain curve of the coal sample only exists in the initial compaction stage, linear elastic stage, and plastic deformation failure stage. This is mainly due to the brittleness of the coal sample. Before the coal sample is damaged, a large amount of energy is accumulated. It is released instantaneously during the damage. The damage degree of the sample is high, and the sound of the coal sample collapsing can be heard during the test, indicating that the impact to the coal sample is relatively strong. Furthermore, Figure 3 also indicates that the upwelling phenomenon of the four interbedded medium-grained sandstone samples with different interlayer thickness is relatively complete in the initial compaction period, and the strength of the interbedded medium-grained sandstone is weakened. With the increase of the interlayer thickness, the slope of the linear elastic phase decreases, and the curve near the peak stress becomes steep. This means that the impact to the medium-grained sandstone increases with the increase of the interlayer thickness. In addition, there is a step-down phenomenon in the post-peak failure stage. This is mainly due to the gradual increase of the interlayer thickness and thus the increasing influence of the mechanical properties of coal on the intercalated medium-grained sandstone.

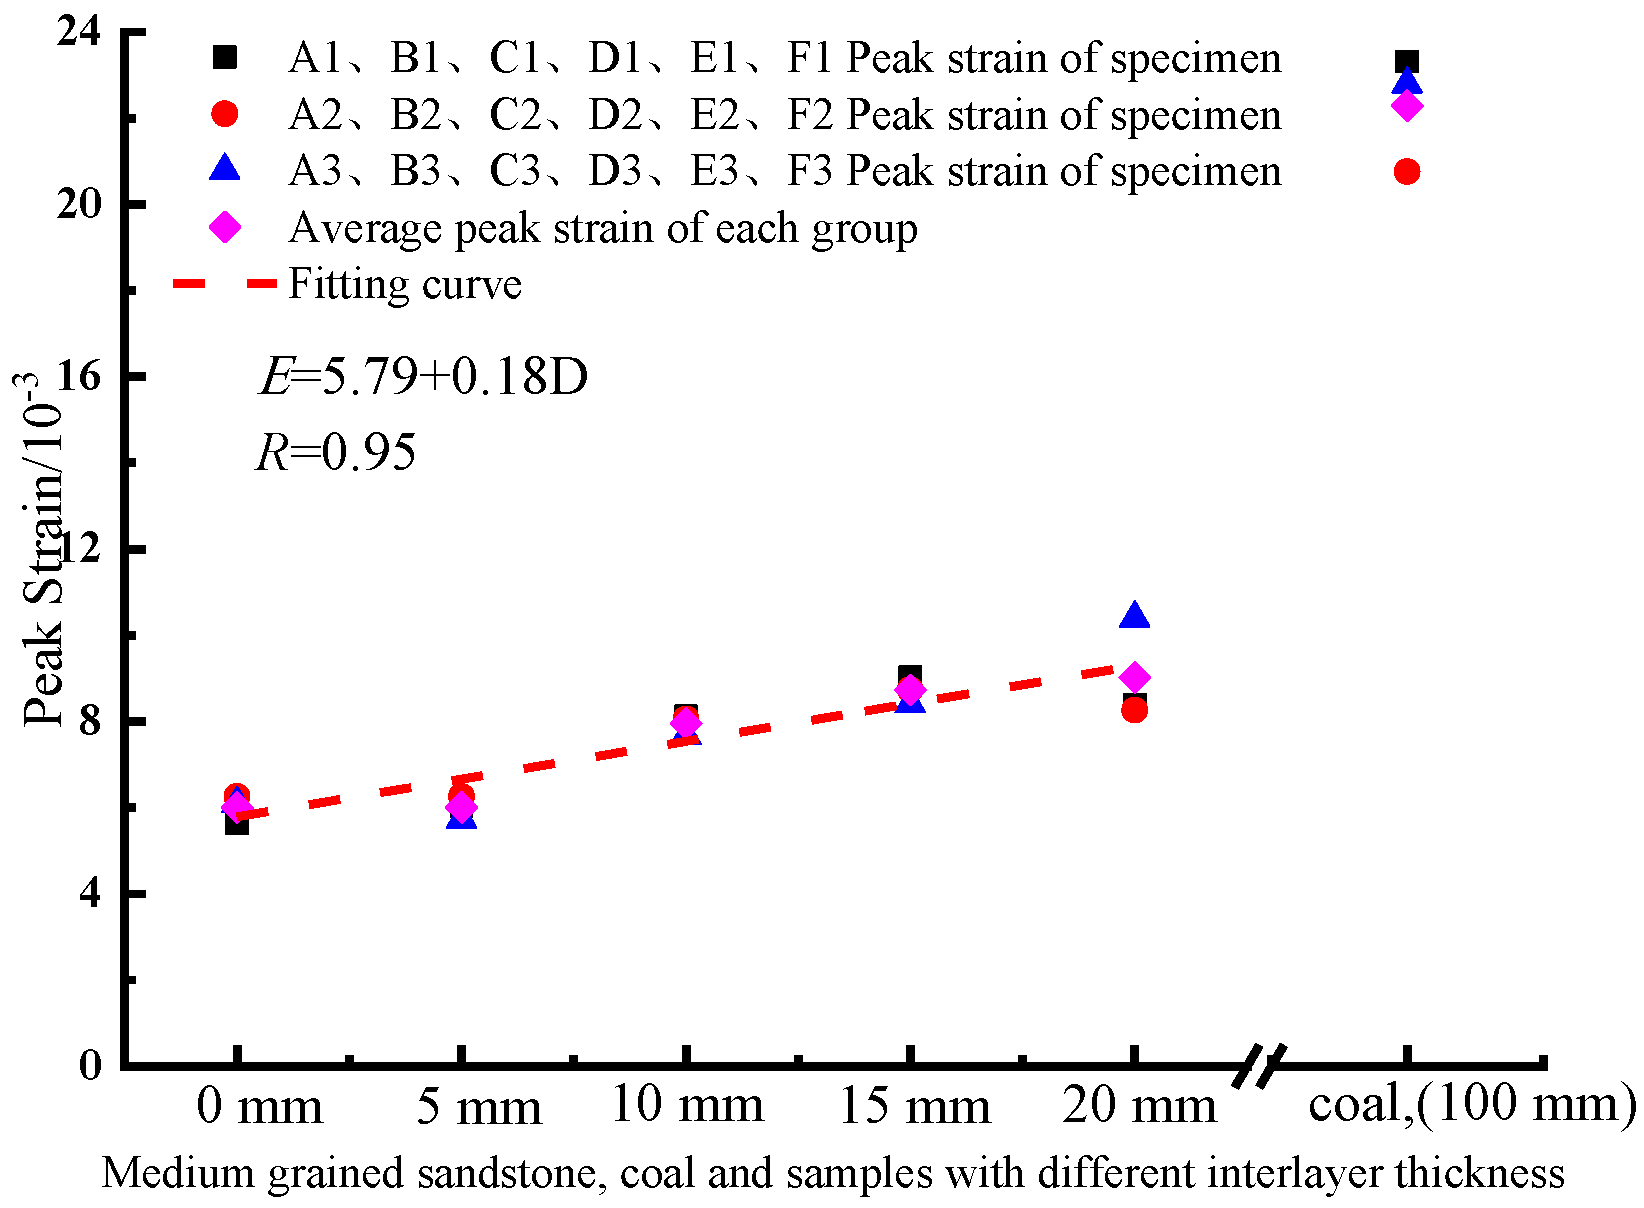
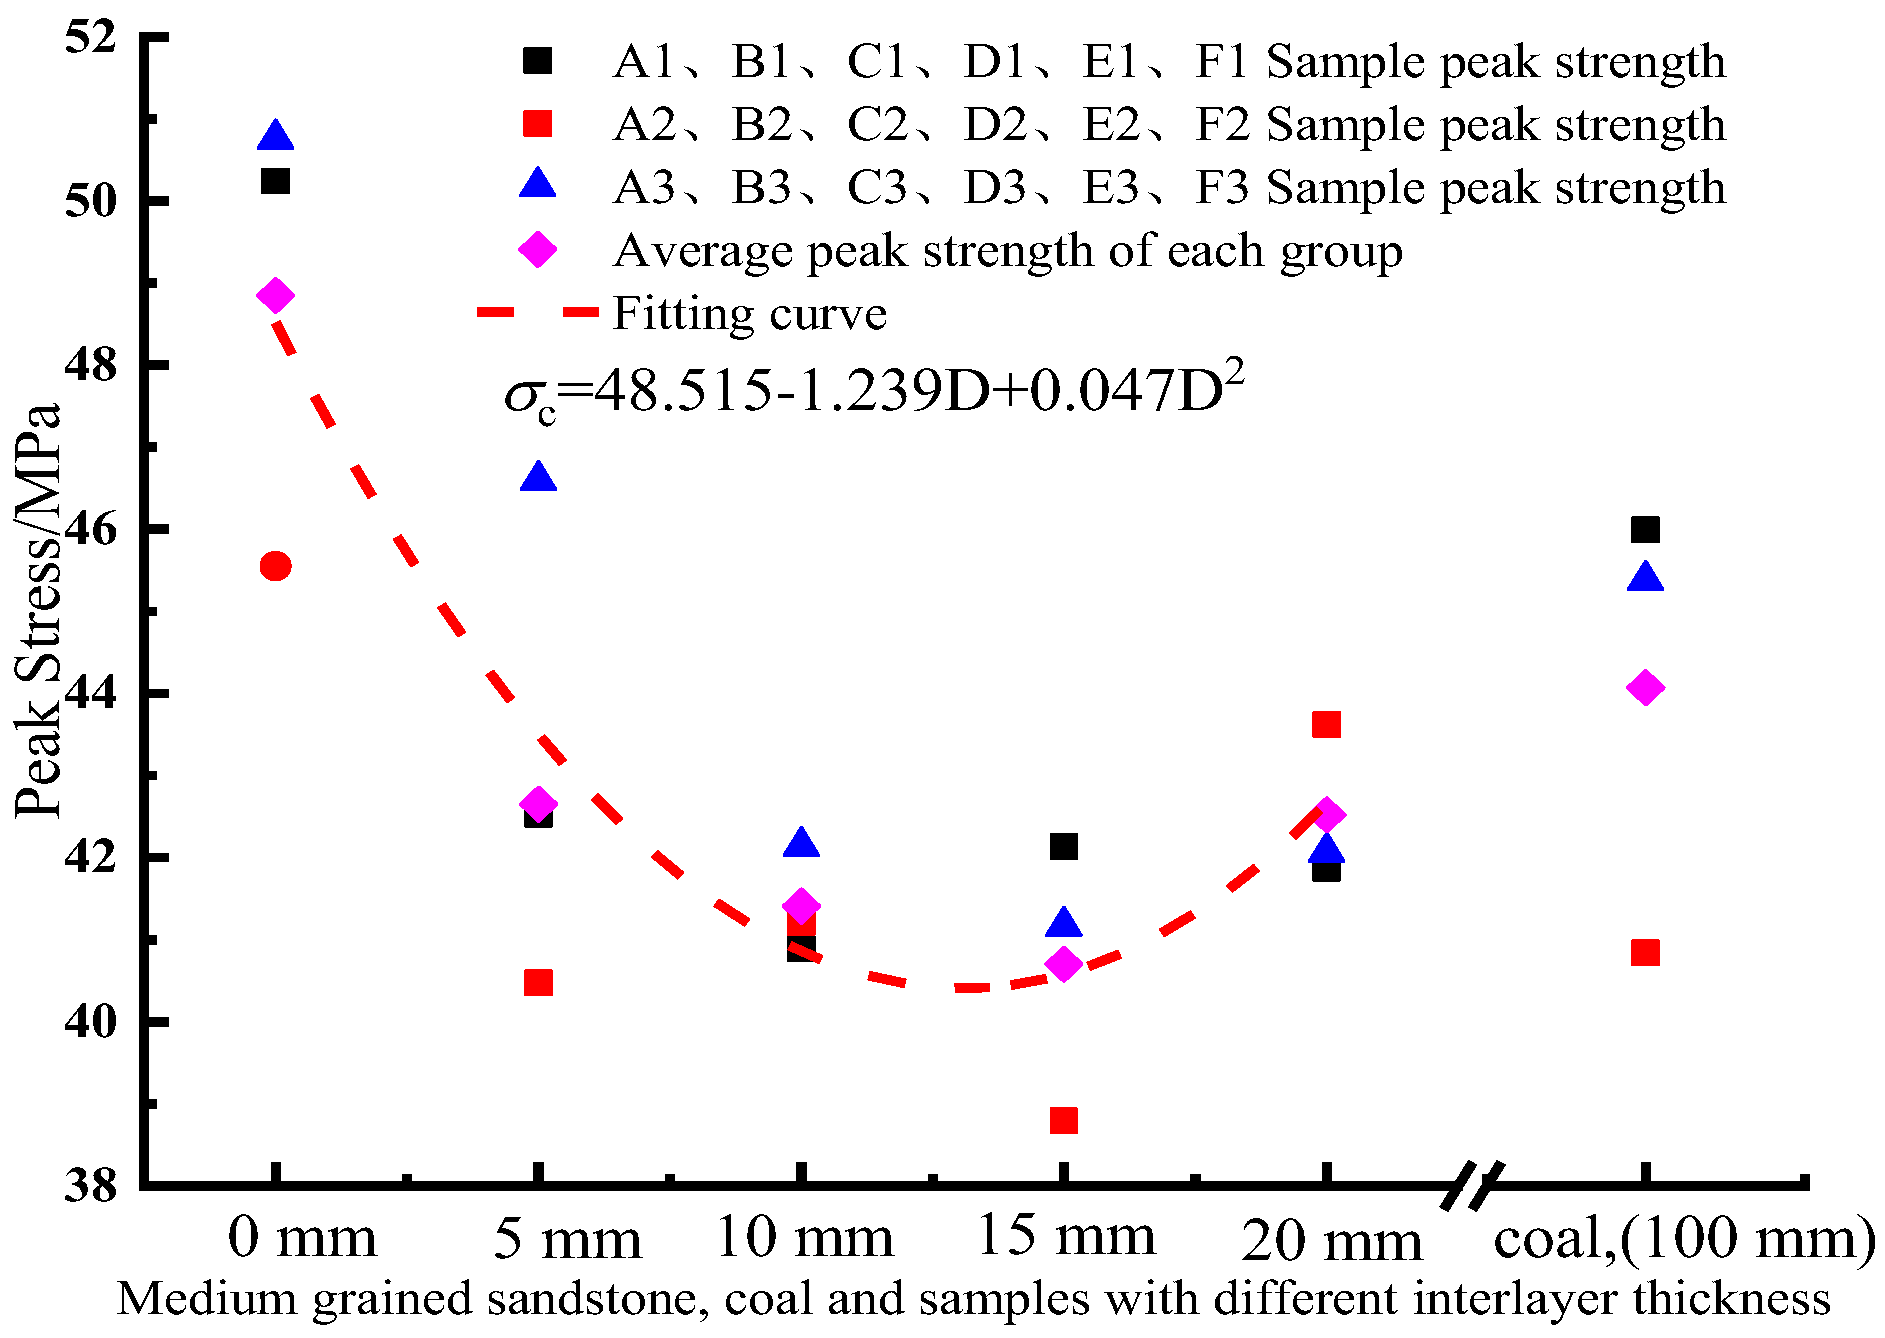
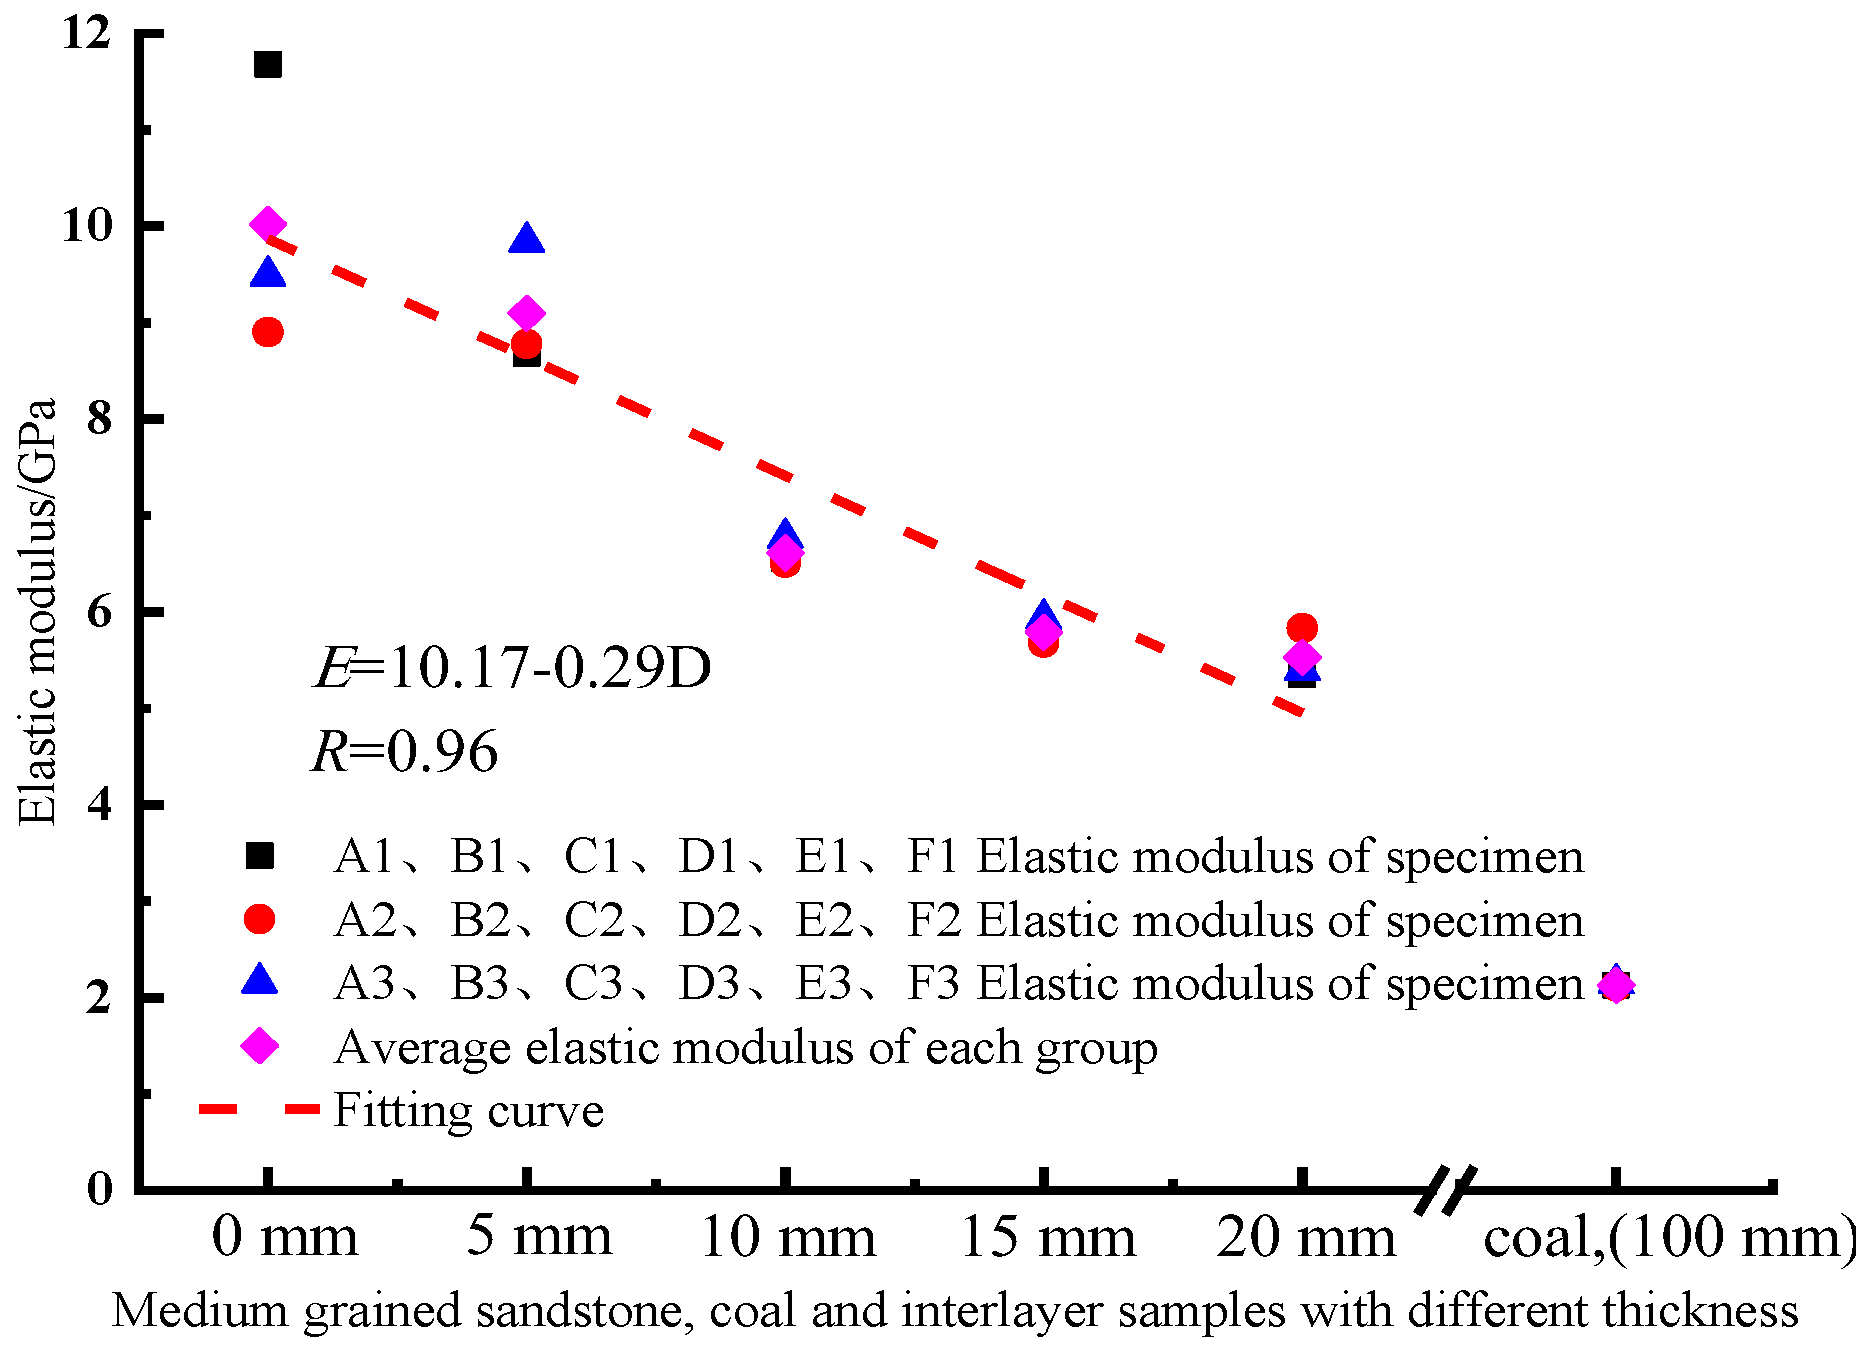
4.2. Characteristics of Uniaxial Mechanical Parameters of Interbedded Sandstone with Different Interlayer Thickness

Table 1 shows the uniaxial compression test results of the interbedded sandstone with different interlayer thickness, where σc is the uniaxial compressive strength, εc is the peak strain, E is the elastic modulus, and μ is Poisson’s ratio. Figure 4, Figure 5 and Figure 6 show the relationship between peak stress and interlayer thickness, the relationship between elastic modulus and interlayer thickness, and the relationship between peak strain and interlayer thickness. With Figure 4, Figure 5 and Figure 6 and Table 1 combined, it can be seen that the compressive strength is 45.55–50.76 MPa with an average value of 48.85 MPa for the complete medium-grained sandstone; 40.07–42.92 MPa with an average of 41.97 MPa for the interbedded medium-grained sandstone with interlayer thickness of 5 mm that accounts for 5% of the total height of the sample; 40.89–42.14 MPa with an average of 41.41 MPa for the interbedded medium-grained sandstone with interlayer thickness of 10 mm that accounts for 10% of the total height of the sample; 38.79–42.13 MPa with an average of 40.70 MPa for the interbedded medium-grained sandstone with interlayer thickness of 15 mm that accounts for 15% of the total height of the sample; and 41.87–43.62 MPa with an average of 42.52 MPa for the interbedded medium-grained sandstone with interlayer thickness of 20 mm that accounts for 20% of the total height of the sample. Moreover, the peak strain is (5.63–6.26) × 10−3 with an average of 6.00 × 10⁻³ for the complete medium-grained sandstone; (5.73–6.26) × 10−3 with an average of 6.01 × 10⁻³ for the interbedded medium-grained sandstone with interlayer thickness of 5 mm that accounts for 5% of the total height of the sample; (7.67–8.12) × 10−3 with an average of 7.95 × 10⁻³ for the interbedded medium-grained sandstone with interlayer thickness of 10 mm that accounts for 10% of the total height of the sample; (8.41–9.03) × 10−3 with an average of 8.73 × 10⁻³ for the interbedded medium-grained sandstone with interlayer thickness of 15 mm that accounts for 15% of the total height of the sample; and (8.26–10.4) × 10−3 with an average of 9.02 × 10⁻³ for the interbedded medium-grained sandstone with interlayer thickness of 20 mm that accounts for 20% of the total height of the sample. In addition, the elastic modulus is 8.9–11.68 GPa with an average value of 10.02 GPa for the complete medium-grained sandstone; 8.68–9.2 GPa with an average value of 8.89 GPa for the interbedded medium-grained sandstone with interlayer thickness of 5 mm that accounts for 5% of the total height of the sample; 6.51–6.77 GPa with an average value of 6.61 GPa for the interbedded medium-grained sandstone with interlayer thickness of 10 mm that accounts for 10% of the total height of the sample; 5.68–5.93 GPa with an average value of 5.79 GPa for the interbedded medium-grained sandstone with interlayer thickness of 15 mm that accounts for 15% of the total height of the sample; and 5.35–5.83 GPa with an average value of 5.53 GPa for the interbedded medium-grained sandstone with interlayer thickness of 20 mm that accounts for 20% of the total height of the sample. There is no obvious law for Poisson’s ratio of interbedded medium-grained sandstone with different interlayer thickness, and the interlayer thickness has no significant effect on Poisson’s ratio for jointed sandstone.
The data analysis above indicates that the uniaxial compressive strength of the interbedded sandstone with different interlayer thickness decreases first with the gradual increase of the interlayer thickness. It reaches its minimum value when the interlayer thickness accounts for 15% of the total height of the sample, and then increases with the gradual increase of the interlayer thickness. The elastic modulus decreases with the increase of the interlayer thickness, showing a negative correlation, while the peak strain increases with the increase of the interlayer thickness, showing a positive correlation. Therefore, when the difference between the compressive strength of the interlayer and the compressive strength of the sandstone is small, the interlayer thickness has little effect on the uniaxial compressive strength of interbedded sandstone. However, due to the large difference in the elastic modulus and peak strain between the interlayer and the sandstone, the interlayer thickness has a great impact on the peak strain and elastic modulus. For the interbedded sandstone with interlayer thickness accounting for 20% of the total height of the sample, the elastic modulus is decreased by 44.8% and the peak strain is increased by 50.3% compared with that of the complete medium-grained sandstone. Therefore, when the structure and movement law of the roof rock mass are analyzed, not only the compressive strength of the interlayer, but also the elastic modulus and peak strain characteristics of the interlayer should be given attention, because these characteristics will also affect the structure and failure of the rock mass.

5. Analysis of Triaxial Compression Test Results

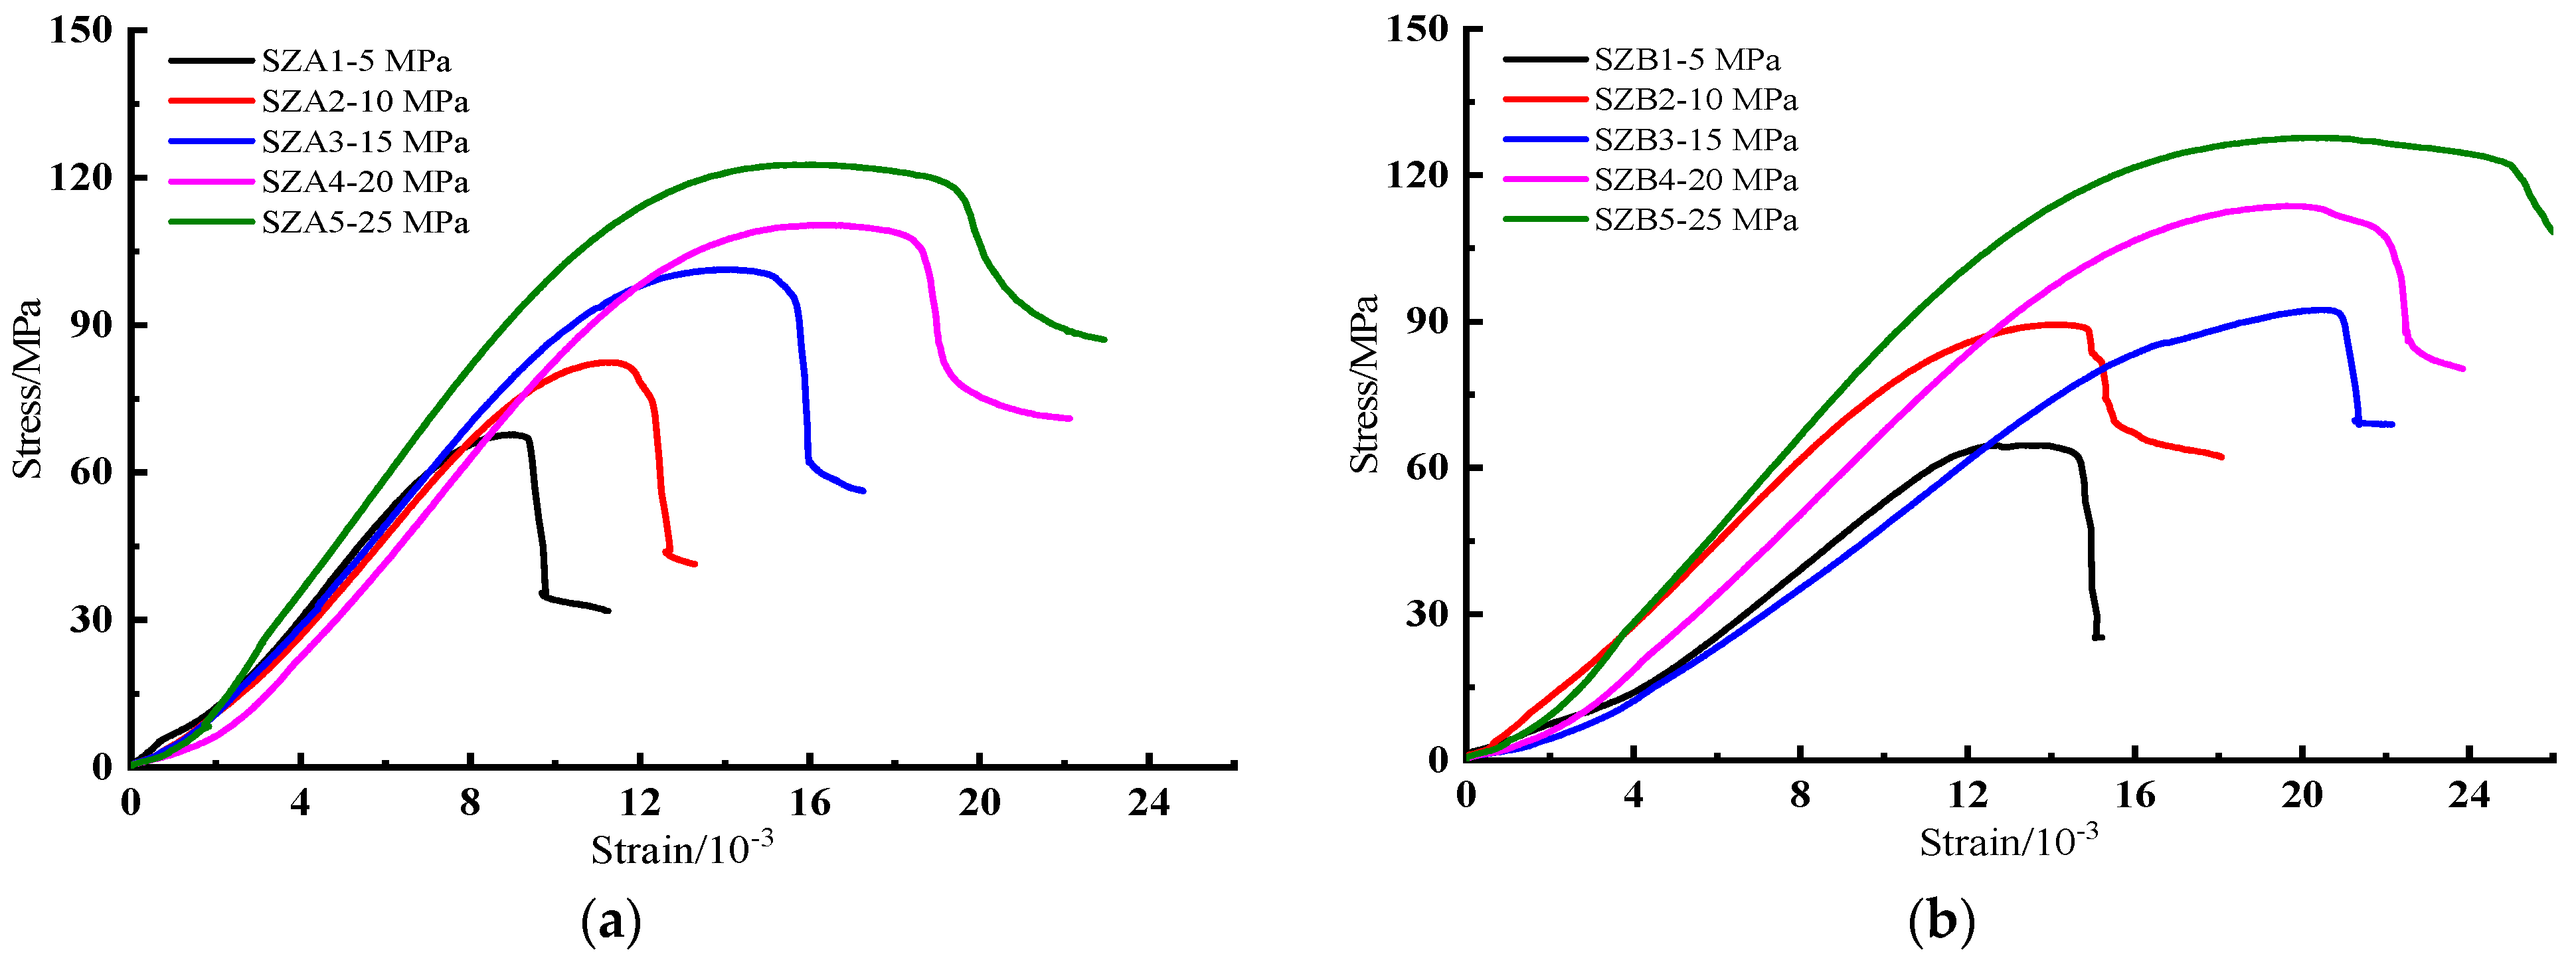
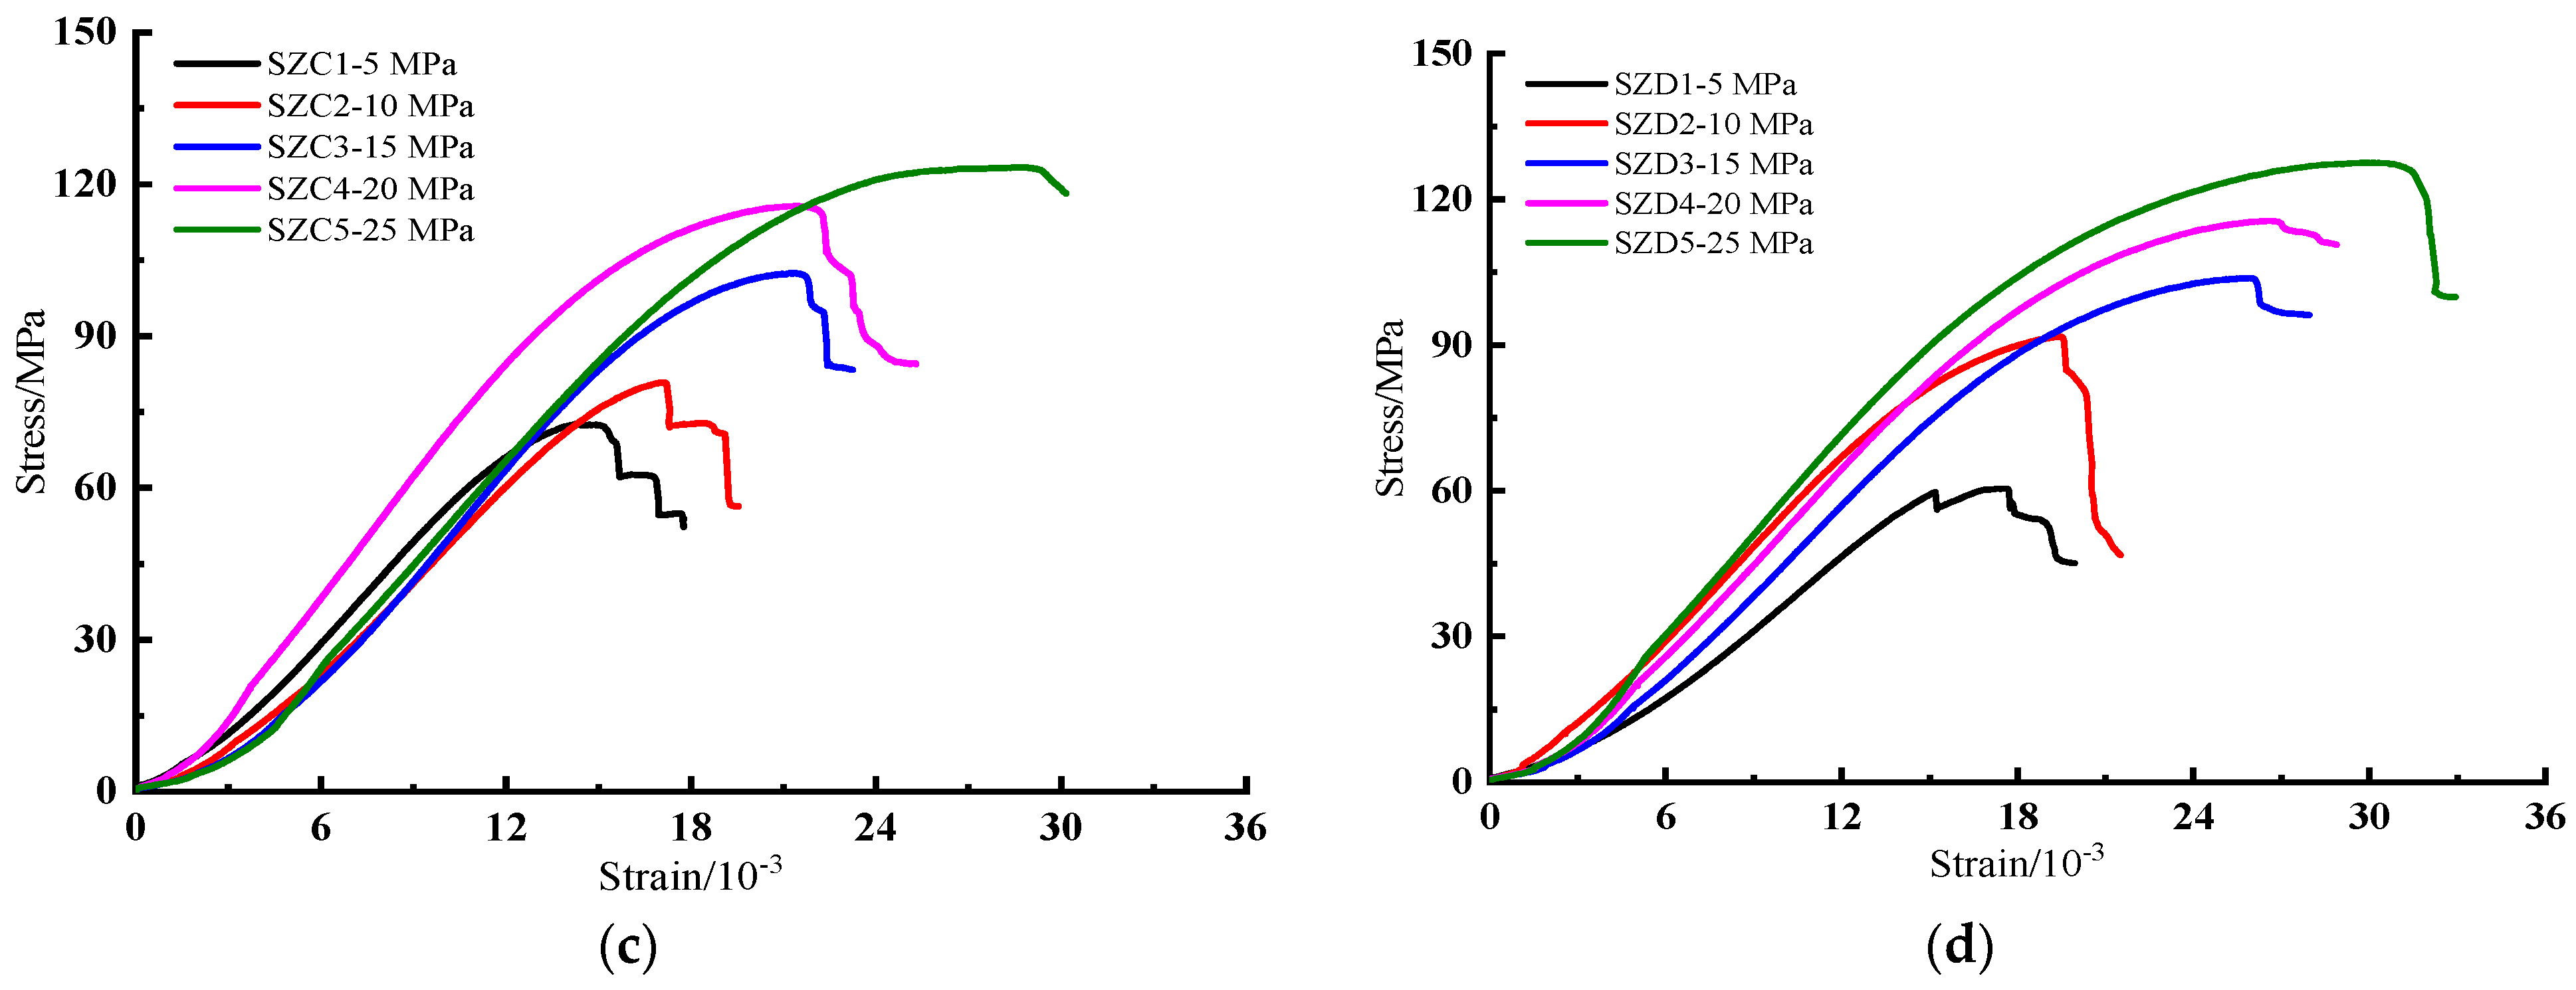
5.1. Deformation Characteristics

Figure 7 shows the stress–strain curves of the interbedded medium-grained sandstone with different interlayer thickness from the triaxial compression test. It can be seen from Figure 7 that the triaxial compressive stress–strain curves of the interbedded sandstone with different interlayer thickness all have four stages: compaction stage, linear elastic stage, yield stage, and failure stage. The stress–strain curves are concave in the initial compaction stage, and almost straight lines in the linear elastic stage. When the interlayer thickness is the same, with the increase of confining pressure, the pre-peak elastic stage and the yield stage are obviously prolonged, the peak strain increases, obviously, the peak strength point moves backward, the residual strength after failure also increases, obviously, and the peak strength of the sample increases. When the confining pressure is the same, with the increase of interlayer thickness, the initial compaction stage is prolonged, the pre-peak elastic stage and the yield stage are significantly prolonged, and the peak strain point obviously moves backward. However, in the linear elastic stage, with the increase of interlayer thickness, the peak strength decreases and the slope of the stress–strain curve decreases. This indicates that the interlayer thickness has a direct effect on the elastic modulus of the interbedded medium-grained sandstone.
The rock sample is medium-grained sandstone with a coal interlayer. Both medium-grained sandstone and coal interlayer are high porosity rocks. There are a large number of anisotropic microcracks in the sample, and a large number of pores between the sample particles. In the process of triaxial compression, the compaction stage includes the slip of microcracks and the closure of interparticle voids. Under the same confining pressure, because the coal interlayer is softer than the medium-grained sandstone, the coal interlayer between the medium-grained sandstone first begins to deform in the compaction stage. Owing to the difference in interlayer thickness, the slip characteristics of the microcracks in the samples are different, and the closure characteristics of the pores between the particles are also different. Therefore, the interlayer thickness has a major influence on the length of the compaction stage. With the increase of interlayer thickness, the compression stage is prolonged gradually, and the strain of the sample increases gradually in the compression stage. In addition, the deformation in the elastic stage mainly comes from the elastic deformation of the mineral particle skeleton of the coal interlayer and medium-grained sandstone during triaxial compression. The magnitude and duration of the strain in the elastic stage are positively correlated with the interlayer thickness and confining pressure. At the same confining pressure, with the increase of interlayer thickness, the yield stage is obviously prolonged, the strain in the yield stage increases, and the peak strain point moves backward. It can also be seen from Figure 7 that the deformation resistance of the sample increases with the increase of confining pressure.

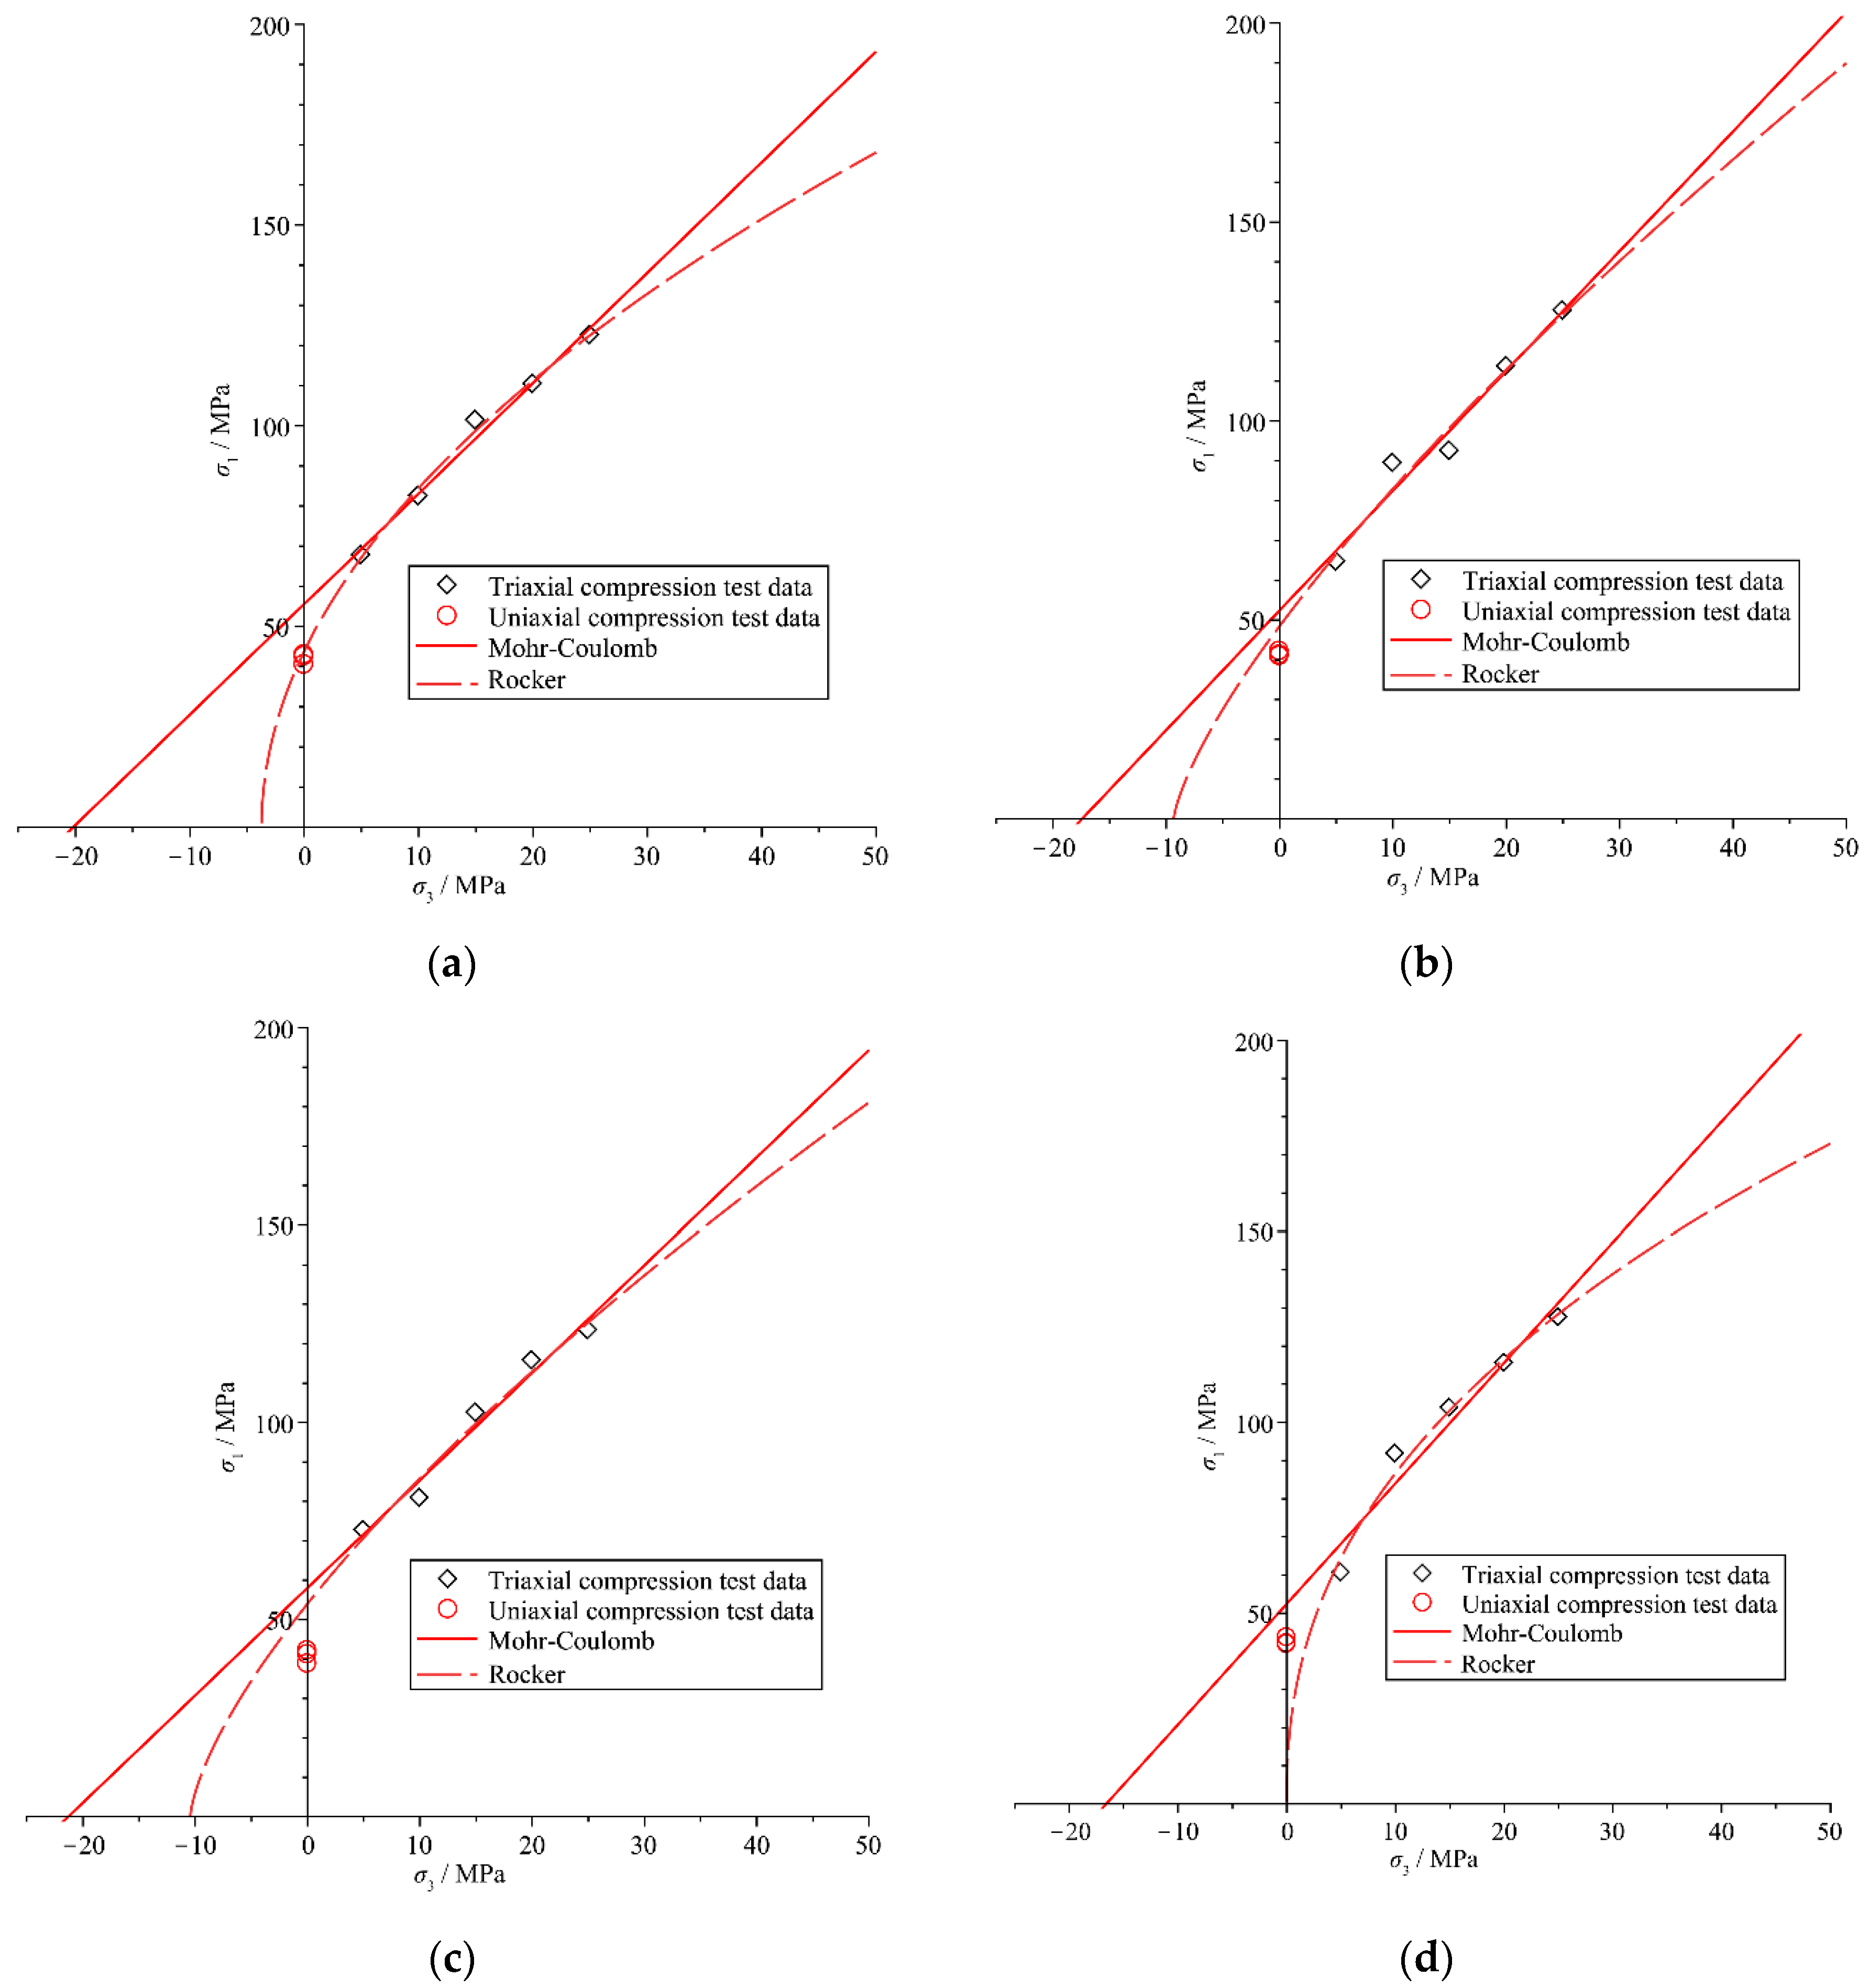
5.2. Strength Characteristics

Table 2 shows the triaxial compression test results of the interbedded medium-grained sandstone with different interlayer thickness, where σ1, σ3, and σR are the peak strength, confining pressure, and residual strength (the stress value at the turning point where the post-peak stress decreases rapidly and tends to decrease slowly), respectively, and εc is the peak strain. It can be seen from Table 2 that the effects of interlayer thickness on the triaxial compressive strength of interbedded sandstone are similar at the confining pressure of 5, 10, 15, 20, and 25 MPa. When the interlayer thickness is the same, the triaxial compressive strength increases with the increase of confining pressure, but the increasing range is different. When the interlayer thickness accounts for 5% of the total height of the sample, the triaxial compressive strength at the confining pressure of 5, 10, 15, 20, and 25 MPa is 67.69, 82.43, 101.33, 110.36, and 122.51 MPa, respectively. Compared with the compressive strength at the confining pressure of 5 MPa, the triaxial compressive strength at the confining pressure of 10, 15, 20, and 25 MPa is increased by 21.78%, 49.70%, 63.04%, and 80.99%, respectively. When the interlayer thickness accounts for 10% of the total height of the sample, the triaxial compressive strength at the confining pressure of 5, 10, 15, 20, and 25 MPa is 64.43, 89.40, 92.44, 113.70, and 127.68 MPa, respectively. Compared with the compressive strength at the confining pressure of 5 MPa, the triaxial compressive strength at the confining pressure of 10, 15, 20, and 25 MPa is increased by 38.76%, 43.47%, 76.47%, and 98.17%, respectively. When the interlayer thickness accounts for 15% of the total height of the sample, the triaxial compressive strength at the confining pressure of 5, 10, 15, 20, and 25 MPa is 72.65, 80.82, 102.42, 115.69, and 123.38 MPa, respectively. Compared with the compressive strength at the confining pressure of 5 MPa, the triaxial compressive strength at the confining pressure of 10, 15, 20, and 25 MPa is increased by 11.25%, 40.98%, 59.24%, and 69.83%, respectively. When the interlayer thickness accounts for 20% of the total height of the sample, the triaxial compressive strength at the confining pressure of 5, 10, 15, 20, and 25 MPa is 60.52, 91.75, 103.79, 115.56, and 127.55 MPa, respectively. Compared with the compressive strength at the confining pressure of 5 MPa, the triaxial compressive strength at the confining pressure of 10, 15, 20, and 25 MPa is increased by 51.60%, 71.50%, 90.95%, and 110.76%, respectively. The analysis above shows that at the same interlayer thickness, the triaxial compressive strength of the sample increases with the increase of the confining pressure. At the same confining pressure, the triaxial compressive strength of the interbedded sandstone with different interlayer thickness does not exhibit obvious law. This indicates that the existence of the interlayer has little effect on the triaxial compressive strength of the medium-grained sandstone when the mechanical properties of the interlayer and the sample are similar.
Rock strength theory is used to study the strength criteria in various stress states and characterize the relationship between the stress state of the rock in the ultimate stress state (failure condition) and the rock strength parameters. As an indispensable calculation basis for geotechnical engineering design, rock strength theory has always been important in geotechnical engineering [21]. Researchers have established many strength criteria and theories from different perspectives. The conventional triaxial strength criteria of rock are mainly studied in geotechnical engineering design.
The Mohr–Coulomb strength criterion is widely used in the design of rock mass engineering and the analysis of geological structure [22], which is one of the classical strength theories in rock mechanics.
The Rocker strength criterion was proposed by B. J. Carter et al. [23], which directly includes tensile strength.
In this paper, the two conventional triaxial strength criteria, i.e., Mohr–Coulomb and Rocker strength criterion are selected to explore the applicability of strength criteria to four interbedded medium-grained sandstone samples with different interlayer thickness. Since the tensile strength of intercalated medium-grained sandstone is much lower than the compressive strength, the use of tensile strength in fitting has no significant impact on the fitting results. Therefore, the tensile strength test was not carried out for this report. The mathematical expressions of the strength criteria and other relevant data after parameter determination follow:
  • Mohr–Coulomb strength criterion
    σ 1 = σ c + tan φ σ 3
    where
    • σ1: peak strength;
    • σc: uniaxial compressive strength;
    • φ: internal friction angle;
    • σ3: confining pressure.
    (1)
    When the interlayer thickness accounts for 5% of the total height of the sample:
    σ 1 = 55.59 + 2.75 σ 3
    According to the Mohr–Coulomb strength criterion, the predicted value of the uniaxial compressive strength of the interbedded medium-grained sandstone with interlayer thickness of 5 mm is 55.59 MPa, and the correlation fitting coefficient is 0.98608.
    (2)
    When the interlayer thickness accounts for 10% of the total height of the sample:
    σ 1 = 52.45 + 3.00 σ 3
    According to the Mohr–Coulomb strength criterion, the predicted value of the uniaxial compressive strength of the interbedded medium-grained sandstone with interlayer thickness of 10 mm is 52.45 MPa, and the correlation fitting coefficient is 0.96465.
    (3)
    When the interlayer thickness accounts for 15% of the total height of the sample:
    σ 1 = 58.09 + 2.73 σ 3
    According to the Mohr–Coulomb strength criterion, the predicted uniaxial compressive strength of the interbedded medium-grained sandstone with interlayer thickness of 15 mm is 58.09 MPa, and the correlation fitting coefficient is 0.97335.
    (4)
    When the interlayer thickness accounts for 20% of the total height of the sample:
    σ 1 = 52.47 + 3.16 σ 3
    According to the Mohr–Coulomb strength criterion, the predicted value of the uniaxial compressive strength of the interbedded medium-grained sandstone with interlayer thickness of 20 mm is 52.47 MPa, and the correlation fitting coefficient is 0.94331 (Table 3).
  • Rocker strength criterion
    σ 1 = σ c ( 1 + σ 3 T ) b
    where
    • σ1: the peak strength;
    • σc: the uniaxial compressive strength;
    • σ3: confining pressure;
    • T: uniaxial tensile strength of rock;
    • b: exponent.
    (1)
    When the interlayer thickness accounts for 5% of the total height of the sample:
    σ 1 = 43.73 ( 1 + σ 3 3.71 ) 0.504
    According to the Rocker strength criterion, the predicted value of the uniaxial compressive strength of the interbedded medium-grained sandstone with interlayer thickness of 5 mm is 43.72 MPa, and the correlation fitting coefficient is 0.99389.
    (2)
    When the interlayer thickness accounts for 10% of the total height of the sample:
    σ 1 = 48.53 ( 1 + σ 3 10.42 ) 0.688
    According to the Rocker strength criterion, the predicted value of the uniaxial compressive strength of the interbedded medium-grained sandstone with interlayer thickness of 10 mm is 48.53 MPa, and the correlation fitting coefficient is 0.96544.
    (3)
    When the interlayer thickness accounts for 15% of the total height of the sample:
    σ 1 = 54.09 ( 1 + σ 3 10.42 ) 0.688
    According to the Rocker strength criterion, the predicted value of the uniaxial compressive strength of the interbedded medium-grained sandstone with interlayer thickness of 15 mm is 54.09 MPa, and the correlation fitting coefficient is 0.97522.
    (4)
    When the interlayer thickness accounts for 20% of the total height of the sample:
    σ 1 = 1.53 ( 1 + σ 3 8.10 ) 0.429
    According to the Rocker strength criterion, the predicted value of the uniaxial compressive strength of the interbedded medium-grained sandstone with interlayer thickness of 20 mm is 1.53 MPa, and the correlation fitting coefficient is 0.98369 (Table 4).
These fitting results indicate that for the interbedded medium-grained sandstone with different interlayer thickness, the predicted results for the compressive strength of the interbedded medium-grained sandstone with different interlayer thickness by the Mohr–Coulomb strength criterion are higher than the corresponding uniaxial compression test values. Furthermore, the fitting correlation coefficient is the smallest among the two strength criteria. For the interlayer thickness of 5%, 10%, 15%, and 20% of the total height of the specimen, it can be seen from Table 3 that the fitting deviations of the uniaxial compressive strength predicted by the Mohr–Coulomb strength criterion and the experimental values are 32.45%, 26.66%, 42.73%, respectively, and 23.40%; it can be seen from Table 4 that the fitting deviations of the uniaxial compressive strength predicted by the Rocker strength criterion and the experimental values are 4.19%, 17.19%, 32.90%, and 96.40%, respectively.
Figure 8 is the fitting curve of the strength criterion for medium-grained sandstone with interlayers of different thicknesses. It can be seen from Figure 8 that both strength criteria pass most of the experimental data in areas other than tensile stress. The Mohr–Coulomb criterion is used to fit the experimental data of the interlayer medium-grained sandstone. The data are not linear, so the Mohr–Coulomb strength criterion cannot be used to explain the relationship between σ3 and σ1. The fitting deviation of the Rocker strength criterion increases significantly with the increase of interlayer thickness. When the interlayer thickness is not greater than 10 mm, the fitting deviation of the Rocker strength criterion is relatively small. When the interlayer thickness is 20 mm, the fitting deviation of the Rocker strength criterion is more than 90%, and its fitting effect is greatly affected by the thickness of the interlayer. The Rocker strength criterion is suitable for rocks with no interlayer or with a small interlayer thickness. The tensile strength of the medium-grained sandstone with the coal-bearing interlayer is much smaller than that of the complete medium-grained sandstone, almost close to 0 MPa. From Figure 8, it can be found that the fitting of the Mohr-Coulomb criterion to the tensile strength obviously deviates from the reality, and the Rocker strength criterion shows a greater advantage.

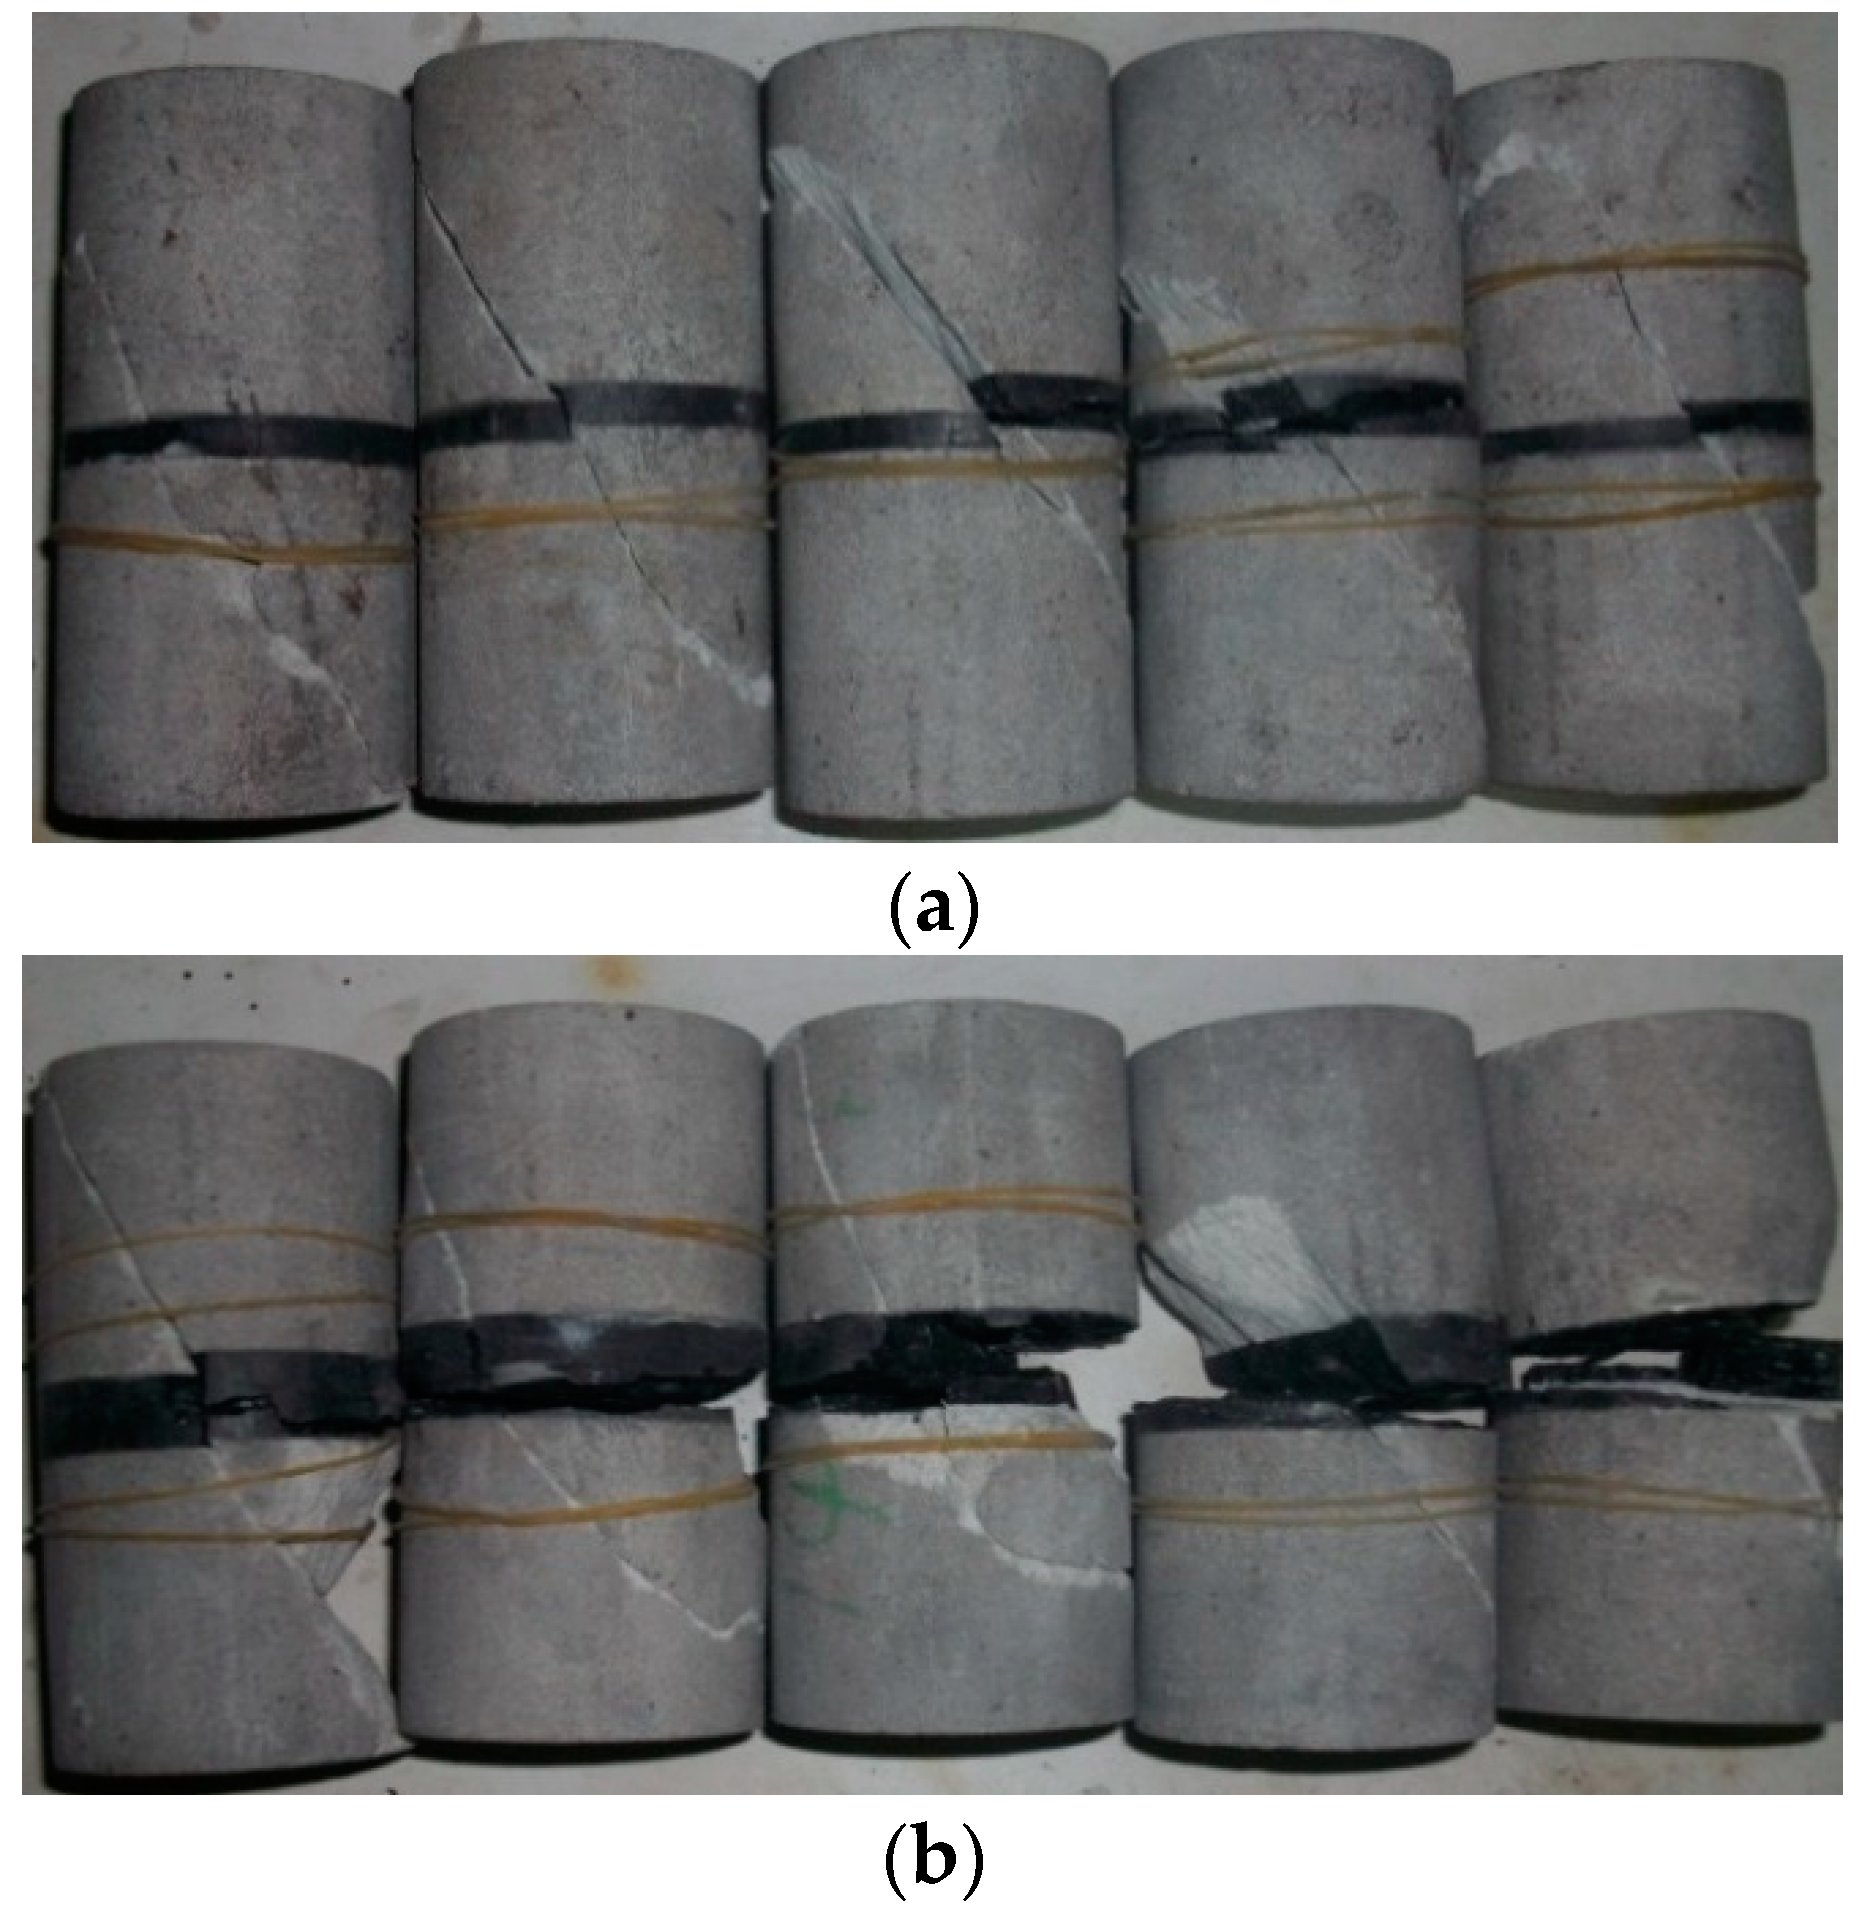
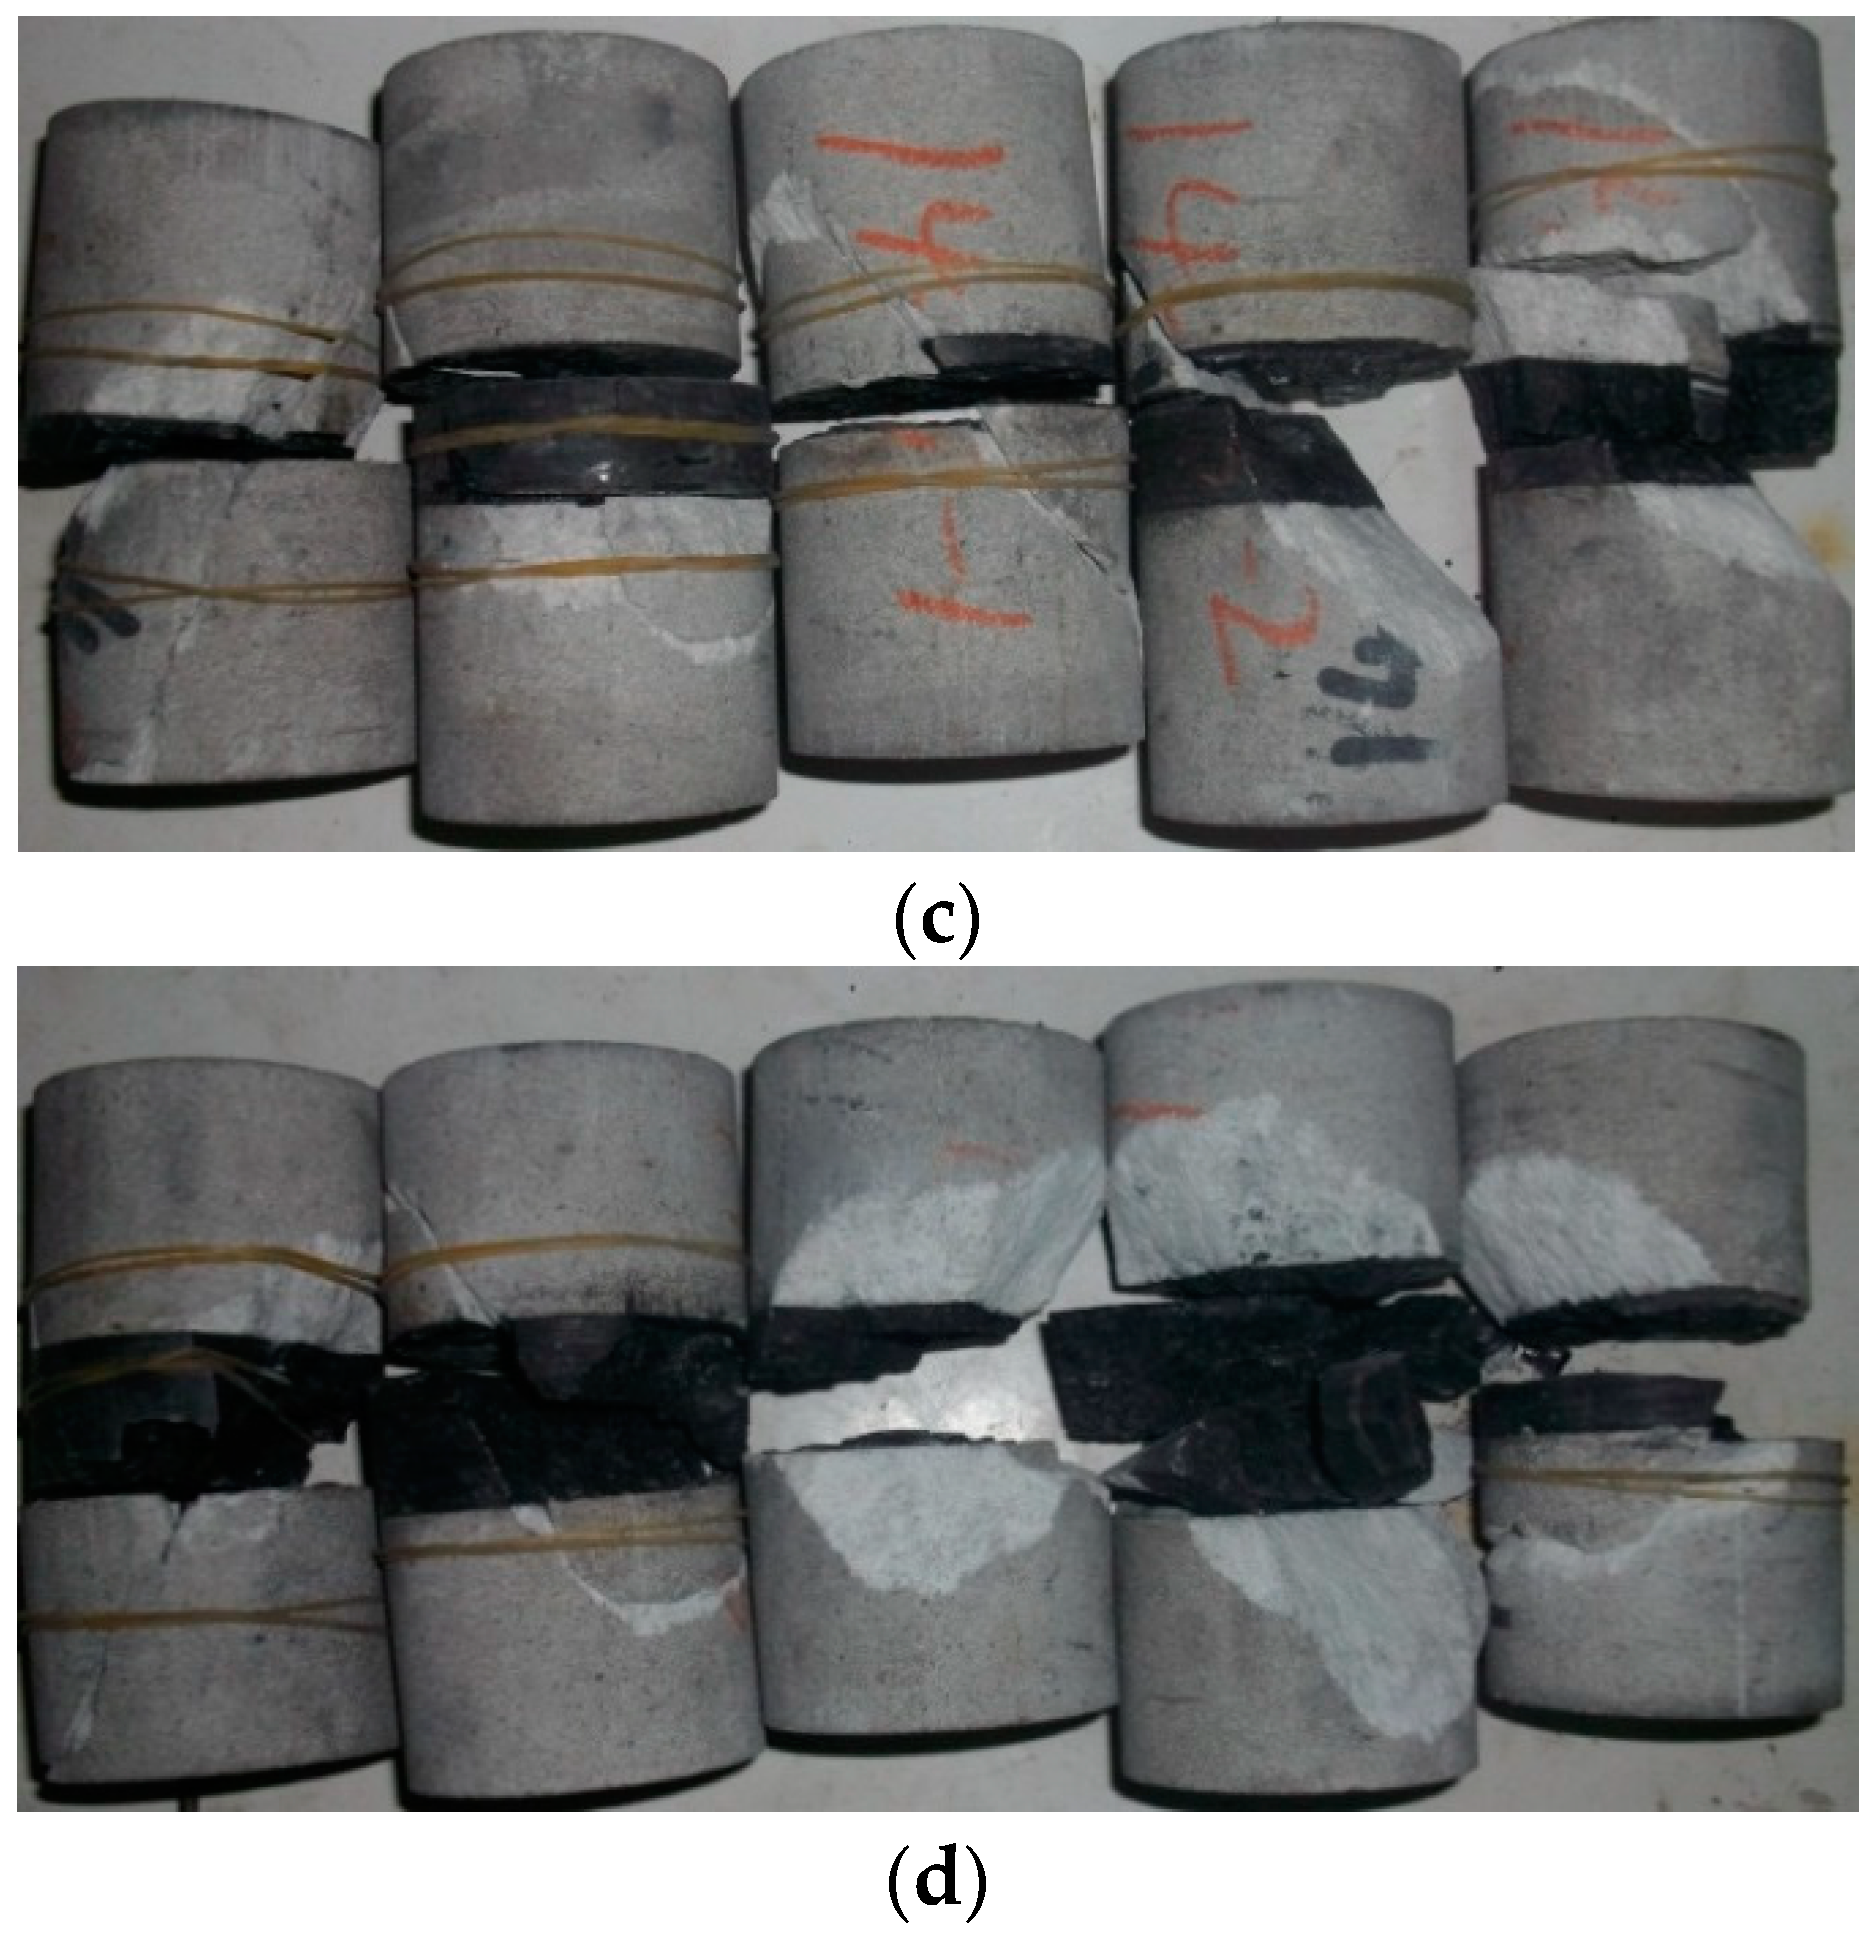
5.3. Failure Characteristics

Figure 9 shows the failure mode of the sample after the triaxial compression test of the interbedded medium-grained sandstone samples with different interlayer thickness. The failure characteristics of the samples with different interlayer thickness and different confining pressures. When the confining pressure is in the range 5.0–25.0 MPa, shear expansion failure appears in the samples, the fracture surface is complex, and the shear slip failure process is also accompanied by tensile cracks, with the characteristics of local tensile failure. The medium-grained sandstone with interlayer is mainly fractured by tension, which can form through cracks.
Figure 9 indicates that the thickness of the coal interlayer in the interbedded sample also has a significant effect on some failure characteristics of coal. When the interlayer thickness accounts for 5% of the total height of the sample, there are few cracks, mainly vertical cracks, in the coal mass. However, when the interlayer thickness increases to 10% of the total height of the sample, the number of cracks in the coal mass increases, and cracks in different directions appear, mainly horizontal and vertical cracks. When the interlayer thickness increases to 15% of the total height of the sample, there are not only vertical cracks and horizontal cracks, but also crushing areas in the coal. When the interlayer thickness increases to 20% of the total height of the sample, a large number of cracks appear in the coal. Compared with the first three samples, the number of cracks in different directions is significantly increased, and the area of the fracture zone is also increased. In addition, when the interlayer thickness is small, the influence of the confining pressure on the failure mode of the interlayer is not obvious. However, as the interlayer thickness increases, the confining pressure also has an obvious influence on the failure characteristics of the interlayer. When the confining pressure is low, there are few cracks in the interlayer, and most are vertical cracks. With the increase of the confining pressure, cracks in different directions appear in the interlayer, the number of cracks increases significantly, and the area of the fracture zone is also increased.
Figure 9 shows that the triaxial compression failure angle of the sample is fluctuant and discrete. Because there are joints, cracks, and other defects in the sample, which control the failure direction of the sample, the failure angle of the sample has certain randomness. Although the test results are discrete, the actual fracture angles of the interbedded samples are all approximately 45 + φ/2. Although the interlayer thickness has a certain effect on the internal friction angle and cohesion of the sample, no obvious law is found.

6. Conclusions

(1)
When the difference between the compressive strength of the interlayer and the compressive strength of the sandstone is small, the uniaxial compressive strength of the interbedded medium-grained sandstone first decreases and then increases with the gradual increase of the interlayer thickness. In addition, the elastic modulus is negatively correlated with the interlayer thickness, while the peak strain is positively correlated with the interlayer thickness. The interlayer thickness has little effect on the triaxial compressive strength of the intercalated medium-grained sandstone.
(2)
The deviation of the fitted uniaxial compressive strength of the Rocker strength criterion when the thickness of the interlayer is small is relatively small, and the prediction result of the Mohr–Coulomb strength criterion for the uniaxial compressive strength of medium-grained sandstones with different interlayer thicknesses is relatively good. For the prediction of the tensile strength of rocks with interlayers, the Rocker strength criterion shows superiority.
(3)
The development of cracks in medium-grained sandstone is hindered due to the existence of the interlayer, but this effect is weakened with the gradual increase of the interlayer thickness. The confining pressure and interlayer thickness also have significant effects on some failure characteristics of the interlayer. With the increase of confining pressure and interlayer thickness, the cracks in the interlayer gradually increase. They develop from vertical cracks to cracks in different directions, and the area of the fracture zone also increases gradually.

Author Contributions

Conceptualization, H.L. (Huigui Li) and J.W.; methodology, H.L. (Huigui Li); software, S.W. and X.L.; validation, H.L. (Huigui Li), H.L. (Huamin Li) and J.W.; formal analysis, J.W.; investigation, H.L. (Huigui Li); resources, H.L. (Huigui Li); data curation, H.L. (Huigui Li); writing—original draft preparation, J.W.; writing—review and editing, H.L. (Huigui Li); visualization, H.L. (Huigui Li); supervision, H.L. (Huamin Li); project administration, H.L. (Huigui Li); funding acquisition, H.L. (Huigui Li). All authors have read and agreed to the published version of the manuscript.

Funding

This research was funded by Natural Science Foundation of Guizhou Education Department (Qianjiaohe KY Zi (2019) 166), Research Initiation Fund for High-Level Talents (YKHZG2018011), the Natural Science Foundation Project of Bijie Science and Technology Bureau (Bikelianhezi NO.G(2019)5).

Institutional Review Board Statement

The study did not require ethical approval.

Informed Consent Statement

The study did not require ethical approval.

Data Availability Statement

The data used to support the findings of this study are available from the corresponding author upon request.

Conflicts of Interest

The authors declare that there is no conflict of interest regarding the publication of this paper.

Abbreviations

σcuniaxial compressive strength
εcpeak strain
Eelastic modulus
μPoisson’s ratio
σ1peak strength
σ3confining pressure
σRresidual strength
φinternal friction angle
R2correlation fit coefficient
Tuniaxial tensile strength of rock

References

  1. Li, H.M.; Li, H.G.; Song, G.J.; Wang, K.L. Physical and mechanical properties of the coal-bearing strata rock in Shendong coal field. J. China Coal Soc. 2016, 41, 2661–2671. [Google Scholar]
  2. Li, H.G.; Li, H.M.; Li, C.X.; Chen, S.L. Study on the Acoustic Emission Characteristics in the Rupture Process of Medium Grain Sandstone with Natural Structural Plane. Min. Saf. Environ. Prot. 2018, 45, 15–20. [Google Scholar]
  3. Huamin, L.; Qunlei, Z.; Chuang, L.; Lulu, S.; Huigui, L. Analysis on overburden strata movement and mine strata pressure behavior of high cutting mining in ultra thick seam. Coal Sci. Technol. 2017, 45, 27–33. [Google Scholar]
  4. Feng, J.F.; Zhou, Y.; Zhang, K.Z.; Xu, Y.L.; Li, H.G. Fracture characteristics and determination of support working resistance of key strata under shallow buried short-distance multi-seam goaf. J. Min. Saf. Eng. 2018, 35, 332–338. [Google Scholar]
  5. He, M.M.; Chen, Y.S.; Li, N.; Zhu, C.H. Deformation and energy characteristics of sandstone subjected to uniaxial cyclic loading. J. China Coal Soc. 2015, 40, 1805–1812. [Google Scholar]
  6. Kang, P.; Jiaqi, Z.; Quanle, Z.; Junhui, M. Fatigue deformation characteristics and damage model of sandstone subjected to uniaxial step cyclic loading. J. China Univ. Min. Technol. 2017, 46, 8–17. [Google Scholar]
  7. Liu, B.; Yang, H.; Haque, E.; Wang, G. Effect of Joint Orientation on the Breakage Behavior of Jointed Rock Mass Loaded by Disc Cutters. Rock Mech. Rock Eng. 2021, 54, 2087–2108. [Google Scholar] [CrossRef]
  8. Zhang, H.Q.; Mao, X.B.; Shi, H.; Wu, Y.; Chen, Y.L. Hysteresis failure behavior of argillaceous sandstone under cyclic loading, load-holding and unloading. J. Min. Saf. Eng. 2018, 35, 163–169. [Google Scholar] [CrossRef]
  9. Xiao, W.; Deng, R.; Fu, X.; Wang, C. Experimental study of deformation and strength properties of simulated columnar jointed rock masses under conventional triaxial compression. Chin. J. Rock Mech. Eng. 2015, 34, 2817–2826. [Google Scholar]
  10. Wang, Z.H.; Xiong, L.X. Uniaxial compression test of single-joint fractured rock mass considering the influence of thickness and length of joint surface and numerical simulation. J. Geol. Hazards Environ. Preserv. 2019, 30, 81–85. [Google Scholar]
  11. Zhang, S.F.; Liu, S.; Ren, D.; Liu, X.L. Numerical simulation of uniaxial compression of jointed rock mass based on FLAC3D Beijing Society of mechanics. In Proceedings of the 22nd Annual Conference of Beijing Society of Mechanics, Beijing Mechanical Society, Beijing, China, 22–27 August 2016; pp. 175–178. [Google Scholar]
  12. Gao, C.; Zhou, Z.; Li, L.; Li, Z.; Zhang, D.; Cheng, S. Strength reduction model for jointed rock masses and peridynamics simulation of uniaxial compression testing. Geomech. Geophys. Geo-Energy Geo-Resour. 2021, 7, 1–21. [Google Scholar] [CrossRef]
  13. Li, J.T.; Zhang, Y.; Gang, M.A.; Zhang, Y. Experimental and Simulation Study on Fracture Characteristics of Sandstone under Cyclic Loading. J. Hunan Univ. 2021, 48, 121–128. [Google Scholar]
  14. Lin, Q.; Cao, P.; Liu, Y.; Cao, R.; Li, J. Mechanical behaviour of a jointed rock mass with a circular hole under compression-shear loading: Experimental and numerical studies. Theor. Appl. Fract. Mech. 2021, 114, 102998. [Google Scholar] [CrossRef]
  15. Li, H.Z.; Xia, C.C.; Wang, X.D.; Zhou, J.F.; Zhang, C.S. Experimental study on deformation and strength properties of jointed marble specimens. Chin. J. Rock Mech. Eng. 2008, 27, 2118–2123. [Google Scholar]
  16. Deng, H.F.; Xiong, Y.; Xiao, Y.; Qi, Y.; Li, T.; Xu, X.L. Shear strength parameters of jointed rock mass based on single test sample method. Chin. J. Geotech. Eng. 2020, 42, 1509–1515. [Google Scholar]
  17. Zhang, K.; Liu, X.; Liu, W.; Zhang, S. Influence of weak inclusions on the fracturing and fractal behavior of a jointed rock mass containing an opening: Experimental and numerical studies. Comput. Geotech. 2021, 132, 104011. [Google Scholar] [CrossRef]
  18. Wang, P.X.; Cao, P.; Pu, C.Z. Effect of the density and inclination of joints on the strength and deformation properties of rock-like specimens under uniaxial compression. J. Univ. Sci. Technol. Beijing 2017, 39, 494–501. [Google Scholar]
  19. Yang, S.Q.; Tao, Y.; Tang, J.Z. Experimental study of triaxial strength and deformation of single jointed sandstone under cyclic loading. J. China Univ. Min. Technol. 2020, 49, 819–882. [Google Scholar]
  20. China National Standardization Administration Committee. GB/T 23561.1—2009 Determination Method of Physical and Mechanical Properties of Coal and Rock; China Standards Press: Beijing, China, 2009.
  21. Su, C.D.; Fu, Y.S. Experimental study of triaxial compression deformation and strength characteristics of red sandstone. Chin. J. Rock Mech. Eng. 2014, 33 (Suppl. 1), 3164–3169. [Google Scholar]
  22. Ministry of Water Resources of the People’s Republic of China. SL264—2001 Water Conservancy and Hydropower Engineering Specifications for Rock Tests; Water Power Press: Beijing, China, 2001. (In Chinese)
  23. Carter, B.J.; Duncan, E.S.; Lajtai, E.Z. Fitting strength criteria to intact rock. Geotech. Geol. Eng. 1991, 9, 73–81. [Google Scholar] [CrossRef]
Figure 1. Schematic diagram of sample scheme design.
Processes 10 00285 g001
Figure 2. Partially formed samples: (a) 5 mm; (b) 10 mm (c) 1 mm; (d) 20 mm.
Processes 10 00285 g002
Figure 3. Stress–strain curves of complete sandstone, four kinds of interbedded sandstone with different interlayer thickness, and coal: (a) complete medium-grained sandstone; (b) medium-grained sandstone with interlayer thickness of 5 mm; (c) medium-grained sandstone with interlayer thickness of 10 mm; (d) medium-grained sandstone with interlayer thickness of 15 mm; (e) medium-grained sandstone with interlayer thickness of 25 mm; (f) coal.
Processes 10 00285 g003aProcesses 10 00285 g003b
Figure 4. Relationship between peak stress and interlayer thickness.
Processes 10 00285 g004
Figure 5. Relationship between elastic modulus and interlayer thickness.
Processes 10 00285 g005
Figure 6. Relationship between peak strain and interlayer thickness.
Processes 10 00285 g006
Figure 7. Stress–strain curves of interbedded sandstone with different interlayer thickness under triaxial compression: (a) 5 mm; (b) 10 mm; (c) 15 mm; (d) 20 mm.
Processes 10 00285 g007aProcesses 10 00285 g007b
Figure 8. Fitting curves of different strength criteria for medium-grained sandstone with different interlayer thickness: (a) 5 mm; (b) 10 mm; (c) 15 mm; (d) 20 mm.
Processes 10 00285 g008
Figure 9. Failure modes of interbedded medium-grained sandstone with different interlayer thickness: (a) 5 mm; (b) 10 mm; (c) 15 mm; (d) 20 mm.
Processes 10 00285 g009aProcesses 10 00285 g009b
Table 1. Mechanical parameters of uniaxial compression.
LithologyInterlayer Thickness/mmNumberH/mmD/mmσc/MPaεc/10−3E/GPaμ
Medium-grained sandstone0 A198.3049.5050.245.6311.680.192
0 A296.2049.7045.556.268.900.251
0A399.2050.1050.766.109.490.262
5 B198.1049.9040.896.038.680.312
5 B298.1049.7040.476.268.780.266
5 B397.9049.8046.605.739.840.194
10 C198.8049.9040.898.126.550.264
10 C298.7050.1041.218.066.510.305
10 C398.6049.7042.147.676.770.309
15 D1100.7049.7042.139.035.760.311
15 D2100.5049.8038.798.745.680.303
15 D399.3049.7041.178.415.930.220
20 E1100.7049.7041.878.395.350.216
20 E2100.5049.8043.628.265.830.208
20 E399.3049.7042.0710.405.400.298
Coal-F199.2049.9045.9923.312.130.146
-F2101.0049.7040.8420.762.120.358
-F399.3049.8045.3822.792.150.341
Table 2. Mechanical parameters of interbedded sandstone with different interlayer thickness under triaxial compression.
LithologyNumberInterlayer Thickness/mmH/mmD/mmσ3/MPaσ1/MPaσR/MPaεc/10−3
Medium-grained sandstoneSZA-1599.2050.10567.6931.838.88
SZA-2598.5849.801082.4341.3911.38
SZA-3599.9650.2015101.3356.2114.10
SZA-4598.8049.7020110.3671.0116.44
SZA-5599.1050.4025122.5187.0116.61
SZB-11099.5049.60564.6325.2213.24
SZB-21099.4250.301089.4062.1514.11
SZB-31098.8650.701592.4468.8920.55
SZB-41098.8249.7020113.7080.3220.02
SZB-51099.6249.8025127.68102.9620.64
SZC-115100.1049.80572.6553.8714.33
SZC-21598.6249.901080.8256.4217.11
SZC-31599.2249.8015102.4283.3521.20
SZC-41599.7649.7020115.6984.4821.40
SZC-51599.9649.7025123.38118.1328.67
SZD-120100.7050.20560.5245.0817.54
SZD-220100.8649.701091.7546.7319.41
SZD-320101.0049.7015103.7996.1425.73
SZD-420100.4050.1020115.56110.6426.61
SZD-520100.9649.7025127.5599.8829.96
Table 3. Fitting parameters of Mohr–Coulomb strength criterion.
LithologyInterlayer Thicknessσc Estimate tan φ R2σc AverageDeviationCohesion/MPa
Medium-grained sandstone5 mm55.592.750.9860841.9732.45%16.67
10 mm52.453.000.9646541.4126.66%15.14
15 mm58.092.730.9733540.7042.73%17.58
20 mm52.473.160.9433142.5223.40%14.76
Table 4. Fitting parameters of Rocker strength criterion.
LithologyInterlayer Thicknessσc EstimateR2σc AverageDeviation
Medium-grained sandstone5 mm43.730.9938941.974.19%
10 mm48.530.9654441.4117.19%
15 mm54.090.9752240.7032.90%
20 mm1.530.9836942.5296.40%
Publisher’s Note: MDPI stays neutral with regard to jurisdictional claims in published maps and institutional affiliations.

