Article

The Study of the Pore Structure Properties of Rocks Based on Complex Network Theory: Taking an Example of the Sandstone in the Tongnan Area in China

1
State Key Laboratory for Geomechanics and Deep Underground Engineering, China University of Mining & Technology, Xuzhou 221008, China
2
School of Mechanics & Civil Engineering, China University of Mining & Technology, Xuzhou 221116, China
3
Key Laboratory of Deep Earth Science and Engineering, Ministry of Education, Sichuan University, Chengdu 610065, China
4
Geotechnical and Structural Engineering Research Center, Shandong University, Jinan 250000, China
*
Authors to whom correspondence should be addressed.
Processes 2022, 10(2), 211; https://doi.org/10.3390/pr10020211
Submission received: 7 December 2021 / Revised: 30 December 2021 / Accepted: 9 January 2022 / Published: 24 January 2022
(This article belongs to the Special Issue Multiphase Flows and Particle Technology)

Abstract

:
The pores in rocks are multi-scale and highly complex. Based on complex network theory, the topological properties of a sandstone flow network are studied. The results show that the sandstone pore scale network is a small-world network with an average shortest path of 5.720, and 80% of the network node degree is less than 3. This network structure can improve the security of the network and ensure the permeability of the pores under the action of external forces. In addition, nodes with appropriate degree distribution have a significant influence on permeability. Nodes with a larger degree will significantly reduce the average shortest path of the network, while nodes with a smaller degree will expand the coverage of the seepage network.

1. Introduction

The pores in a rock reservoir are characterized by a multi-form, multi-scale and complex connection structure. The accurate description and quantitative characterization of the rock pore structure is the key to revealing the mechanism of the seepage phenomenon [1,2]. Further study on the structural characteristics of reservoir rocks has important scientific significance and engineering application value for accurately and quantitatively evaluating the permeability of rocks, improving oil recovery and reducing production costs.
In recent years, many experiments and simulations have been carried out on the statistical properties and evolution of the pore structure in rocks. Based on sandstone‘s computed tomography (CT) scan image data of sandstone, Hajizadeh, A. [3] proposed a type of random porous media reconstruction technology by combining continuous, two-dimensional, multi-point statistical simulation with a multi-scale data extraction process using statistical methods. Since the traditional Darcy’s law cannot accurately describe gas flow in tight rock, Civan, F. [4] adopted the revised Darcy’s law to describe the gas density in shale migration law, and the apparent permeability is a function of the internal permeability porosity. Based on the pore network model, Zhang, T.Y. [5] proposed a modeling method based on the pore and throat size and calculated the permeability of different models in combination with seepage theory. Yang, J. [6] applied the fractal control function to characterize the complex shape of a rock’s pore structure and established the fractal reconstruction model of the rock pore structure in combination with the improved simulated annealing algorithm. Shaina, K. [7] used focused ion beam scanning electron microscopy (FIB-SEM) to obtain the pore structure distribution of shale by the digital core method and compared the result with conventional scanning electron microscopy from the perspective of the organic matter content of the porosity and the pore connectivity.
At present, we mainly adopt the Euler number or average (such as for the average pore size or average pore throat length) from a macro perspective around the rock pore connectivity structure characterization. However, the relationship between the anisotropy degree of pore network clustering, the selection of the seepage path and the macroscopic permeability remains to be studied.
Nature and Science successively published two pioneering achievements of complex networks and put forward the small world model [8] and scale-free model [9] from 1988 to 1999. These two models form the basic framework of modern complex network theory. In the past 10 years, complex network theory has been widely used in physics, biology, informatics, big data and many other research fields [10,11,12]. Based on the analysis of network topology and complexity, the theoretical model of a network structure is established, and the internal evolution, robustness and dynamic transmission mechanism of a network are revealed.
Considering a real sandstone pore network and complex network theory, this study analyzes the topological characteristics and correlation properties of the pore network. This provides a new method for revealing the microscopic mechanism of porous seepage and characterizing the pore network structure of a rock.

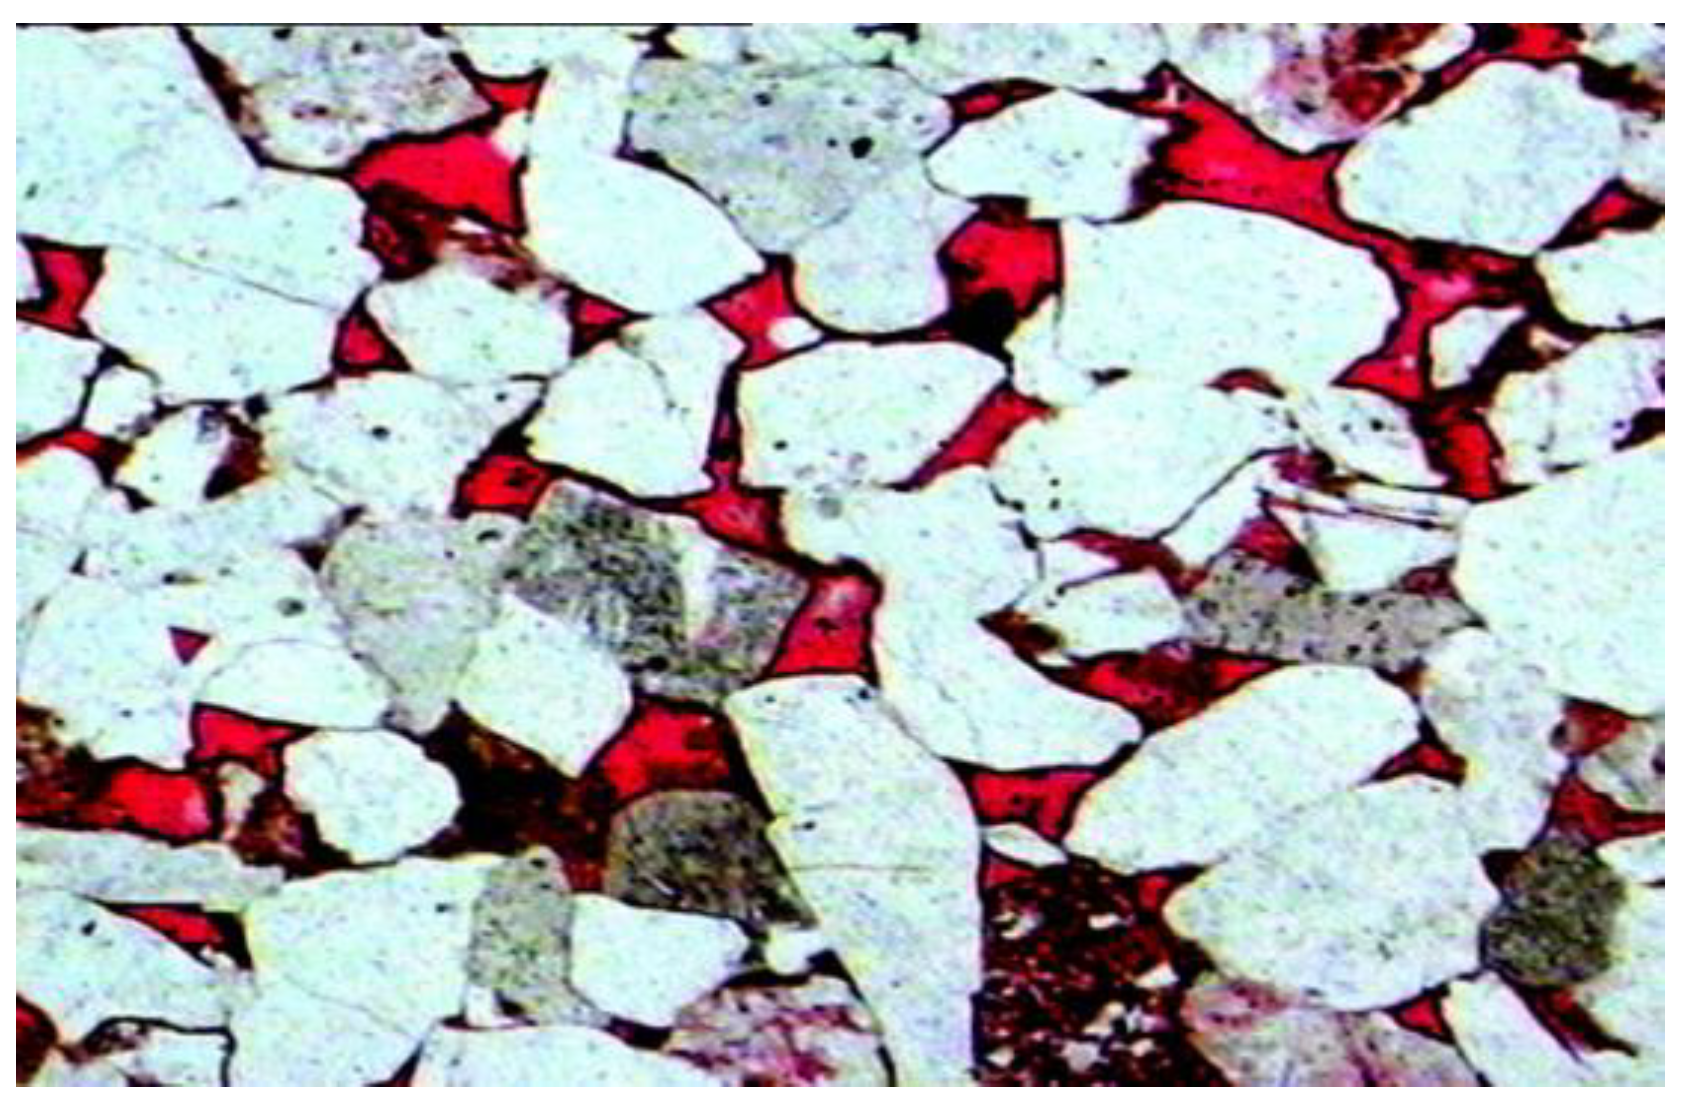
2. Basic Characteristics of a Sandstone Pore Network

Sandstone in the Tongnan area of China was studied as an example. After the mercury injection experiment, the seepage network of the sandstone was obtained by scanning electron microscopy, as shown in Figure 1.
In the pore network, the pore–throat intersection is defined as the “node”, and the seepage crack is defined as the “edge”. The average shortest path length of the network is expressed as [12]
l = 1 1 2 N ( N 1 ) i > j d i j
where N is the number of nodes and d i j is the shortest path length from node i to j. The distribution of the distance d of the network P ( d ) is at its maximum when d = 6 , as shown in Figure 2. P ( d ) represents the proportion of the shortest path length in the entire network when the sandstone pore network’s shortest path is d . The average shortest path length of the network was 5.720, and the average shortest path length was 14.
The degree distribution of the network nodes is the number of cracks connected to this node. The node degree distribution of the sandstone pore network is shown in Figure 3. P ( k ) represents the proportion of all degree distributions in the whole network when the degree distribution is k . Figure 3 shows that 80% of the network nodes had degrees less than or equal to 3, and those with degrees equal to 3 accounted for more than 50% of the total nodes. This indicates that the permeability would be significantly affected only when the nodal degree distribution value was at a certain intermediate value. The nodes with a larger degree significantly reduced the average shortest path of the network, while the nodes with a smaller degree expanded the coverage of the seepage network.
The network clustering coefficient is used to measure the clustering of network nodes. The clustering coefficient of a node is the ratio of the number of edges of the node to the maximum number of edges of adjacent nodes, which can be expressed as
C i = 2 E i k i ( k i 1 )
where k i is the number of nodes connected node i and E i is the actual number of edges between k i nodes. The clustering coefficient of all the network C is the average of the clustering coefficients of all the nodes C = 1 N i = 1 N C i .
The distribution of the clustering coefficients is shown in Figure 4. It can be seen from Figure 4 that the percentage of nodes in the penetration network with a clustering coefficient of 1 was greater than 70%, and the average clustering coefficient of the whole network was 0.799. It can be seen from the seepage network that any three intersecting fractures could form a loop. Obviously, this network was a ring network [11]. It can be seen from the nature of the network structure that the ring network had a high flow point, which means that the network was not easy to disconnect under the action of external forces.
The above study shows that seepage is a small world network. The average distance of the seepage network was small ( d = 5.720 ) , but the average clustering coefficient was large ( C = 0.799 ) .

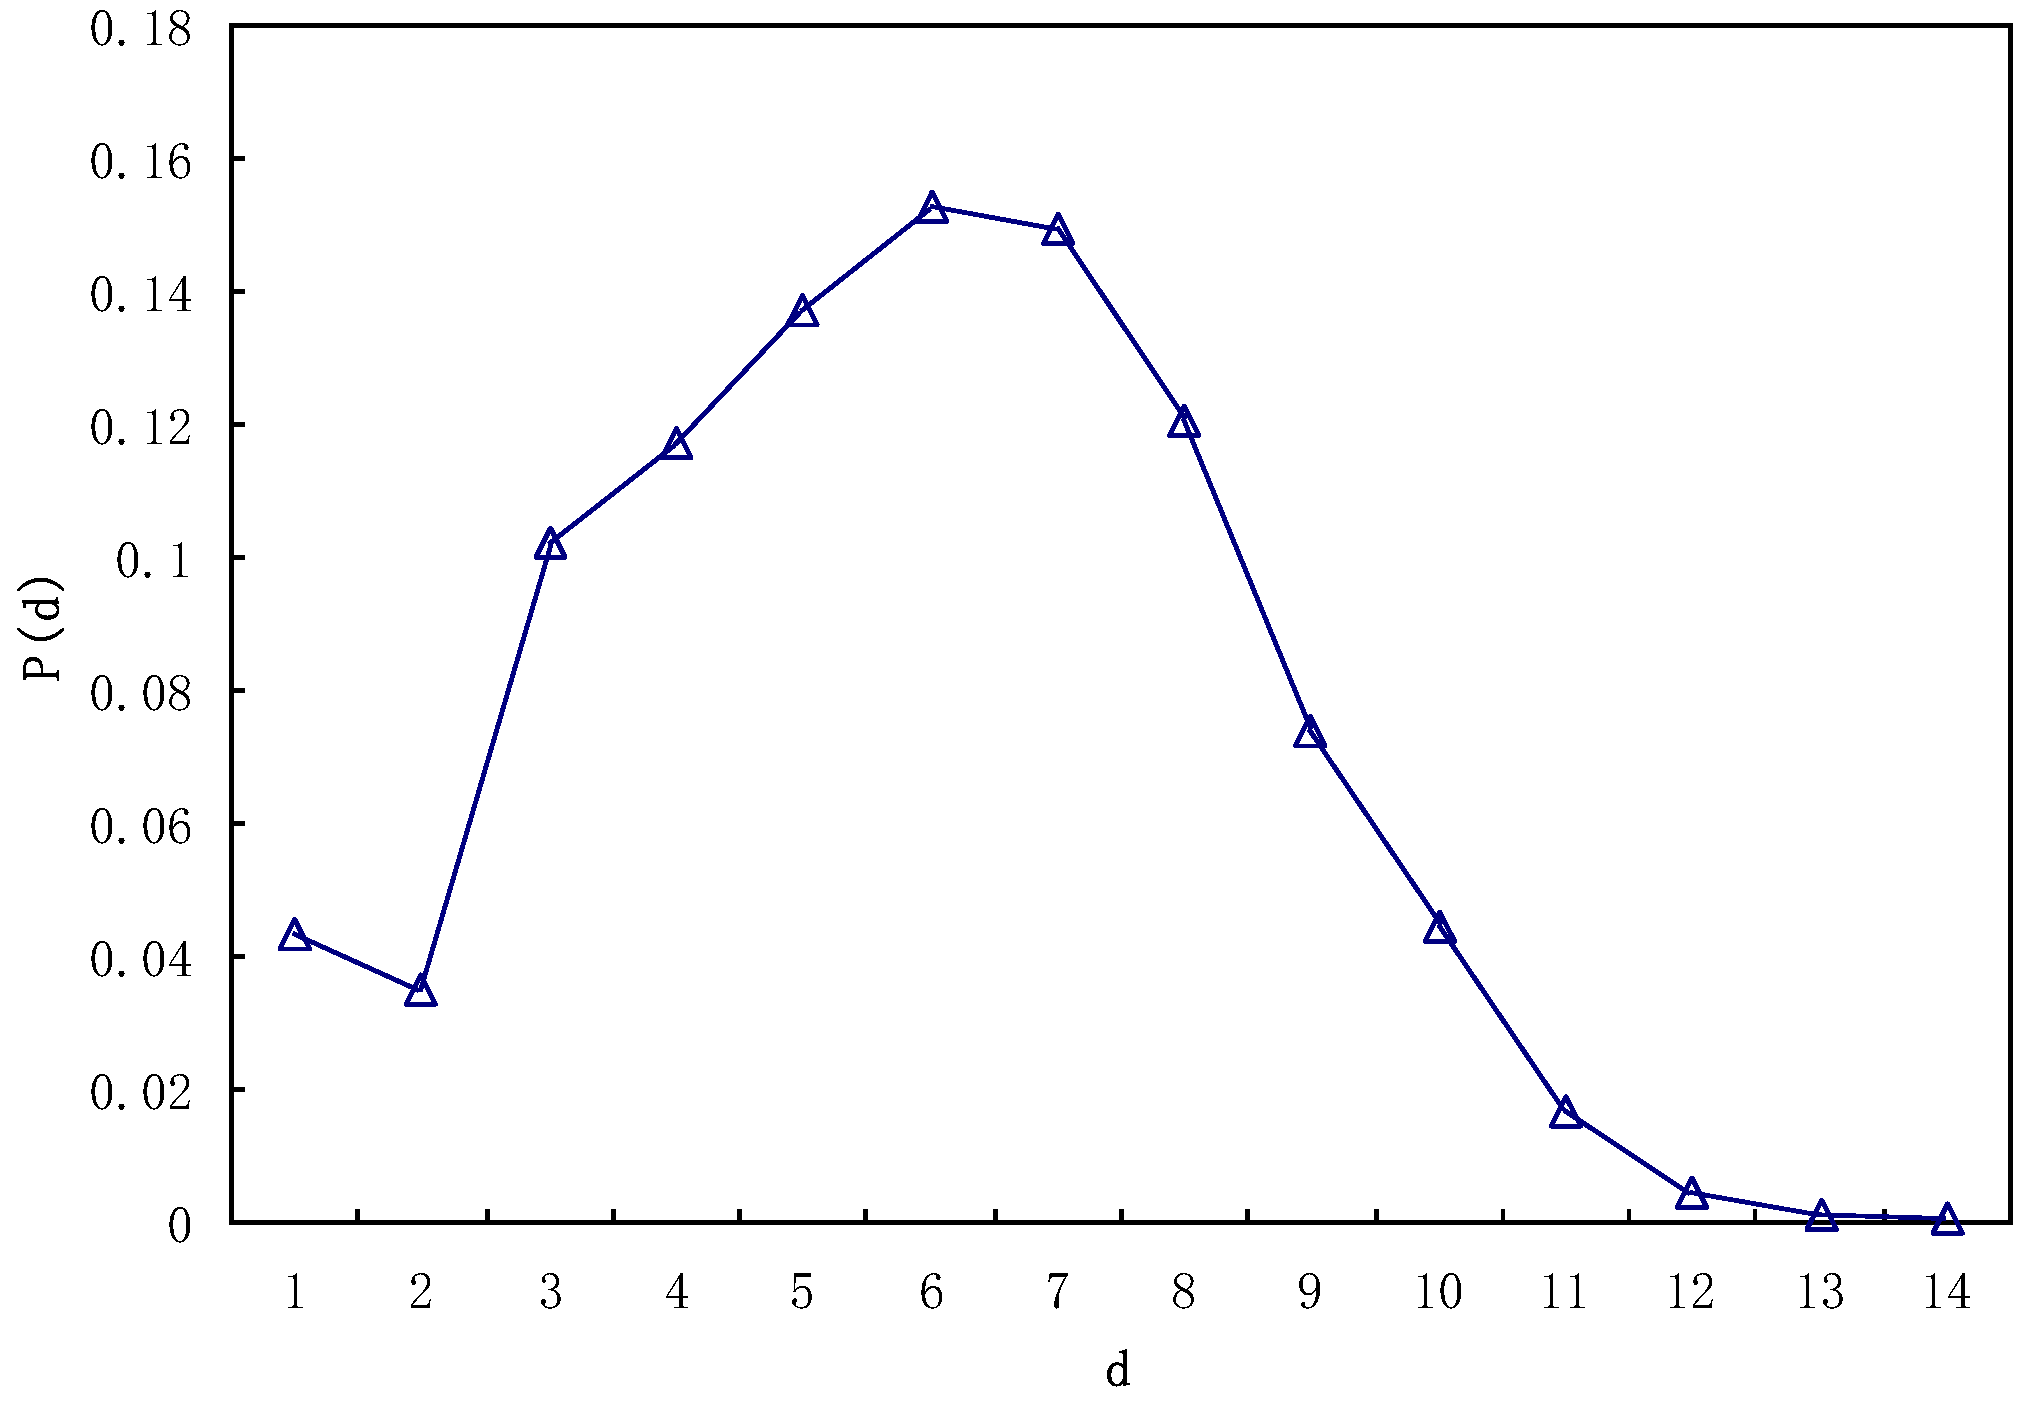
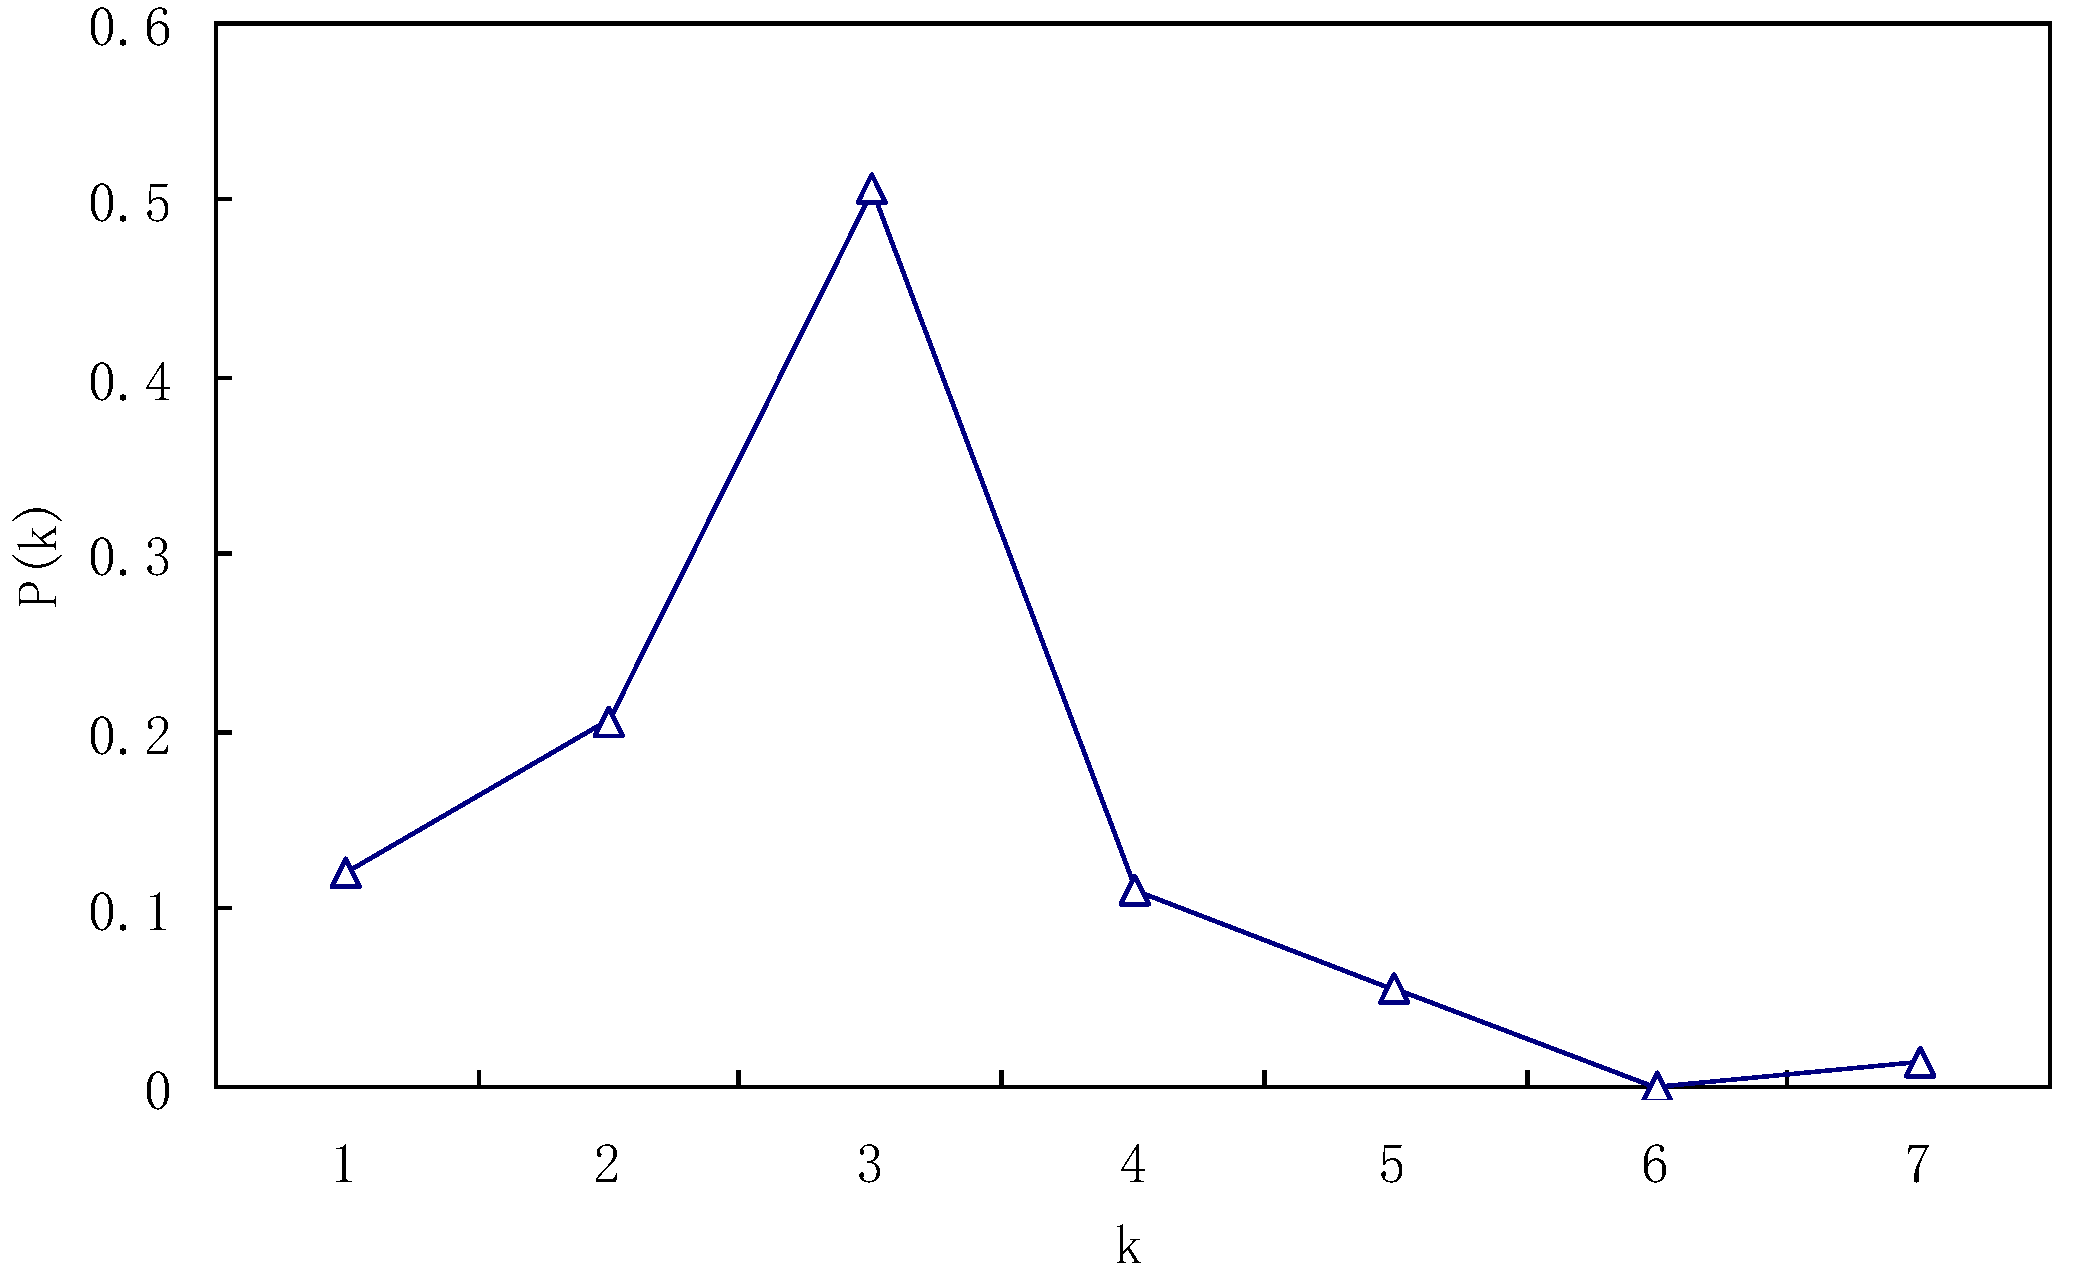
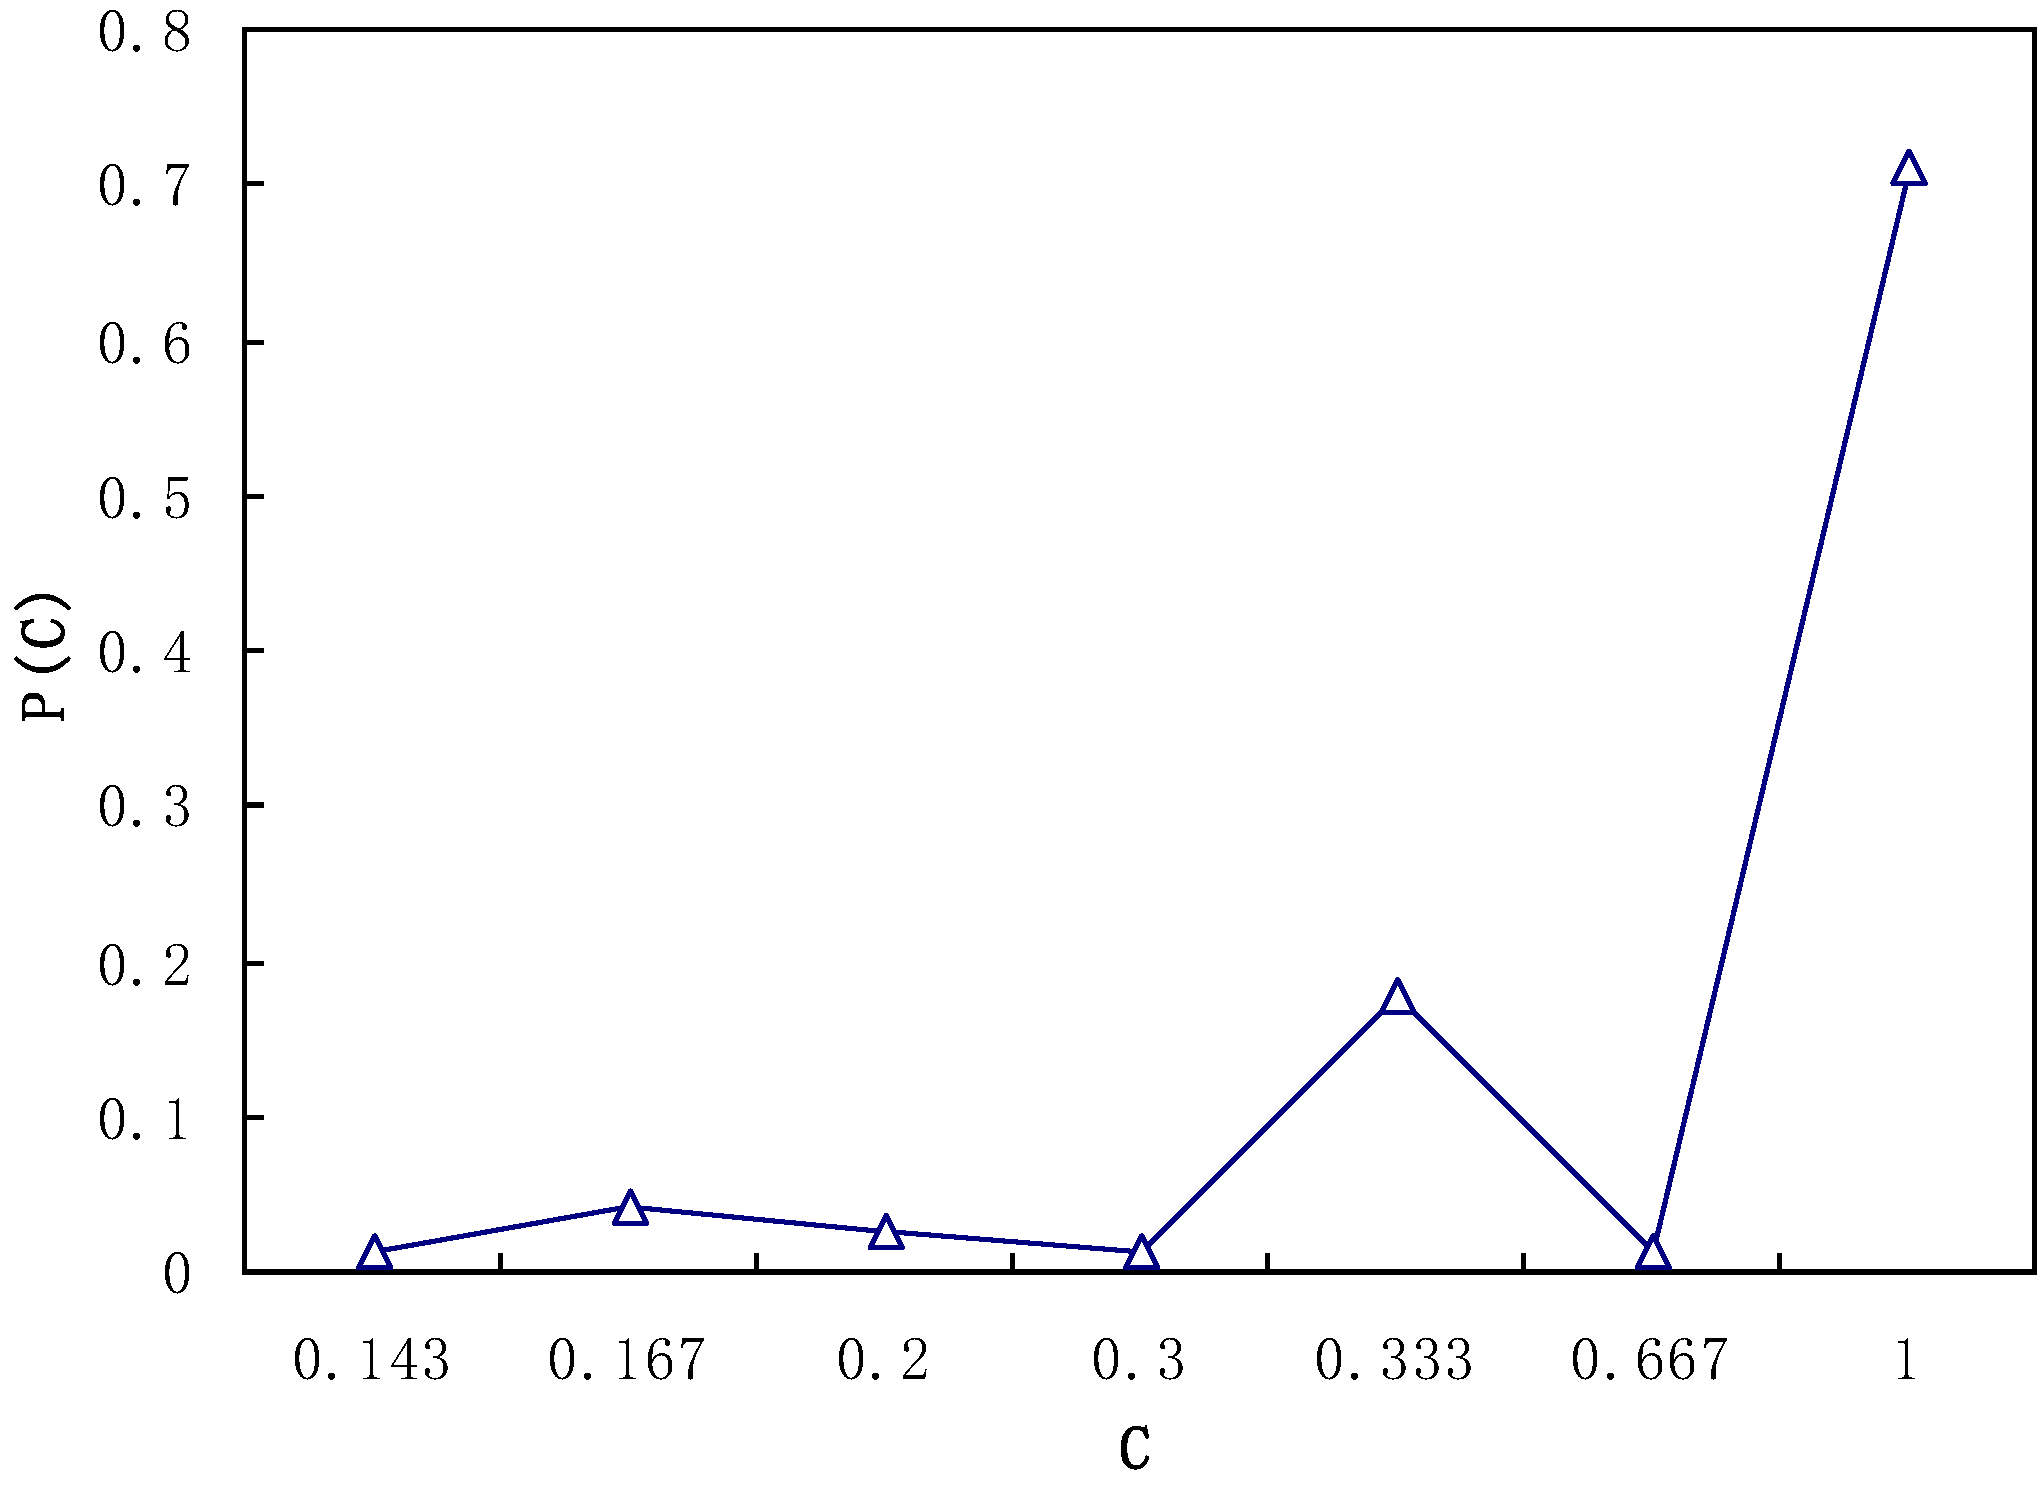
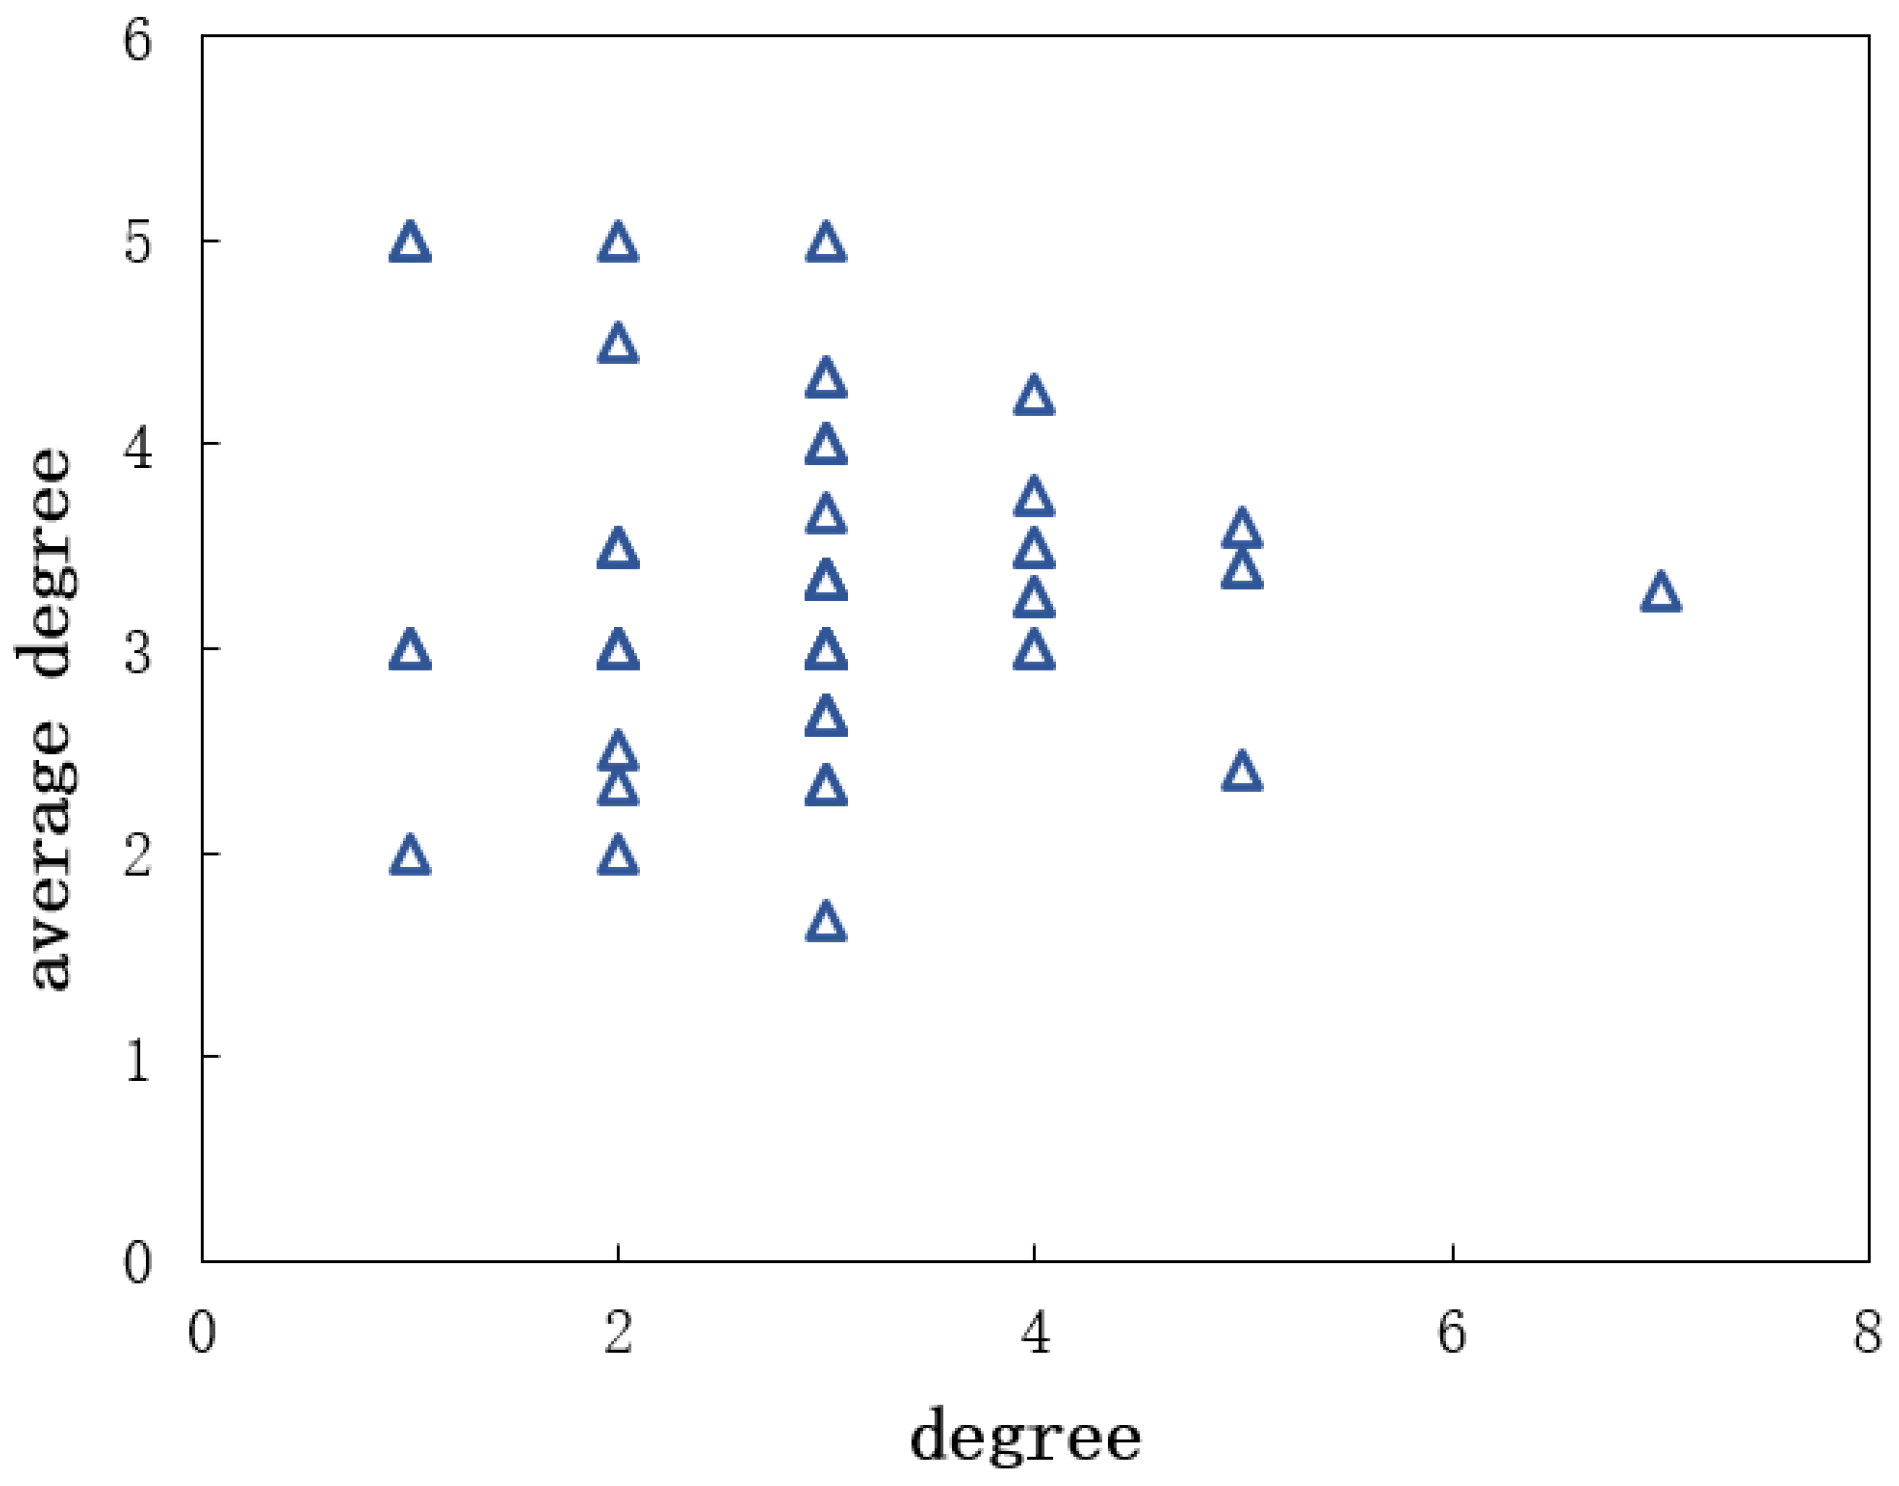
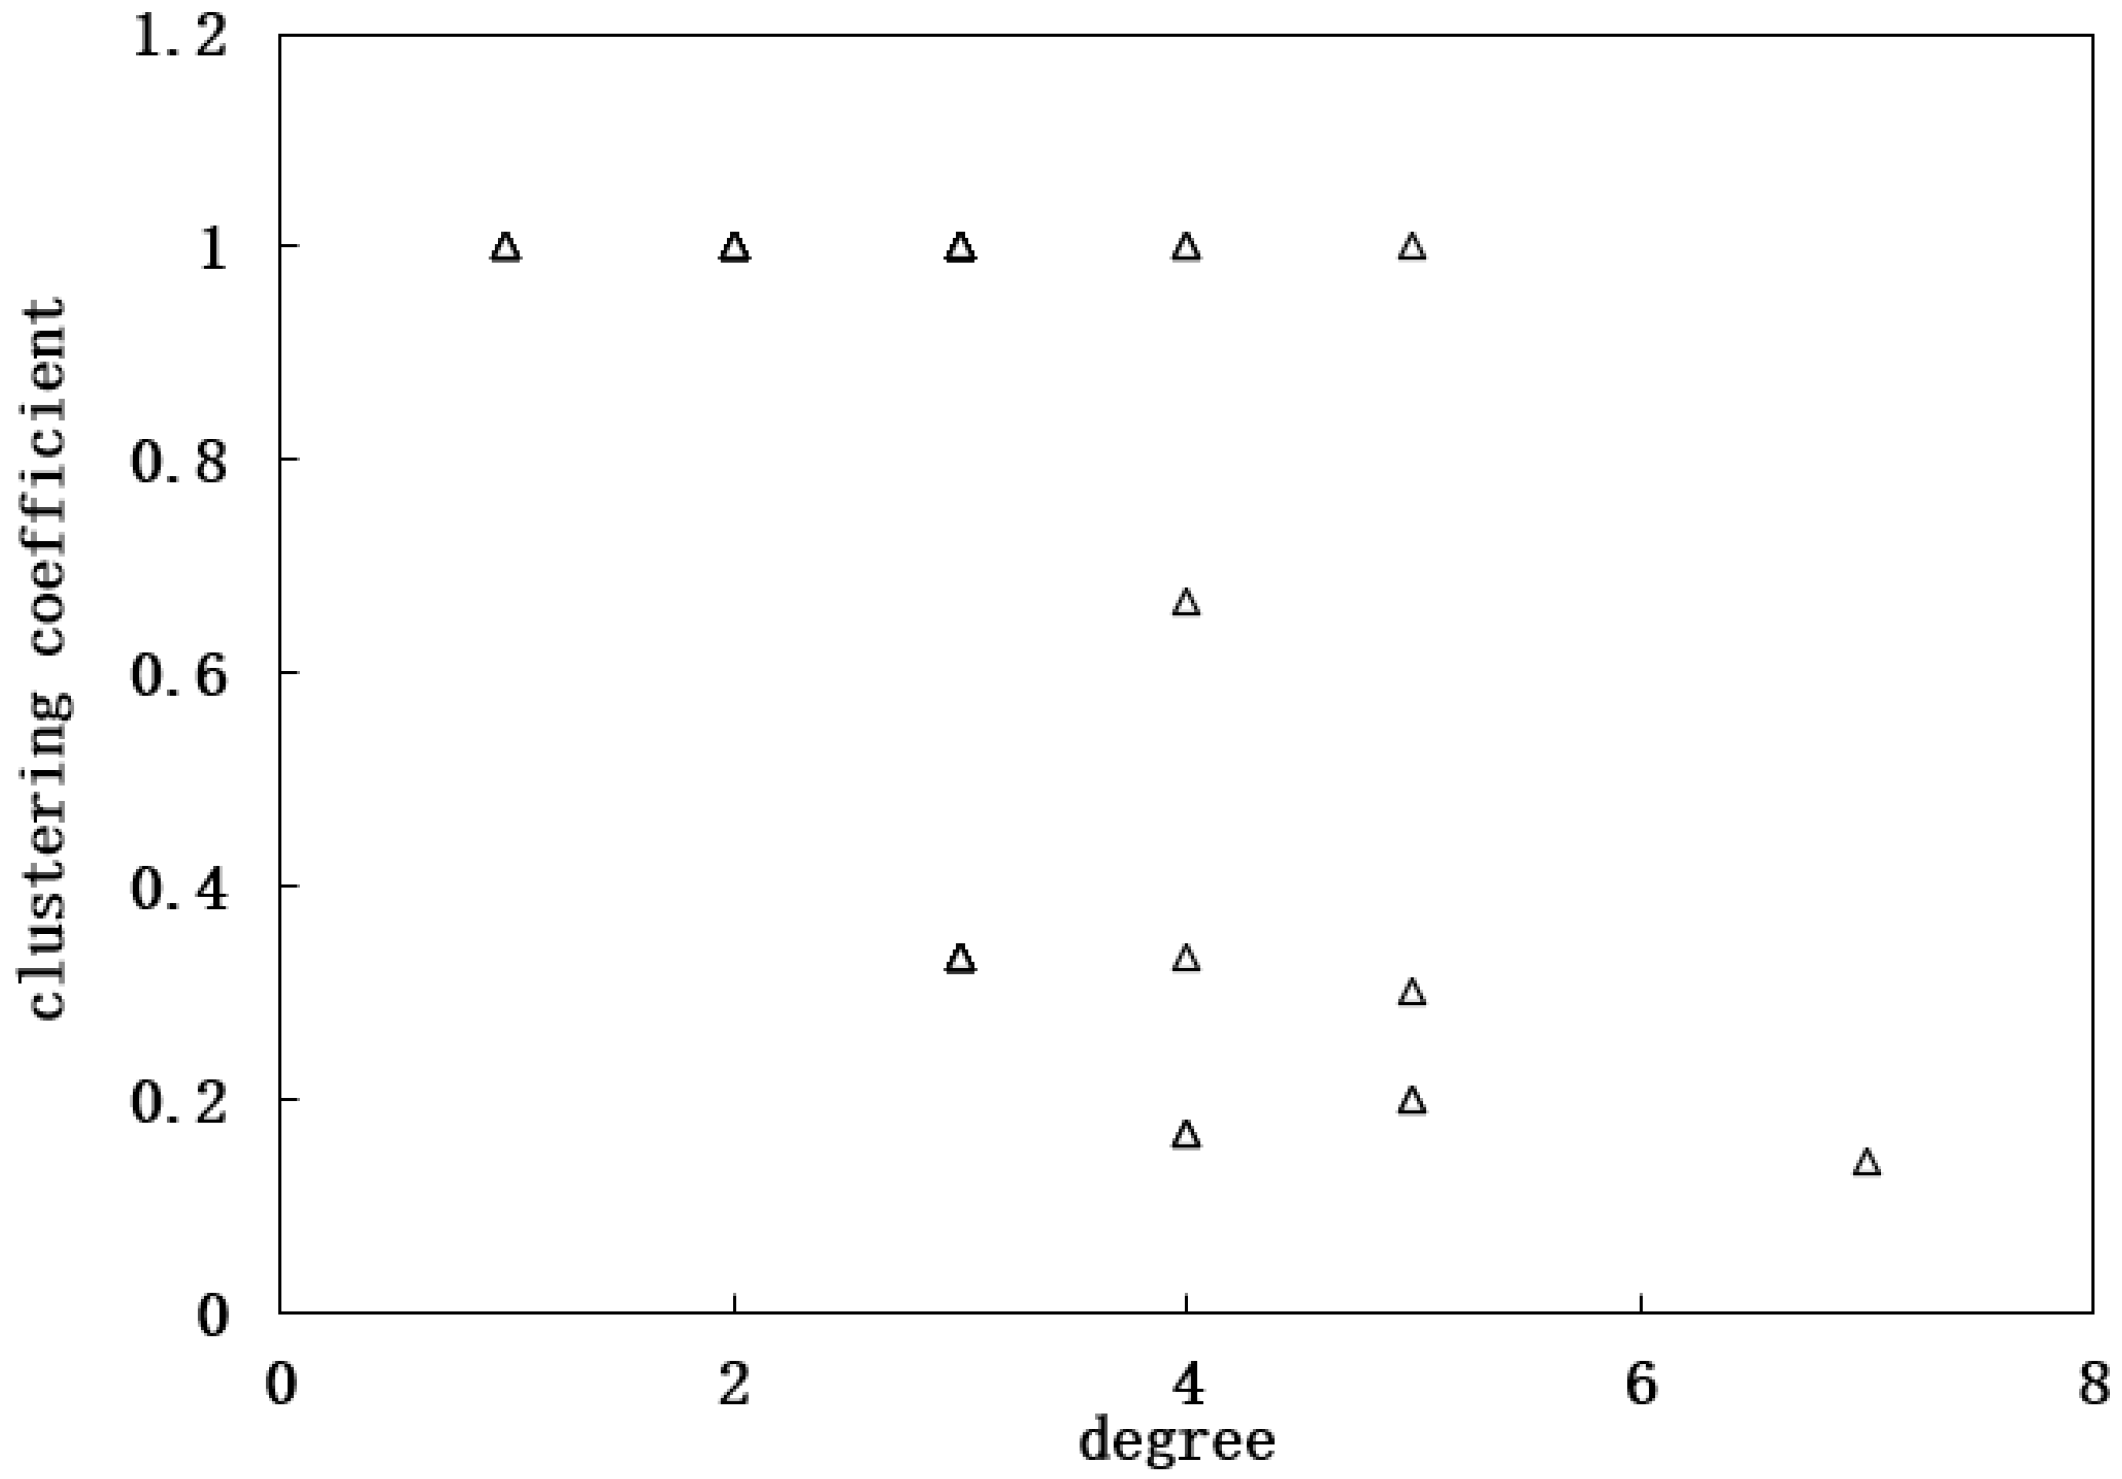
3. Results and Discussion

In order to describe the structure of the network more comprehensively, it is necessary to further study the nodes and the level of the clustering degree. The average degree of all adjacent nodes connected to node i can be expressed as
k n n , i = 1 k i j v ( i ) k j
Therefore, the average degree of all adjacent nodes connected to the nodes whose degree is k can be written as
k n n ( k ) = 1 N k i , k i = k k n n , i
where N k is the number of the nodes whose degree is k . The relation of the nodes is their preference of mutually choosing [12]. If k n n ( k ) is increasing along with k (i.e., the nodes with large degrees can connect to other nodes with large degrees too preferentially), then the network has a positive correlation. The Pearson correlation coefficient can be used to quantitatively judge network correlation [13], which can be expressed as
r = M 1 j i k i [ M 1 1 2 ( j i + k i ) ] 2 M 1 1 2 ( j i 2 + k i 2 ) [ M 1 1 2 ( j i + k i ) ] 2
where j i and k i are the degrees of two endpoints of the i edge, i = 1 , , M , the number of edges in network is M and 1 r 1 . When r > 0 , the network has a positive correlation. When r < 0 , the network has a negative correlation. When r = 0 , the network has no correlation. The Pearson related coefficient of the nodes in network r = 0.098 ; that is, the seepage network did not show an obvious relationship, as shown in Figure 5.
In this paper, the percolation network was a small network [14] (i.e., the total number of nodes was small), and more than 50% of the nodes’ degrees were equal to 3. The middle interval of degrees had more nodes than other intervals. The nodes with higher degrees and nodes with lower degrees had more connections, depending on the size and characteristics of the network. Different fracture numbers and distributions of the internal rocks would lead to different correlations of the nodes in network. It should be noted that a large amount of empirical data and further studies are needed to determine whether this distinction can characterize the seepage capacities of rocks with different fracture degrees.
The correlation of degree refers to the relationship between the average clustering coefficient and node degree. The research shows that the clustering coefficient of the nodes in the real network presents an obvious power law decreasing trend with the increase in nodes [15], while the clustering coefficient of a certain network presents a certain power law decreasing trend with the increase in the change degree. The relationship between the node clustering coefficient and degree is shown in Figure 6. It can be seen from Figure 6 that the pore network had no obvious correlation.

4. Conclusions

Based on complex network theory, this study analyzed the topological characteristics of a sandstone pore network. The results show that the sandstone pore network, taking the fracture intersection as nodes, was a small world network. It had a shorter average path length and bigger clustering coefficient. This kind of network has higher security and shows that the material under the external force can better ensure the seepage ability. The clustering coefficient and degree had no obvious correlation. The permeability was mainly determined by nodes of a medium degree, while the nodes of a large degree and small degree had no significant influence on the permeability.

Author Contributions

Conceptualization, Y.H.; methodology, J.Z.; software, J.Z.; formal analysis, J.G. and D.Y.; investigation, Q.J.; writing—original draft preparation, Y.H.; writing—review and editing, G.L. and Q.J.; supervision, D.Y.; data curation, J.G. and H.L.; funding acquisition, G.L.; software, H.L. All authors have read and agreed to the published version of the manuscript.

Funding

This work was supported by the Foundation of Key Laboratory of Deep Earth Science and Engineering (Sichuan University) (Grant No. DESE 202103).

Institutional Review Board Statement

Not appilable.

Informed Consent Statement

Not appilable.

Data Availability Statement

Not appilable.

Acknowledgments

This work was supported by the Foundation of Key Laboratory of Deep Earth Science and Engineering (Sichuan University) (Grant No. DESE 202103).

Conflicts of Interest

The authors declare no conflict of interest.

References

  1. Jimenez-Hornero, F.J.; Ariza-Villaverde, A.B.; de Ravé, E.G. Multifractal Description of simulated flow velocity in idealised porous media by using the sandbox method. Fractals 2013, 21, 157–169. [Google Scholar] [CrossRef]
  2. Mohammadpour, R.; Ghani, A.A.; Azamathulla, H.M. Numerical modeling of 3-D flow on porous broad crested weirs. Appl. Math. Model. 2013, 37, 9324–9337. [Google Scholar] [CrossRef]
  3. Hajizadeh, A.; Safekordi, A.; Farhadpour, F.A. A multiple-point statistics algorithm for 3D pore space reconstruction from 2D images. Adv. Water Resour. 2011, 34, 1256–1267. [Google Scholar] [CrossRef]
  4. Civan, F.; Rai, C.S.; Sondergeld, C.H. Shale-gas permeability and diffusivity inferred by improved formulation of relevant retention and transport mechanisms. Transp. Porous Media 2011, 86, 925–944. [Google Scholar] [CrossRef]
  5. Zhang, T.Y.; Li, D.L.; Yang, J.Q. A study of the effect of pore characteristic on permeability with a pore network model. Pet. Sci. Technol. 2013, 31, 1790–1796. [Google Scholar] [CrossRef]
  6. Yang, J.; Jiangtao, Z.; Marcelo, E. 3D numerical reconstruction of well-connected porous structure of rock using fractal algorithms. Comput. Methods Appl. Mech. Eng. 2014, 279, 212–226. [Google Scholar]
  7. Shaina, K.; Hesham, E.; Carlos, T. Assessing the utility of FIB-SEM images for shale digital rock physics. Adv. Water Resour. 2015, 18, 1350006. [Google Scholar]
  8. Watts, D.J.; Strogatz, S.H. Collective dynamics of ‘small-world’ networks. Nature 1998, 393, 440–442. [Google Scholar] [CrossRef]
  9. Barabási, A.L.; Albert, R. Emergence of scaling in random networks. Science 1999, 286, 509–512. [Google Scholar] [CrossRef] [PubMed] [Green Version]
  10. Li, H.; Yuan, L. A Kind of Deterministic Small-World Network Derived from Polygonal Nesting. Appl. Mech. Mater. 2014, 614, 543–549. [Google Scholar] [CrossRef]
  11. Amartya, S.; Bryan, R.L.; Gaurav, J. The long-range interaction landscape of gene promoters. Nature 2012, 389, 109–113. [Google Scholar]
  12. Jiang, Z.Y.; Liang, M.G.; Li, Q. Optimal dynamic bandwidth allocation for complex networks. Phys. A Stat. Mech. Its Appl. 2013, 392, 1256–1262. [Google Scholar] [CrossRef]
  13. Huang, D.Z. Research on Reservoir Parameters and Characterization of Continental Tight Sandstone. Ph.D. Thesis, Chengdu University of Technology, Chengdu, China, 2009. [Google Scholar]
  14. Strogatz, S.H. Exploring complex networks. Nature 2001, 410, 268–276. [Google Scholar] [CrossRef] [PubMed] [Green Version]
  15. Quezada, G.R.; Toledo, P.G.; Saavedra, J.H.; Rozas, R.E. Generation of Spatially Correlated Network Models of Porous Media. Transp. Porous Media 2015, 111, 499–515. [Google Scholar] [CrossRef]
Figure 1. Sandstone slice under scanning electron microscope (single polarized × 25).
Processes 10 00211 g001
Figure 2. Sandstone pore network’s shortest path distribution.
Processes 10 00211 g002
Figure 3. Sandstone pore network’s node degree distribution.
Processes 10 00211 g003
Figure 4. Distribution of sandstone pore network’s clustering coefficient.
Processes 10 00211 g004
Figure 5. The relationship of the degrees of all the nodes and the average degree of their adjacent nodes.
Processes 10 00211 g005
Figure 6. The relationship of the node and the clustering coefficient.
Processes 10 00211 g006
Publisher’s Note: MDPI stays neutral with regard to jurisdictional claims in published maps and institutional affiliations.

