Article

An Artificial Neural Network Model to Predict Efficiency and Emissions of a Gasoline Engine

1
Power Machinery and Vehicular Engineering Institute, College of Energy Engineering, Zhejiang University, Hangzhou 310027, China
2
Beijing Power Machinery Research Institute, Beijing 100074, China
3
Mechanical Engineering Department, Zhejiang University City College, Hangzhou 310015, China
*
Author to whom correspondence should be addressed.
Processes 2022, 10(2), 204; https://doi.org/10.3390/pr10020204
Submission received: 13 December 2021 / Revised: 16 January 2022 / Accepted: 19 January 2022 / Published: 21 January 2022
(This article belongs to the Special Issue Advanced Combustion and Combustion Diagnostic Techniques)

Abstract

:
With global warming, and internal combustion engine emissions as the main global non-industrial emissions, how to further optimize the power performance and emissions of internal combustion engines (ICEs) has become a top priority. Since the internal combustion engine is a complex nonlinear system, it is often difficult to optimize engine performance from a certain factor of the internal combustion engine, and the various parameters of the internal combustion engine are coupled with each other and affect each other. Moreover, traditional experimental methods including 3D simulation or bench testing are very time consuming or expensive, which largely affects the development of engines and the speed of product updates. Machine learning algorithms are currently receiving a lot of attention in various fields, including the internal combustion engine field. In this study, an artificial neural network (ANN) model was built to predict three types of indicators (power, emissions, and combustion phasing) together, including 50% combustion crank angle (CA50), carbon monoxide (CO), unburned hydrocarbons (UHC), nitrogen oxides (NOx), indicated mean effective pressure (IMEP), and indicated thermal efficiency (ITE). The goal of this work was to verify that only one machine learning model can combine power, emissions, and phase metrics together for prediction. The predicted results showed that all coefficients of determination (R2) were larger than 0.97 with a relatively small RMSE, indicating that it is possible to build a predictive model with three types of parameters (power, emissions, phase) as outputs based on only one ANN model. Most importantly, when optimizing the powertrain control strategy of a hybrid vehicle, only a surrogate model can help establish the relationship between the input and output parameters of the whole engine, which is the need of the future research. Overall, this study demonstrated that it is feasible to integrate three types of combustion-related parameters in a single machine learning model.

1. Introduction

The rapid development of the automobile industry has greatly contributed to the economic development and modernization of China but at the same time has also brought about energy supply tension and environmental pollution problems [1,2]. Therefore, the development of efficient and low-pollution advanced combustion technology has become the main goal of the internal combustion engine industry and researchers [3,4]. Meanwhile, the decarbonized energy revolution requires innovation in various powertrains such as gas turbine combustor [5,6] and advanced engine technologies such as in-cylinder thermal barrier coatings [7,8]. It needs different kinds of alternative fuels (i.e., biofuel [9,10], natural gas [11,12], and ethanol [13,14]). So much work needs a fast and effective tool to enhance research and development efficiency [15,16]. Nowadays, engine research and development are mainly based on 3D CFD simulations and bench tests, but they are time consuming or expensive [17,18]. Machine learning is one highly effective method to improve the speed of product development and has been used in various fields, such as building [19,20], energy [21,22], environment [23,24], and geography [25]. The previous results showed that the predictions of ML models were good and better accelerated the progress of research in various fields [26,27]. In addition, artificial intelligence-based engine system optimization has a promising future in significantly improving engine performance, while it also provides a basis for improving traditional model-based-design (MBD) [28,29]. Hence, the application of machine models into the engine field is to help further improve the efficiency of engine development [30,31].
Table 1 shows that researchers have used different machine learning algorithms to make predictions of the relevant parameters of the engine, and the results indicated that the overall predictive performance of the machine learning algorithms are good. However, there may be cases where a certain algorithm is not applicable under certain operating conditions; for example, the KNN algorithm does not predict well in the case of uneven samples [32]. In addition, most studies have applied ANN to predict engine response and essentially to predict one particular class of parameters, such as power, emissions, or combustion characteristics, individually [33,34]. This was probably because the basic units of ANN are neurons that can better describe the parameters related to chain chemical reactions, and combustion parameters fall into this category [35,36]. An ANN model can be widely used in different areas since support vector regression (SVR) requires very high computational cost and the random forest (RF) model cannot forecast responses well for the boundary data [37,38]. Hence, in this paper, the ANN model is chosen to predict the relevant parameters of the engine [39]. Meanwhile, it can be found that the literature on the integration of these three types of parameters into a single ML model for prediction is limited. However, only one surrogate model is requested to replace the whole engine combustion characteristics (including efficiency and emissions) inside the powertrain design software (such as ADVISOR), which is used to optimize the powertrain control strategy of the hybrid vehicle in the future work. Therefore, the purpose of study was to demonstrate that it is feasible to integrate the three types of parameters into a single ANN model and evaluate ML model predictive performance with statistical indicators.
In this study, a single artificial neural network (ANN) was applied to predict three types of engine metrics (power, emission, and phase) together, including CA50, CO, HC, NOx, IMEP, and ITE, using speed, intake pressure, and spark timing as input parameters. The learning effect of the nonlinear relationship between the input and output parameters of this correlation model was also evaluated under different operating conditions. The main statistical metrics R2 and RMSE were used to evaluate the model prediction performance [49,50]. Most importantly, the results indicated that it is possible to integrate the three types of parameters into one ANN model for prediction, which demonstrated that it is feasible to simulate the input–output relationship of multiple classes of engine parameters using only one surrogate model [51,52].
The rest of the paper is as follows: Section 2 contains a description of the numerical modeling, test operating conditions, the introduction of the principle of the ANN model, the way of dividing the dataset, and the description of statistical indicators; Section 3 showed the predictive performance of the ANN model and discussed the results. Section 4 summarized the work of this paper and stated the main conclusions.

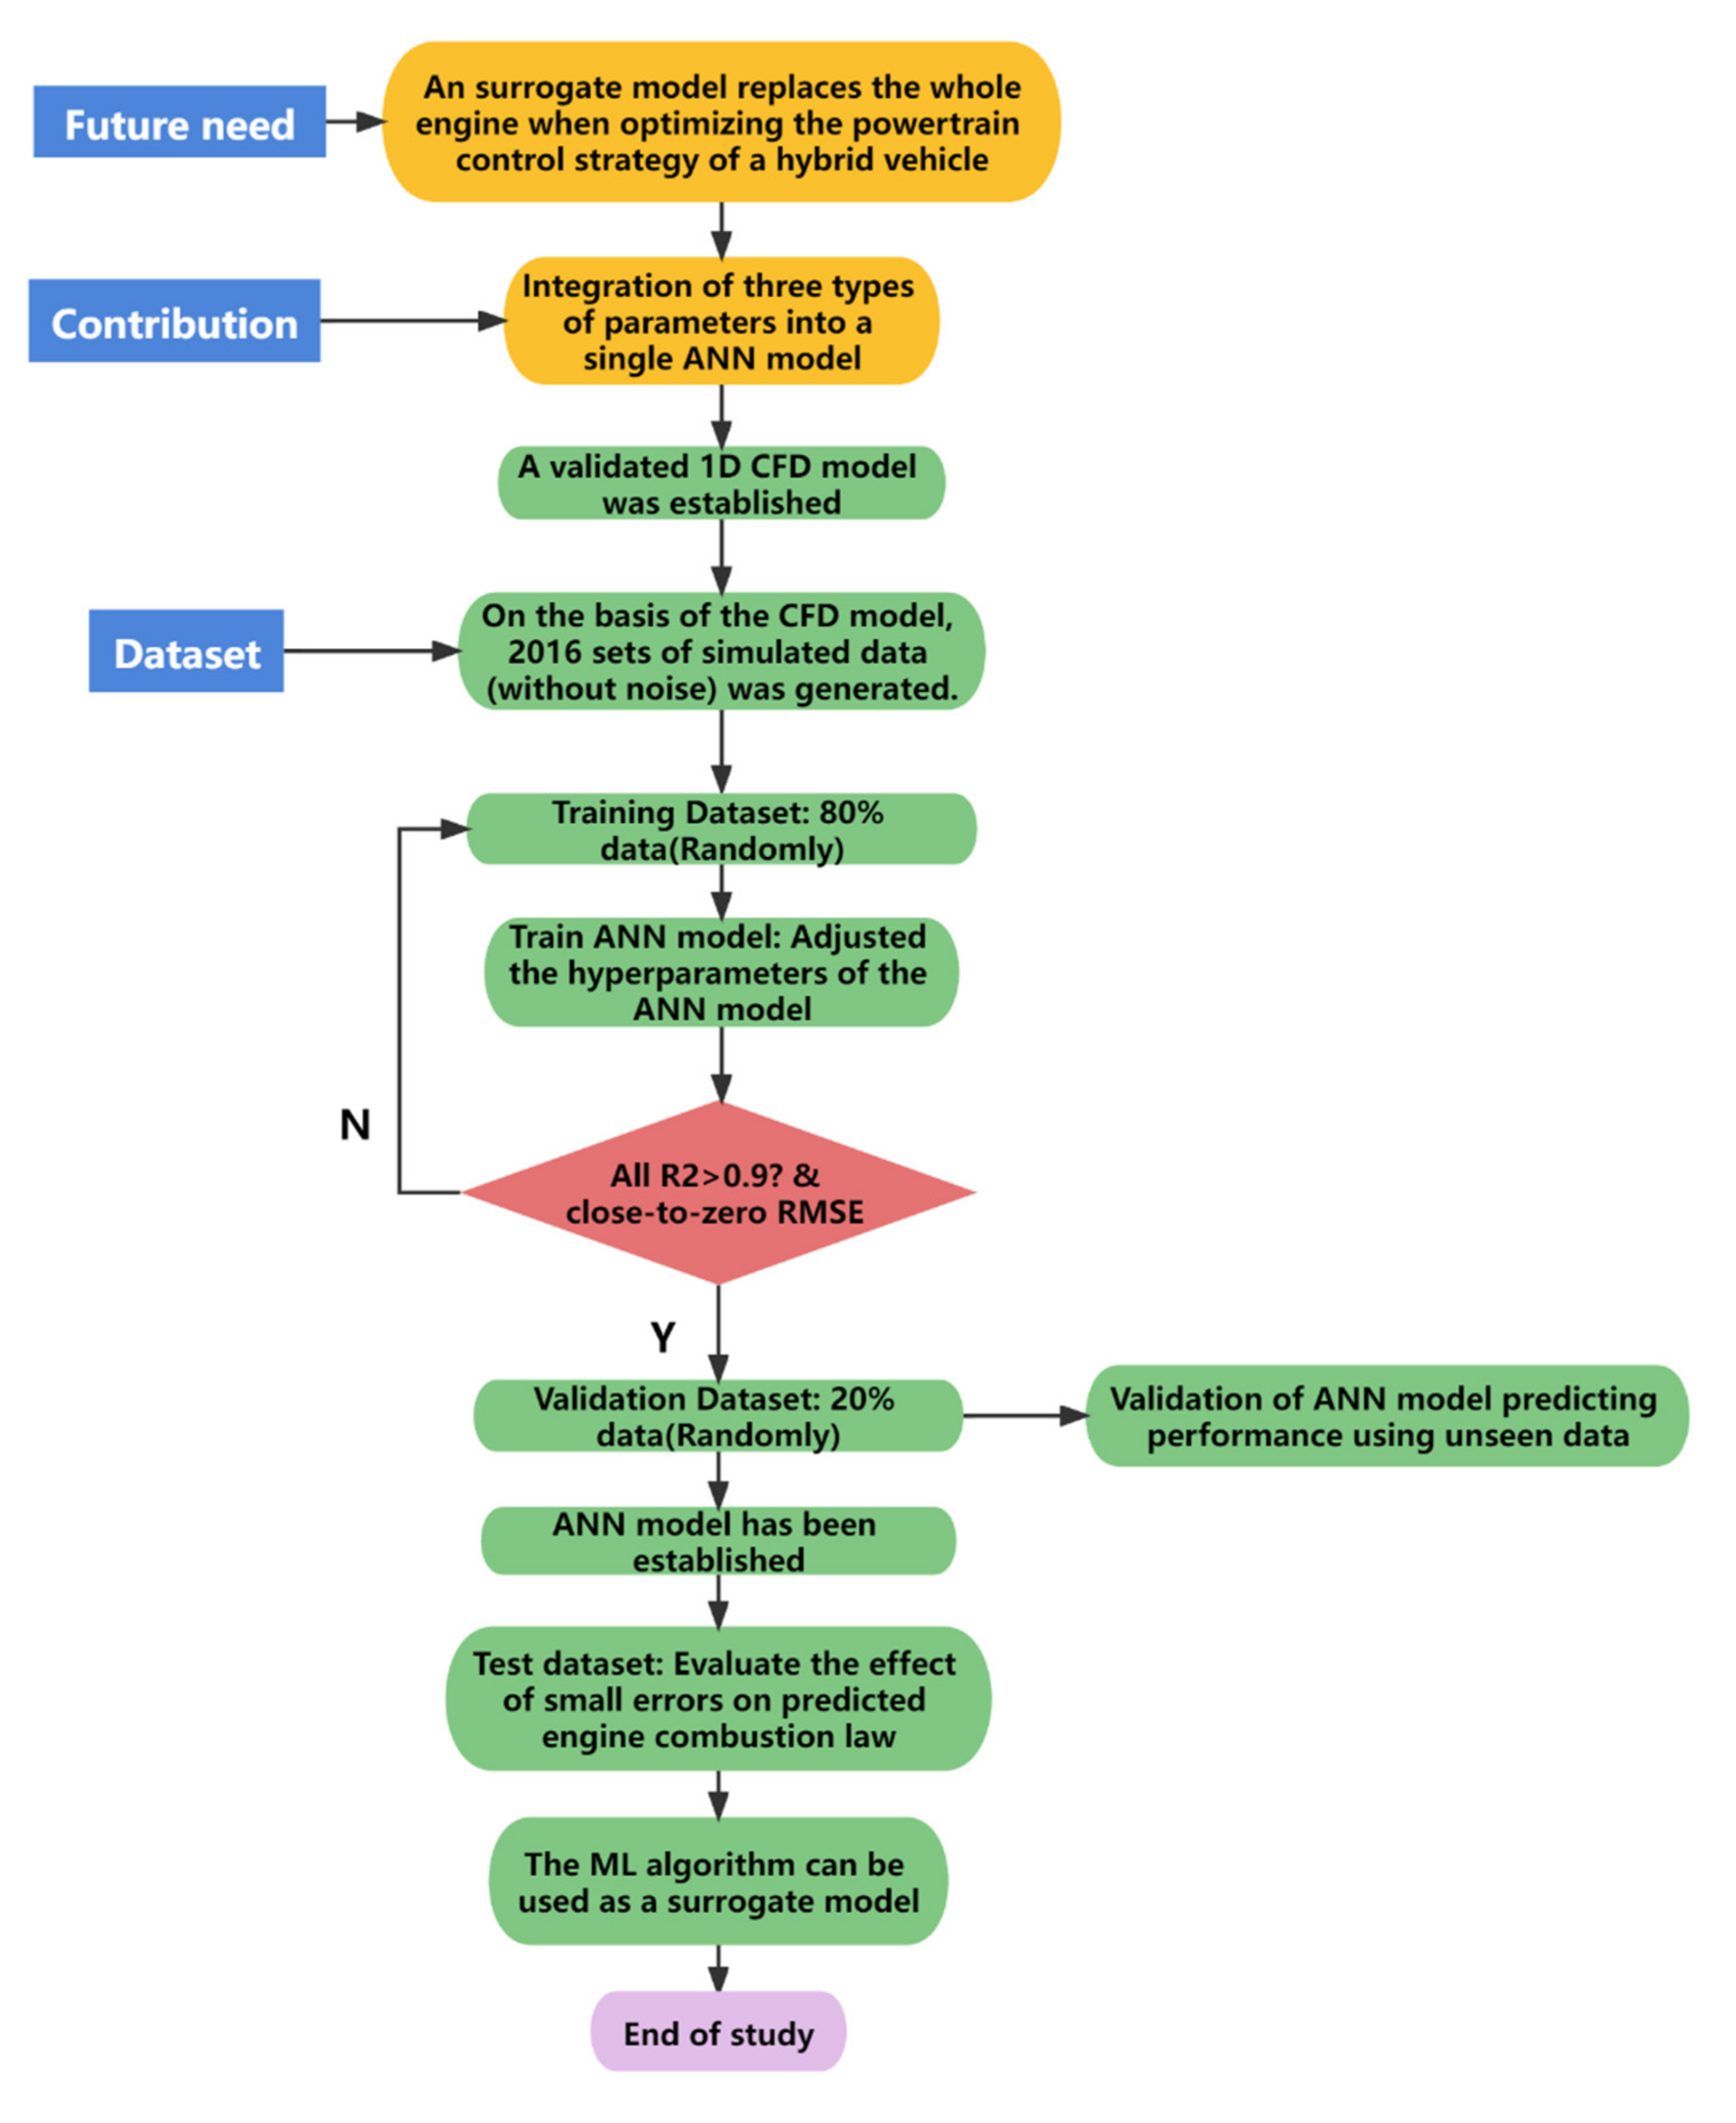
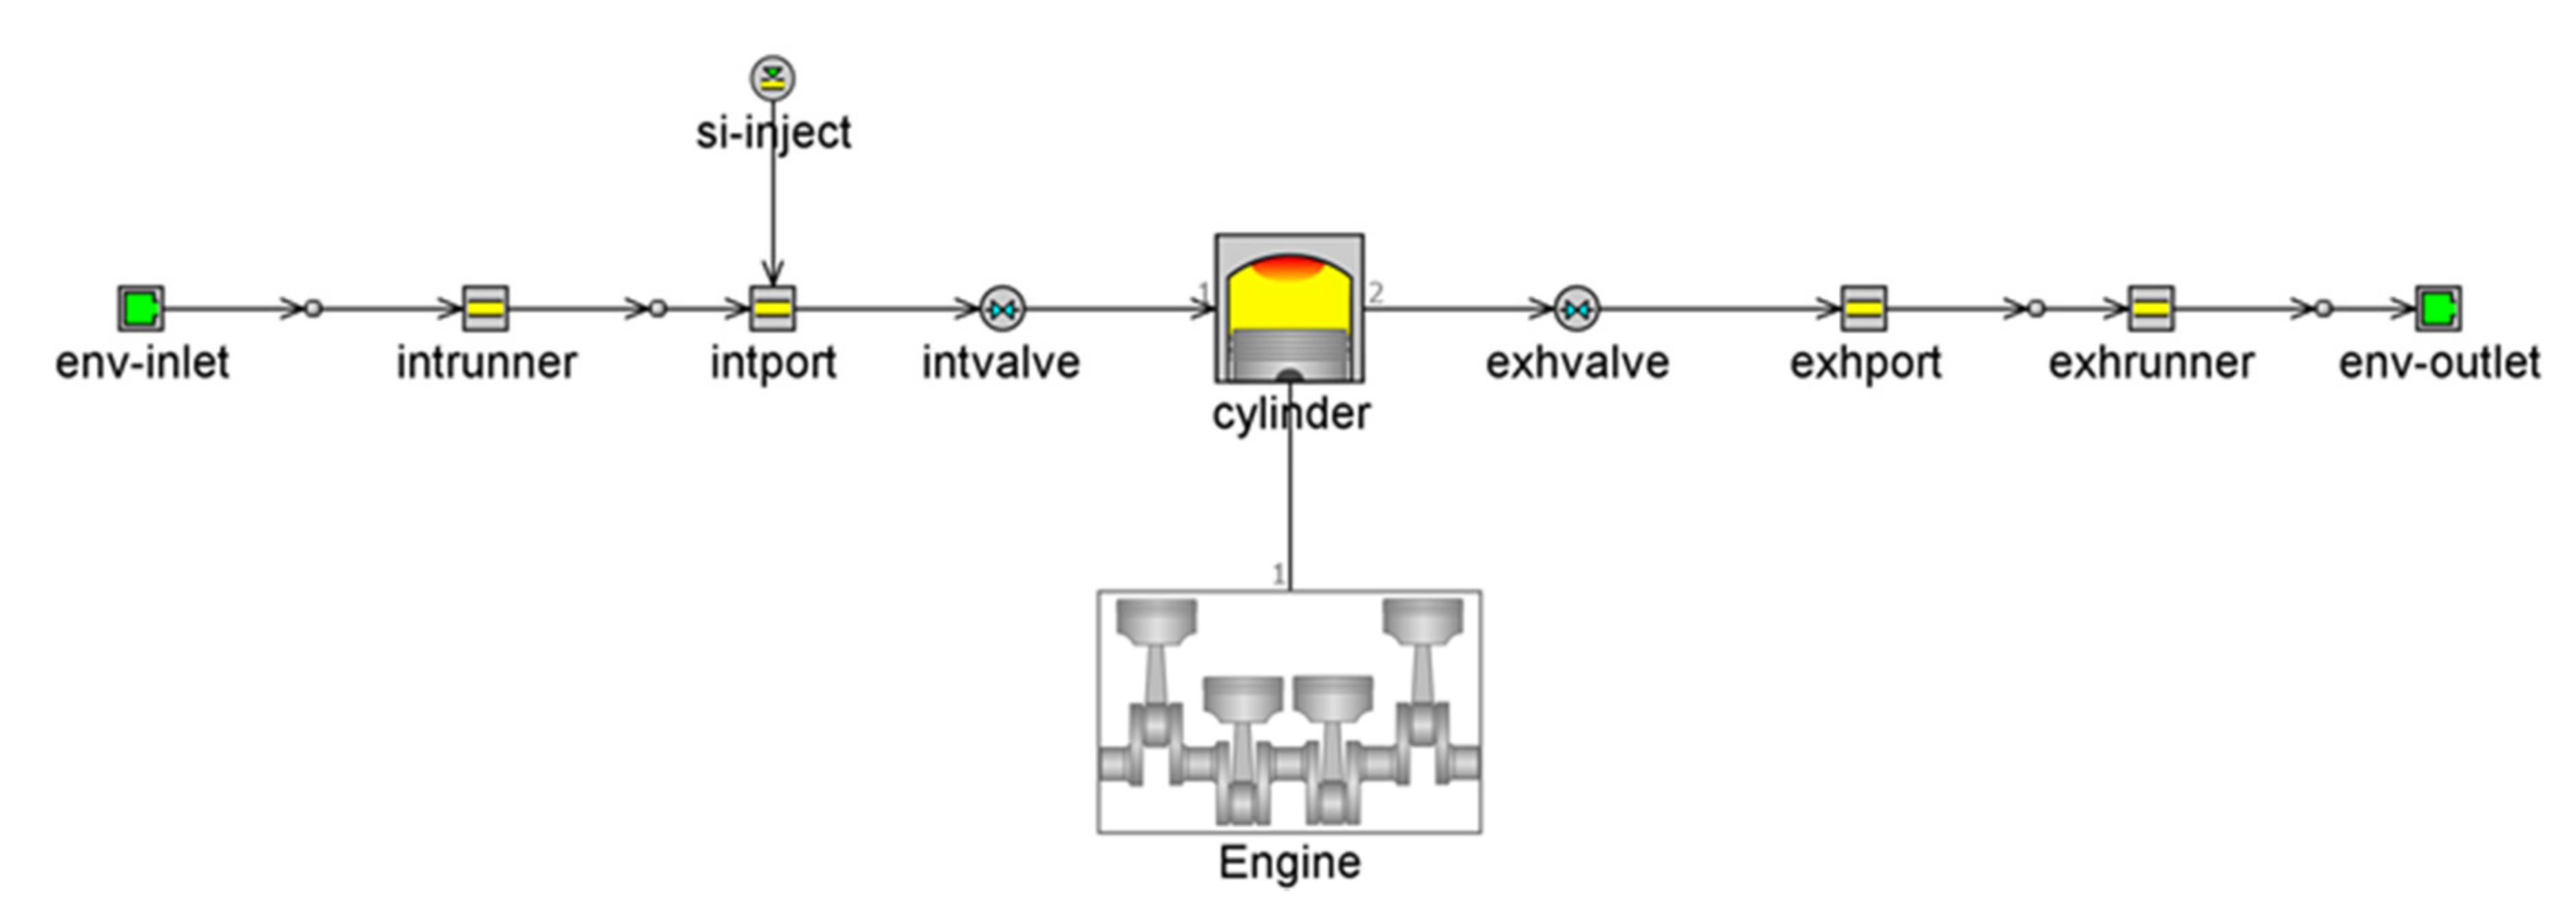
2. Materials and Methods

A single-cylinder gasoline engine with spark ignition (SI) and port fuel injection (PFI) was used to obtain experimental data. A validated one-dimensional (1D) CFD model was built based on GT-power 2016 software, which can simulate the engine responses under various operating conditions. The engine has a compression ratio of 9.5, a connecting rod length of 175 mm, and a bore and stroke of approximately 86 mm. More details can be found in Table 2, and the CFD model is shown in Figure 1. In addition, ref. [31] provides details of 1D model calibration. As mentioned in the “Introduction” part, the CA50 (50% energy released crank angle), carbon monoxide (CO), unburned hydrocarbons (UHC), nitrogen oxides (NOx), indicated mean effective pressure (IMEP), and indicated thermal efficiency (ITE) were recorded based on the CFD model. The six parameters included three classes indicators (i.e., power, emissions, and combustion phasing). In total, about 2000 sets of data were collected with the input parameters ST, speed, and torque (changed by intake pressure) to establish the ANN model used to predict engine responses. The inlet pressure has six different sets of values ranging from 0.5 to 1, and the distribution is equally spaced. For the engine speed selection, the range of variation is 1000–4000 rpm, with a total of 16 different sets of values and an interval of 200 rpm. Since the MBT of the engine is different under each operating condition, the selected spark timing range should include all MBTs for all operating conditions to ensure predictive accuracy, so the spark timing range was selected larger, ranging from −40 to 0 CA ATDC.
Artificial neural networks are adaptive nonlinear dynamic systems consisting of a large number of simple basic components—neurons interconnected [19]. They can classify the data through the network’s own memory and analysis, and the accuracy of the model prediction results can be guaranteed through correlation processing. Moreover, the unique structure of neural network, adaptive learning, memory and strong error tolerance and robustness make it widely used in the field of engine prediction. The neural network can be combined with the engine condition monitoring system, which can improve itself according to the change information in real time as the monitoring system information is updated to ensure the accuracy of prediction. At the same time, it is suitable for the complexity of the engine working environment; it can not only analyze the change pattern of past engine performance parameters but also consider the external environment of the engine working and various related factors affecting the engine.
The internal combustion engine is a complex nonlinear system where the in-cylinder combustion is influenced by the combination of various factors (e.g., atmospheric pressure, valve timing, temperature, humidity), which also determine the engine power, emissions, and combustion phasing. Therefore, the research and application of neural network in the engine field has great potential. Neural network has self-learning ability, which can summarize the law from a large amount of data. In this study, a Levenberg–Marquardt back propagation (BP) neural network, which has been proven to be effective in predicting the relevant parameters of the engine in ref [53], was used for predicting the performance and emissions of a spark ignition engine. For the ANN model, the parameters are updated using the fastest gradient descent method, i.e., the parameters are updated in the opposite direction of the gradient, in a certain step size, so that the evaluation function reaches a minimal value. The process of building the ML model was mainly based on the neural network toolbox of MATLAB 2016, and the training epochs and learning rate of ANN model were set to 1000 and 0.001, respectively.
Among the many factors that affect the performance of neural networks, the structure has a significant impact on the prediction results. Therefore, in order to select a suitable ANN network structure, the R2 and RMSE based on three kinds of ANN structures (3-7-6, 3-7-7-6, 3-5-5-6) are compared in this study. The specific statistical values based on various neural network structures are shown in Table 3 and Table 4. The lowest R2 based on the 3-7-7-6 neural network structure ANN is ≈0.98, which is better than several other structures, and the RMSE is smaller for almost all metrics compared to other structures. Therefore, we choose the 3-7-7-6 ANN structure to predict engine responses due to its better generalization capability under the operating conditions investigated in this study.
The approximately 2000 sets of data generated based on the 1D CFD model were divided into two datasets. A randomly selected 80% of the data was used as the training dataset to train the ANN model on various parameters; then, the remaining 20% of points were used as the validation set, which could be used to validate the predictive performance of the ML model with these unseen data. Moreover, it can be used to judge if the established ML was overfitted based on the comparison with the evaluation metrics of the training set [54]. This division way of the dataset has been proved to be suitable [55]. When optimizing the powertrain control strategy of a hybrid vehicle, only one surrogate model is needed to establish the relationship between the input and output parameters of the entire engine, which is a future need. Therefore, in this paper, all three types of engine-related parameters (power, emission, phase) are predicted based on an ANN model to build predictions.
To further evaluate the extent to which the trained machine learning model learns the internal combustion law of the engine, 165 steady-state points including different operating conditions were applied in this study. Of these points, 60% (99/165) were used to test how well the ANN model learns the patterns of engine output parameters with ST, 29% (48/165) were used to test whether the ANN model is able to learn the intrinsic patterns between speed and engine related parameters at different loads, and 11% (18/165) of the testing dataset was used to evaluate whether the ANN model is good at predicting the intrinsic connection of engine output parameters with load at low, medium, and high engine speeds.
For the evaluation metrics, the coefficient of determination (R2) and root mean square error (RMSE) are used to measure the predictive performance of the ML model for these three types of metrics. If R2 is close-to-unity, the RMSE value is quite small, which indicates that the model can better learn some patterns within the data. The detailed formulas for this can be found in Equations (1)–(4), supported by reference [56].
The sum of squared residuals ( S S r e s ) and sum of squares due to error ( S S t o t ) are defined as follows:
S S r e s = i = 1 n ( y ( i ) y ¯ ) 2
S S t o t = i = 1 n ( y ( i ) y ¯ ) 2
The coefficient of determination is defined as follows:
R 2 = 1 S S r e s S S t o t
The root mean square error is defined as follows:
R M S E = 1 n i = 1 n ( y ( i ) y ^ ( i ) ) 2
where y ^ ( i ) is the forecasted result of the ANN model; y ¯ represents the average value of the validated data; y ( i ) are the data generated based on the corrected 1D model; and n represents the number of data.
To illustrate the structure of this paper in further detail, a flow chart was created to show the logical structure of the entire paper. More details can be found in Figure 2. The future needs of the power system lead to the purpose of this paper; next, we explain the ML modeling process of this paper.
The following sections describe and analyze the predicted results based on the ANN model, which can verify that only one ANN model can predict three classes of indicators well with sufficient data.

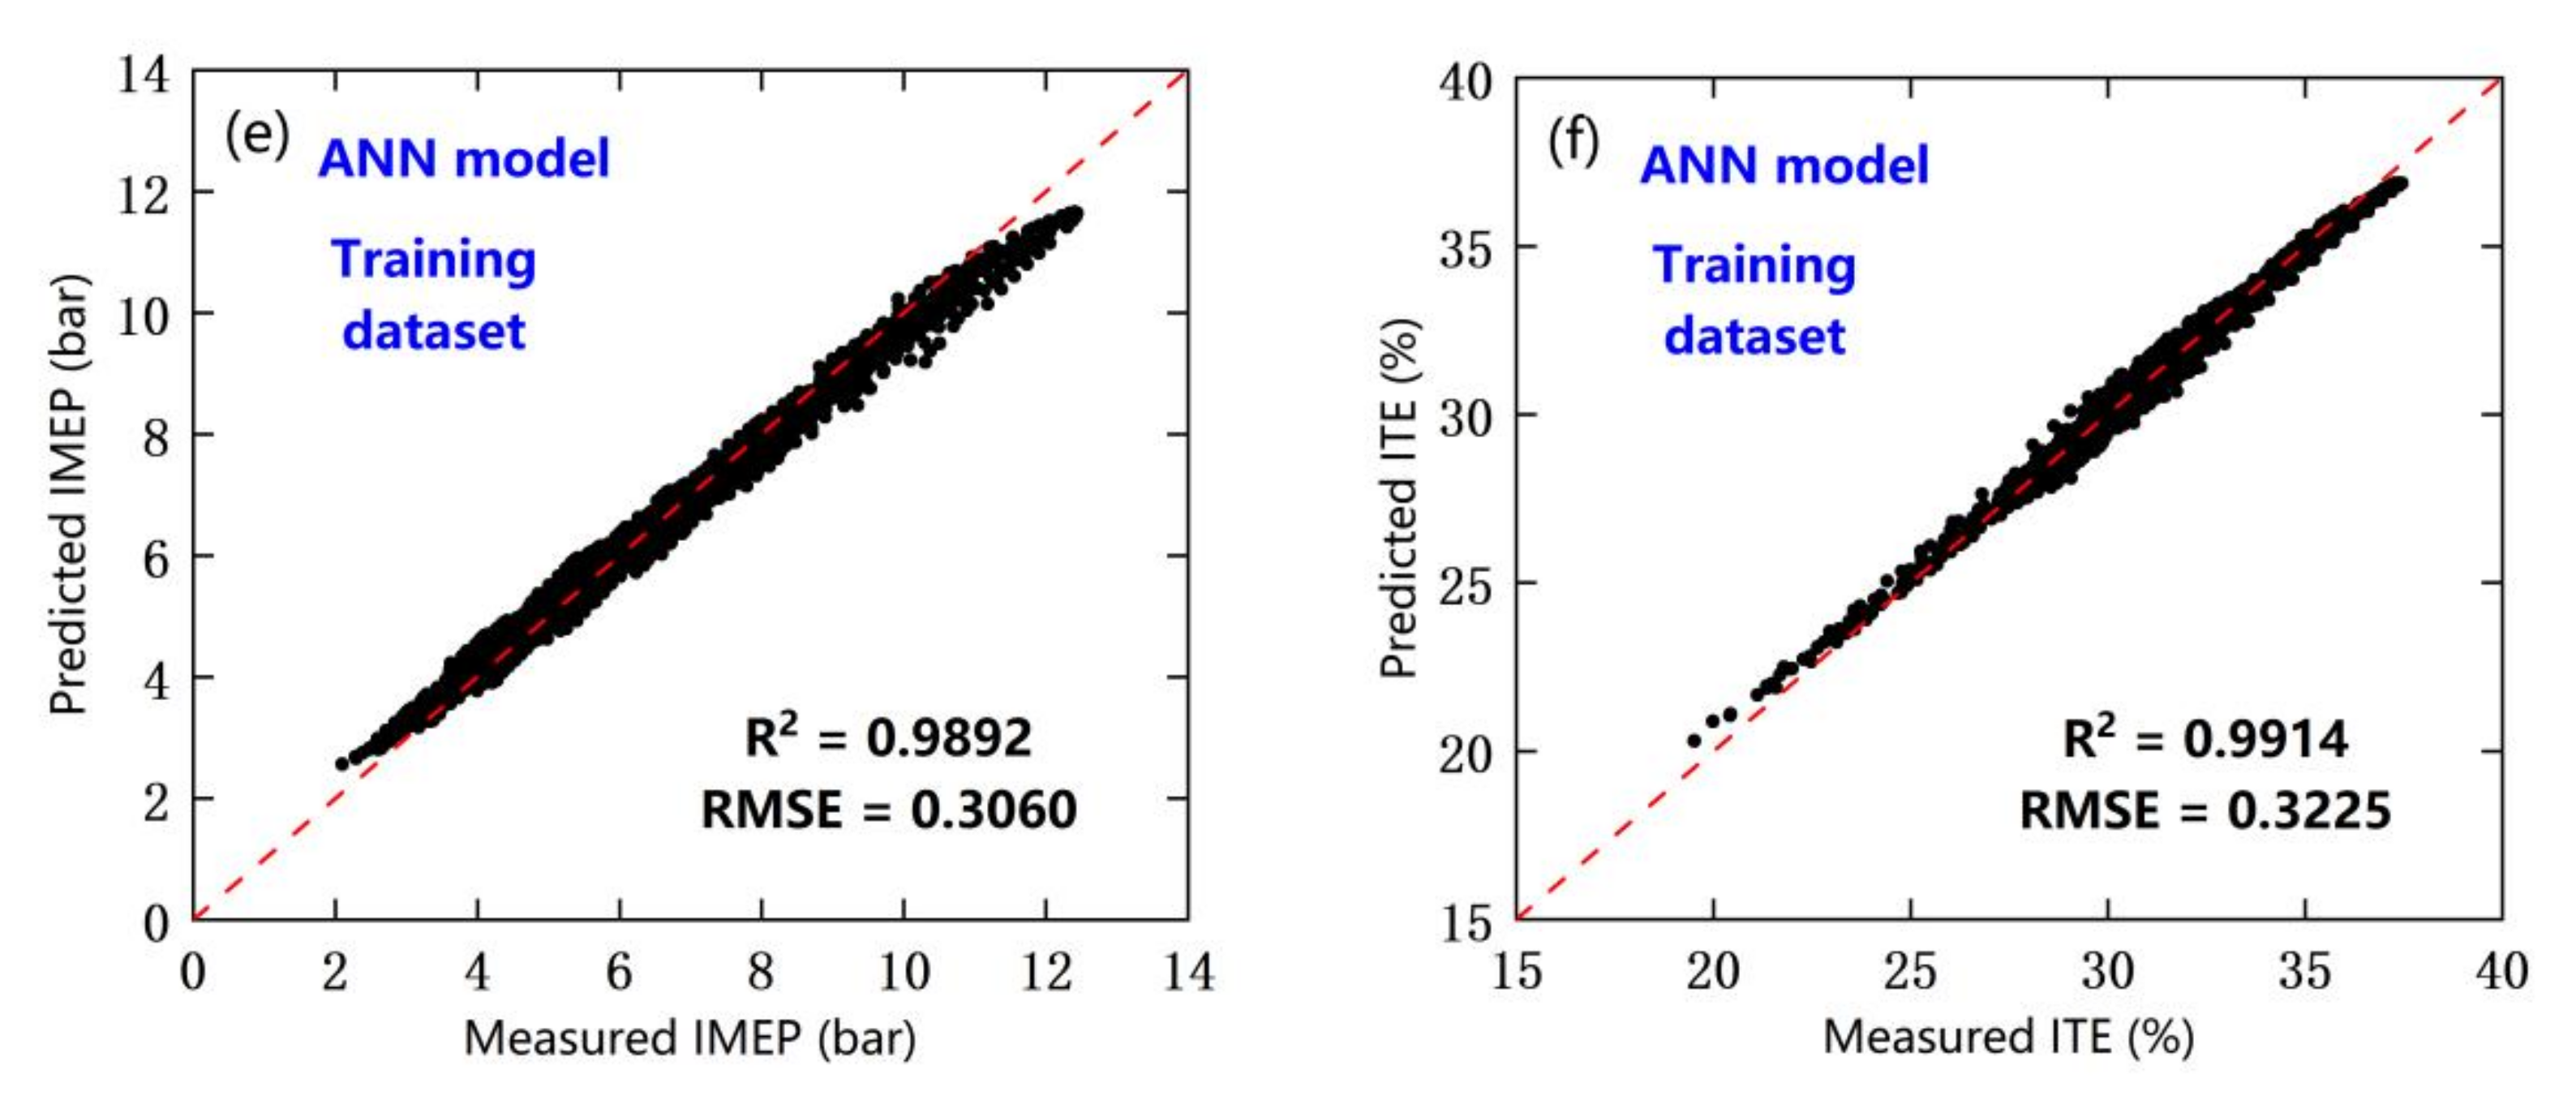
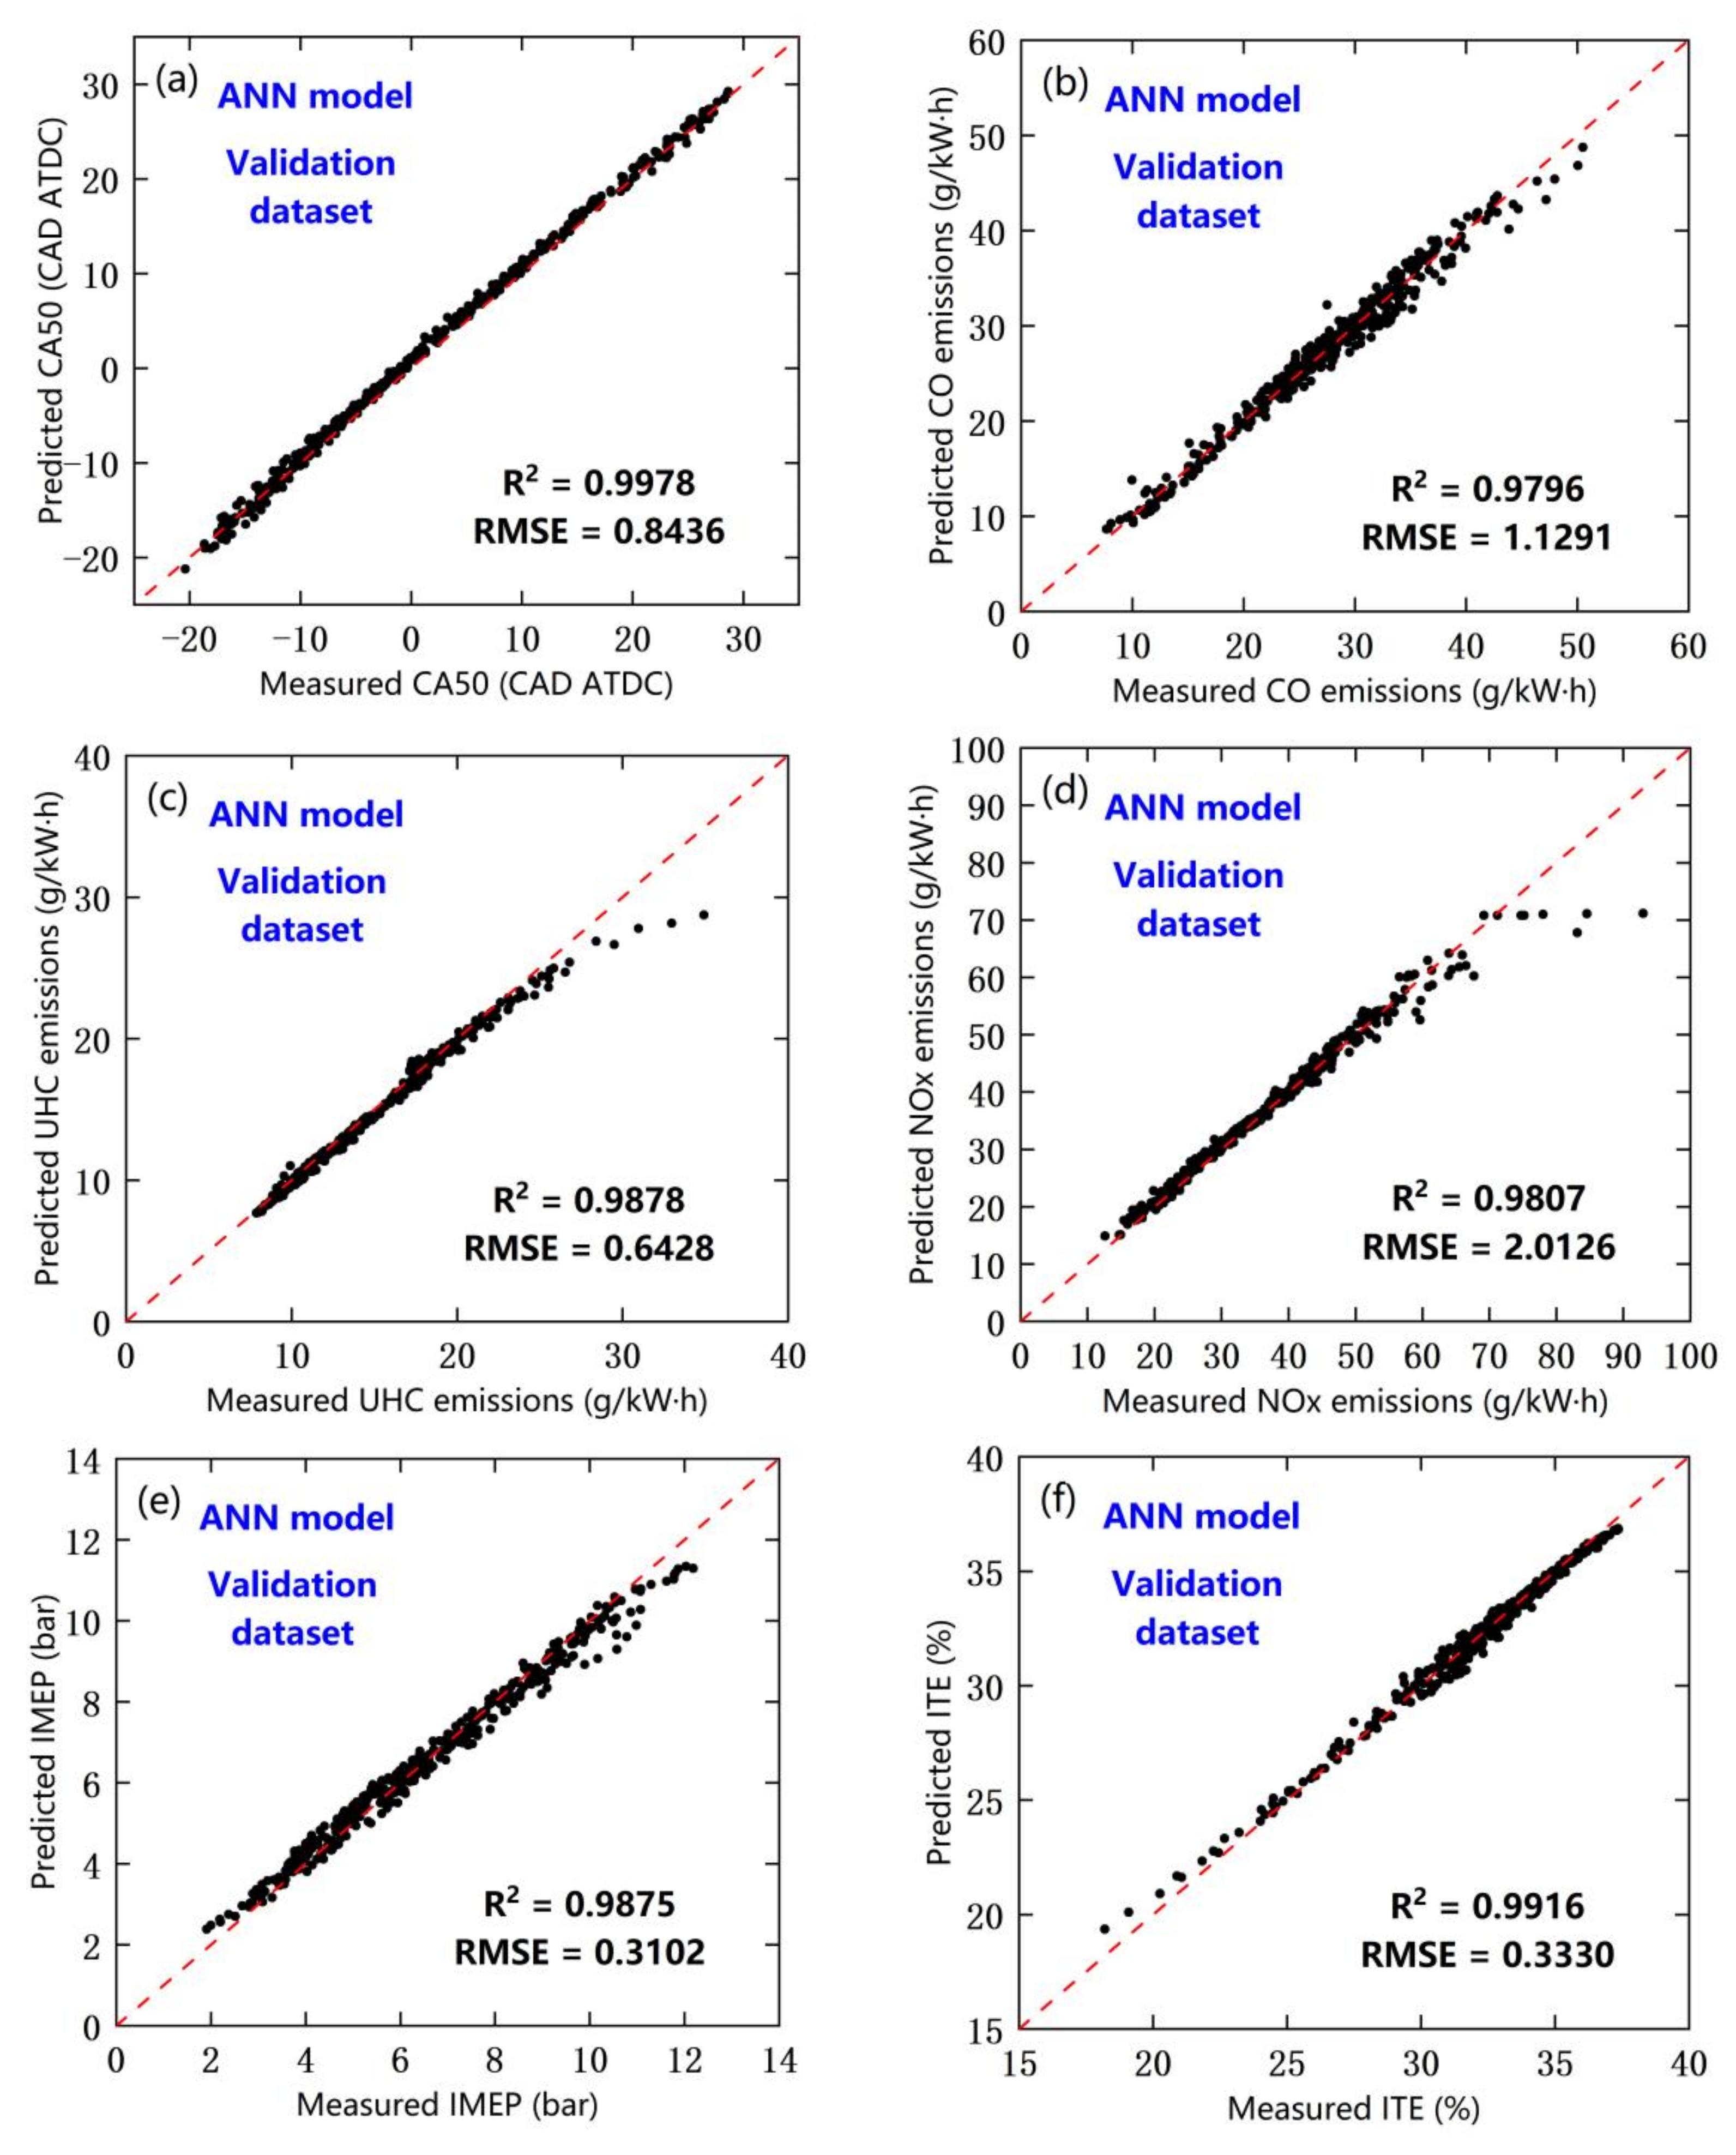
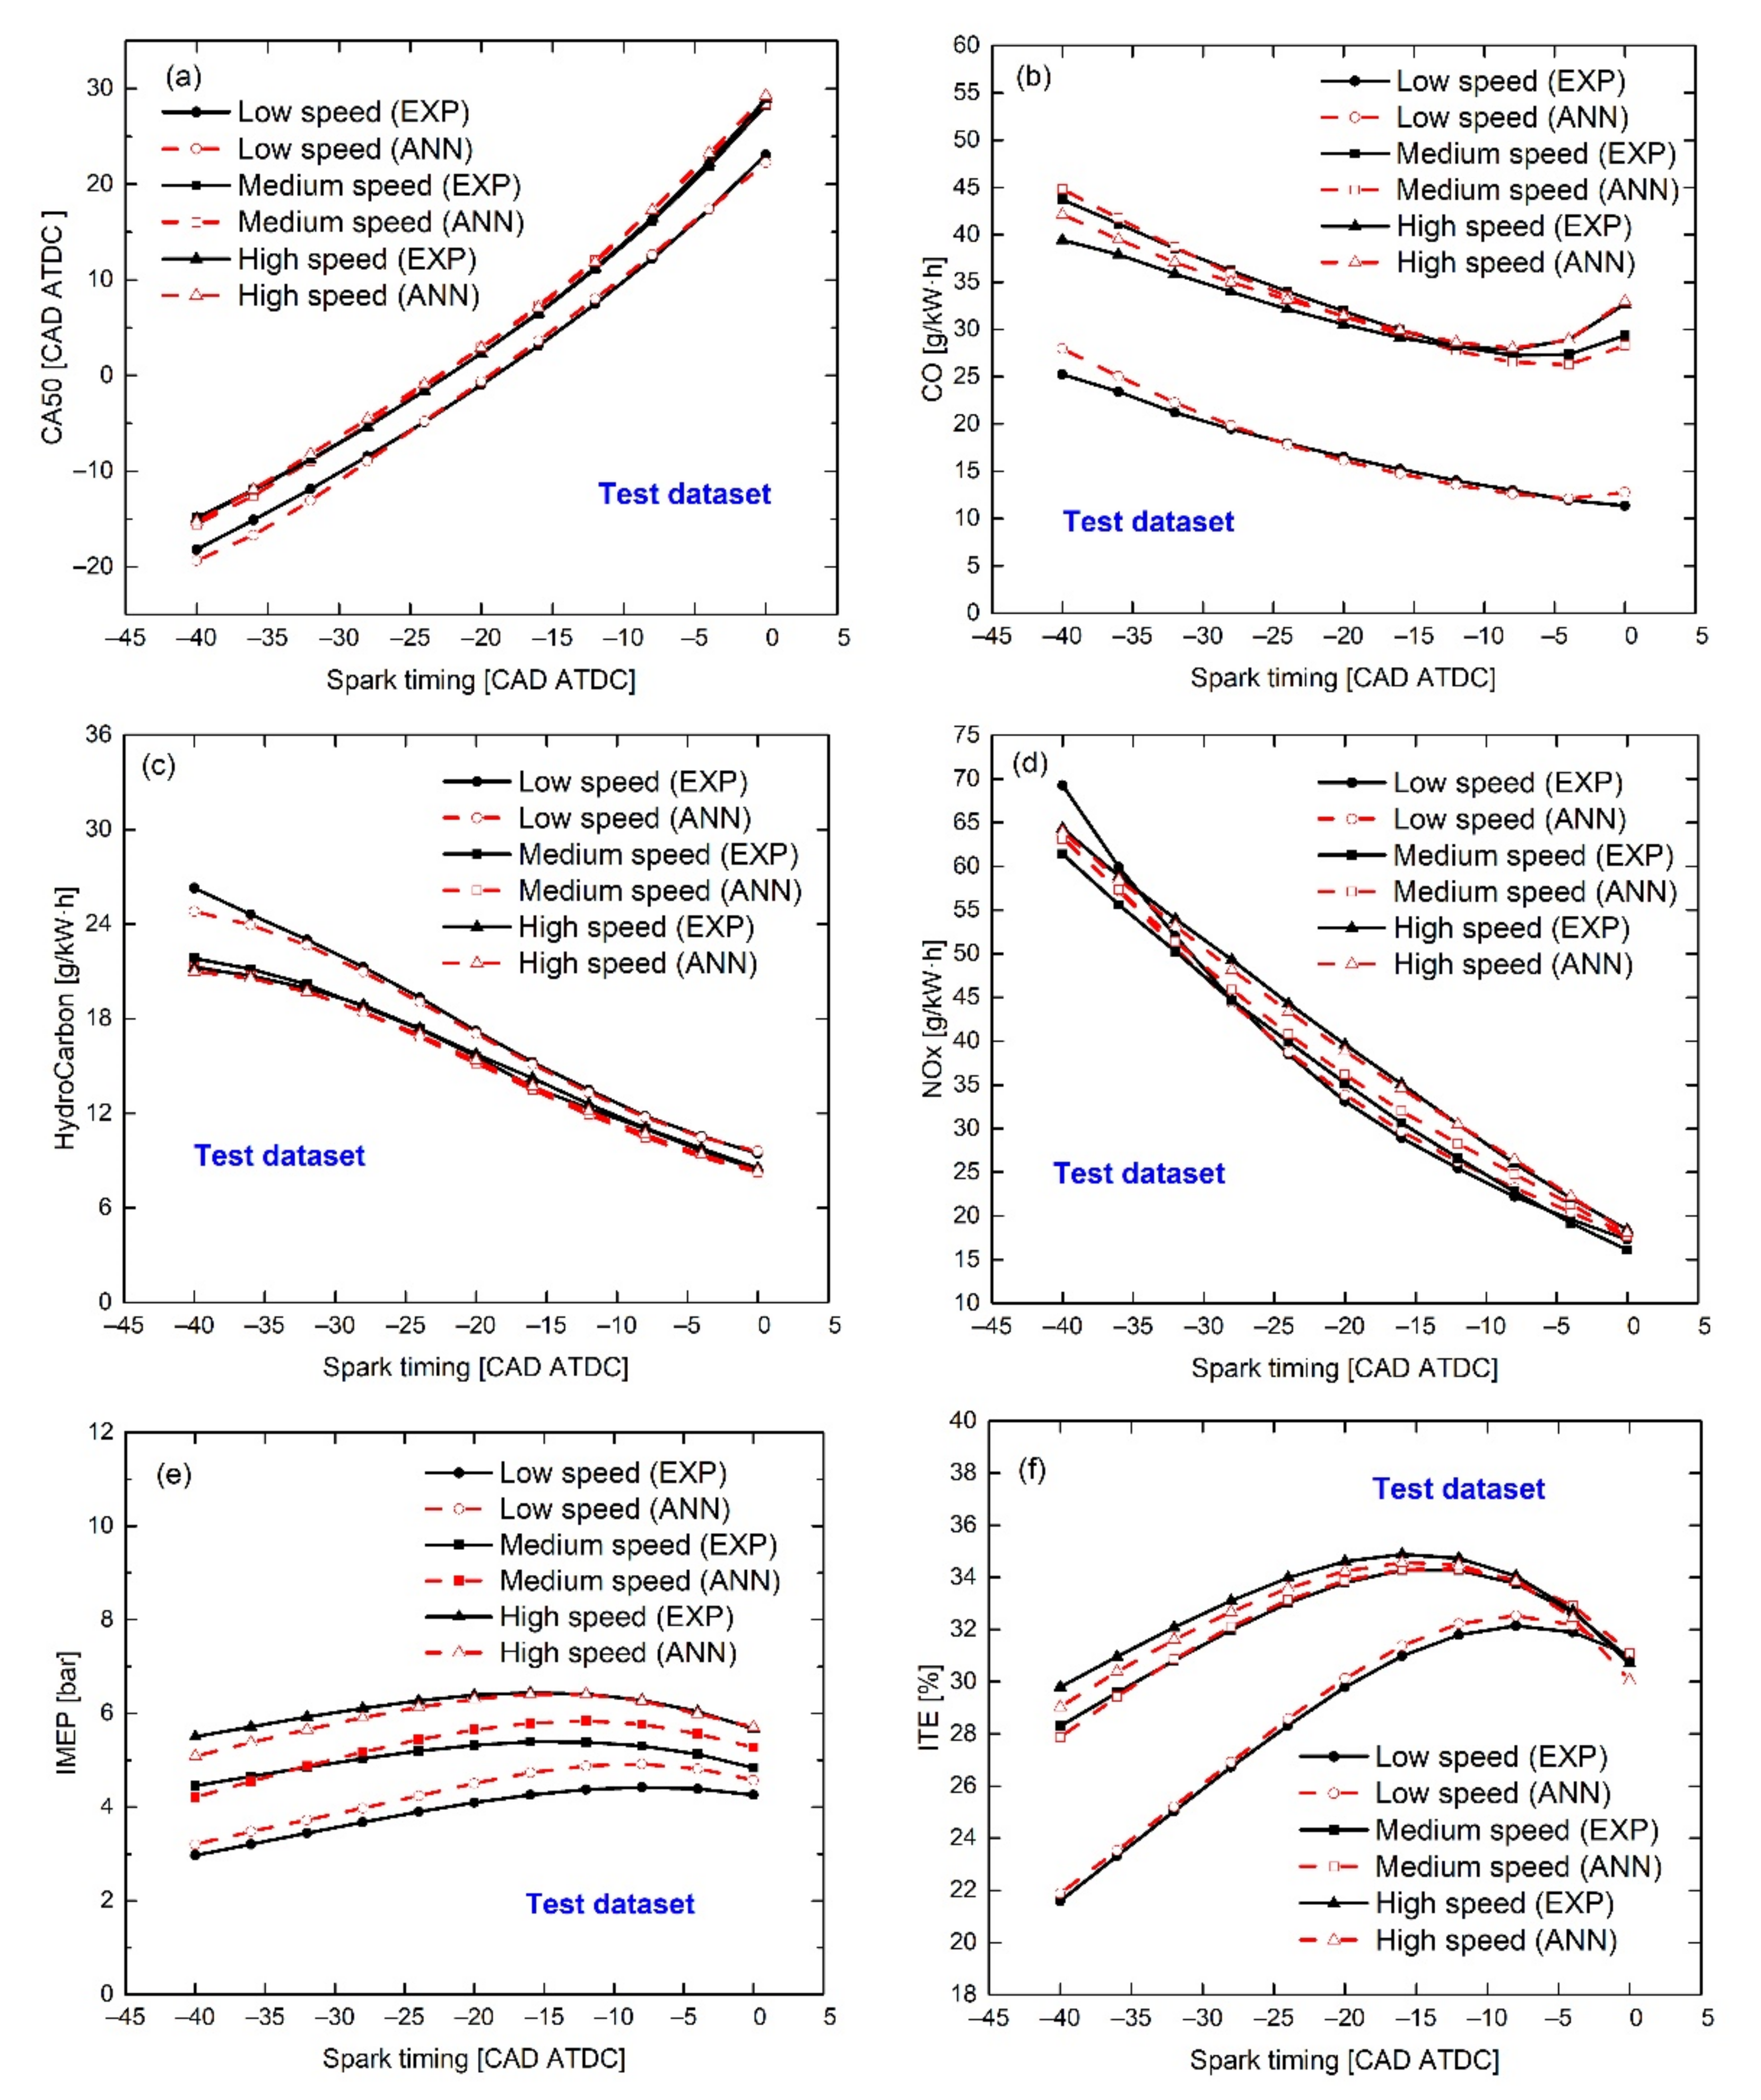
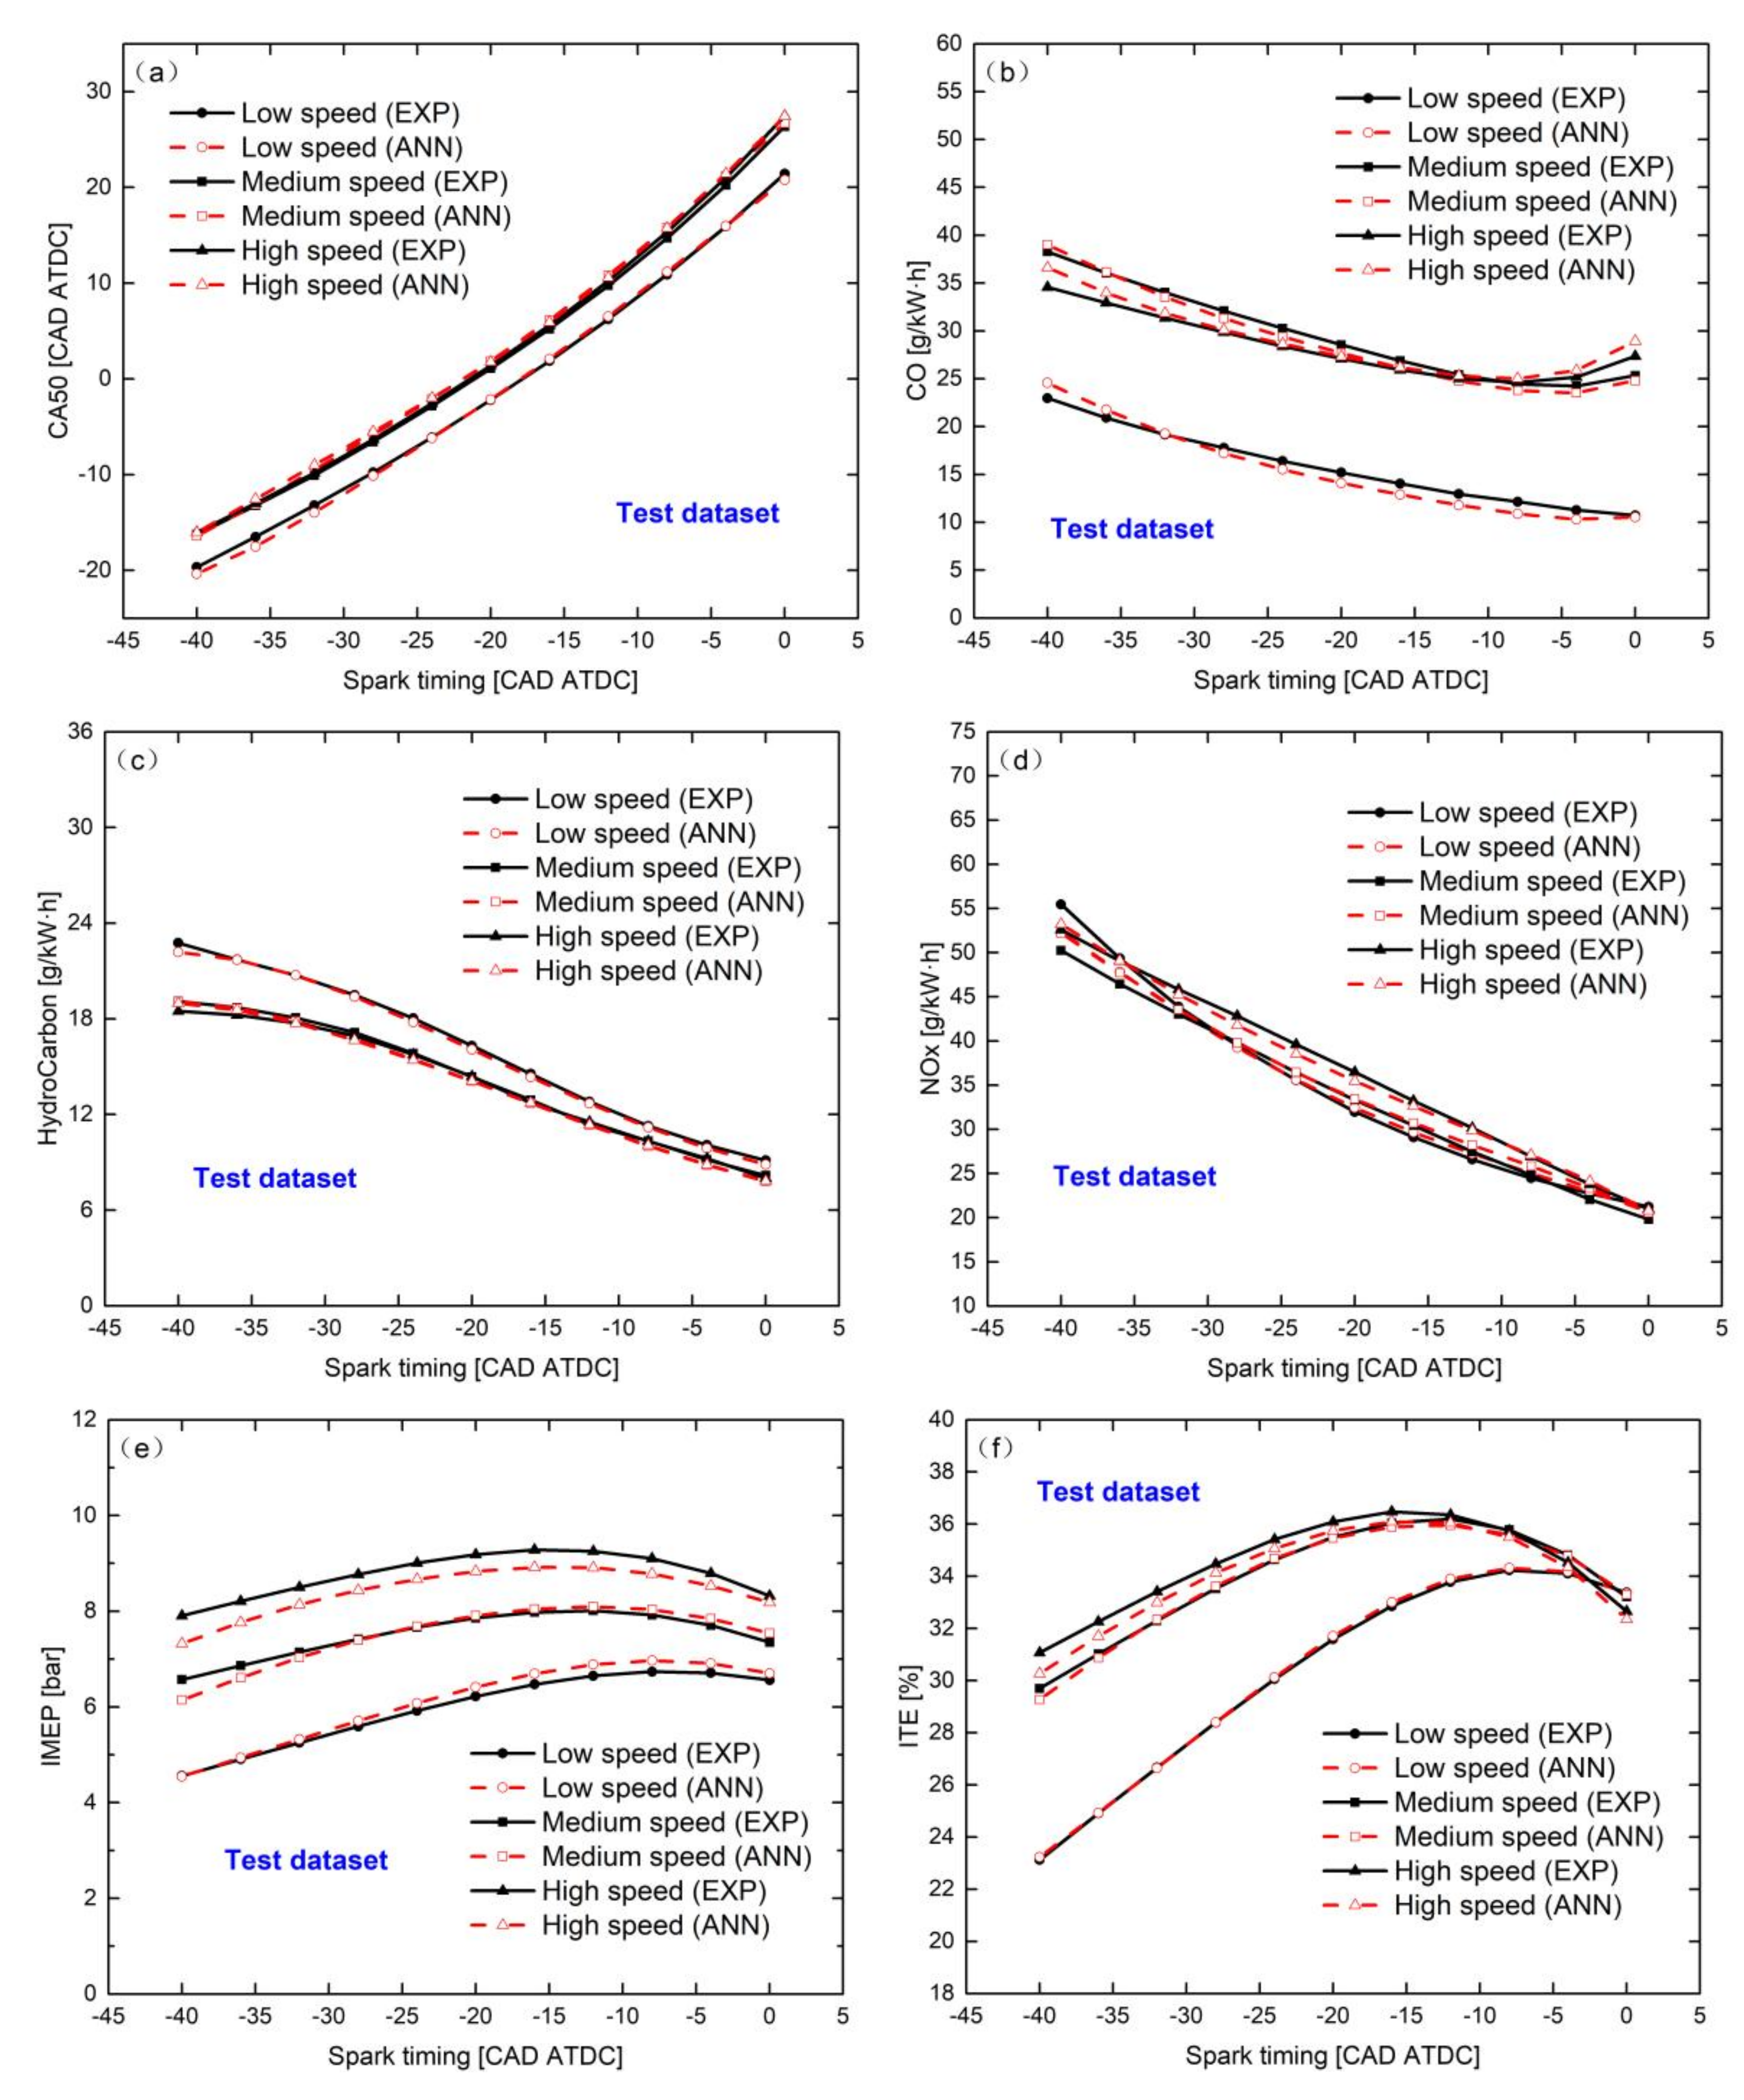
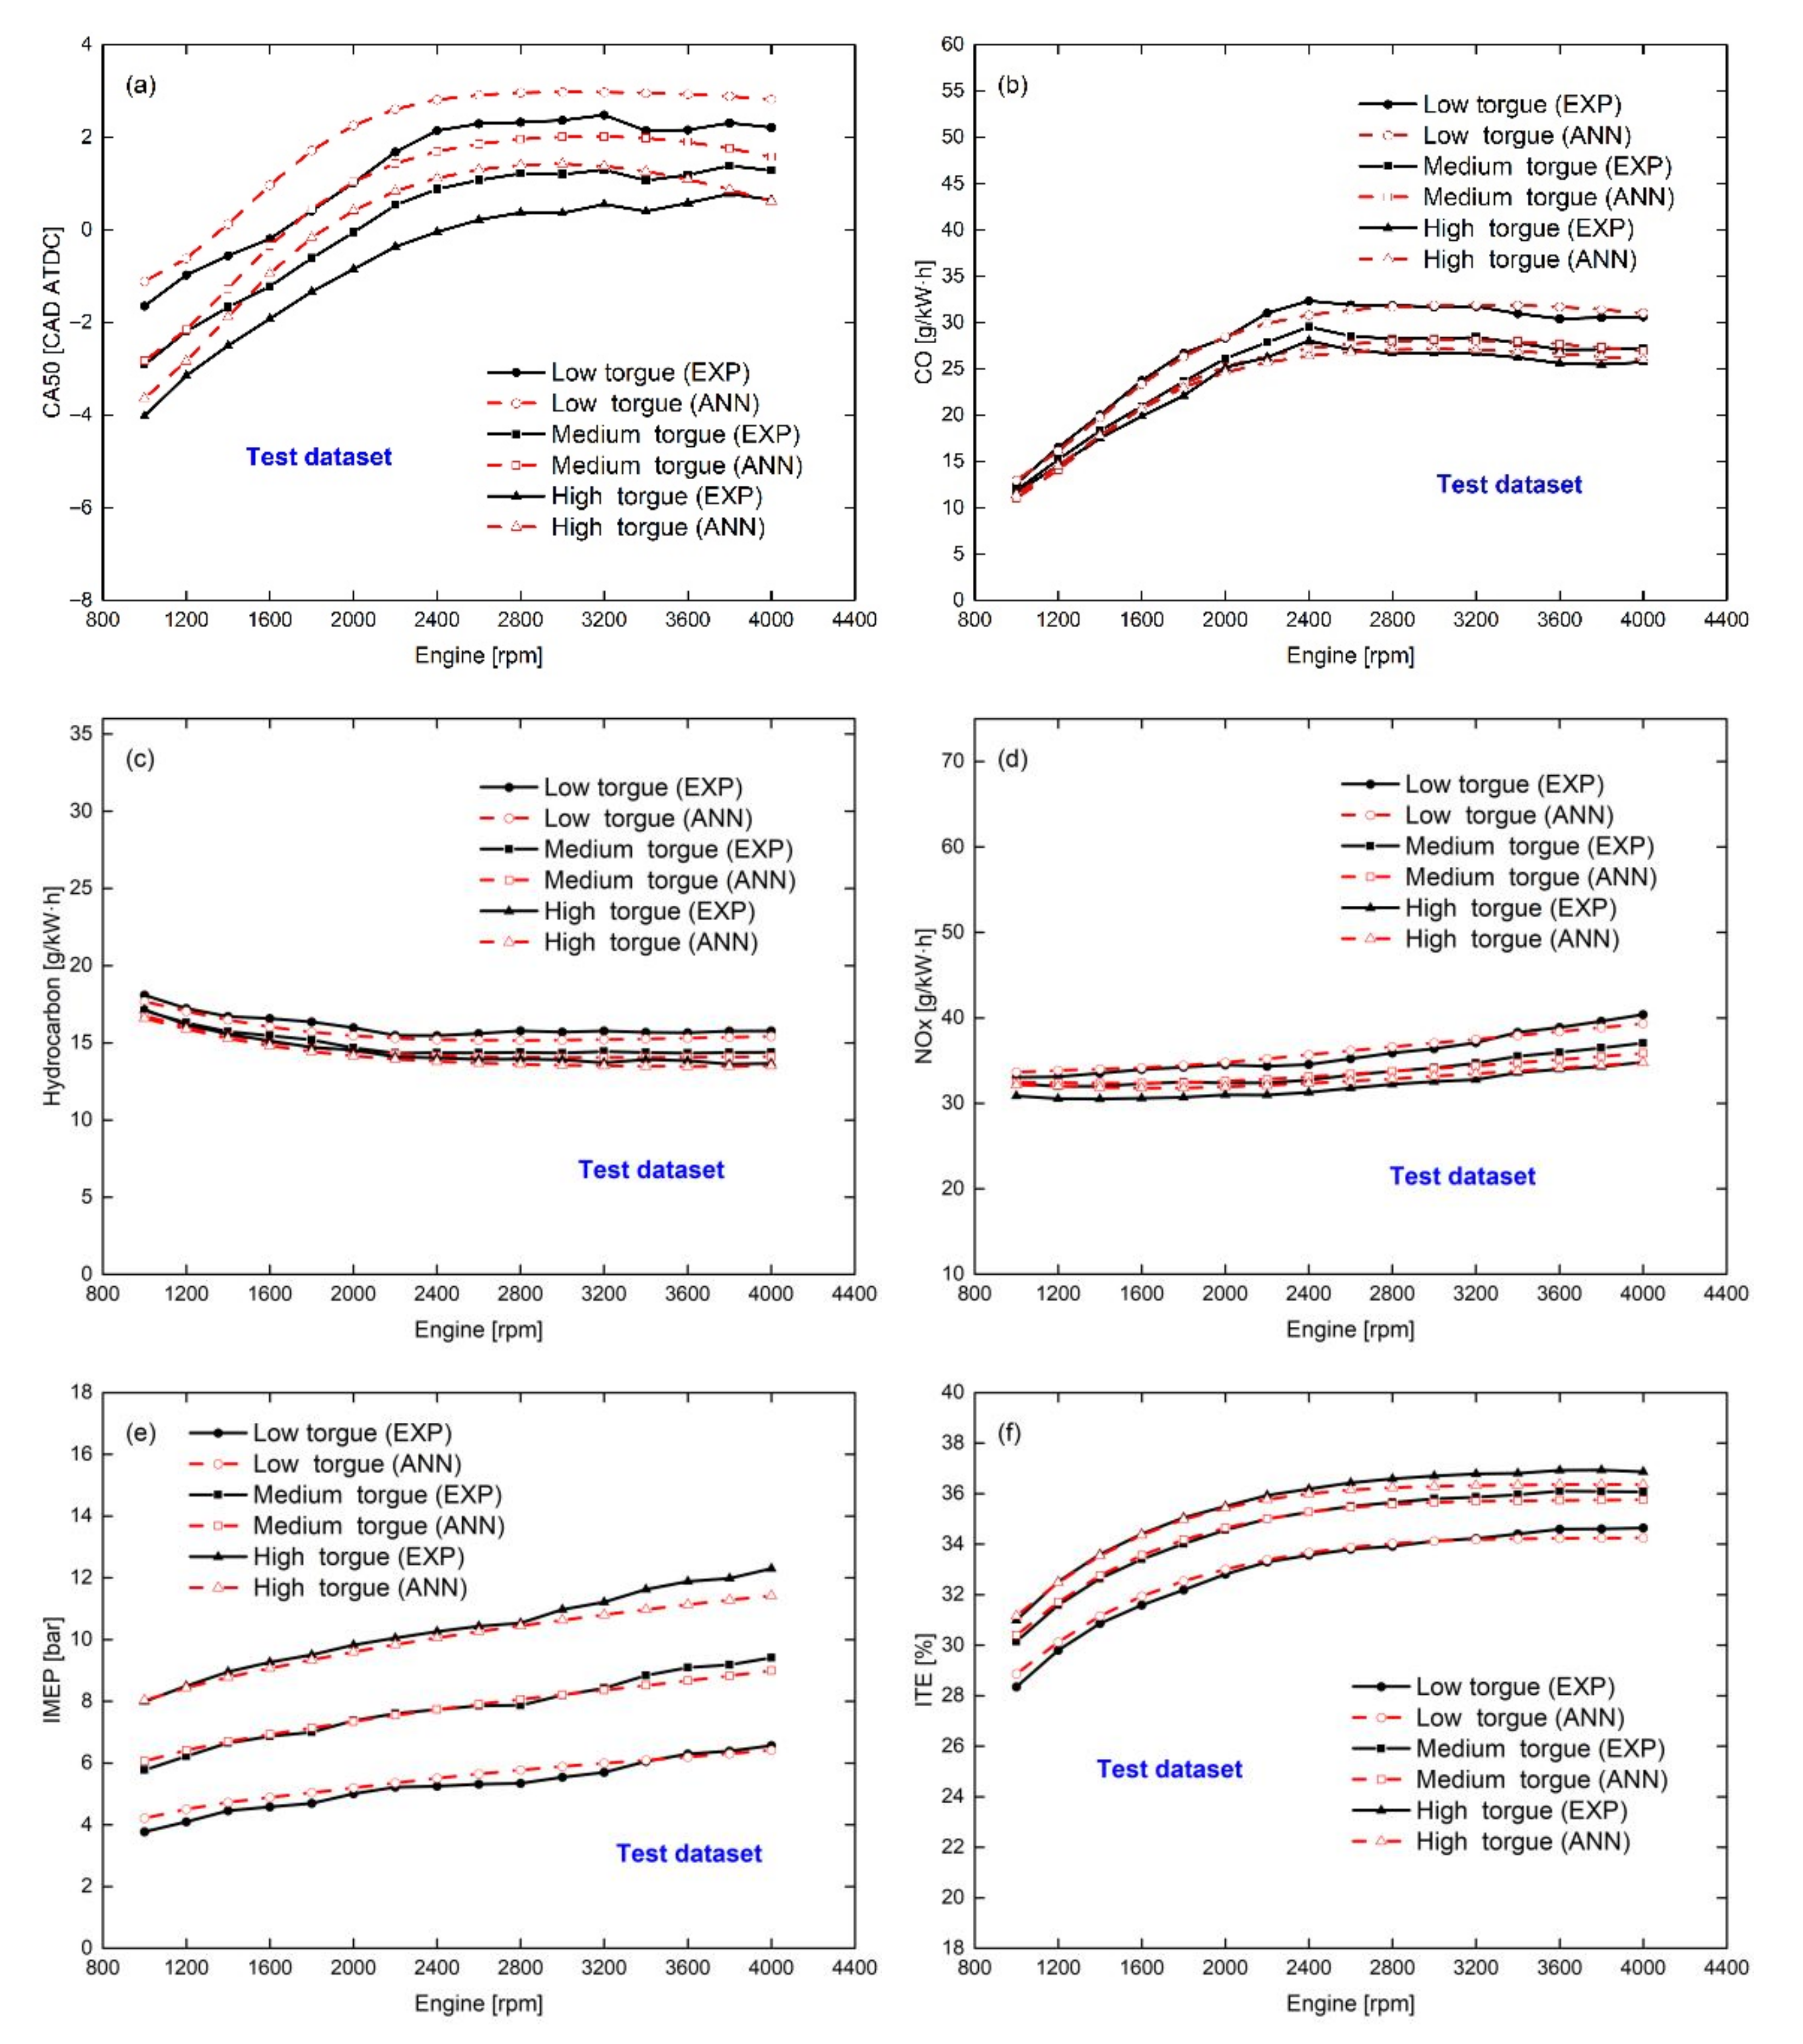
3. Results and Discussions

This section presents the prediction performance of three classes of parameters (including CA50, CO, UHC, NOx, IMEP, and ITE) based on the one ANN model for engine power, emission, and phase.
Figure 3 shows the comparison between the prediction results of the ANN-based model for three types of parameters (power, emission, combustion phasing) and the true values, which can be used to evaluate the predictive performance of the ML model by R2 and RMSE. In addition, it can be found that all the black points are close to the red dashed line at 45 degrees, which indicates that the trained ANN model has good prediction performance and the predicted results agree with the actual values. In addition, the R2 values based on the ANN model for the parameters CA50, carbon monoxide (CO), unburned hydrocarbons (UHC), nitrogen oxides (NOx), IMEP, and ITE are 0.9977, 0.9828, 0.9936, 0.9899, 0.9892, and 0.9914, respectively, and the RMSE values are 0.8353 1.0507, 0.4659, 1.3946, 0.3060, and 0.3225. R2 characterizes the extent to which the regression equation explains the variation in the dependent variable, and RMSE represents the model prediction error, which is the average difference between the actual and predicted outcome values. Basically, R2 values greater than 0.98 and very small RMSE values represent that the training dataset is well trained for the model, and the ANN model learns the internal relationships between the relevant parameters of the training dataset well.
Figure 4 shows the comparison between the three types of metric parameters (power, emission, and phase) predicted by the ANN model and the validation dataset and the actual data measured. This is a performance validation of the trained ML model with some unseen data. The prediction performance of the ML model is evaluated mainly based on the statistical metrics R2 and RMSE. The six predicted parameters CA50, CO, UHC, NOx, IMEP, and ITE correspond to R2 of 0.9978, 0.9796, 0.9878, 0.9807, 0.9875, and 0.9916, respectively, and RMSE of 0.8436, 1.1291, 0.6428, 2.0126, 0.3102, and 0.3330. It can be found that the R2 of the validation set is also basically around 0.98, which is similar to the R2 of the training set. Meanwhile, the RMSE is larger compared to the RMSE of the training set, which is understandable because the validation set is tested with unseen data. Overall, since the R2 and RMSE of the validation set are similar to those of the training set, this indicates that there is no overfitting in building the ML model. Whereas overfitting is usually caused by noisy datasets, this paper uses data generated by a modified 1D CFD model without noise. In addition, by measuring the distance between the black points and the red dashed line, it can be seen that basically, the black points on each plot are located near the red dashed line. The results show that the machine learning model developed in this paper is able to predict three types of parameters (power, emission, and phase) simultaneously and with good prediction results. This indicates that in future hybrid vehicle powertrain design, only one ANN model can be used instead of the whole engine model to predict these three combustion-related parameters with good results.
The previous two figures showed that an ANN model can be used to predict a total of six parameters for three types of engine metrics, including CA50, CO, UHC, NOx, IMEP, and ITE. The predicted results showed agreement with actual values, as evidenced by the relatively small prediction errors. It is interesting to evaluate the effect of small prediction errors on the prediction performance of ML models on engine combustion laws. This section considers the learning of internal combustion laws by the ML model for five operating conditions: the variation pattern of the predicted indexes with ST at different speeds under low, medium, and high loads; the variation of the predicted parameters with speed at different loads and with loads at different speeds when ST = −20 CAD ATDC. The typical results were chosen and shown in Figure 5, Figure 6, Figure 7, Figure 8 and Figure 9. By comparing the predicted results and the true values with the variation pattern of a certain input parameter (i.e., speed, intake pressure, and ST), it can be used to assess how well the ML model understands the input–output nonlinear relationship.
Figure 5 shows the pattern of the effect of spark timing on power, emission, and phase metrics at low load, low to medium-high engine speed, which includes actual values and predicted results based on the ANN model. As expected, CA50 is retarded with the delay of ST in Figure 5a because of the delayed ignition time [57]. The SI engines investigated in this study fit this pattern. It is also noteworthy that the CA50 curves at medium and high speeds are highly overlapping, while the curves at low speeds are relatively advanced. This is because as the engine speed increases, the combustion duration corresponds to a longer crankshaft angle, which leads to a delay in CA50. Figure 4b shows the amount of CO production at low load with the variation of spark timing at different speeds, the trend of which can be explained by MBT. According to references [57], MBT is defined as the optimum spark timing, which lies approximately between −20 and −1 CAD ATDC in the range of 1000 to 4000 rpm. Higher engine speeds need to be matched with a more advanced MBT [57]. The combustion efficiency is improved when ST is delayed from −40 to 0 CAD ATDC close to MBT, which is supported by reference [57]. As a result, CO emissions, which are products of incomplete combustion, decrease with the increase in combustion efficiency. In addition, the CO emissions at medium and high speeds increase significantly and relatively because the injected fuel increases while the combustion efficiency is similar, resulting in more incomplete combustion generation. It is also worth noting that CO emissions are greater at medium speeds than at high speeds when ST is before −12 CAD ATDC, while after that, the relationship is reversed. This is because CO emissions are influenced by the interaction of fuel injection and combustion efficiency. At delayed ST, the increase in fuel injection is the dominant factor leading to CO emissions, while at early ST, the deterioration in combustion leads to more CO emissions. This could be the result of higher in-cylinder pressure pressing unburned hydrocarbons into the crevices. For the IMEP and ITE trends, the main reason is the presence of MBT. Overall, Figure 5 shows that the ANN predicted engine combustion pattern basically matches the black line represented by the actual values, which indicates that the intrinsic relationship between input and output at low load can be integrated inside an ANN model with good prediction.
Figure 6 shows the predicted values of each metric based on the ANN model as well as the true values of the six parameters that are integrated in the output responses of an ML model. It can be found that the overall prediction trend is good, and for the CA50 and emission indicators, the ANN model predicts the trend accurately. However, for the power parameters, the prediction is not as accurate, but the trend is more or less the same. It can be seen from Figure 6 that the combustion performance of the engine is improved as the spark timing is adjusted toward MBT (maximum braking torque). Thus, with the delayed spark timing, CO production decreases before MBT and increases after MBT at medium and high engine speeds. At low speed, where MBT is delayed, CO can be found to decrease with the delay in spark timing. This is because the lower the engine speed, the MBT will be delayed. As can be seen in Figure 6f, the high efficiency zone is located in the medium to high-speed zone under medium load, which is in accordance with the combustion law [57]. In addition, for a particular speed and torque, NOx decreases with the delayed spark timing, which is due to the later ignition time reducing the in-cylinder pressure and temperature. Overall, the ANN model is relatively accurate in predicting the combustion laws, but there is some predicted error in the absolute value of the power parameter prediction.
Figure 7 shows the comparison of the predicted values of the three types of parameters, power, emission, and phase, based on the machine learning model with the actual data at high load. The general trend of the three types of parameters (power, emission, and phase) with spark timing at high load is similar to that of Figure 5 and Figure 6, and the peaks of both IMEP and ITE increase further [57]. Figure 7a shows that at the same speed, CA50 gradually increases with the delay in spark timing, as expected in reference [57]. As seen in Figure 7e, the increased piston motion speed and faster airflow at higher speeds leads to a decrease in the residual exhaust gas coefficient and an increase in the intake volume. The combined effect of these factors leads to an increase in fuel injected mass, since IMEP is an indicator parameter for the amount of work per cycle and thus an increase in IMEP. It is worth noting that the ANN model is very accurate in predicting CA50 and emissions. For IMEP and ITE, it is accurate at low and medium speeds, but for high speeds, the specific values of IMEP and ITE are not accurate. Overall, at high loads, the trends predicted by the ANN model are similar to the trends of the actual values. Moreover, as seen in Figure 7, the red dashed and black solid lines largely overlap. This indicates that it is feasible to predict these three metrics (power, emission, and phase) based on only one ANN model. Therefore, the ML model can be used as an analytical tool for future combustion and may help in multi-dimensional simulation and deepening the development process of low-carbon engines.
Figure 8 shows the comparison of the predicted results with the calibration data for different engine loads at spark timing = −20 CA ATDC. It can be found that the predictions of IMEP and ITE at high speed and high torque are somewhat deviated, which correspond to the results in Figure 7e. It can be seen from Figure 8f that the enhanced airflow motion accelerates the flame propagation speed and improves the combustion efficiency as the engine speed increases. However, the duration of combustion corresponding to the crankshaft angle also lengthens, which indicates a deterioration in the level of constant volume combustion. This explains the slope of the indicated thermal efficiency slowing down as the engine speed increases. The CA50, which is an indicator of the in-cylinder combustion rate, is also consistent with this pattern. When combustion efficiencies are similar, there is a trade-off between UHC and CO. As expected, CO generally tends to increase as unburned hydrocarbons decrease, because the two metrics together represent the degree of incomplete combustion. More interestingly, at ST = −20CA ATDC, the specific value of CA50 predicted by ANN fluctuates somewhat with engine speed, which is probably because the range of CA50 fluctuation is relatively small with engine speed. From Figure 5, Figure 6 and Figure 7, it can be seen that the fluctuation range of CA50 is about −20 to 30 CA ATDC, so the absolute error of prediction is relatively small compared to the whole fluctuation range of CA50. The prediction of the trend of the six indicators based on an ANN model is acceptable, at least for the operating conditions of ST = −20 CA ATDC. Therefore, the ANN model prediction results can be used as a combustion analysis tool as well as an aid to low-carbon engine development.
Figure 9 shows the effect of engine load on combustion, emission, and power metrics at different engine speeds with spark timing = 20 CA ATDC. Figure 9a shows the curves of CA50 versus intake pressure at different engine speeds, where intake pressure is a common engine load indicator. Since the differences in CA50, emissions, IMEP, and ITE at different engine speeds have been analyzed, the next discussion of Figure 9 will focus on the effect of intake pressure. According to reference [57], lower loads correspond to lower volumetric efficiency and larger residual gas coefficients, as well as lower temperatures, which lead to a degradation of combustion. This explains the delay in CA50 with increasing intake pressure, as well as the reduction in CO and UHC emissions and the increase in thermal efficiency, since combustion performance is the main factor determining the engine output responses. Furthermore, it can be observed that the predicted engine power, emission, and phase trends are consistent with the actual values. Therefore, the performance of the trained machine learning model is acceptable considering the intrinsic linkage aspect of the load–output relationship.
Overall, all the obtained results suggest that it is quite possible to integrate three types of parameters (mainly determined by combustion) into one ANN model. Further evaluation of the accuracy of this algorithm for predicting results will be considered for noisy data in future work.

4. Summary and Conclusions

Basically, most researchers predict engine efficiency, emissions, or phasing alone, and some of them forecast two classes of the parameters based on ML models in the existing literature. Due to the requirements of future vehicle integration, only one CPU is usually needed to control the whole vehicle, so it is necessary if only one ANN model is needed to predict these three types of parameters. However, the literature is limited for predicting three classes of metrics (including power, emissions, and combustion phasing indicators) based on one ANN model. In this paper, a 3-7-7-6 ANN model was established to verify whether three types of parameters (mainly determined by combustion) can be integrated into one ANN model, using spark timing, speed, and torque as inputs. In addition, the statistical parameters including R2 and RMSE were used to evaluate the predictive performance based on the ML model. The major findings were as follows:
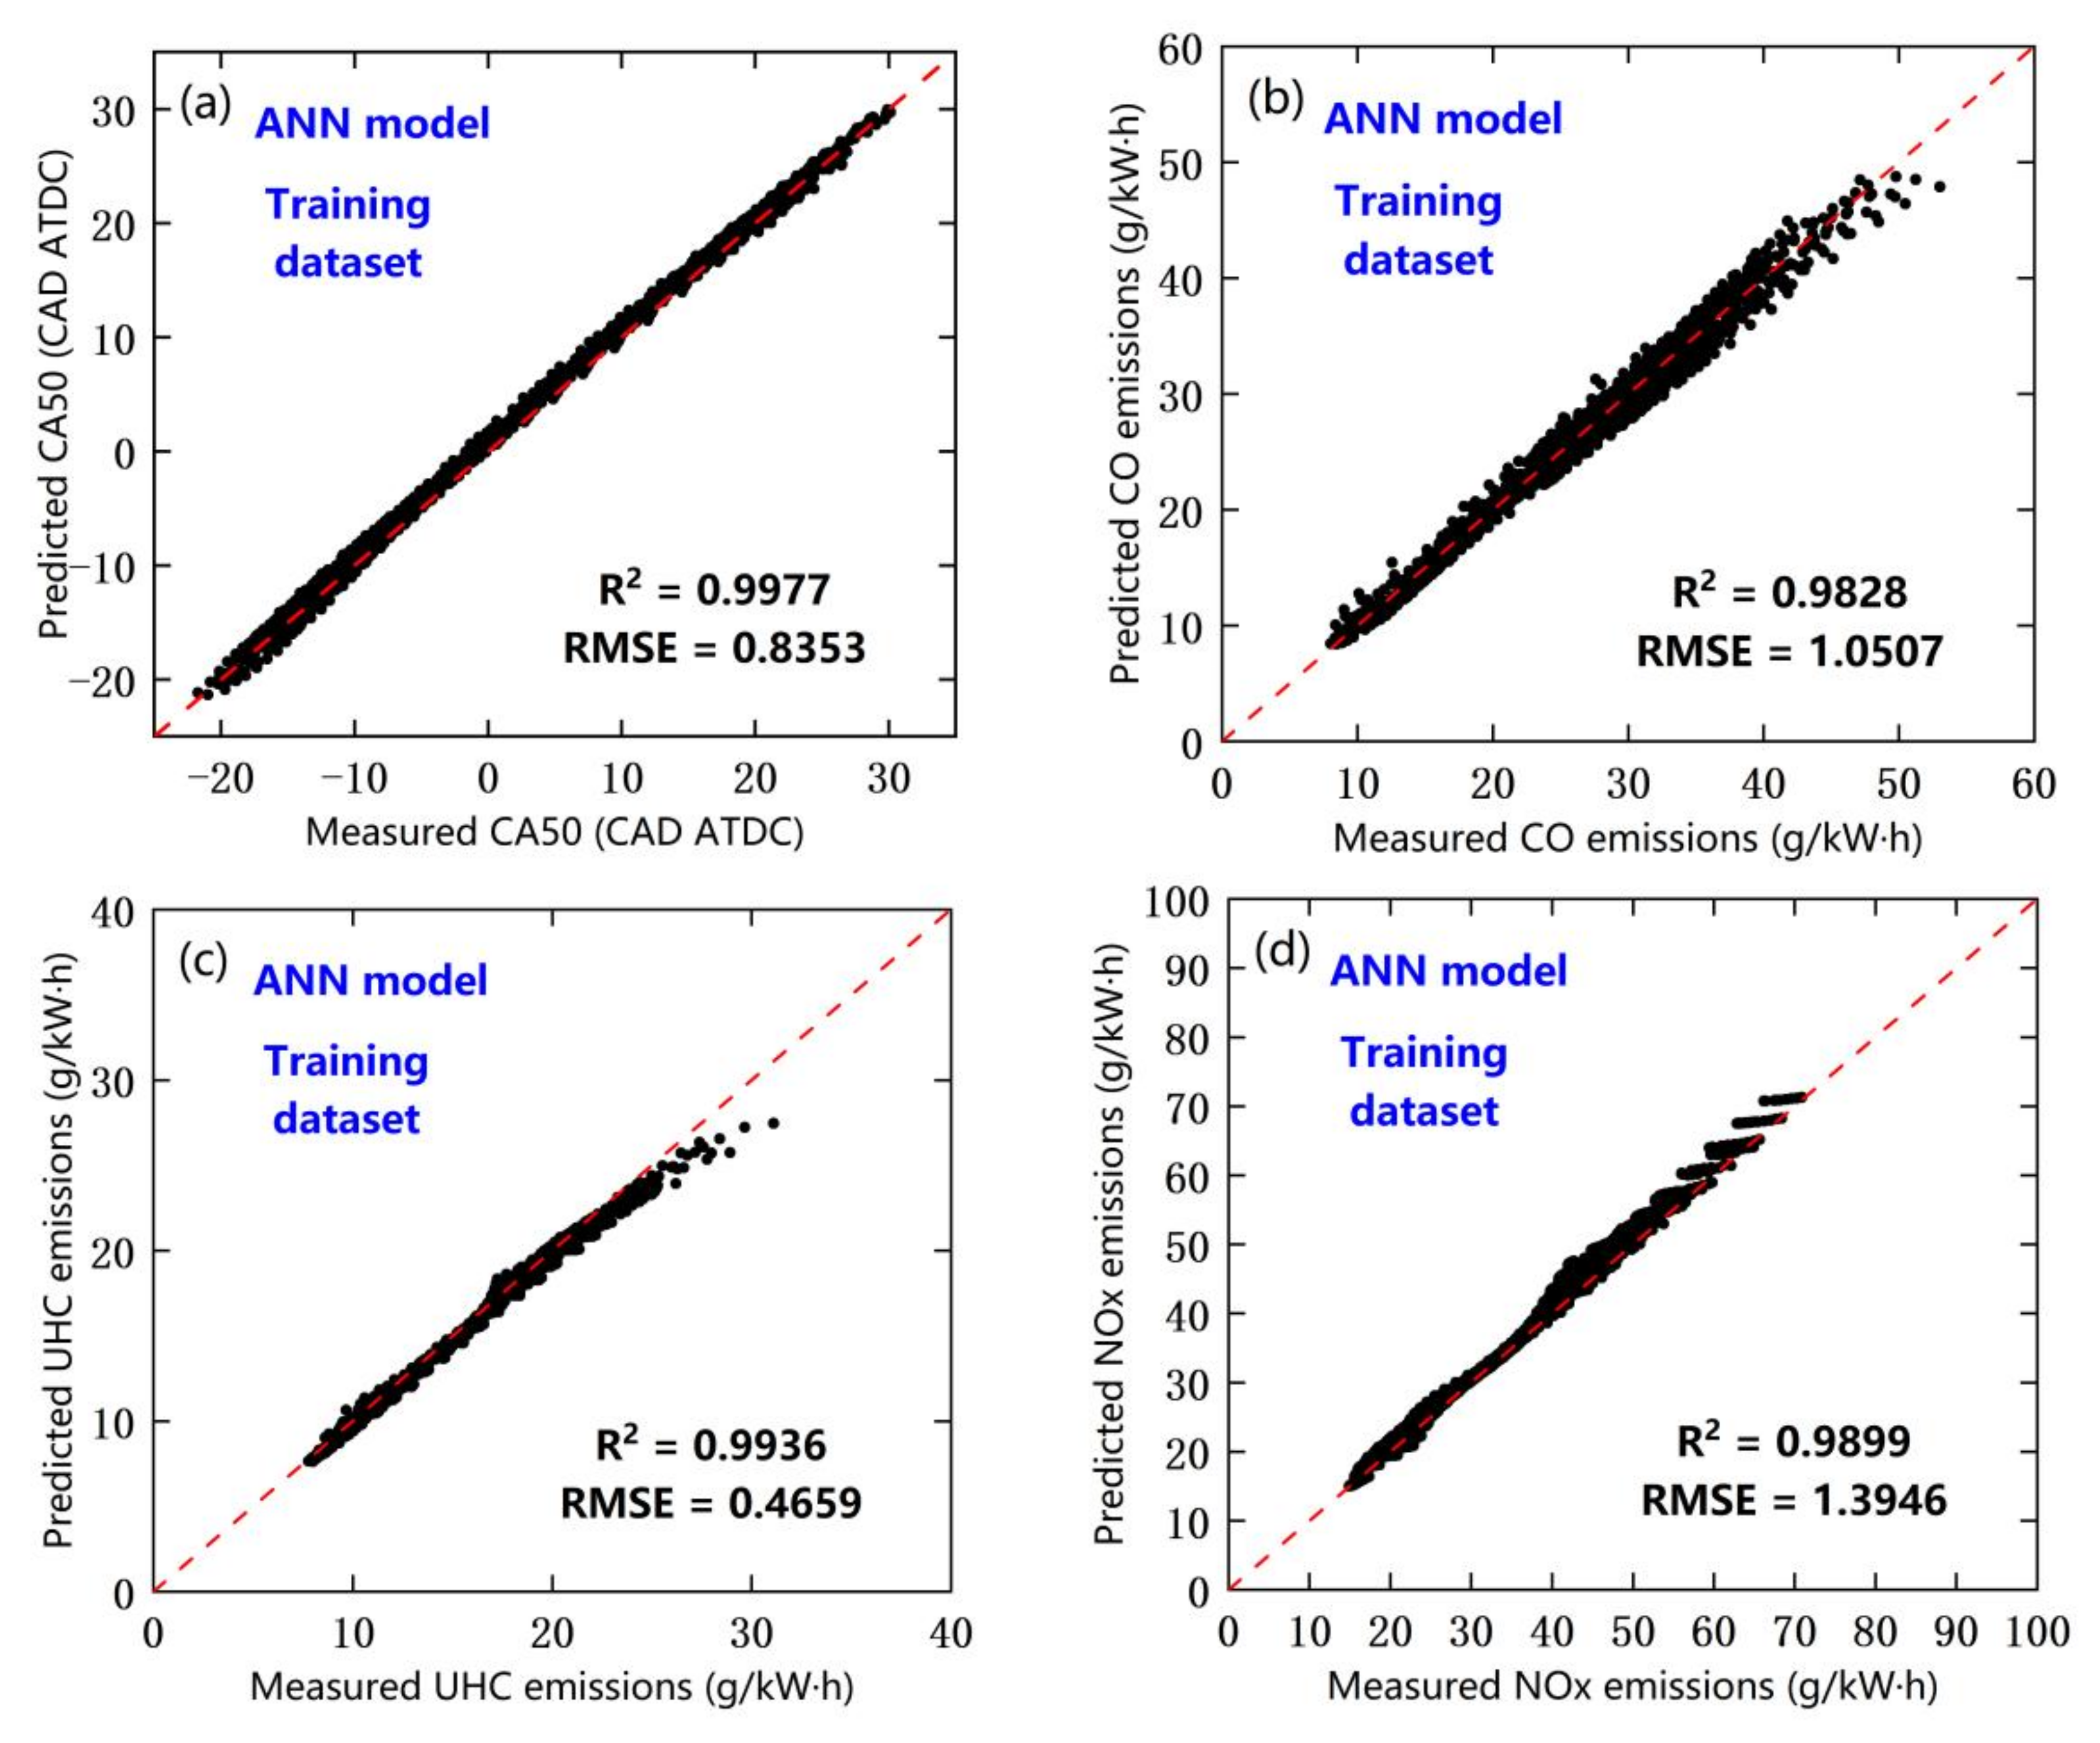
  • In order to achieve better prediction results, this study compared the prediction results of three different ANN model structures (including 3-7-6, 3-7-7-6, and 3-5-5-6), and the results showed that among these three prediction results, the lowest R2 of the prediction results of 3-7-7-6 basically remained around ≈0.98, which was higher than the R2 of the other two ANN models. Almost metrics predicted less RMSE values than those of the other two structures, which indicates that a 3-7-7-6 neuron network can achieve the better prediction results for each parameter (including power, emission, and phasing indicators).
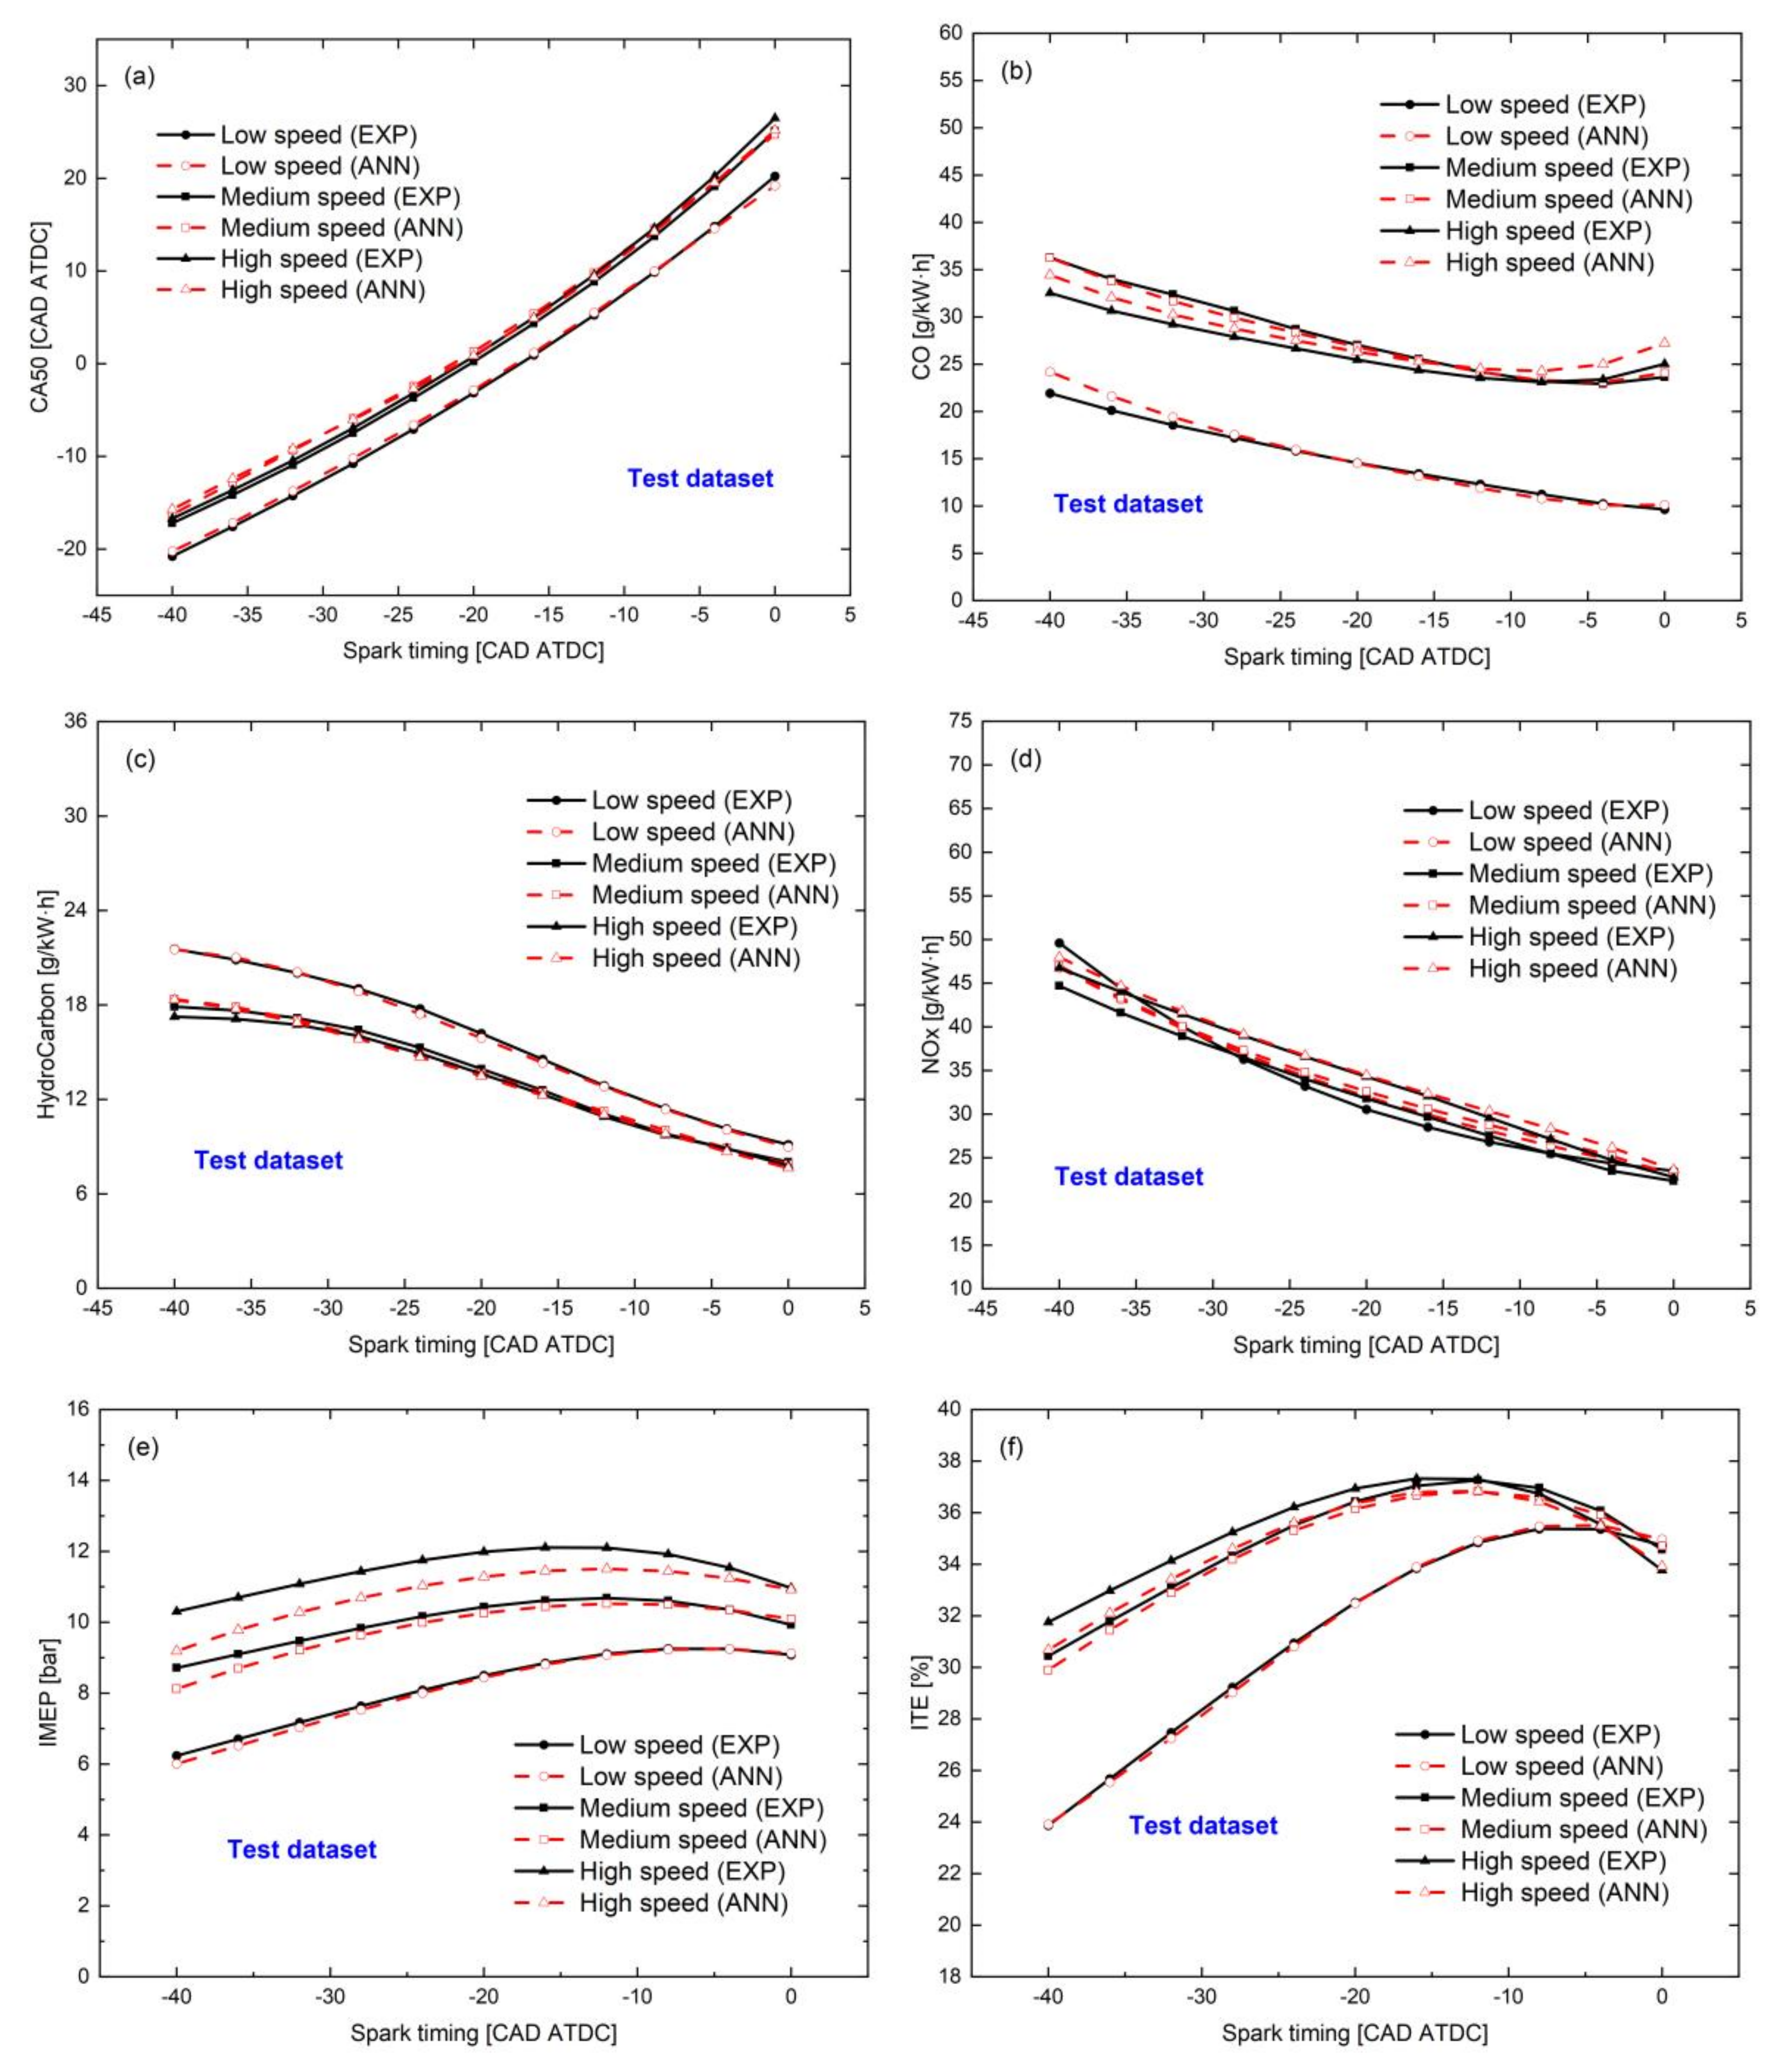
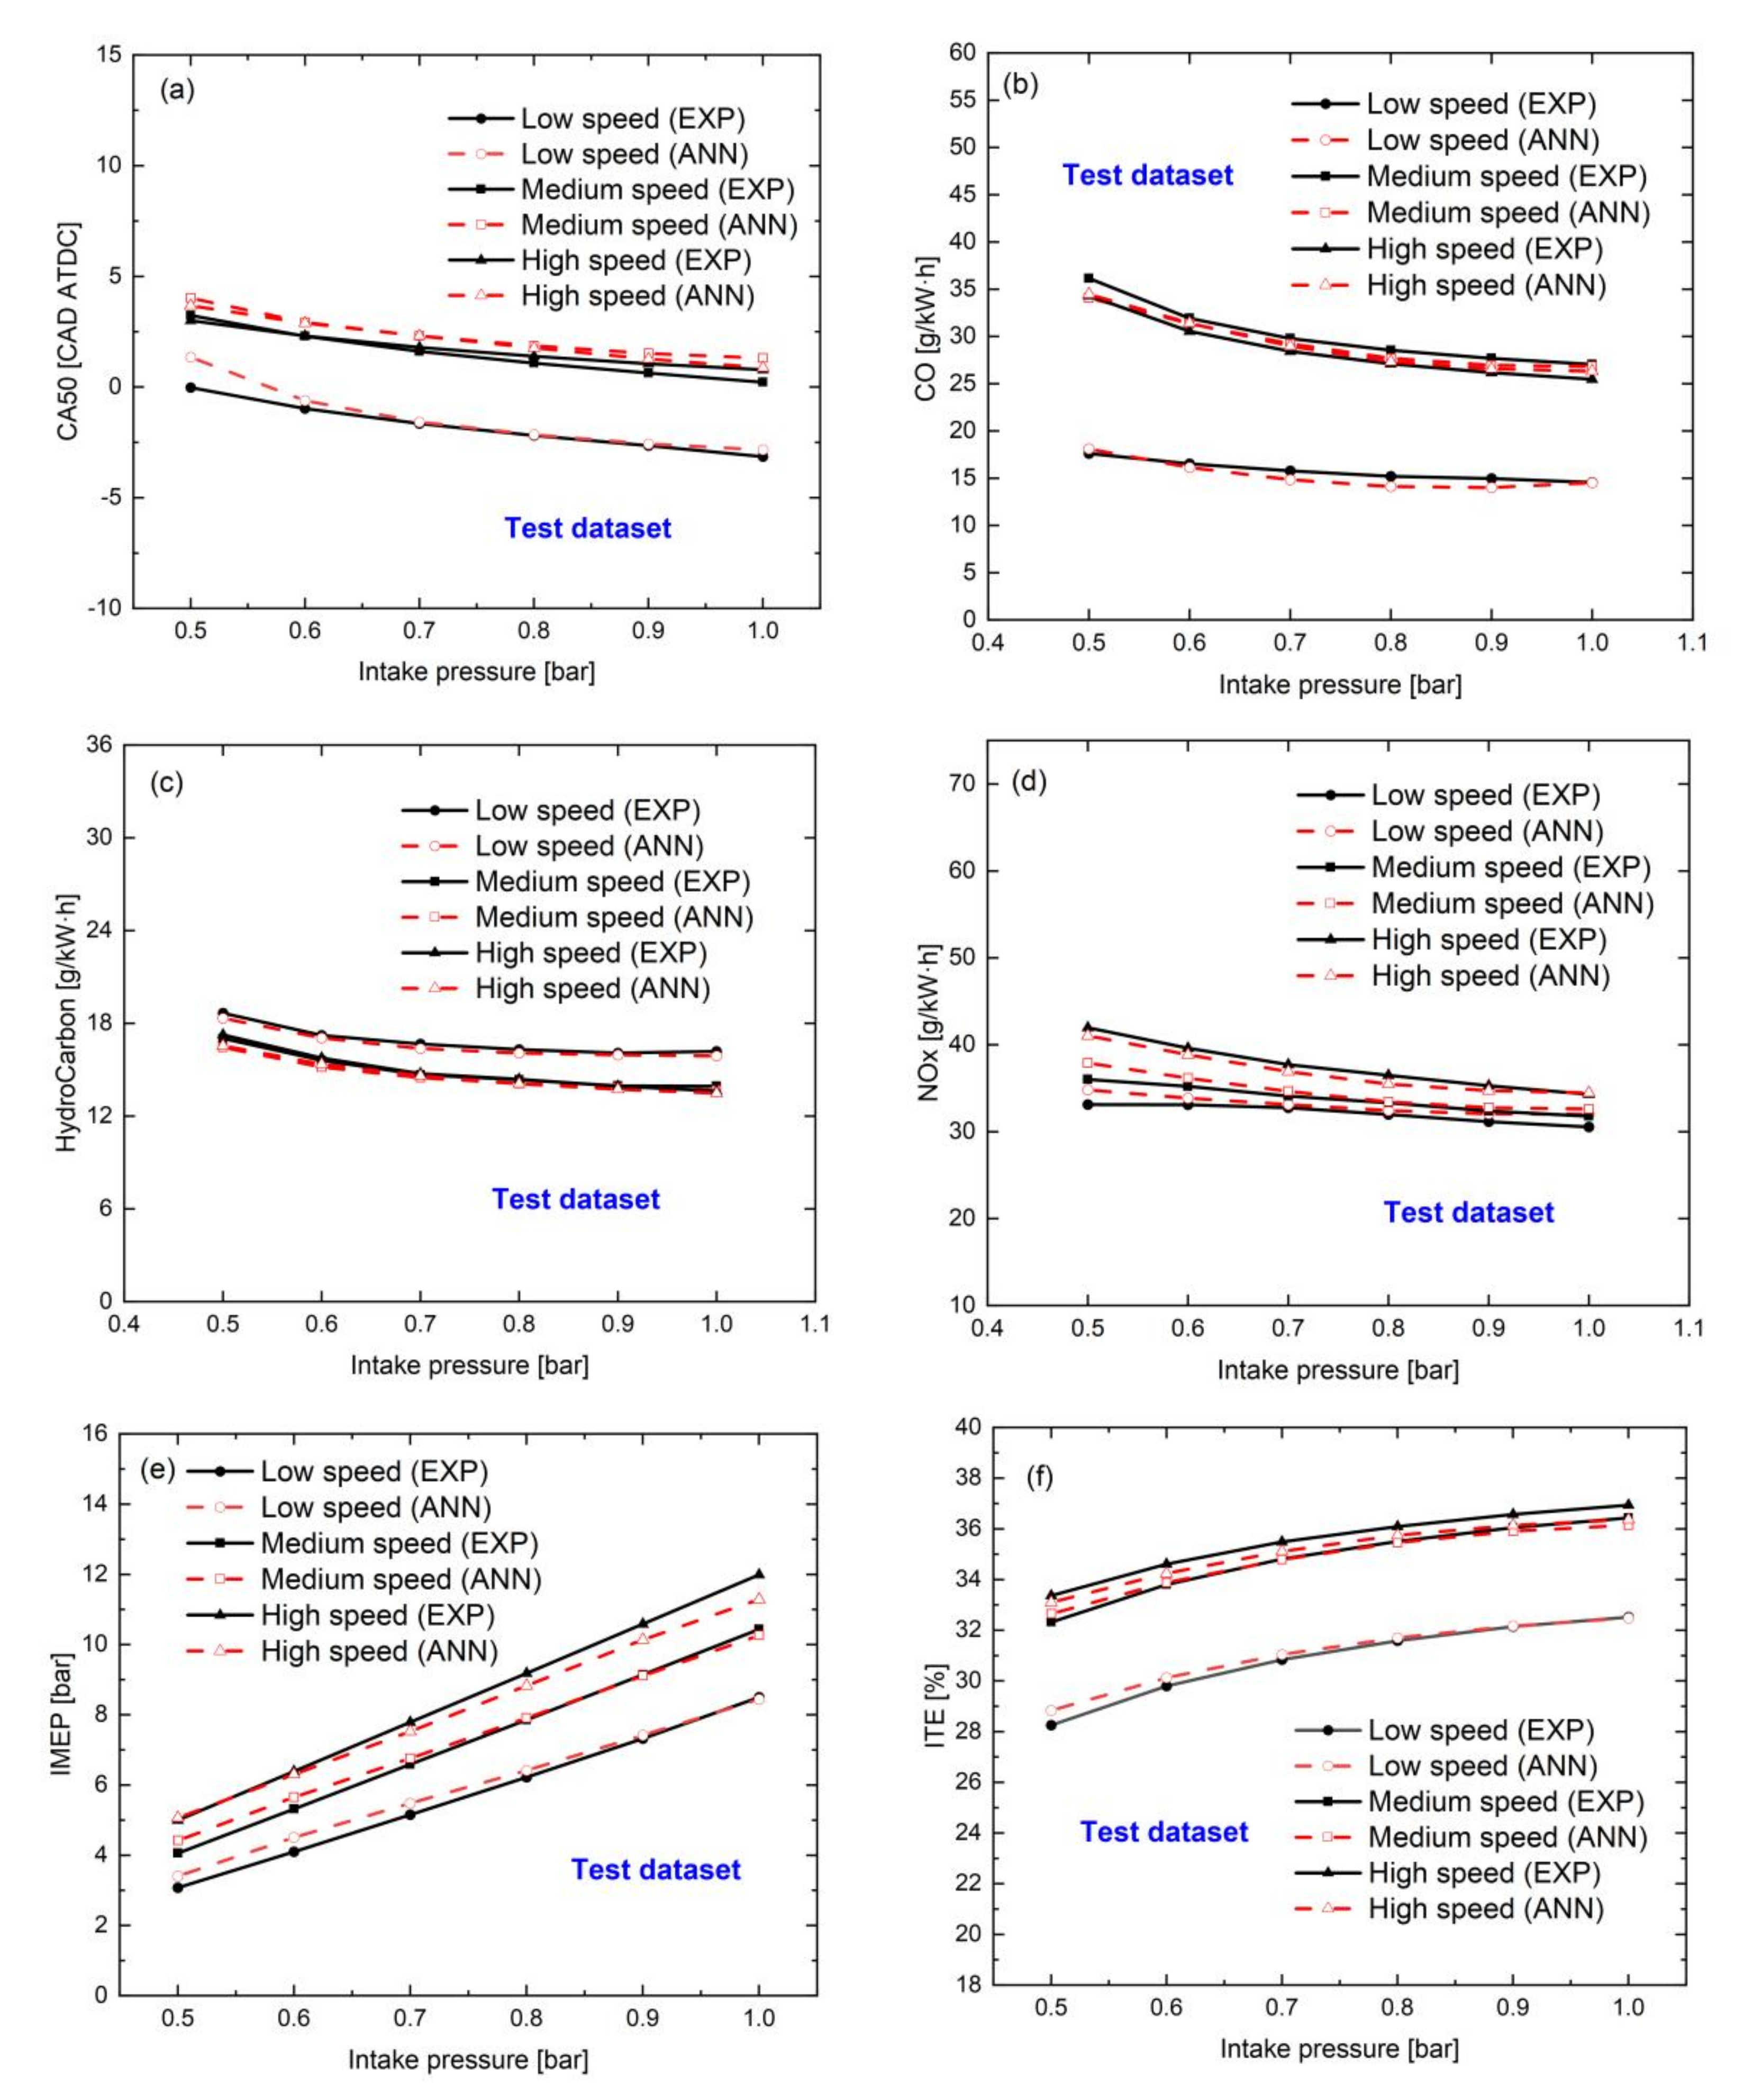
  • Using three types of variables (including six parameters) as output parameters and spark timing, speed, and intake pressure as input indicators with one ANN model, this can achieve good prediction results with close-to-unity R2 and relatively small RMSE. In the future, the whole vehicle only needs one controller in the optimization of powertrain system control strategies, and the results indicated the integration is possible.
  • For the testing dataset, the ANN model can learn the trends between inputs and engine responses, which indicates that ANN can learn some internal intrinsic connections, which may be because some parameters of the chain chemical reaction can be learned by ANN. Therefore, the future ML model can be used to assist the engine design in the future.
Overall, ≈2000 sets of noise-free data provided by a validated 1D model were generated to train the model, and the results show that the ML model can be used to assist in engine design and development. The neural network algorithm must be updated again whenever the engine boundary parameters (e.g., valve timing changes, compression ratio changes) are changed during the design of the powertrain. In the future, more advanced neuron networks can be trained on noisy data, and the related prediction performance of ANN compared with other ML models (i.e., SVM, RF, GBDT) can be considered.

Author Contributions

R.Y., Conceptualization, methodology, simulation, writing—draft preparation; Y.Y., Validation, writing—draft preparation; X.S., Methodology, simulation; Q.W., Writing—draft preparation; J.F., Validation; Y.Z., Validation; Z.L., Analysis, supervision. All authors have read and agreed to the published version of the manuscript.

Funding

This research received no external funding.

Institutional Review Board Statement

Not applicable.

Informed Consent Statement

Not applicable.

Data Availability Statement

The data presented in this study are available on request from the corresponding author.

Acknowledgments

We gratefully acknowledge Zhejiang University, Zhejiang University City College, and Beijing Power Machinery Research Institute for providing the equipment and software usage rights.

Conflicts of Interest

The authors declare no conflict of interest.

Abbreviations

1DOne-Dimensional
ATDCAfter Top Dead Center
ANNArtificial Neural Network
BDTBoosted Decision Tree
BPBack Propagation
BSFCBrake Specific Fuel Consumption
CADCrank Angle Degree
CA5050% Burned Crank Angle
CFDComputational Fluid Dynamics
COCarbon Monoxide
EGTExhaust Gas Temperature
ICEsInternal Combustion Engines
IMEPIndicated Mean Effective Pressure
ITEIndicated Thermal Efficiency
MBDModel-Based Design
MBTMaximum Brake Torque
MLMachine Learning
NOxNitrogen Oxides
R2Coefficient of Determination
RFRandom Forest
RMSERoot Mean Squared Error
SISpark Ignition
SSresSum of Squares Due to Regression
SStotSum of squares Due to Error
STSpark Timing
SVRSupport Vector Regression
UHCUnburned Hydrocarbons

References

  1. Yang, R.; Sun, X.; Liu, Z.; Zhang, Y.; Fu, J. A numerical analysis of the effects of equivalence ratio measurement accuracy on the engine efficiency and emissions at varied compression ratios. Processes 2021, 9, 1413. [Google Scholar] [CrossRef]
  2. Liu, J.; Dumitrescu, C.E. 3D CFD simulation of a CI engine converted to SI natural gas operation using the G-equation. Fuel 2018, 232, 833–844. [Google Scholar] [CrossRef]
  3. Liu, J.; Dumitrescu, C.E. Combustion partitioning inside a natural gas spark ignition engine with a bowl-in-piston geometry. Energy Convers. Manag. 2019, 183, 73–83. [Google Scholar] [CrossRef]
  4. Liu, J.; Ulishney, C.J.; Dumitrescu, C.E. Experimental investigation of a heavy-duty natural gas engine performance operated at stoichiometric and lean operations. Energy Convers. Manag. 2021, 243, 114401. [Google Scholar] [CrossRef]
  5. Feser, J.; Gupta, A. Performance and emissions of drop-in aviation biofuels in a lab-scale gas turbine combustor. J. Energy Resour. Technol. 2021, 143, 042103. [Google Scholar] [CrossRef]
  6. Chong, C.T.; Chiong, M.C.; Ng, J.H.; Tran, M.V.; Valera-Medina, A.; Józsa, V.; Tian, B. Dual-fuel operation of biodiesel and natural gas in a model gas turbine combustor. Energy Fuels 2020, 34, 3788–3796. [Google Scholar] [CrossRef]
  7. Yan, Z.; Gainey, B.; Gohn, J.; Hariharan, D.; Saputo, J.; Schmidt, C.; Caliari, F.; Sampath, S.; Lawler, B. A comprehensive experimental investigation of low-temperature combustion with thick thermal barrier coatings. Energy 2021, 222, 119954. [Google Scholar] [CrossRef]
  8. Yan, Z.; Gainey, B.; Lawler, B. A parametric modeling study of thermal barrier coatings in low-temperature combustion engines. Appl. Therm. Eng. 2022, 200, 117687. [Google Scholar] [CrossRef]
  9. Ambrogi, L.; Liu, J.; Battistoni, M.; Dumitrescu, C.; Gasbarro, L. CFD investigation of the effects of gas’ methane number on the performance of a heavy-duty natural-gas spark-ignition engine. SAE Tech. Pap. 2019. [Google Scholar] [CrossRef]
  10. Gasbarro, L.; Liu, J.; Dumitrescu, C.; Ulishney, C.; Battistoni, M.; Ambrogi, L. Heavy-duty compression-ignition engines retrofitted to spark-ignition operation fueled with natural gas. SAE Tech. Pap. 2019. [Google Scholar] [CrossRef]
  11. Liu, J.; Ulishney, C.J.; Dumitrescu, C.E. Effect of spark timing on the combustion stages seen in a heavy-duty compression-ignition engine retrofitted to natural gas spark-ignition operation. SAE Int. J. Engines 2021, 14, 335–344. [Google Scholar] [CrossRef]
  12. Liu, J.; Dumitrescu, C.E. Analysis of two-stage natural-gas lean combustion inside a diesel geometry. Appl. Therm. Eng. 2019, 160, 114116. [Google Scholar] [CrossRef]
  13. Kapusuz, M.; Ozcan, H.; Yamin, J.A. Research of performance on a spark ignition engine fueled by alcohol–gasoline blends using artificial neural networks. Appl. Therm. Eng. 2015, 91, 525–534. [Google Scholar] [CrossRef]
  14. Gainey, B.; Yan, Z.; Lawler, B. Autoignition characterization of methanol, ethanol, propanol, and butanol over a wide range of operating conditions in LTC/HCCI. Fuel 2021, 287, 119495. [Google Scholar] [CrossRef]
  15. Böyükdipi, Ö.; Tüccar, G.; Soyhan, H.S. Experimental investigation and artificial neural networks (ANNs) based prediction of engine vibration of a diesel engine fueled with sunflower biodiesel—NH3 mixtures. Fuel 2021, 304, 121462. [Google Scholar] [CrossRef]
  16. Silitonga, A.S.; Masjuki, H.H.; Ong, H.C.; Sebayang, A.H.; Dharma, S.; Kusumo, F.; Siswantoro, J.; Milano, J.; Daud, K.; Mahlia, T.M.I.; et al. Evaluation of the engine performance and exhaust emissions of biodiesel-bioethanol-diesel blends using kernel-based extreme learning machine. Energy 2018, 159, 1075–1087. [Google Scholar] [CrossRef]
  17. Stocchi, I.; Liu, J.; Dumitrescu, C.E.; Battistoni, M.; Grimaldi, C.N. Effect of piston crevices on the numerical simulation of a heavy-duty diesel engine retrofitted to natural-gas spark-ignition operation. J. Energy Resour. Technol. 2019, 141, 112204. [Google Scholar] [CrossRef]
  18. Liu, J.; Szybist, J.; Dumitrescu, C. Choice of tuning parameters on 3D IC engine simulations using G-equation. SAE Tech. Pap. 2018. [Google Scholar] [CrossRef]
  19. Ahmad, M.W.; Mourshed, M.; Rezgui, Y. Trees vs Neurons: Comparison between random forest and ANN for high-resolution prediction of building energy consumption. Energy Build. 2017, 147, 77–89. [Google Scholar] [CrossRef]
  20. Sadat-Mohammadi, M.; Shakerian, S.; Liu, Y.; Asadi, S.; Jebelli, H. Non-invasive physical demand assessment using wearable respiration sensor and random forest classifier. J. Build. Eng. 2021, 44, 103279. [Google Scholar] [CrossRef]
  21. Suryadevara, N.K. Energy and latency reductions at the fog gateway using a machine learning classifier. Sustain. Comput. Inform. Syst. 2021, 31, 100582. [Google Scholar] [CrossRef]
  22. Pai, P.S.; Rao, B.S. Artificial neural network based prediction of performance and emission characteristics of a variable compression ratio CI engine using WCO as a biodiesel at different injection timings. Appl. Energy 2011, 88, 2344–2354. [Google Scholar]
  23. Douna, V.; Barraza, V.; Grings, F.; Huete, A.; Restrepo-Coupe, N.; Beringer, J. Towards a remote sensing data based evapotranspiration estimation in Northern Australia using a simple random forest approach. J. Arid. Environ. 2021, 191, 104513. [Google Scholar] [CrossRef]
  24. Sayin, C.; Ertunc, H.M.; Hosoz, M.; Kilicaslan, I.; Canakci, M. Performance and exhaust emissions of a gasoline engine using artificial neural network. Appl. Therm. Eng. 2007, 27, 46–54. [Google Scholar] [CrossRef]
  25. Oliphant, A.J.; Thenkabail, P.S.; Teluguntla, P.; Xiong, J.; Gumma, M.K.; Congalton, R.G.; Yadav, K. Mapping cropland extent of Southeast and Northeast Asia using multi-year time-series Landsat 30-m data using a random forest classifier on the Google Earth Engine Cloud. Int. J. Appl. Earth Obs. Geoinf. 2019, 81, 110–124. [Google Scholar] [CrossRef]
  26. Huang, Q.; Liu, J. Practical limitations of lane detection algorithm based on Hough transform in challenging scenarios. Int. J. Adv. Robot. Syst. 2021, 18, 17298814211008752. [Google Scholar] [CrossRef]
  27. Liu, J.; Wang, H. Machine learning assisted modeling of mixing timescale for LES/PDF of high-Karlovitz turbulent premixed combustion. Combust. Flame 2022, 238, 111895. [Google Scholar] [CrossRef]
  28. Liu, J.; Ulishney, C.J.; Dumitrescu, C.E. Comparative performance of machine learning algorithms in predicting nitrogen oxides emissions of a heavy duty natural gas spark ignition engine. In Proceedings of the International Conference on Applied Energy, Virtual, 29 November–2 December 2021. [Google Scholar]
  29. Liu, J.; Ulishney, C.J.; Dumitrescu, C.E. Application of random forest machine learning models to forecast combustion profile parameters of a natural gas spark ignition engine. In Proceedings of the American Society of Mechanical Engineers International Mechanical Engineering Congress and Exposition, Virtual, Online, 16–19 November 2020. [Google Scholar] [CrossRef]
  30. Oh, H.; Hwang, J.; Pickett, L.M.; Han, D. Machine-learning based prediction of injection rate and solenoid voltage characteristics in GDI injectors. Fuel 2021, 92, 122569. [Google Scholar] [CrossRef]
  31. Yang, R.; Sun, X.; Liu, Z.; Zhang, Y.; Fu, J. A numerical study into the importance of equivalence ratio measurement accuracy for spark ignition engines. In Proceedings of the ASME 2021 International Mechanical Engineering Congress and Exposition, Virtual, Online, 1–5 November 2021. [Google Scholar]
  32. Liu, J.; Ulishney, C.J.; Dumitrescu, C.E. Predicting the combustion phasing of a natural gas spark ignition engine using the k-nearest neighbors algorithm. In Proceedings of the American Society of Mechanical Engineers International Mechanical Engineering Congress and Exposition, Virtual, Online, 16–19 November 2020. [Google Scholar] [CrossRef]
  33. Parlak, A.; Islamoglu, Y.; Yasar, H.; Egrisogut, A. Application of artificial neural network to predict specific fuel consumption and exhaust temperature for a diesel engine. Appl. Therm. Eng. 2006, 26, 824–828. [Google Scholar] [CrossRef]
  34. Mohammadhassani, J.; Dadvand, A.; Khalilarya, S.; Solimanpur, M. Prediction and reduction of diesel engine emissions using a combined ANN–ACO method. Appl. Soft Comput. 2015, 34, 139–150. [Google Scholar] [CrossRef]
  35. Liu, J.; Huang, Q.; Ulishney, C.; Dumitrescu, C.E. Comparison of random forest and neural network in modeling the performance and emissions of a natural gas spark ignition engine. J. Energy Resour. Technol. 2022, 144, 032310. [Google Scholar] [CrossRef]
  36. Hoang, A.T.; Nižetić, S.; Ong, H.C.; Tarelko, W.; Le, T.H.; Chau, M.Q.; Nguyen, X.P. A review on application of artificial neural network (ANN) for performance and emission characteristics of diesel engine fueled with biodiesel-based fuels. Sustain. Energy Technol. Assess. 2021, 47, 101416. [Google Scholar]
  37. Liu, J.; Ulishney, C.J.; Dumitrescu, C.E. Random forest machine learning model for predicting combustion feedback information of a natural gas spark ignition engine. J. Energy Resour. Technol. 2021, 143, 012301. [Google Scholar] [CrossRef]
  38. Di Mauro, A.; Chen, H.; Sick, V. Neural network prediction of cycle-to-cycle power variability in a spark-ignited internal combustion engine. Proc. Combust. Inst. 2019, 37, 4937–4944. [Google Scholar] [CrossRef]
  39. Ismail, H.M.; Ng, H.K.; Queck, C.W.; Gan, S. Artificial neural networks modelling of engine-out responses for a light-duty diesel engine fuelled with biodiesel blends. Appl. Energy 2012, 92, 769–777. [Google Scholar] [CrossRef]
  40. Liu, J.; Huang, Q.; Ulishney, C.; Dumitrescu, C.E. Prediction of exhaust gas temperature of a natural gas spark ignition engine using machine learning methods. In Proceedings of the International Conference on Applied Energy, Virtual, 1–10 December 2020. [Google Scholar]
  41. Liu, J.; Ulishney, C.; Dumitrescu, C.E. Prediction of efficient operating conditions inside a heavy-duty natural gas spark ignition engine using artificial neural networks. In Proceedings of the American Society of Mechanical Engineers International Mechanical Engineering Congress and Exposition, Virtual, Online, 16–19 November 2020. [Google Scholar] [CrossRef]
  42. Liu, J.; Ulishney, C.; Dumitrescu, C.E. Improving machine learning model performance in predicting the indicated mean effective pressure of a natural gas engine. In Proceedings of the American Society of Mechanical Engineers Internal Combustion Engine Division Fall Technical Conference, Virtual, Online, 4–6 November 2020. [Google Scholar] [CrossRef]
  43. Korres, D.M.; Anastopoulos, G.; Lois, E.; Alexandridis, A.; Sarimveis, H.; Bafas, G. A neural network approach to the prediction of diesel fuel lubricity. Fuel 2002, 81, 1243–1250. [Google Scholar] [CrossRef]
  44. Deng, Y.; Zhu, M.; Xiang, D.; Cheng, X. An analysis for effect of cetane number on exhaust emissions from engine with the neural network. Fuel 2002, 81, 1963–1970. [Google Scholar]
  45. Gamo, S.O.; Ouladsine, M.; Rachid, A. Diesel engine exhaust emissions modelling using artificial neural networks. SAE Tech. Pap. 1999. [Google Scholar] [CrossRef]
  46. Obodeh, O.; Ajuwa, C.I. Evaluation of artificial neural network performance in predicting diesel engine NOx emissions. Eur. J. Sci. Res. 2009, 33, 642–653. [Google Scholar]
  47. Togun, N.K.; Baysec, S. Prediction of torque and specific fuel consumption of a gasoline engine by using artificial neural networks. Appl. Energy 2010, 87, 349–355. [Google Scholar] [CrossRef]
  48. Brusca, S.; Lanzafame, R.; Messina, M. Neural Network application to evaluate thermodynamic properties of ICE’s combustion gases. SAE Tech. Pap. 2005. [Google Scholar] [CrossRef]
  49. Li, Y.; Jia, M.; Han, X.; Bai, X.S. Towards a comprehensive optimization of engine efficiency and emissions by coupling artificial neural network (ANN) with genetic algorithm (GA). Energy 2021, 225, 120331. [Google Scholar] [CrossRef]
  50. Ghobadian, B.; Rahimi, H.; Nikbakht, A.M.; Najafi, G.; Yusaf, T.F. Diesel engine performance and exhaust emission analysis using waste cooking biodiesel fuel with an artificial neural network. Renew. Energy 2009, 34, 976–982. [Google Scholar] [CrossRef] [Green Version]
  51. Negnevitsky, M. Artificial Intelligence: A Guide to Intelligent Systems; Pearson Education: London, UK, 2005. [Google Scholar]
  52. Rajkumar, S.; Das, A.; Thangaraja, J. Integration of artificial neural network, multi-objective genetic algorithm and phenomenological combustion modelling for effective operation of biodiesel blends in an automotive engine. Energy 2022, 239, 121889. [Google Scholar] [CrossRef]
  53. Fu, J.; Yang, R.; Li, X.; Sun, X.; Li, Y.; Liu, Z.; Zhang, Y.; Sunden, B. Application of artificial neural network to forecast engine performance and emissions of a spark ignition engine. Appl. Therm. Eng. 2022, 201, 117749. [Google Scholar] [CrossRef]
  54. Huang, Q.; Liu, J.; Ulishney, C.; Dumitrescu, C.E. On the use of artificial neural networks to model the performance and emissions of a heavy-duty natural gas spark ignition engine. Int. J. Engine Res. 2021, 14680874211034409. [Google Scholar] [CrossRef]
  55. Liu, J.; Huang, Q.; Ulishney, C.; Dumitrescu, C.E. Machine learning assisted prediction of exhaust gas temperature of a heavy-duty natural gas spark ignition engine. Appl. Energy 2021, 300, 117413. [Google Scholar] [CrossRef]
  56. Liu, J.; Huang, Q.; Ulishney, C.; Dumitrescu, C.E. A support-vector machine model to predict the dynamic performance of a heavy-duty natural gas spark ignition engine. SAE Tech. Pap. 2021. [Google Scholar] [CrossRef]
  57. Heywood, J.B. Internal Combustion Engine Fundamentals; McGraw-Hill: New York, NY, USA, 1988. [Google Scholar]
Figure 1. One-dimensional (1D) CFD model of single spark ignition engine.
Processes 10 00204 g001
Figure 2. The overall flow chart of the work.
Processes 10 00204 g002
Figure 3. Comparison of ANN predicted performance and emissions with actual value for the training dataset: (a) CA50, (b) CO, (c) UHC, (d) NOx, (e) IMEP, (f) ITE.
Processes 10 00204 g003aProcesses 10 00204 g003b
Figure 4. Comparison of ANN predicted performance and emissions with actual value for the validation dataset: (a) CA50, (b) CO, (c) UHC, (d) NOx, (e) IMEP, (f) ITE.
Processes 10 00204 g004
Figure 5. Comparison of ANN model predicted performance and emissions with calibrated data under low load for the steady test dataset: spark timing effects: (a) CA50, (b) CO, (c) UHC, (d) NOx, (e) IMEP, (f) ITE.
Processes 10 00204 g005
Figure 6. Comparison of ANN model predicted performance and emissions with calibrated data under medium load for the steady test dataset: spark timing effects: (a) CA50, (b) CO, (c) UHC, (d) NOx, (e) IMEP, (f) ITE.
Processes 10 00204 g006
Figure 7. Comparison of ANN model predicted performance and emissions with calibrated data under high load for the steady test dataset: spark timing effects: (a) CA50, (b) CO, (c) UHC, (d) NOx, (e) IMEP, (f) ITE.
Processes 10 00204 g007
Figure 8. Comparison of ANN model predicted performance and emissions with calibrated data at the spark timing = −20 CA ATDC for the steady test dataset: speed effects: (a) CA50, (b) CO, (c) UHC, (d) NOx, (e) IMEP, (f) ITE.
Processes 10 00204 g008
Figure 9. Comparison of ANN model predicted performance and emissions with calibrated data at the spark timing = −20 CA ATDC for the steady test dataset: load effects: (a) CA50, (b) CO, (c) UHC, (d) NOx, (e) IMEP, (f) ITE.
Processes 10 00204 g009
Table 1. Various algorithms for engine responses prediction.
ReferencesAlgorithmOutputMain Conclusions
[40]ANN, GBDT, RF, SVRExhaust gas temperature (EGT)ANN is most appropriate for predicting EGT but is more complex for hyperparameter tuning.
[32]K-nearestPhaseBased on the unevenly distributed training set, the KNN model does not predict well.
[41]ANNPeak pressure riseThe ANN model can predict the relationship between pressure-based parameters and key control variables.
[42]BDTIMEPThe BDT model did not perform so well for low load operating conditions.
[43]ANNFuel lubricityThe proposed neuron network can predict the lubricity well, using other diesel fuel properties as inputs.
[44]ANNEmissionsBP neural network can be used to predict emissions with the cetane number as the input parameter.
[45]ANNEmissionsANN can be used for engine exhaust emissions modeling.
[46]ANNNOxThe ANN model is a good tool for NOx prediction if speed and torque are used as input parameters.
[47]ANNTorque, BSFCThe ANN model is very accurate for power class parameter prediction, and the prediction performance and accuracy are very good.
[48]Neuron networkThermodynamic propertiesThe gas thermodynamics properties can be evaluated with Elman neural network.
Table 2. Engine specifications.
Research TypeSingle-Cylinder
Cycle4-stroke SI PFI
Valves per cylinder2
Bore [mm] × Stroke [mm]86 × 86.07
Intake valve opens/closes9 CAD BTDC/84 CAD ABDC
Exhaust valve opens/closes55 CAD BBDC/38 CAD ATDC
Connecting rod length [mm]175
Piston cup diameter [mm]80
Piston cup depth [mm]5
Wrist pin to crank offset [mm]1
Compression ratio9.5
TDC clearance height [mm]1
Table 3. The R2 coefficient and RMSE calculated for the training dataset based on the different structures of the ANN model.
ANN Structure3-7-63-7-7-63-5-5-6
R2 (CA50)0.99560.99770.9907
R2 (CO emissions)0.94990.98280.9687
R2 (HC emissions)0.97510.99360.9755
R2 (NOx emissions)0.96500.98990.9316
R2 (IMEP)0.98380.98920.9923
R2 (ITE)0.97550.99140.9829
RMSE (CA50)0.86370.83531.2378
RMSE (CO emissions)1.80981.05071.4158
RMSE (HC emissions)0.71020.46590.7029
RMSE (NOx emissions)2.31871.39463.2367
RMSE (IMEP)0.29910.30600.2063
RMSE (ITE)0.51680.32250.4264
Table 4. The R2 coefficient and RMSE calculated for the validation dataset based on the different structures of the ANN model.
ANN Structure3-7-63-7-7-63-5-5-6
R2 (CA50)0.99550.99780.9907
R2 (CO emissions)0.94620.97960.9719
R2 (HC emissions)0.96520.98780.9647
R2 (NOx emissions)0.94750.98070.9138
R2 (IMEP)0.98220.98750.9913
R2 (ITE)0.97240.99160.9860
RMSE (CA50)0.89310.84361.2541
RMSE (CO emissions)1.84291.12911.3253
RMSE (HC emissions)0.89970.64280.9041
RMSE (NOx emissions)3.06592.01263.9147
RMSE (IMEP)0.30570.31020.2131
RMSE (ITE)0.56880.33300.3999
Publisher’s Note: MDPI stays neutral with regard to jurisdictional claims in published maps and institutional affiliations.

