Article

Unsteady Mass Transfer in Bubble Wakes Analyzed by Lagrangian Coherent Structures in a Flat-Bed Reactor

1
Institute of Multiphase Flows, Hamburg University of Technology, 21073 Hamburg, Germany
2
Department of Mechanical Engineering and Production Management, Hamburg University of Applied Science, 20099 Hamburg, Germany
*
Authors to whom correspondence should be addressed.
Processes 2022, 10(12), 2686; https://doi.org/10.3390/pr10122686
Submission received: 4 November 2022 / Revised: 24 November 2022 / Accepted: 6 December 2022 / Published: 13 December 2022
(This article belongs to the Special Issue Multiphase Reaction Process Design and Optimization)

Abstract

:
To increase the yield and selectivity in reactive bubbly flows, the gas-liquid interactions have to be understood in depth. In the current fundamental study, flow and concentration data of the wakes of two-dimensional bubbles in an organic solvent are obtained experimentally in a flat-bed reactor. The unsteady mass transport phenomena in these turbulent wakes of two freely rising, two-dimensional bubbles with bubble Reynolds numbers Re = 949 and Re = 388 are evaluated by analyzing Lagrangian Coherent Structures (LCS). To reveal how LCS govern the transport of dissolved gas in bubble wakes, and therefore affect gas-liquid reactions, LCS in two-dimensional velocity fields are computed and compared with concentration fields of dissolved gas. The analysis of backward Finite Time Lyapunov Exponent (bFTLE) fields reveals coherent fluid dynamic structures for both bubble Reynolds numbers studied. In the higher bubble Reynolds number case, two types of coherent structures are found, which hinder the mixing of the dissolved gas and the liquid bulk. Repelling LCS are found to enclose parcels transported into the vortices, and indicate thus, which fluid parcels can possibly take part in chemical reactions. Due to higher mixing, unveiled by details from the LCS and FTLE analyses, and therefore increased contact area between dissolved gas and fresh liquid, higher yields of reaction products are suggested for the lower bubble Reynolds number case in this two-dimensional study. This is contradicting the rule of thumb that mixing increases for higher bubble Reynolds numbers.

1. Introduction

Applications of multiphase flows in the field of chemical reactions in the industry are, for instance, oxidation, hydrogenation, and chlorination. By improving the efficiency of chemical reactions in bubbly flows, the energy input and waste production can be reduced inherently [1]. To accomplish these improvements for gas-liquid reactions mainly occurring in the continuous phase [2], a deep understanding of the governing gas-liquid interactions in bubble wakes is crucial.
We are considering cases where the Hatta number (Equation (1))
Ha = δ k C i n 1 D gl 1 ,
with δ denoting the thickness of the boundary layer, k the reaction rate, C i n 1 the concentration at the gas-liquid interface, n the order of the reaction and D gl the diffusion coefficient of the gas, is low to intermediate ( Ha 3 ) [3,4]. Therefore, a large part of the reaction occurs in the liquid phase and not in the direct vicinity of the bubble surface. Furthermore, the Damköhler number (Equation (2))
Da I = τ conv τ reac 1
of the process is neither very small nor very large ( 0 Da I ) [5], meaning that the timescales of the mixing τ conv are in a similar range as the reaction timescales τ reac . To broaden the comprehension of the governing transport phenomena in such cases, it is appropriate to study fundamental systems using strong simplifications in the first step. Studies of single bubble dynamics can deliver crucial insights into local transport and fluid dynamic phenomena. Here, the analysis of Lagrangian Coherent Structures (LCS) in the bubble wakes reveals details about the bubble wake mixing that are otherwise not directly accessible.
In a finite-time interval, LCS unveils transport barriers in turbulent flows by definition of the most repelling, attracting, and shearing material lines in the extended phase space [6,7]. Since the mass flux across LCS is negligible [8], they are particularly interesting for the given purpose of studying transport phenomena. The current study focuses on the analysis of hyperbolic LCS, which are the locally most repelling or attracting material lines [9]. Furthermore, Finite Time Lyapunov Exponents (FTLE), a measure for the sensitivity of final positions with regard to initial positions of fluid parcels, are examined. Lines of high FTLE values indicate strong repelling or attracting material lines and can thus be used to identify transport barriers. FTLE fields allow an analysis of the similarity of fluid transport patterns and concentration fields without a restriction on single manifolds.
A recent measurement technique that allows the evaluation of product concentration and selectivity of competitive-consecutive model reactions is applied in [10,11]. Additionally, Particle Image Velocimetry (PIV) measurements in the wake of bubbles have been performed in both, aqueous solutions [12] and organic solvents [13]. Furthermore, concentration fields of dissolved gas in bubble wake by means of Laser Induced Fluorescence (LIF) have been measured simultaneously to the flow fields [10]. The coupling of both measurement techniques enables a detailed analysis of occurring coherent structures by means of LCS analysis and its correlation to the concentration field. This is desirable as it promotes new insights into the transport phenomena as well as the progression of chemical reactions in bubble wakes [10].
To study freely rising bubbles at a reduced complexity, a setup with high optical accessibility as in the Taylor bubble setup in [10,13] is desired. However, some of the limitations occurring in the Taylor bubble setup, like the varying liquid layer thickness, which aggravates exact concentration measurements [11], or the influence of the counter-current flow needed for bubble fixation, have to be addressed, and overcome. A suitable setup to match those requirements is a flat-bed reactor, displayed in Figure 1, as introduced by Roig et al. [14]. A flat-bed reactor consists of two parallel glass plates with a small gap in between. In case the confinement ratio of the gap width h and the two-dimensional equivalent diameter of the rising bubble d is h / d 1 , the bubble behavior loses its third degree of freedom and, thus, can be considered two-dimensional [15,16]. The two-dimensional equivalent diameter results from the projected bubble area S and is defined by Roig et al. [14] as:
d = 4 S π 1
Typically the fluid dynamic conditions in this reactor concept are characterized by the dimensionless Archimedes (Equation (4)), Eötvös (Equation (5)), and the bubble Reynolds (Equation (6)) numbers
Ar = g d d ν 1
Eo = ( ρ L ρ G ) g d 2 σ 1
Re = u B d ν 1
with ν denoting the kinematic viscosity of the liquid phase, g the gravitation constant, ρ the density of the liquid phase (L) and the gaseous species (G) respectively, σ the surface tension and u B the bubble terminal rising velocity [14]. The mass transfer from bubbles is characterized by the Sherwood number (Equation (7))
Sh = β L d D gl 1
which describes the ratio of convective mass transfer, represented by the mass transfer coefficient β L and the two-dimensional equivalent diameter of the bubble d, to diffusive transfer, represented by the diffusion coefficient D gl .
As of today, the vast majority of research in this field focused on the dynamics of rising bubbles in the water. However, in the current study, the velocity and concentration data are obtained in an organic solvent, restricting the possibility of directly comparing the data with the literature. Keeping this in mind, some of the previous studies in this research area will be presented in the following. For an air-water system, Roig et al. performed a detailed experimental study focusing on the occurring bubble shape regimes, path oscillations, and the vorticity in dependency of the Archimedes number at high bubble Reynolds numbers in a vertically aligned flat-bed reactor [14]. Filella et al. continued with this subject, taking a closer look at the oscillatory motion and the wake of the rising bubbles [17]. While both studies use two-dimensional Particle Image Velocimetry (2D-PIV) to study the flow structures, Pavlov et al. recently used the Shake-the-Box particle tracking algorithm of Schanz et al. [18] to obtain detailed three-dimensional information [19]. Whilst the previous authors focused on the flow structures and fluid dynamic behavior, Roudet et al. investigated the gas-liquid mass transfer at an isolated oxygen bubble rising in water by applying planar Laser Induced Fluorescence (pLIF) at high bubble Reynolds numbers [20]. More recently Felis et al. used colorimetric methods to study the reactive mass transfer around an oxygen bubble rising in acetonitril, using a customized bio-inspired copper complex [21].
The aim of the current study is to investigate the existence of Lagrangian Coherent Structures and transport barriers in the wakes of two freely rising bubbles of different sizes in a flat-bed reactor. The required velocity fields are captured by means of PIV with high temporal and spatial resolution. LCS computed from the velocity data are then compared with the concentration fields of dissolved gas obtained by means of LED-Induced Fluorescence (LEDIF) in the same reactor setup and for similar bubble sizes. This fundamental study will show how the transport of liquid and dissolved gas is governed by Lagrangian Coherent Structures and will help to unveil the complex interplay of mass transfer, fluid dynamics, and chemical reactions.

2. Materials and Methods

2.1. Experimental Setup

The reactor system used in this work for both, the flow and concentration field, measurements (see Figure 1) consists of two vertically aligned borosilicate glass plates (250 mm × 130 mm × 3.8 mm). The glass plates are placed in between a screwed stainless steel frame and are kept apart at a defined distance of h = 1 mm. The resulting field of view (FOV) of 27 mm × 53 mm is recorded with a high-speed camera (Phantom, USA, VEO640L; Lens: Carl Zeiss, Germany, 2/50M ZF2.0 Makro Planar). On the top, a stainless steel closure is screwed to the frame, ensuring a controlled gas atmosphere, if needed, and enabling the flushing of the setup with argon (Westfalen AG, Germany, >99,999 Vol.-% purity) as an inert gas. At the bottom of the reactor, a stainless steel liquid distributor is attached, containing two openings, for filling and draining the liquid, and a hypodermic needle (B. Braun, Germany, Sterican, Size 2: 0.80 × 40 mm) placed in the center to generate the bubbles. The hypodermic needle, which guarantees a reproducible bubble generation [22], is connected to a gas supply and the bubble formation is controlled using a solenoid valve (V4, Buerkert, Germany, Type0127). The reactor is connected via a three-way valve (V2) to a reservoir tank containing the pretreated liquid phase and a gas-tight syringe (Hamilton, Switzerland, Gastight 1025, 25 mL) to fill the setup. For both measurements, flow and concentration field, methanol (Honeywell, USA, HPLC gradient, CAS: 67-56-1) is used as the liquid phase, and two differently sized bubbles are generated by adjusting the pressure at the solenoid valve (V4) to p wobbling = 60 mbar and p ellipsoidal = 30 mbar at a constant opening time of t open = 30 ms. The resulting bubble characteristics are given in Table 1 and both bubbles are shown in Figure 4.

2.1.1. Particle Image Velocimetry

For the visualization and quantitative analysis of the two-dimensional velocity fields of single rising argon bubbles in methanol, two-dimensional two-component PIV (2D + 2C PIV) measurements are performed. To observe the bubble motion without superimposed effects caused by mass transfer, V L = 250 mL of methanol are rinsed with argon for 20 min to ensure an argon saturation of the methanol. In addition, 0.1 g of silver-coated hollow glass spheres (Cospheric, USA, d T =  5–20 μm, ρ p = 750 kg m 3 ) are added, acting as tracer particles for the PIV measurements. To ensure that the tracers are flow following, they must be neutrally buoyant and the Stokes number (Equation (8)) describing the mean tracer diameter and L the characteristic length of the bubble, should not exceed St < 10 2 [23]. The resulting Stokes numbers
St = 2 9 ρ P ρ L d T L 2 Re
are listed in Table 1. Moreover, a sufficient time interval of t > 5 min between consecutively rising single bubbles ensures a stagnant liquid phase before each bubble rises.
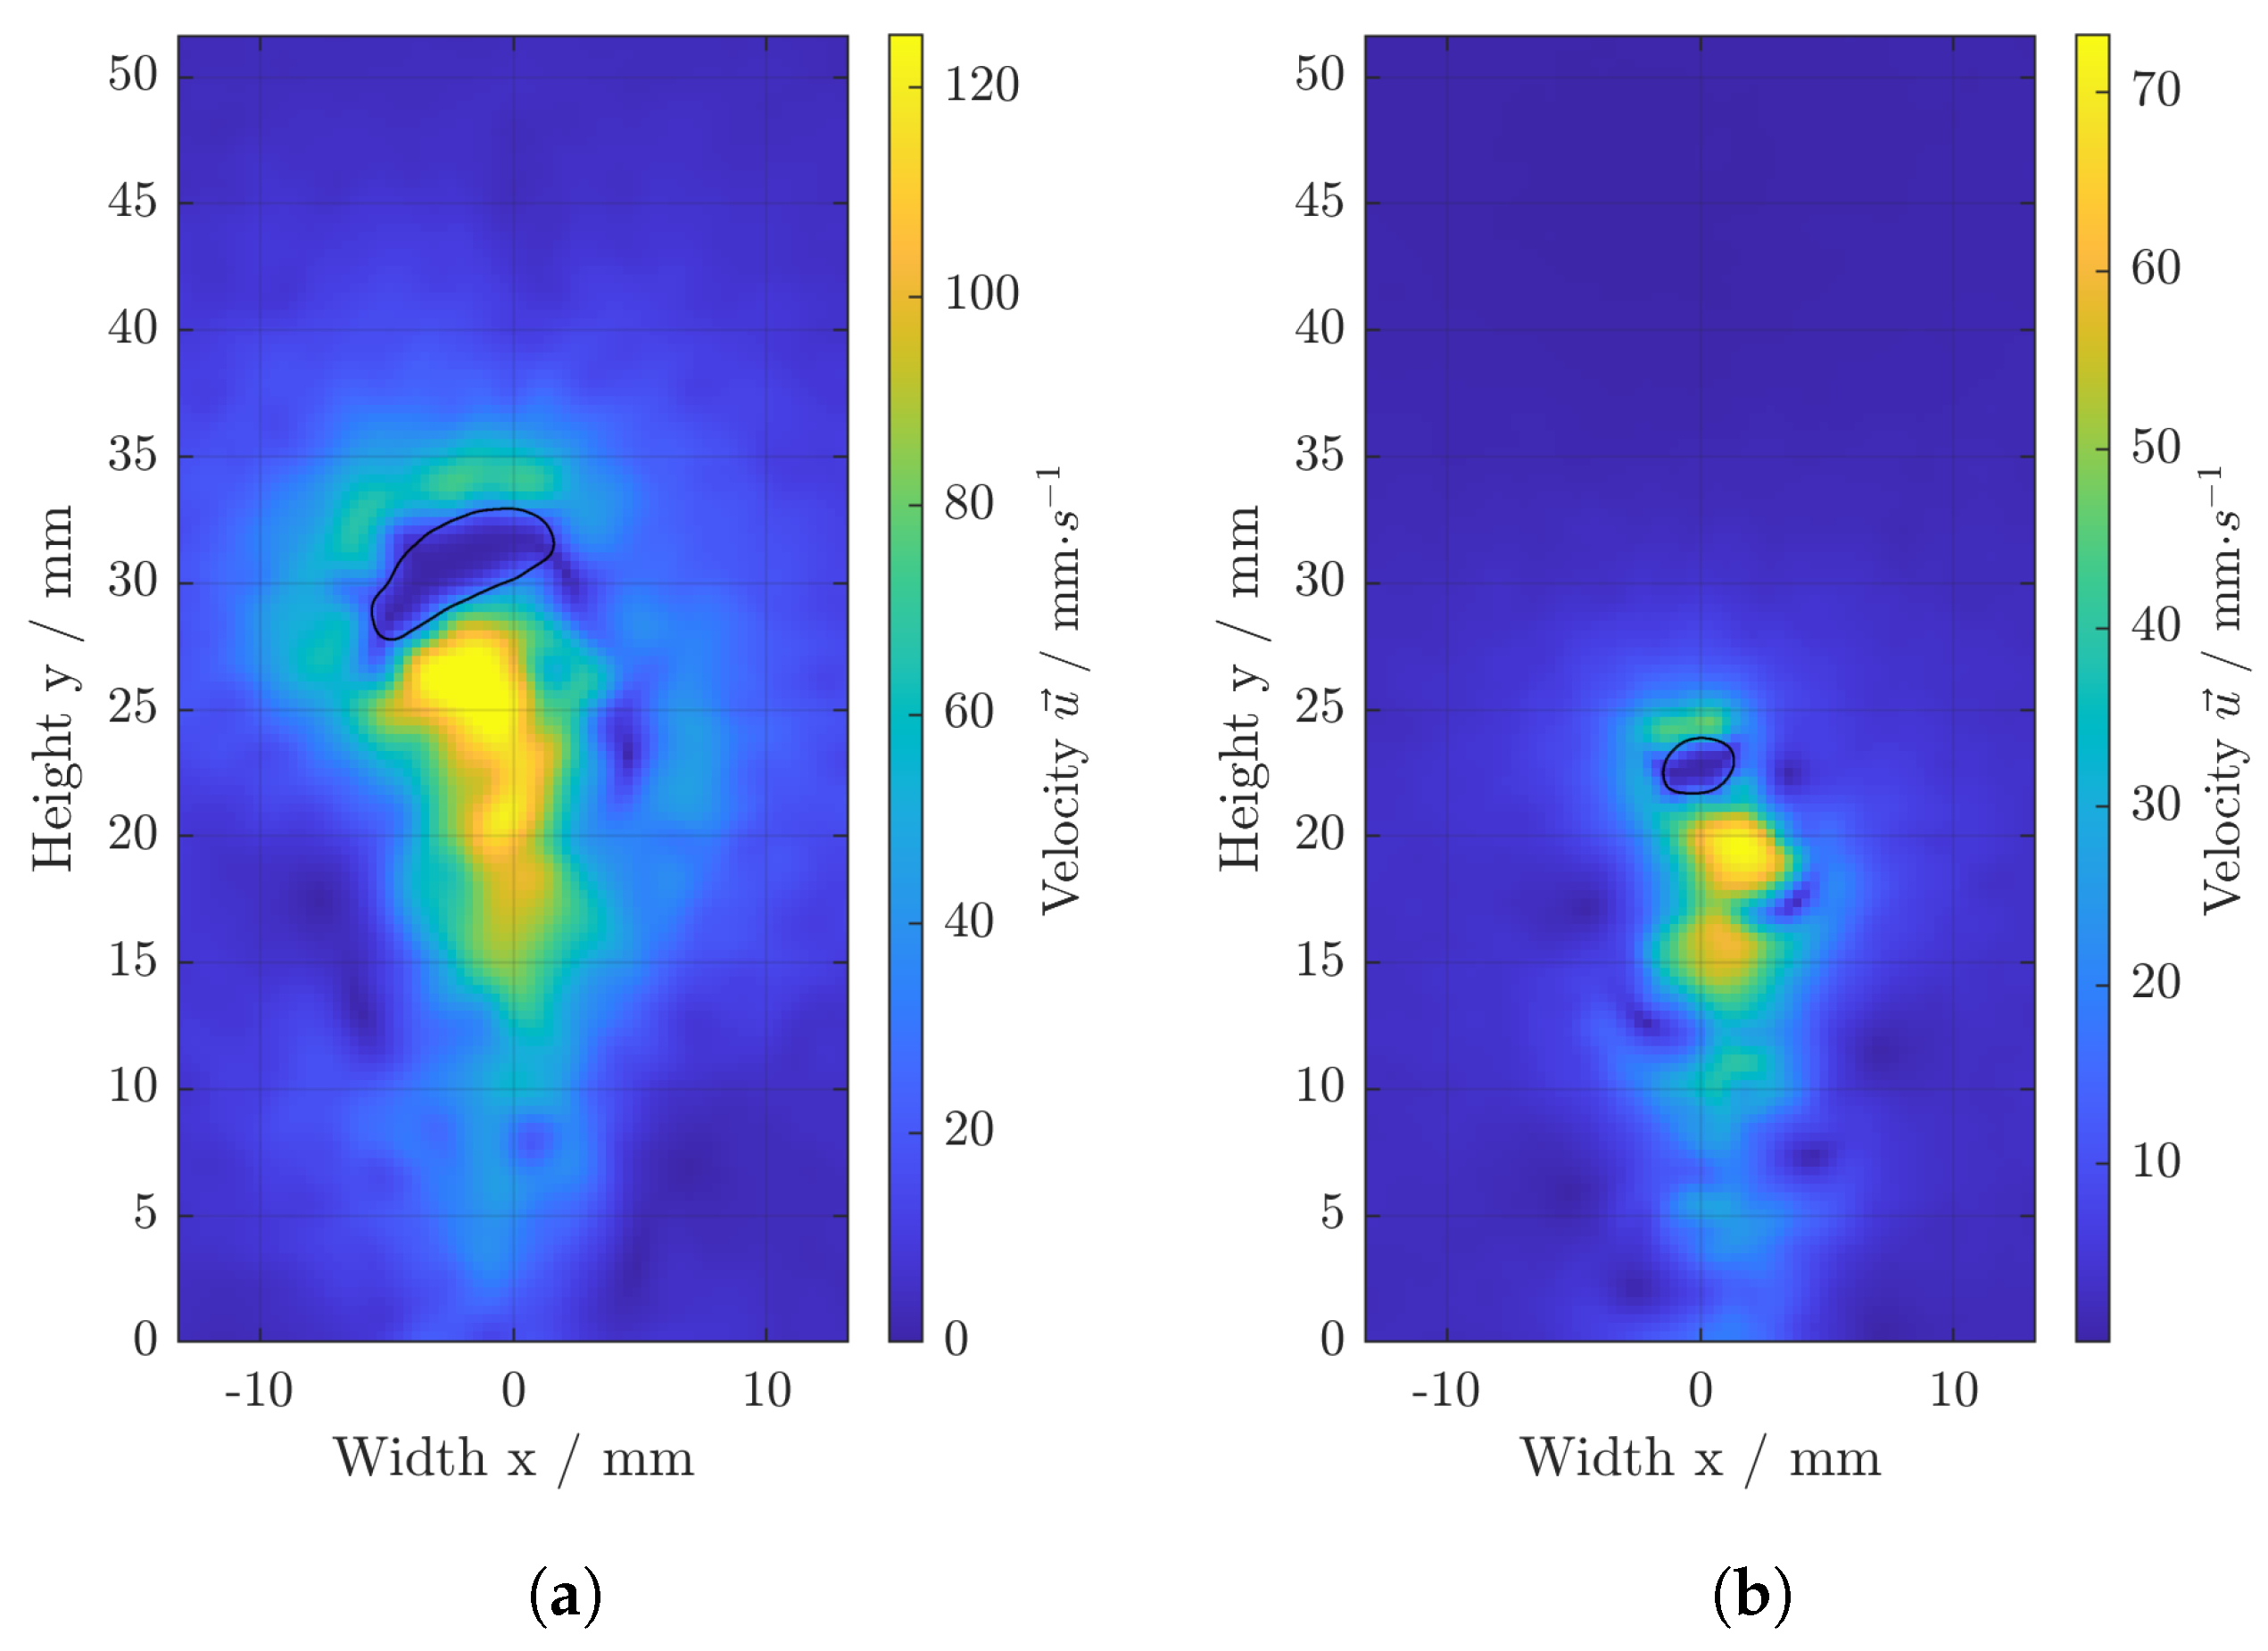
For the image acquisition a high-speed camera (Phantom, USA, VEO640L; Lens: Carl Zeiss, Germany, 2/50M ZF2.0 Makro Planar), and an in-house developed illumination system are used. The main components of the illumination are a high-power LED (Osram, Germany, OSTAR Projection Power, LE B P3W 01) with a wavelength of 459 nm, and a collimator lens. An Arduino DUE is acting as a function generator and is combined with an in-house power unit, providing the needed energy for the LED. Both camera and LED, are actuated by the same trigger signal at a rate of f = 250 Hz. As the tracer particles are not fluorescent, the backscattered light signal needs to be recorded. Therefore, the illumination system is placed on the same side and height as the camera with an angle of 30 shifted laterally, minimizing reflections back into the camera. Prior to the first experiment, a calibration image is taken, yielding a spatial resolution of 24.06 µm px 1 . Thus, in combination with the recording frequency, data acquisition with the high spatio-temporal resolution is possible. The PIV post-processing is performed using the commercial software PIVview 2c V3.62 (PIVTEC GmbH, Germany), yielding velocity fields with large dynamics from very low velocities to velocities exceeding the bubble rise. The applied settings for the PIV processing are given in the supplementary information (cf. Table S1). Due to the large dynamics in the bubble wake, small interrogation windows are chosen for the PIV analysis, since otherwise relevant details of the wake structures are not resolved. However, in a subpart of the interrogation windows seeding is not sufficient and thus some erroneous velocity vectors occur. This leads to some noise in the velocity fields. Therefore, before being processed by Lagrangian analysis, described in Section 2.2, the velocity fields are spatially smoothed using the Gaussian filter routine provided by Matlab with a standard deviation of σ = 1.75 for the wobbling bubble (cf. Figure 2a) and σ = 1.25 for the ellipsoidal bubble (cf. Figure 2b). An exemplary comparison of a smoothed and an unprocessed velocity field is given in the supplementary material (Figures S1–S4). Examples of resulting smoothed velocity fields are shown in Figure 2.

2.1.2. LED-Induced Fluorescence

To enable a direct comparison of the LCS with the concentration fields, LEDIF measurements are performed. Contrary to conventional LIF measurements, instead of a laser acting as the light source to excite the fluorescent dye, the already introduced in-house high-power LED illumination system is used, as in [24]. Thus, the concentration fields of single rising oxygen bubbles can be studied within the exact same reactor setup as the PIV, without moving the camera or the illumination. The dye used is Dichlorotris (1; 10-phenanthroline) ruthenium(II) hydrate (Sigma Aldrich, USA). The fluorescence of this dye is quenched in dependency of the dissolved oxygen concentration [25,26]. Based on previous experiments, a dye concentration of c dye = 30 mgL 1 in V L = 250 mL of methanol is prepared [27]. Afterwards the methanol is treated with argon for 20 min to remove dissolved oxygen from the liquid phase. To ensure an oxygen-free atmosphere in the reactor, it is additionally rinsed with argon for the same time period. The oxygen-free methanol is then pumped into the reactor and a single rising oxygen bubble is recorded, using the same camera, illumination, and bubble generation settings as previously for the PIV measurements. After each bubble is recorded, the methanol is replaced by a fresh oxygen-free solution.
The surface tensions of pure methanol and methanol-dye-solution are measured (Krüss, Germany, DVT50) and compared, to ensure that there are no detectable changes caused by the dye. Since the determined deviation is less than one percent, changes in surface tension by the dye are considered negligible.
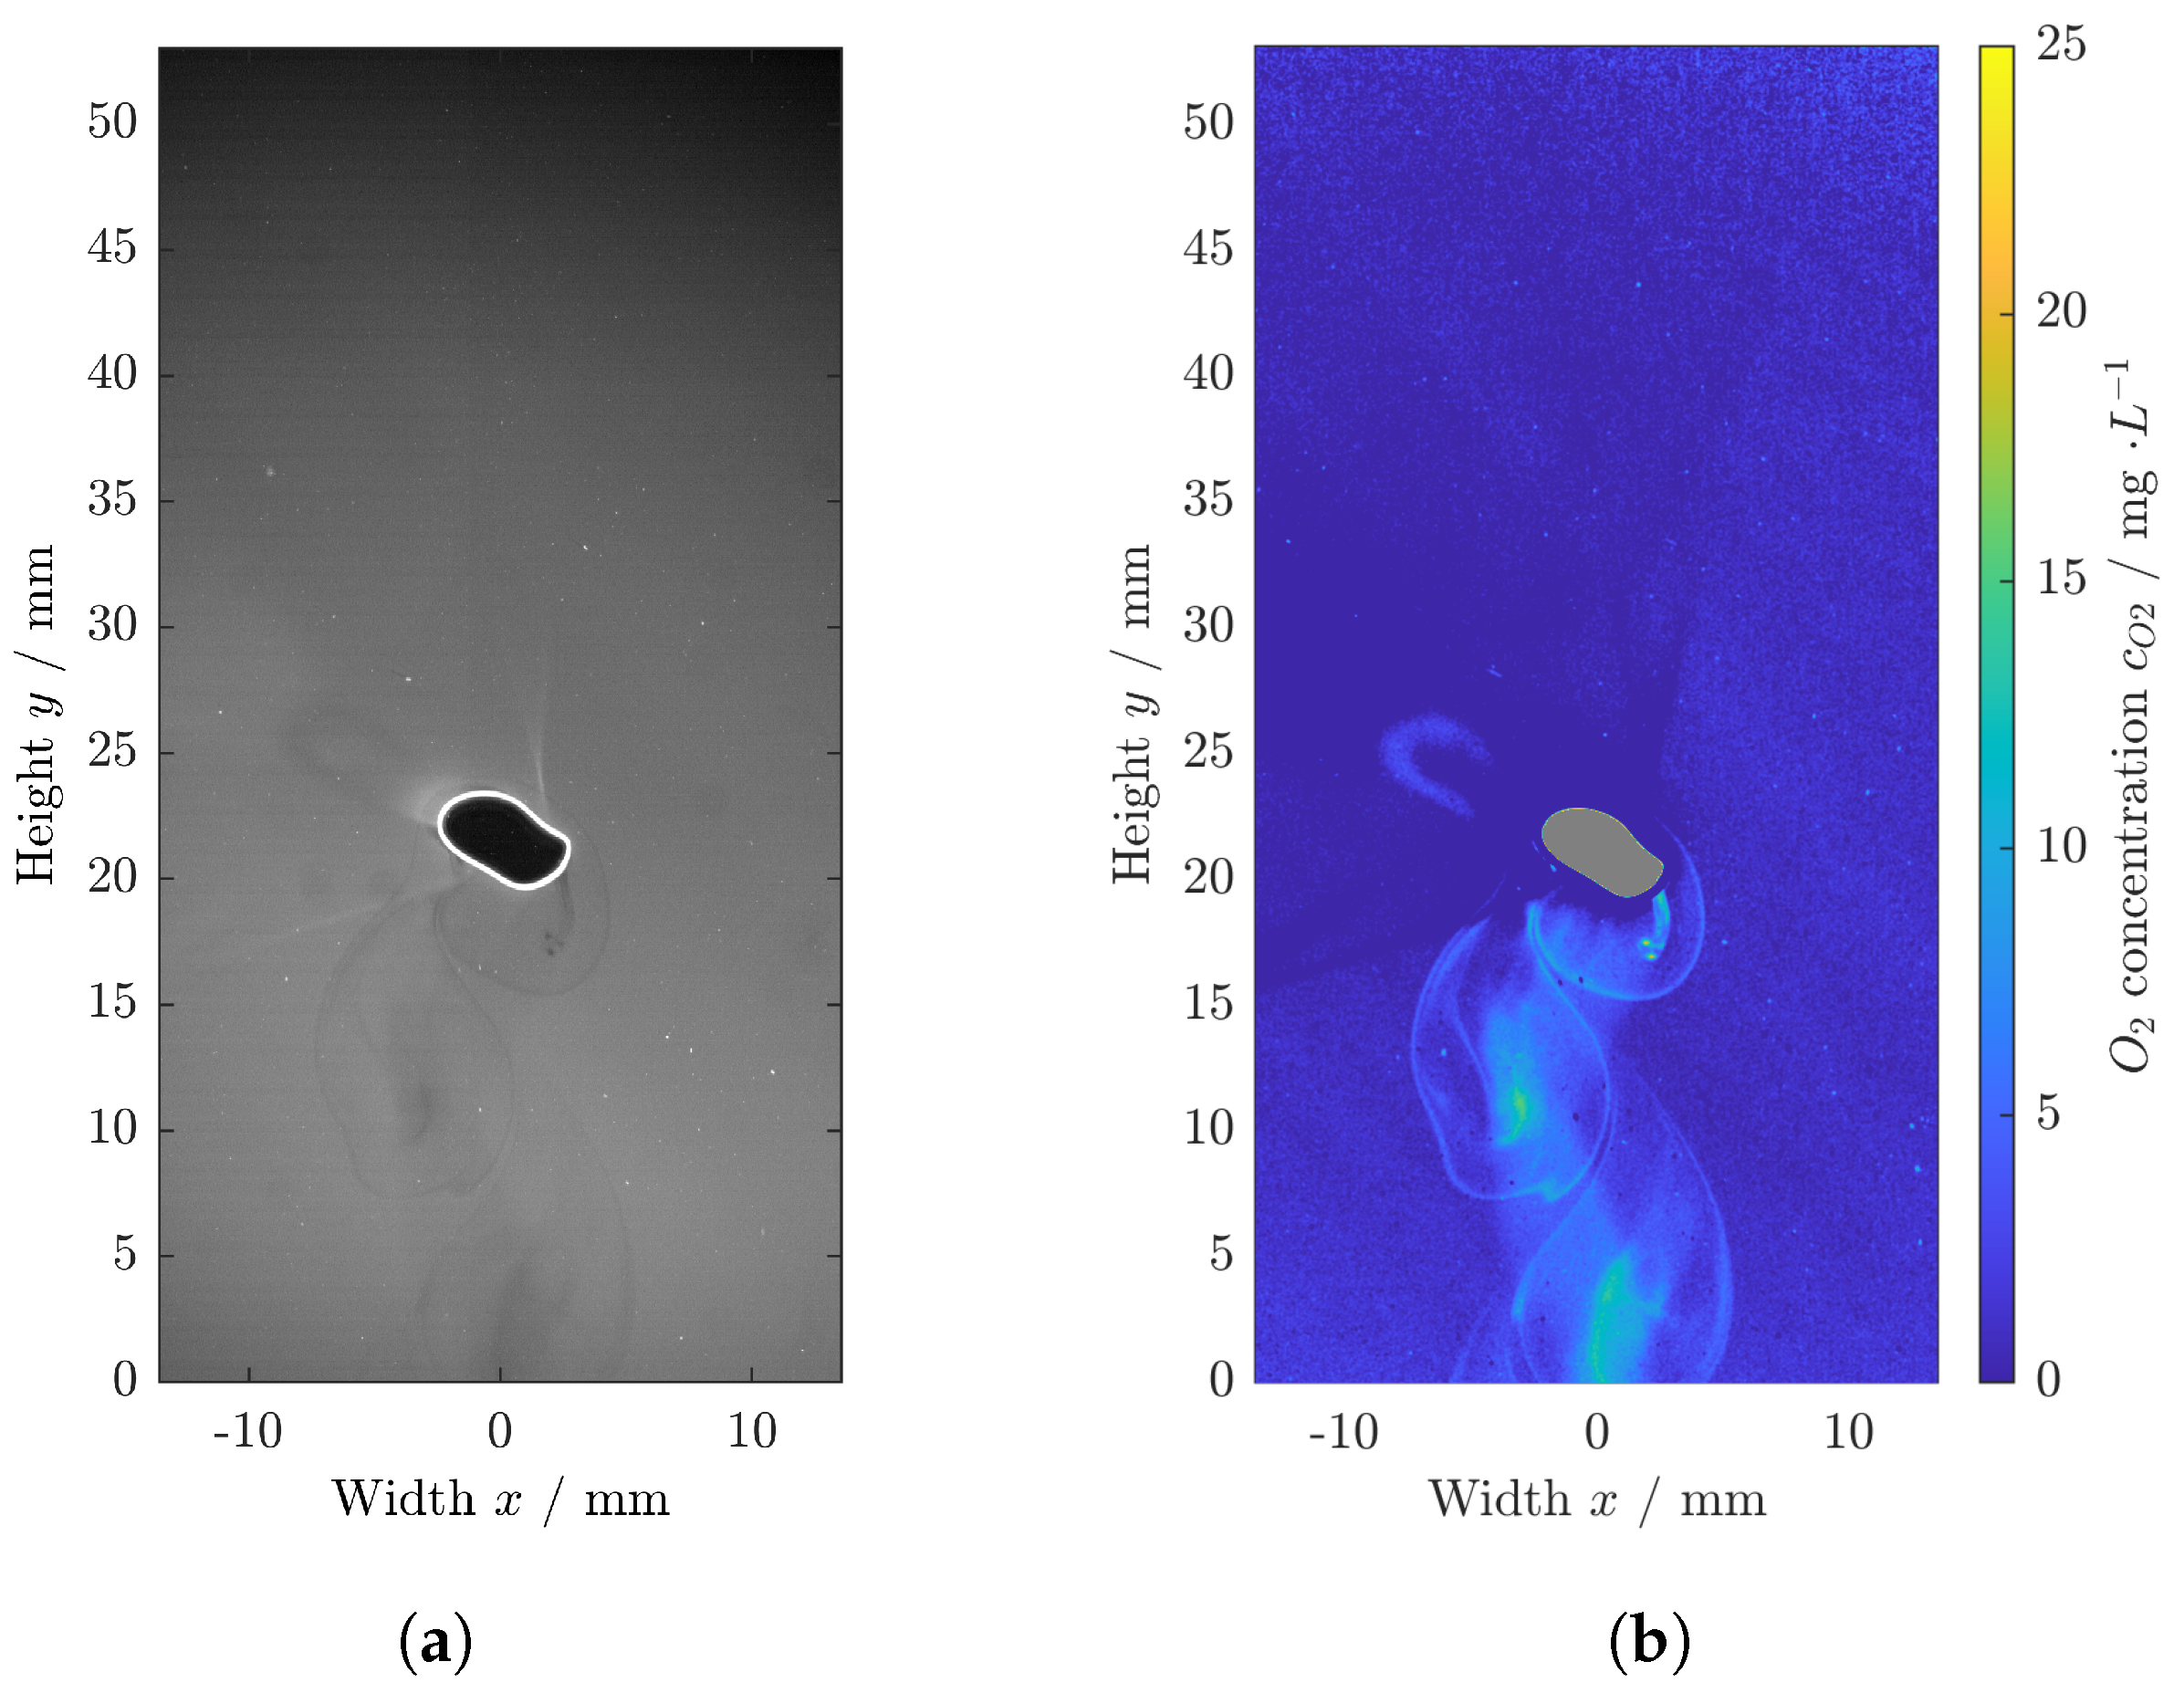
To obtain the quantitative oxygen concentration c O 2 in the bubble wake, a calibration of the grey values G to the oxygen concentration is conducted. The method used has been reported by Kameke et al. [28] and yields an individual linear calibration fit with coefficients m and b for each pixel c O 2 ( i , j ) .
c O 2 = m · G + b
The saturation concentration of oxygen in methanol is c O 2 , Sat = 328 mgL 1 [29]. Since such high concentrations are not expected within the experimental procedure, the calibration of the concentration to the measured grey values is performed by adjusting five different oxygen concentrations ranging from c O 2 = 0 mgL 1 up to c O 2 = 40 mgL 1 . The defined mixtures of oxygen and argon are generated by using two Coriolis mass flow controllers (MFC) (Bronkhorst, Netherlands, 200 mLn/min), cf. Figure 1b. Afterward, the mixture is gassed into the methanol solution for 20 min to ensure an equilibrium state. Next, the solution is transferred into the reactor and the quenched signal is recorded. This procedure is repeated for five concentrations from which the parameters m and b are calculated pixel-wise subsequently. An example of a calibration fit, a recorded gray value image, and a quantitatively analyzed concentration field is displayed in Figure 3.

2.2. Lagrangian Methods

Lagrangian Coherent Structures are computed by investigating the trajectories of virtual fluid parcels seeded equidistantly into the experimentally obtained Eulerian velocity field. Considering an integration of the trajectories in forward time, the repelling material lines are those, along which a patch of fluid parcels stretches most. Oppositely, along attracting lines the largest stretch of a fluid parcel patch is observed in integration in backward time. For their computation, the open access Matlab Toolbox LCS-Tool introduced by Onu et al. in 2015 is used [9]. To obtain the Lagrangian velocities at arbitrary points in space and time, spatial and temporal interpolation of the Eulerian velocity fields is needed in the first step [9]. Linear interpolation is considered sufficient for the current study, since PIV measurements are only reliably possible if particle displacement is not too large and thus the differences in the subsequent velocity fields in time are only moderate.
The virtual fluid parcels are released on an equidistant grid with the size of 308 × 724 parcels. To obtain the largest stretch around each parcel X 0 in a finite-time interval, the deformation tensor F t 0 t ( X 0 ) and the Cauchy-Green strain tensor C t 0 t = F t 0 t ( X 0 ) T F t 0 t ( X 0 ) are determined. The deformation tensor describes the stretch around each parcel, and the Cauchy-Green strain tensor is a symmetric and positive definite matrix, from which the eigenvalues and eigenvectors can be obtained. The eigenvalues λ i and eigenvectors ξ i describe the rate and direction of the stretch. Haller proposed a finite-difference approximation for the deformation tensor [7]:
F t 0 t ( X 0 ) x ( t , X 0 + d x ) x ( t , X 0 d x ) 2 d x x ( t , X 0 + d y ) x ( t , X 0 d y ) 2 d y y ( t , X 0 + d x ) y ( t , X 0 d x ) 2 d x y ( t , X 0 + d y ) y ( t , X 0 d y ) 2 d y
For determining the two-dimensional deformation tensor shown in Equation (10), the nearest grid points are used for the small vectors d i pointing in the x- and y-directions. In the current study, for the calculation of the invariants of the Cauchy-Green strain tensor an auxiliary grid is used, as recommended by Onu et al. for the analysis of data sets [9], with a relative width of δ x = 0.01 . Since the deformations in the time intervals considered are fairly small, the resolution of the auxiliary grid is considered sufficient. To underline this statement, spatial convergence is qualitatively affirmed prior to further analyses by testing different auxiliary grid spacings. The forward and backward FTLE are defined as shown in Equations (11) and (12) [7], where λ 2 is the largest eigenvalue of the Cauchy-Green strain tensor C t 0 t and τ a finite-time interval: τ = t t 0 . Here t 0 is the time when the virtual fluid parcels are released on an equidistant grid, as detailed above.
forward FTLE : Λ + ( X 0 , τ ) = log λ 2 | τ | 1
backward FTLE : Λ ( X 0 , τ ) = log λ 2 | τ | 1
Lastly, hyperbolic LCS are computed by integration of r = ξ i ( r ) along the grid of eigenvectors ξ i . The integration starts at the local maximal/minimal eigenvalue λ 2 / λ 1 respectively, as detailed by Onu et al. in [9]. Here, only the repelling LCS are calculated from the forward integration.
Whilst LCS are identified by integration along eigenvector fields and thus yield single material lines, FTLE are calculated by scaling the scalar field of eigenvalues λ 2 . LCS as well as lines of high FTLE values are considered transport barriers hindering mass flux, and therefore mixing, across them. In the current study, FTLE fields are analyzed, since this enables a consideration of the stretching in the full field of view. High backward FTLE values indicate a strong attraction of fluid parcels in the finite-time interval, whereas high forward FTLE values point out a strong spreading of fluid parcels in time.
No PIV particles were added to the gas of the bubble and therefore, no statement can be made about the gas flow inside the bubble. Therefore, all velocities inside the bubble, and thus also at the bubble surface, are set to zero (cf. Figure 2). Owing to the missing velocities right at the bubble surface, in the subsequent computation described above some nonphysically behaving fluid parcels entering the bubble volume were observed. These fluid parcels were identified algorithmically by tracking the bubble boundary and removed from further analysis.

3. Results and Discussion

3.1. Concentration Fields in the Bubble Wakes

The concentration fields captured with LEDIF measurements are shown in Figure 4. The results from both cases are not compared after an equal rising time, but after both bubbles passed a similar liquid volume. For the evaluation of the PIV and LEDIF measurements, the positions of the bubbles are matched such that the bubble is at the same approximate vertical and horizontal position on its trajectory.
Since, contrary to its movement, the mass transfer from the bubble is not two-dimensional, gas is also transferred in z-direction into the liquid film between the bubble and the reactor wall. In Figure 4, the structure of the respective dissolved gas can easily be identified as a steady veil behind the bubbles with the width of approximately the major axis of the bubble, as also highlighted in Figure 4a. The current study, however, focuses solely on the two-dimensional phenomena in the bubble wakes, and therefore the dissolved gas in the liquid film between the bubble and the reactor wall will not be further addressed. The effects on the results of the current study are considered minor since no convection in the liquid film is expected and the gas is therefore not likely to travel into the bubble wake during the recording time. For a quantitative analysis of the total transferred gas from the bubble into the liquid bulk this dissolved gas needs to be considered as well. However, the current study focuses on the transport phenomena in the wakes.
In both bubbles wakes, coherent concentration structures can be identified as rotating vortices. Thus, Figure 4 can be understood as a chronological evolution of a single vortex. With respect to the mixing performance induced by the bubbles themselves, it is particularly interesting that the structures behind the wobbling bubble form closed pockets and change little during the bubble rise, whereas spreading of the dissolved gas into the continuous phase is possible behind the ellipsoidal bubble. In the supplements, concentration fields for t = 3 s are provided for both cases to emphasize how coherent the closed pockets in the case of the wobbling bubble are. In the case of the ellipsoidal bubble, clear spreading of the dissolved gas can be observed. Moreover, in Figure 4b, rapidly dissolving spines of dissolved gas connecting the vortex and the bubble can be observed. Contrarily, in the wake of the wobbling bubble, the dissolved gas seems to only spread in the pockets, but not in the liquid bulk, which however would be desirable for a homogeneous reaction environment. Therefore, an enhanced mixing of the two phases is suggested for the smaller, ellipsoidal bubble contrary to the expectations from a mere consideration of the bubble Reynolds number.

3.2. FTLE Fields

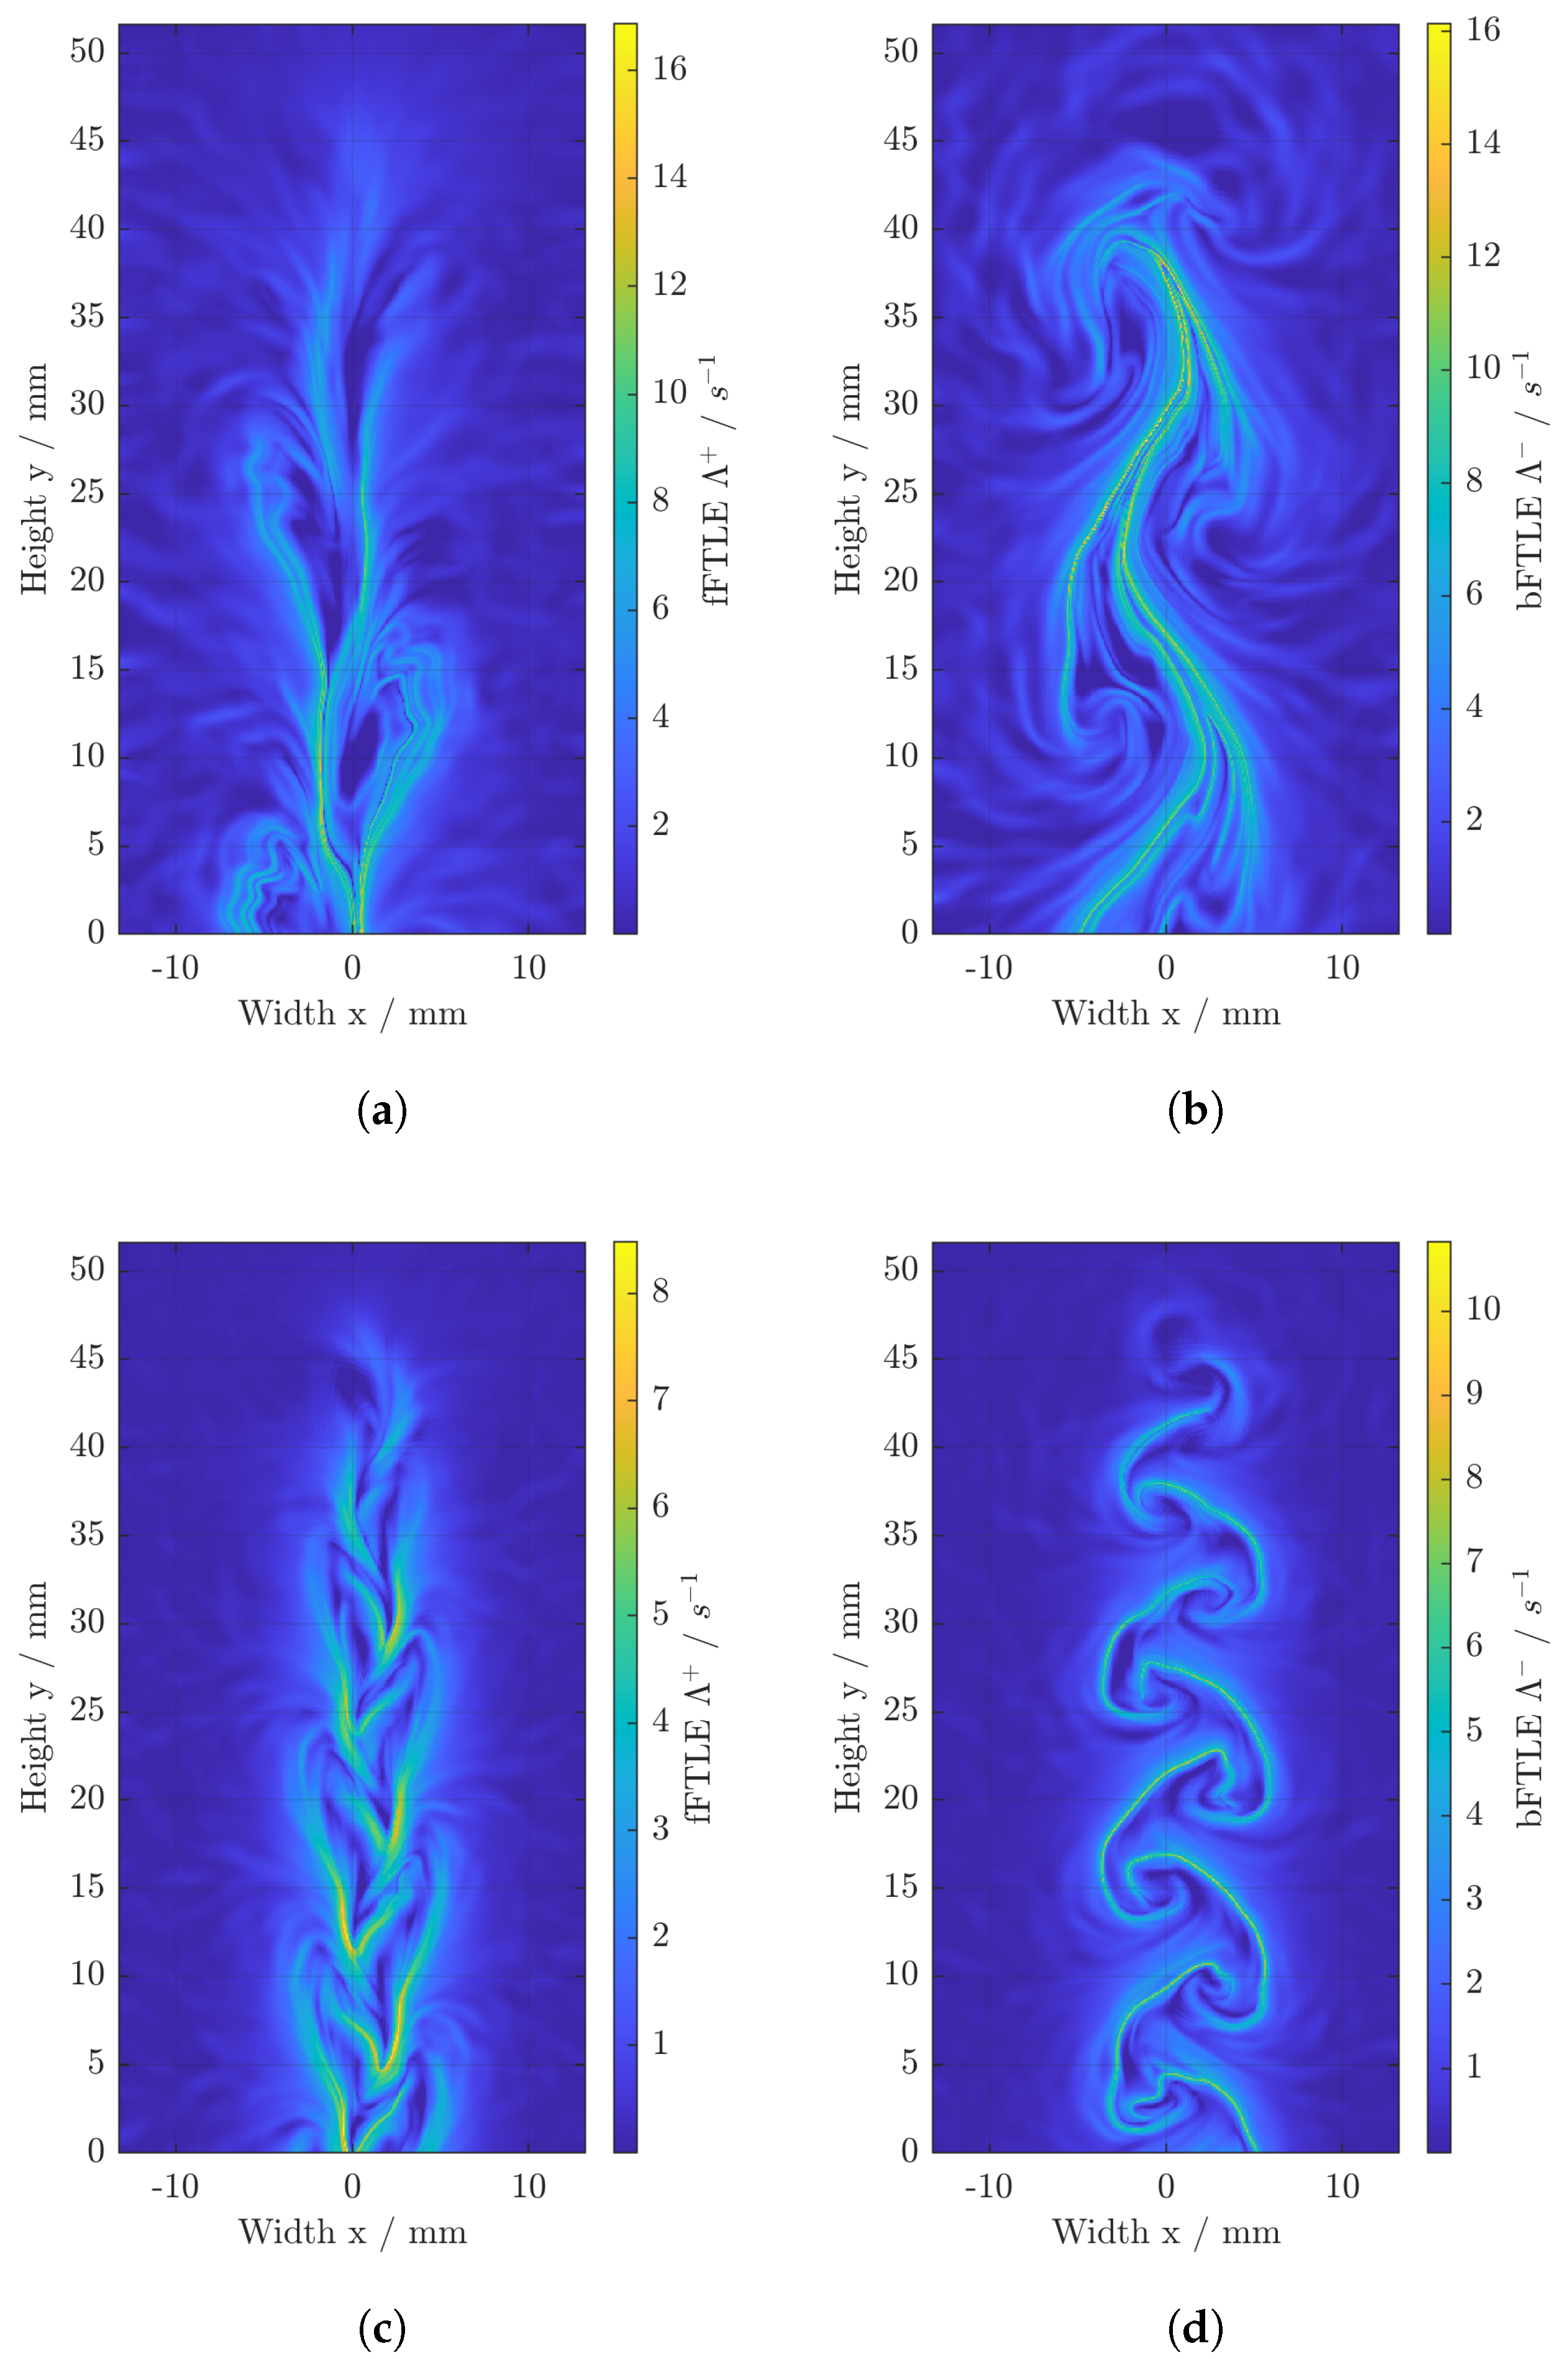
Figure 5 depicts the forward FTLE (fFTLE) and backward FTLE (bFTLE) fields for the finite-time intervals τ [0 s, 0.408 s] and τ [0.408 s, 0 s] for the wobbling bubble as well as τ [0 s, 0.524 s] and τ [0.524 s, 0 s] for the ellipsoidal bubble, respectively. These finite-time intervals are those in which the bubble is entirely in the FOV. Since the FTLE fields depict the scaled eigenvalues, defined in Equations (11) and (12), they can be viewed as a stretch rate around fluid parcels in the considered finite-time interval. Therefore, a high fFTLE value indicates a strong repelling line, and a high bFTLE value a strong attracting line, respectively. In spite of their opposing influence on the fate of fluid parcels, both, strong repelling and strong attracting, lines are considered transport barriers hindering mixing across them. The coherent structures of the bFTLE fields will be addressed together with the concentration fields, and therefore at this point solely conclusions about the mixing performances are drawn. In this regard, attention should be paid to the vertical alignment of the repelling lines, especially in the case of the wobbling bubble (Figure 5a). As transport barriers, such as vertical alignment of the fFTLE, but also bFTLE, ridges prevent horizontal mixing of the dissolved gas with the liquid bulk. In Figure 5a, strong repelling lines fully enclose an area, which is suggestively in the wake of the bubble. With this assumption, the dissolved gas in the wake cannot be distributed by convection into the liquid bulk. Contrary, the repelling lines in Figure 5c do not seem to be fully enclosed, leading to the enabled mixing of the liquid bulk and the dissolved gas. The bFTLE field for the case of the wobbling bubble shown in Figure 5b indicates a strong attracting line roughly at x = 0 . Due to the fading strength of the bFTLE at the bottom of the domain, it is conceivable that the fluid parcels attracted by these material lines are strongly entrained upwards rising with the bubble, and are not distributed into the liquid bulk. Furthermore, the attracting LCS acts as a transport barrier and hinders horizontal mixing across the x-origin. Such a continuous transport barrier along the y-axis is not visible in Figure 5d for the ellipsoidal bubble. Since for the current problem horizontal mixing is in fact more valuable than vertical, the presented observations are indicators for a less intense mixing of the dissolved gas and the liquid bulk in the case of the wobbling bubble caused by the coherent fluid dynamical structures. Using the bubble Reynolds number as an indicator for mixing performance would therefore lead to erroneous conclusions.

3.3. Comparison of the Concentration and bFTLE Fields

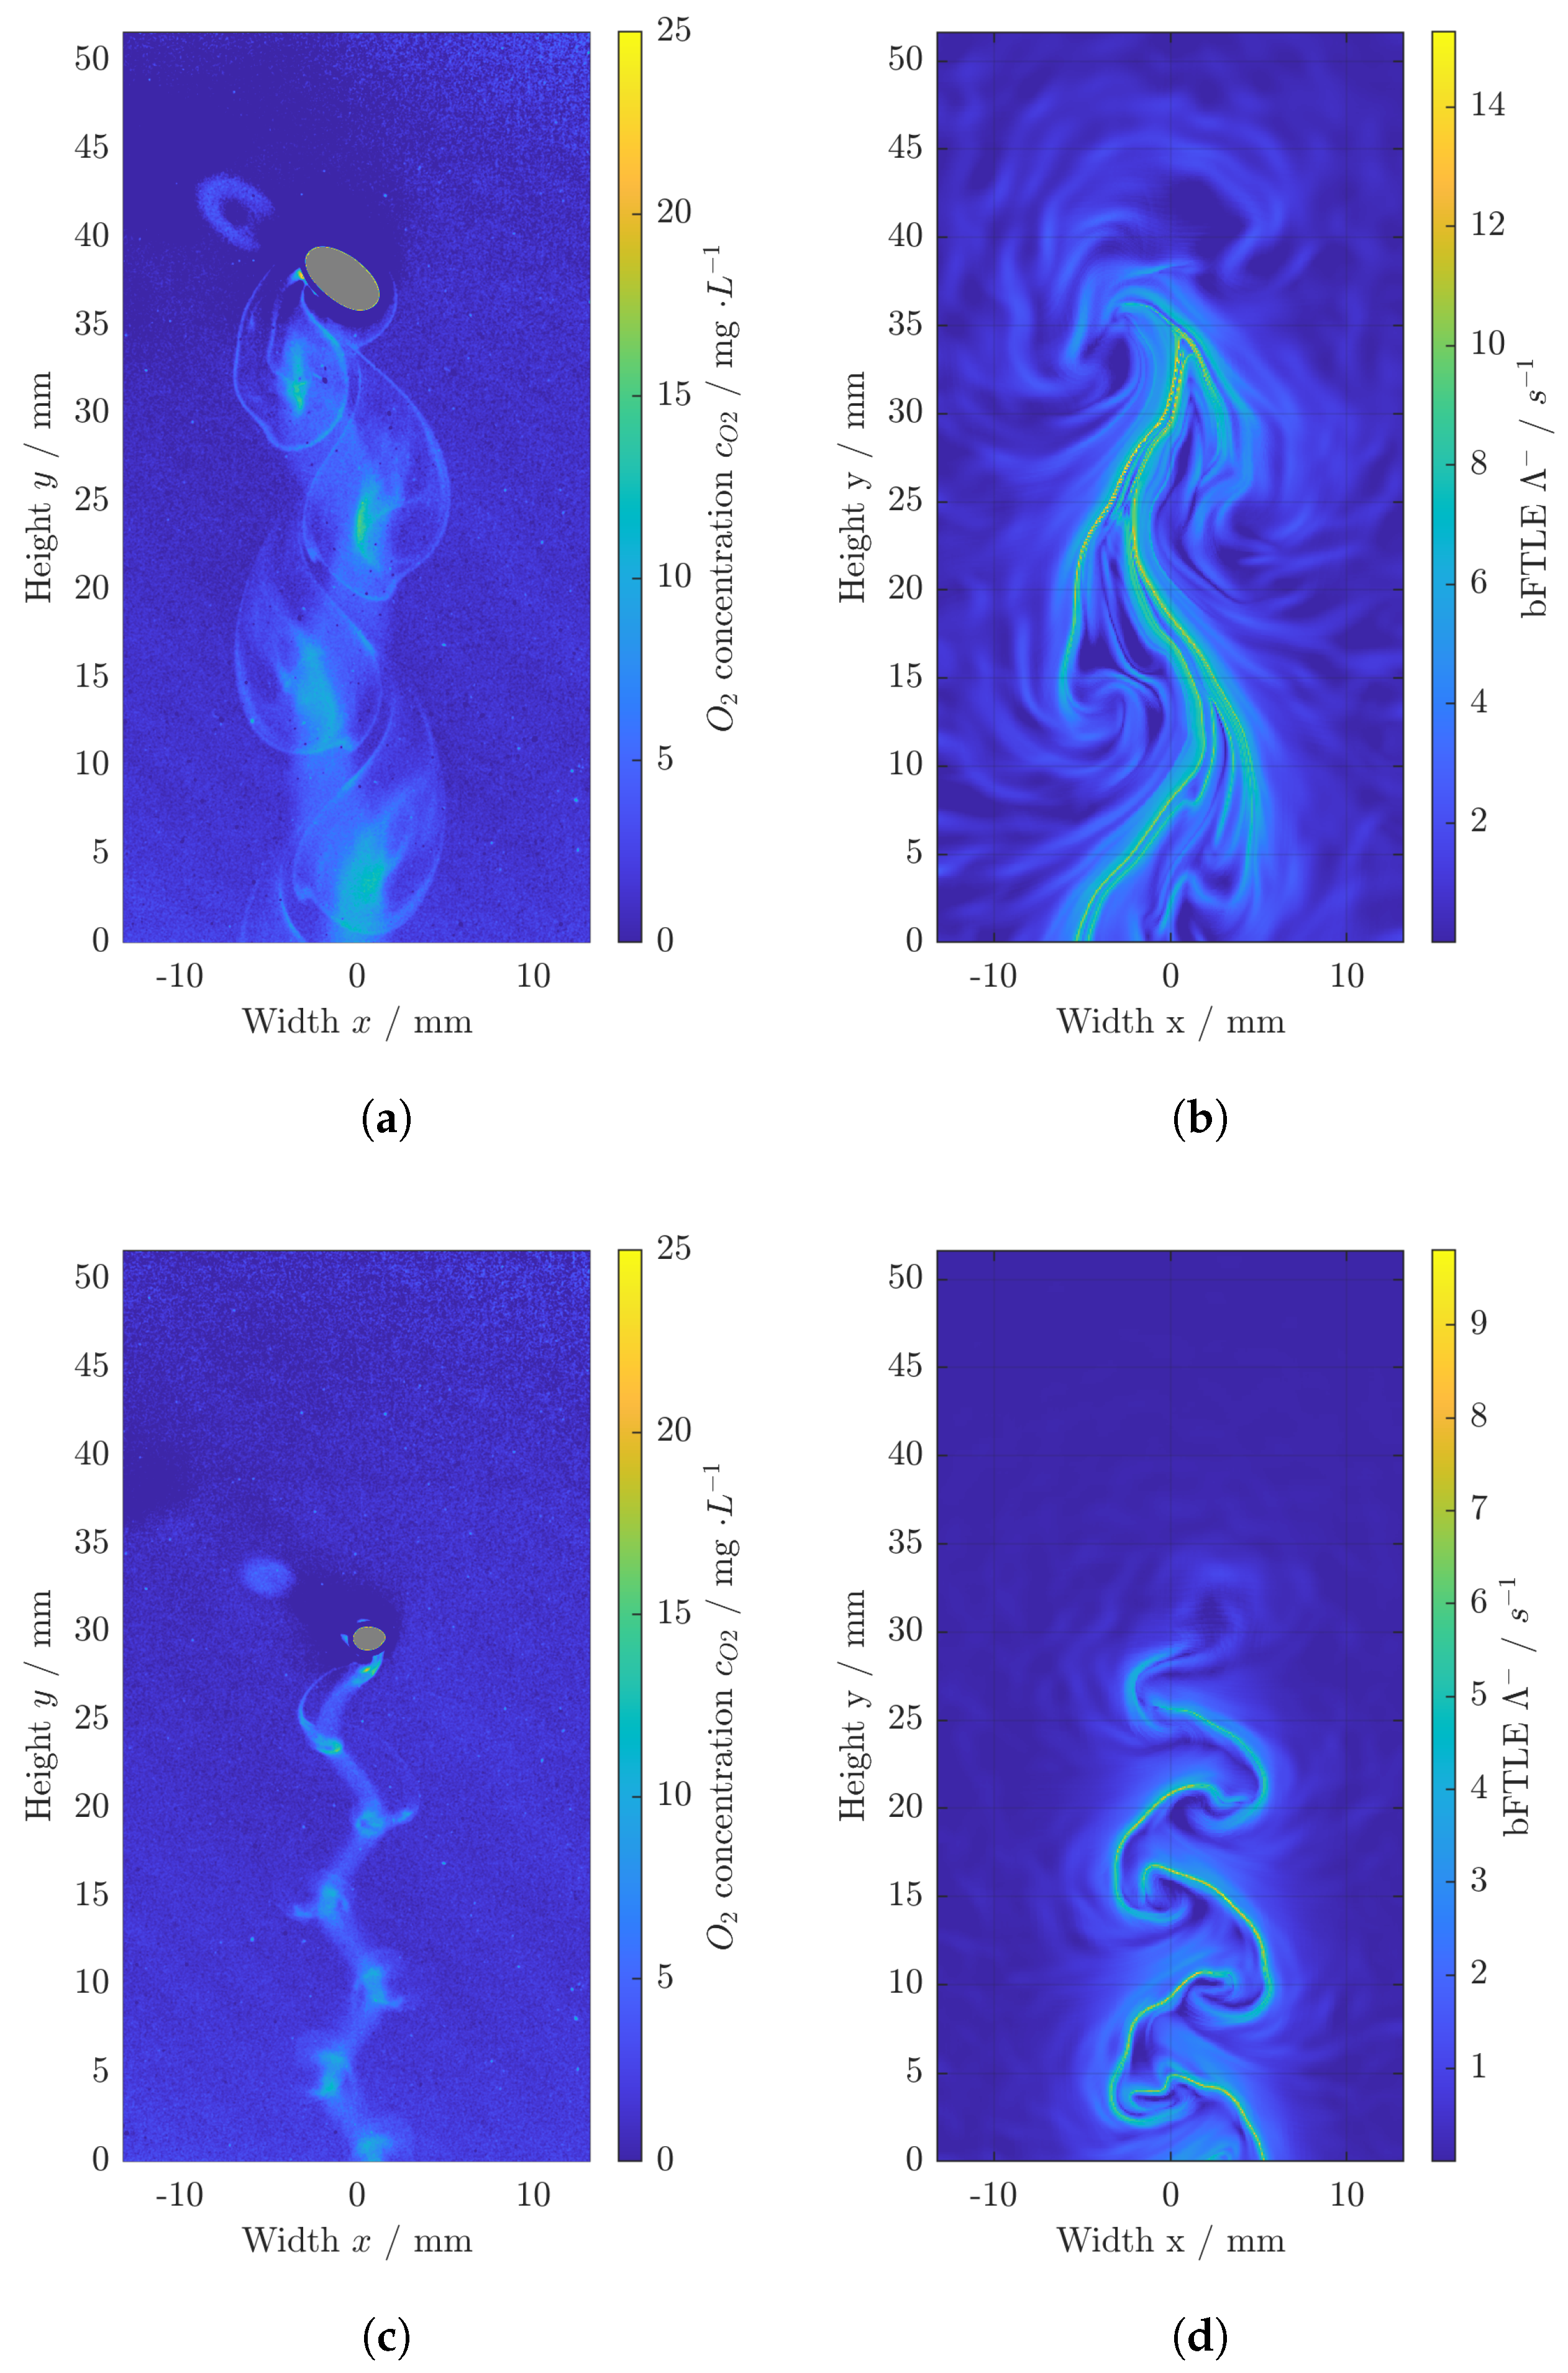
To investigate how the coherent fluid dynamical structures govern the transport of dissolved gas, the concentration fields are compared with the bFTLE fields. The method is considered reasonable, because both analyses, bFTLE, and LEDIF, show an evolution of the vortices in a finite-time interval. The velocity and concentration data were obtained in separate experiments with differing gases, as explained in the previous section, and thus the LEDIF experiment is conducted with, whereas the PIV experiment is conducted without, mass transfer from the bubble. Therefore, the trajectories and movements of the bubbles vary slightly. Nevertheless, a comparison of the structures in the wake is considered feasible. To observe how the structures evolve with time, another shorter finite-time interval for each bubble is considered additionally to the ones presented previously. The resulting concentration field for t = 0.324 s and the bFTLE field for finite-time interval τ [0.324 s,0 s] are pictured in Figure 6a,b for the wobbling bubble. Respectively, for the case of the ellipsoidal bubble, the concentration field for t = 0.360 s and the finite-time interval τ [0.360 s,0 s] are shown in Figure 6c,d.
Comparing Figure 6a,b, the bFTLE structures agree well with the concentration structures. The strongest attracting lines are observed around x = 0 and also the vortices are well-pictured by the bFTLE structures. It seems like the cores of high concentrations of dissolved gas are bounded by the bFTLE ridges. Furthermore, the path of dissolved gas into the uppermost vortex on the left-hand side is also pictured in Figure 6b by a bFTLE ridge.
The bFTLE ridges in the case of the ellipsoidal bubble display the cores of persisting high concentration of dissolved gas remarkably well, as depicted in Figure 6c,d. However, the rapidly dissolving spines seem to be coherent ridges in the fluid dynamic structures, but not in the concentration fields. In spite of the fact that the bFTLE fields give detailed qualitative information about the concentration field structures, they cannot portray diffusion. Here, the strong concentration gradients to both sides of the spines cause rapid dilution. Thus, bFTLE fields cannot provide a reliable representation of the concentration fields, although they give crucial information about the convective transport phenomena. In bubbly flows where the convective transport in the bubble wake dominates over the diffusive one, the analysis of LCS and FTLE is relevant, since in this way areas of persisting high concentration of dissolved gas can be identified, as shown here for the vortices in both bubble Reynolds number cases.
The comparison of bFTLE and LEDIF analyses shows clearly that it is possible to draw conclusions about the mixing of dissolved gas in bubble wakes with a bFTLE analysis. Therefore, the influence of the coherent fluid dynamic structures on the mixing of both phases should be pointed out once more. Although Figure 5 and Figure 6 show coherent structures for both cases, there seem to be major differences between the structures and, thus, their influence on the transport phenomena in the wakes. Whilst the structures in the case of the wobbling bubble enclose the dissolved gas completely preventing spreading into the liquid bulk, mixing of both phases seems to be enabled in the case of the ellipsoidal bubble. These effects of the coherent structures on mass transport imply a need for a new definition of relevant timescales. The contact time of liquid with the bubble, as often used in the Damköhler number, for instance, cannot represent the timescales of mass transport in the wakes. However, in the current study, the mass transport and its timescale on the basis of the wake mixing deviate from each other in the presented cases and detailed consideration is thus crucial. Therefore, for a profound statement on relevant timescales, investigations of contact times between dissolved gas and liquid bulk should concentrate on the small-scale phenomena in the single vortices. In this regard, the study highlights that the classical Sherwood number based on the transfer rate of gas from the bubble to the liquid bulk cannot describe the transfer of dissolved gas trapped in convective structures to the liquid bulk. In the current application, for example, a slower mass transfer is expected for the ellipsoidal bubble. However, the results show that the mass transfer from the wake of the wobbling bubble to the liquid bulk is hindered more strongly.

3.4. Approximate Identification of Liquid Transported into the Bubble Wake

In terms of process optimization, it is desirable to be able to identify those fluid parcels of the liquid bulk, which may take part in chemical reactions. Therefore, the initial positions of fluid parcels transported into the wake are of large interest.
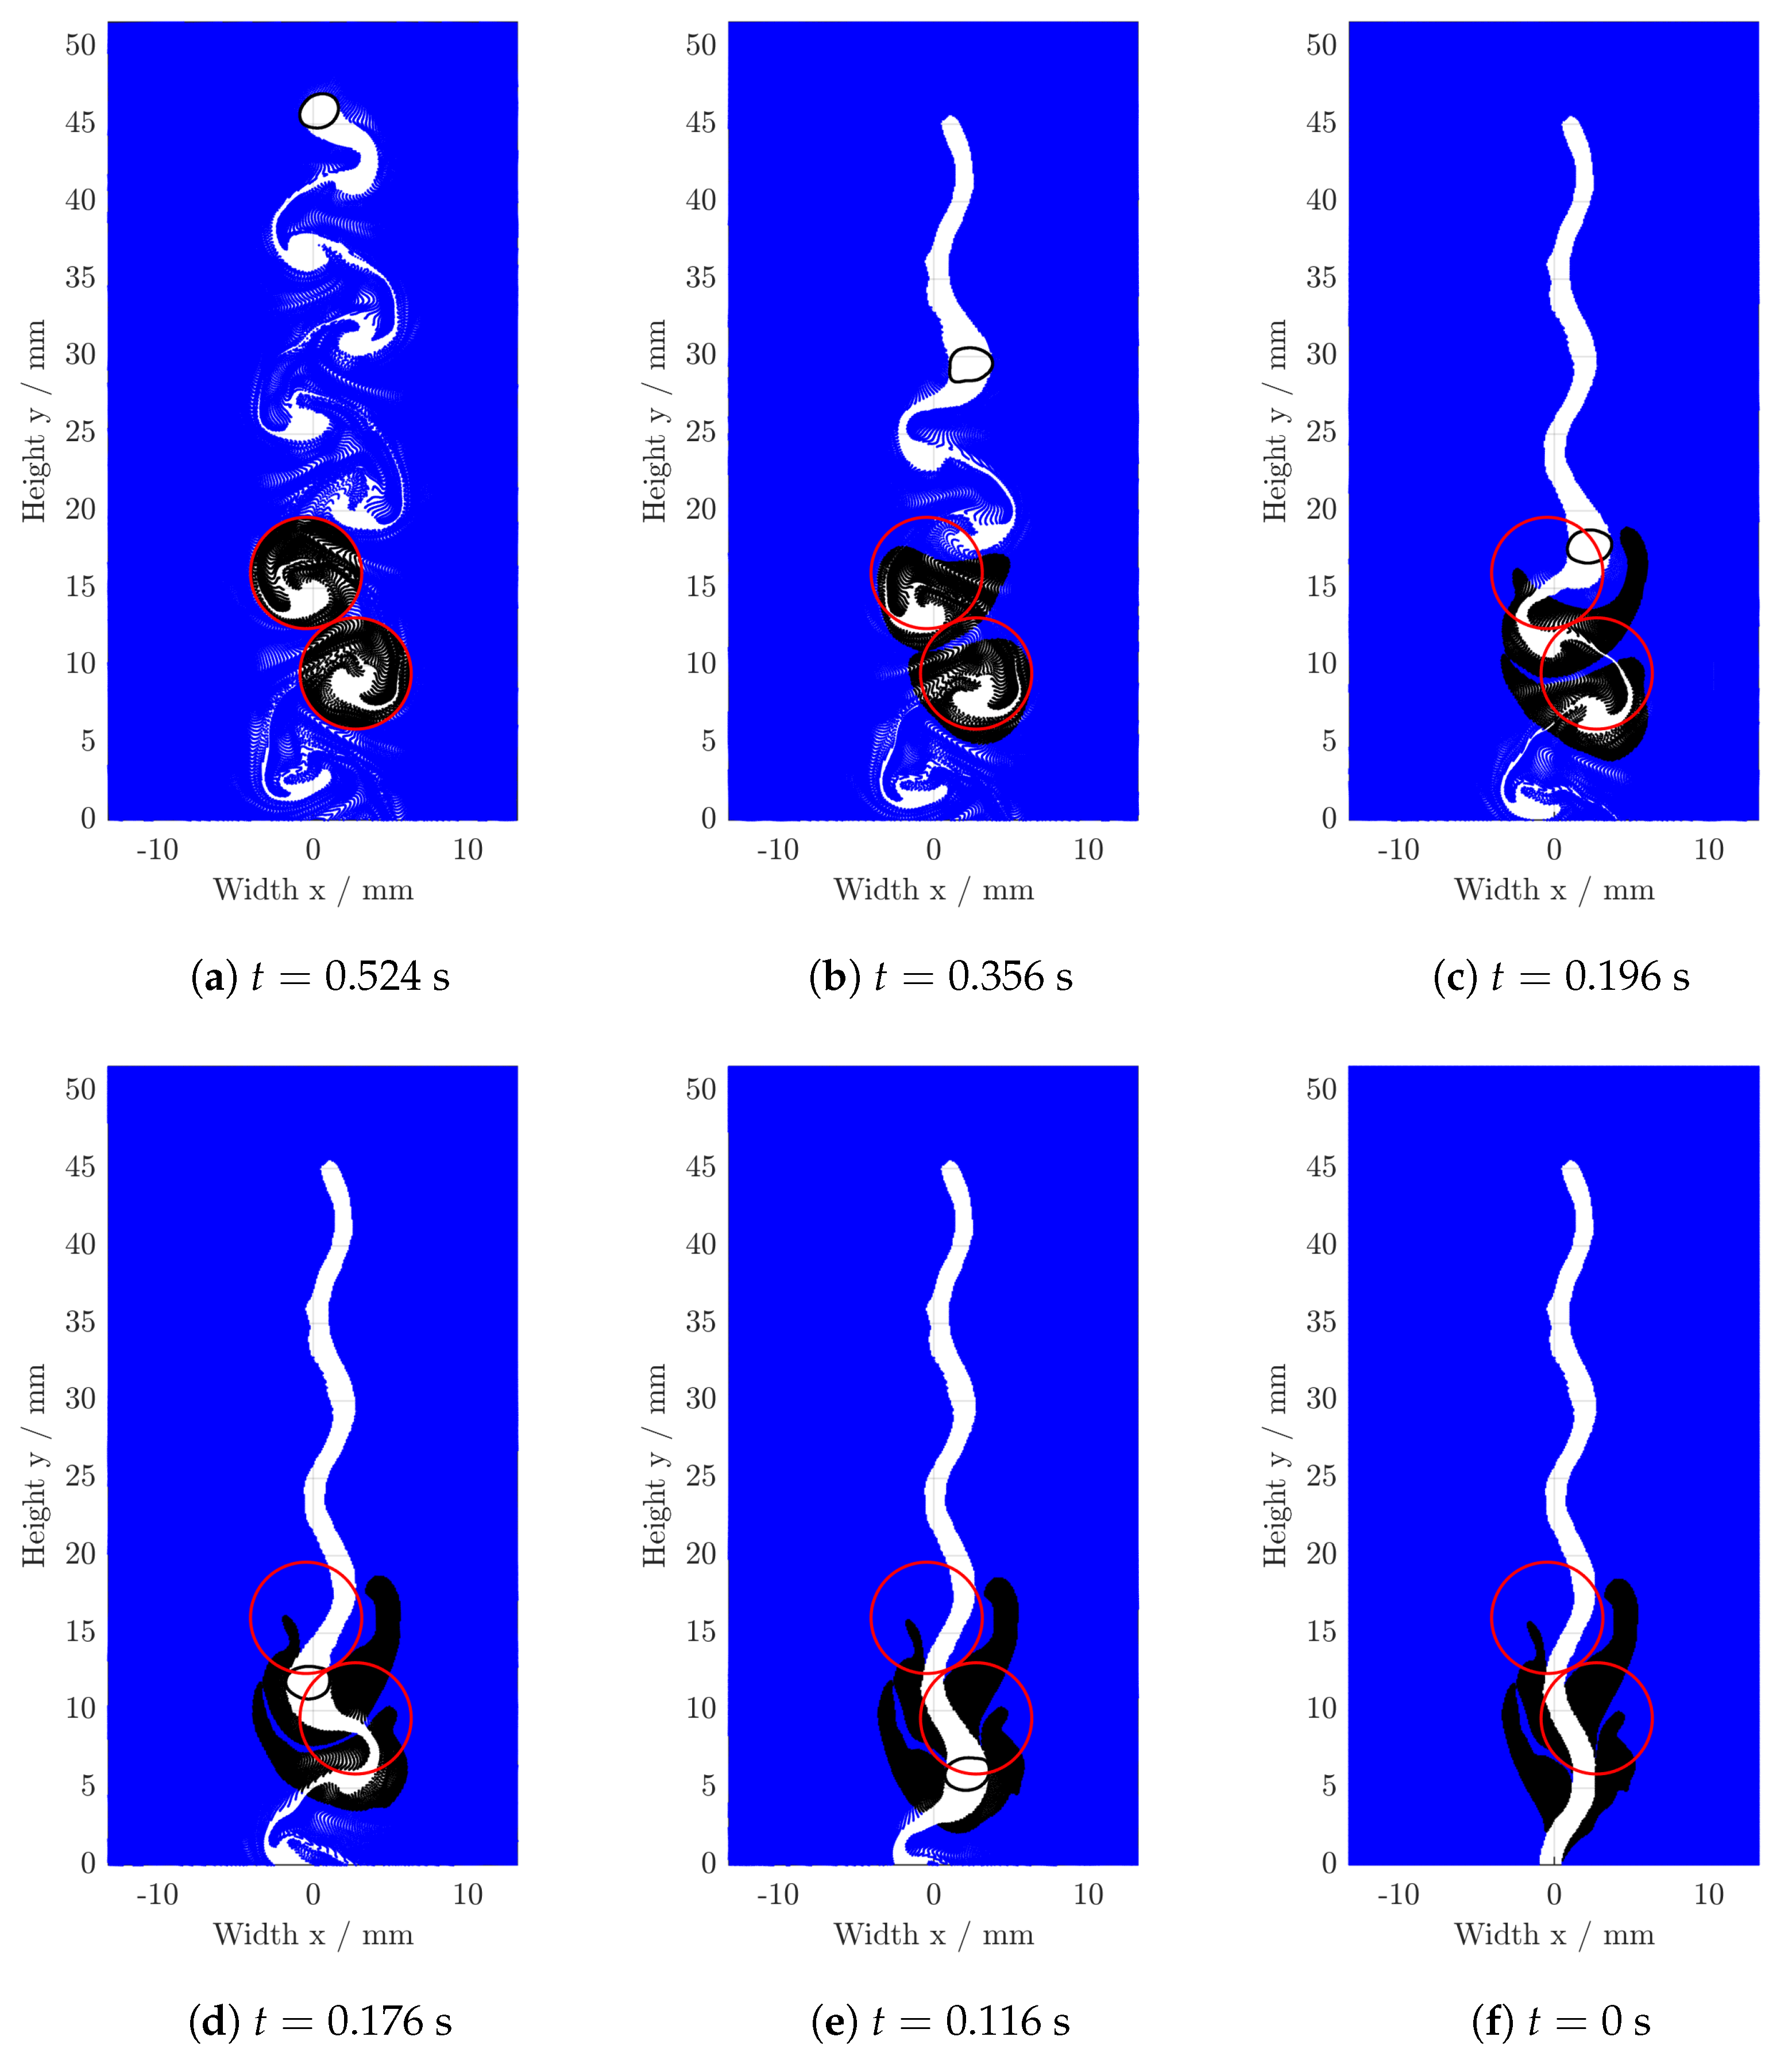
Since the vortices in the wake of the ellipsoidal bubble seem nearly spherical, two vortices are approximated with two circles in the last time frame ( t = 0.524 s), as depicted in Figure 8a. In the next step, the virtual fluid parcels transported into these circles are marked (black) and tracked in backward time to their initial positions, as shown in Figure 7. Since the structure of the parcels in their initial positions is remarkably reminiscent of the fFTLE structures presented in Figure 5c, the initial positions are overlaid with the repelling hyperbolic LCS (Figure 8b). Although the agreement is not perfect, it is very clear that the initial positions of the parcels transported into the wake are bounded by the repelling LCS. At this point, it is good to revise that the vortices are only roughly approximated with two circles. Fluid parcels traveling between these circles are definitely in the wake but are not captured by the approximation and, thus, not considered in the analysis. It is therefore very likely that these parcels would fill the gaps highlighted with green arrows in Figure 8b. Analogously, the circles may overestimate the vortices locally at some points leading to a few parcels initially outside of the area bounded by the LCS. Haller emphasized that tracking of single fluid parcels leads to poor results [7] and, therefore, the current analysis should rather concentrate on the behavior of the totality of parcels. Concluding in this regard, the repelling LCS as well as the fFTLE fields may indicate, which parcels are transported into the wake, and can thus take part in chemical reactions.

4. Conclusions

This study aimed to understand the transport of dissolved gas and bulk liquid in bubble wakes by a computation of LCS and FTLE fields from two-dimensional velocity data. Furthermore, concentration fields of dissolved gas were obtained with LEDIF measurements and compared with the bFTLE fields. The obtained concentration fields show coherent structures of dissolved gas. The dissolved gas in the higher Reynolds number case is distributed slower into the liquid bulk in comparison to the lower Reynolds number case, which could be relevant for the progress of a chemical reaction. The observed differences in mixing could be explained by the analysis of LCS that governs the transport of liquid and dissolved gas in the bubble wakes. With attracting LCS, areas, where dissolved gas is trapped, can be identified. Repelling LCS is suggested to bound liquid transported into the bubble wakes. Hence, they display detailed information about the gas-liquid interactions. A comparison of the LCS in form of FTLE fields with the concentration of the LEDIF measurements shows a strong accordance. In sum, the results of this single bubble case suggest that a sole consideration of bubble Reynolds numbers cannot be used as an indicator for mixing efficiency and yield, since the bubble Reynolds number falls short to take the details and direction of mixing into account. Moreover, the need for a new definition of relevant timescales is discussed. To evaluate the mixing timescales, the phenomena in the wakes have to be considered in more detail and on a more local scale.
Furthermore, the results of this work show enormous potential for Lagrangian analysis methods in the field of bubbly flows and are expected to be crucial for deepening our understanding of the fluid dynamics and transport phenomena in turbulent bubble wakes. Since research using FTLE fields are already well-established, the range of applications of the presented results is considered wide and not restricted to solely two-dimensional cases. Furthermore, the closed vortices identified to form a relevant field of fundamental research, since dissolved gas is trapped inside, slowing down the mixing of both phases. In this regard, also further analysis using elliptic LCS and Finite-Time Coherent Sets (FTCS) [30] could deliver valuable insights. But also more detailed investigations of the transport of dissolved gas into these closed vortices may be of interest.

Supplementary Materials

The following supporting information can be downloaded at https://www.mdpi.com/article/10.3390/pr10122686/s1, Figure S1: Unprocessed velocity field for the case of the wobbling bubble; Figure S2: Smoothed velocity field for the case of the wobbling bubble; Figure S3: Unprocessed velocity field for the case of the ellipsoidal bubble; Figure S4: Smoothed velocity field for the case of the ellipsoidal bubble; Figure S5: Concentration field in the wake of the wobbling bubble for t = 3 s; Figure S6: Concentration field in the wake of the ellipsoidal bubble for t = 3 s; Table S1: Parameters used for the PIV image analysis in PIVview 2c V3.62 (PIVTEC GmbH, Germany).

Author Contributions

Conceptualization: F.K., M.S., and A.v.K.; methodology: L.K. and A.v.K.; investigation: F.K. and J.F.; resources: M.H.; writing—original draft preparation: L.K. and F.K.; writing—review and editing: L.K., F.K., J.F., M.H., M.S., and A.v.K.; visualization: L.K. and F.K.; supervision: M.H., M.S., and A.v.K.; funding acquisition: M.H., M.S., and A.v.K. All authors have read and agreed to the published version of the manuscript.

Funding

This research was funded by the Deutsche Forschungsgemeinschaft (DFG, German Research Foundation)—projects 395843083, 256614085 and 501131738.

Data Availability Statement

Data can be provided after contacting the corresponding authors.

Acknowledgments

The authors gratefully acknowledge the financial support provided by the Deutsche Forschungsgemeinschaft (DFG, German Research Foundation) within the projects 395843083, 256614085 and 501131738. Also, we thank all the students involved who contributed to the success of this work. In particular, we would like to thank our student René Weglewski. Publishing fees are funded by the Deutsche Forschungsgemeinschaft (DFG, German Research Foundation)—project number 491268466—and the Hamburg University of Technology (TUHH) in the funding programme Open Access Publishing.

Conflicts of Interest

The authors declare no conflict of interest.

References

  1. Schlüter, M.; Bothe, D.; Herres-Pawlis, S.; Nieken, U. (Eds.) Reactive Bubbly Flows: Final Report of the DFG Priority Programm 1740; Fluid Mechanics and Its Applications; Springer: Cham, Switzerland, 2021; Volume 128. [Google Scholar]
  2. Kück, U.; Kröger, M.; Bothe, D.; Räbiger, N.; Schlüter, M.; Warnecke, H.J. Skalenübergreifende Beschreibung der Transportprozesse bei Gas/Flüssig-Reaktionen. Chem. Ing. Tech. 2011, 83, 1084–1095. [Google Scholar] [CrossRef]
  3. Hatta, S. On the absorption velocity of gases by liquids. Tech. Repts. Tohoku Imp. Univ. 1932, 10, 119–128. [Google Scholar]
  4. Baerns, M.; Hofmann, H.; Renken, A.; Falbe, J.; Fetting, F.; Keim, W.; Onken, U. Chemische Reaktionstechnik: Lehrbuch der Technischen Chemie; Wiley: Hoboken, NJ, USA, 1999; Volume 1. [Google Scholar]
  5. Koudella, C.R.; Neufeld, Z. Reaction front propagation in a turbulent flow. Phys. Rev. E Stat. Nonlinear Soft Matter Phys. 2004, 70, 026307. [Google Scholar] [CrossRef] [Green Version]
  6. Haller, G.; Yuan, G. Lagrangian coherent structures and mixing in two-dimensional turbulence. Phys. D Nonlinear Phenom. 2000, 147, 352–370. [Google Scholar] [CrossRef]
  7. Haller, G. Lagrangian Coherent Structures. Annu. Rev. Fluid Mech. 2015, 47, 137–162. [Google Scholar] [CrossRef] [Green Version]
  8. Shadden, S.C.; Lekien, F.; Marsden, J.E. Definition and properties of Lagrangian coherent structures from finite-time Lyapunov exponents in two-dimensional aperiodic flows. Phys. D Nonlinear Phenom. 2005, 212, 271–304. [Google Scholar] [CrossRef]
  9. Onu, K.; Huhn, F.; Haller, G. LCS Tool: A Computational Platform for Lagrangian Coherent Structures. J. Comput. Sci. 2015, 7, 26–36. [Google Scholar] [CrossRef] [Green Version]
  10. von Kameke, A.; Kastens, S.; Rüttinger, S.; Herres-Pawlis, S.; Schlüter, M. How coherent structures dominate the residence time in a bubble wake: An experimental example. Chem. Eng. Sci. 2019, 207, 317–326. [Google Scholar] [CrossRef] [Green Version]
  11. Kexel, F.; von Kameke, A.; Tenhaus, J.; Hoffmann, M.; Schlüter, M. Taylor Bubble Study of the Influence of Fluid Dynamics on Yield and Selectivity in Fast Gas–Liquid Reactions. Chem. Ing. Tech. 2021, 93, 830–837. [Google Scholar] [CrossRef]
  12. Kastens, S.; Timmermann, J.; Strassl, F.; Rampmaier, R.F.; Hoffmann, A.; Herres-Pawlis, S.; Schlüter, M. Test System for the Investigation of Reactive Taylor Bubbles. Chem. Eng. Technol. 2017, 40, 1494–1501. [Google Scholar] [CrossRef]
  13. Kexel, F.; Kameke, A.V.; Hoffmann, M.; Schlüter, M. The influence of fluid dynamics on the selectivity of fast gas–liquid reactions in methanol. Chem. Eng. Process.—Process Intensif. 2021, 180, 108650. [Google Scholar] [CrossRef]
  14. Roig, V.; Roudet, M.; Risso, F.; Billet, A.M. Dynamics of a high-Reynolds-number bubble rising within a thin gap. J. Fluid Mech. 2012, 707, 444–466. [Google Scholar] [CrossRef] [Green Version]
  15. Kopf-Sill, A.R.; Homsy, G.M. Bubble motion in a Hele–Shaw cell. Phys. Fluids 1988, 31, 18–26. [Google Scholar] [CrossRef]
  16. Wang, X.; Klaasen, B.; Degrève, J.; Blanpain, B.; Verhaeghe, F. Experimental and numerical study of buoyancy-driven single bubble dynamics in a vertical Hele-Shaw cell. Phys. Fluids 2014, 26, 123303. [Google Scholar] [CrossRef]
  17. Filella, A.; Ern, P.; Roig, V. Oscillatory motion and wake of a bubble rising in a thin-gap cell. J. Fluid Mech. 2015, 778, 60–88. [Google Scholar] [CrossRef] [Green Version]
  18. Schanz, D.; Gesemann, S.; Schröder, A. Shake-The-Box: Lagrangian particle tracking at high particle image densities. Exp. Fluids 2016, 57, 70. [Google Scholar] [CrossRef]
  19. Pavlov, L.; Cazin, S.; Ern, P.; Roig, V. Exploration by Shake-the-Box technique of the 3D perturbation induced by a bubble rising in a thin-gap cell. Exp. Fluids 2021, 62, 22. [Google Scholar] [CrossRef]
  20. Roudet, M.; Billet, A.M.; Cazin, S.; Risso, F.; Roig, V. Experimental investigation of interfacial mass transfer mechanisms for a confined high–reynolds–number bubble rising in a thin gap. AIChE J. 2017, 63, 2394–2408. [Google Scholar] [CrossRef] [Green Version]
  21. Felis, F.; Strassl, F.; Laurini, L.; Dietrich, N.; Billet, A.M.; Roig, V.; Herres-Pawlis, S.; Loubière, K. Using a bio-inspired copper complex to investigate reactive mass transfer around an oxygen bubble rising freely in a thin-gap cell. Chem. Eng. Sci. 2019, 207, 1256–1269. [Google Scholar] [CrossRef] [Green Version]
  22. Huang, J.; Saito, T. Discussion about the differences in mass transfer, bubble motion and surrounding liquid motion between a contaminated system and a clean system based on consideration of three-dimensional wake structure obtained from LIF visualization. Chem. Eng. Sci. 2017, 170, 105–115. [Google Scholar] [CrossRef]
  23. Ouellette, N.T.; O’Malley, P.J.J.; Gollub, J.P. Transport of Finite-Sized Particles in Chaotic Flow. Phys. Rev. Lett. 2008, 101, 174504. [Google Scholar] [CrossRef]
  24. Chen, J.; Kim, H.D.; Kim, K.C. Measurement of dissolved oxygen diffusion coefficient in a microchannel using UV-LED induced fluorescence method. Microfluid. Nanofluid 2013, 14, 541–550. [Google Scholar] [CrossRef]
  25. Rüttinger, S.; Spille, C.; Hoffmann, M.; Schlüter, M. Laser-Induced Fluorescence in Multiphase Systems. ChemBioEng Rev. 2018, 5, 253–269. [Google Scholar] [CrossRef]
  26. Jimenez, M.; Dietrich, N.; Grace, J.R.; Hébrard, G. Oxygen mass transfer and hydrodynamic behaviour in wastewater: Determination of local impact of surfactants by visualization techniques. Water Res. 2014, 58, 111–121. [Google Scholar] [CrossRef]
  27. Timmermann, J. Experimental Analysis of Fast Reactions in Gas-Liquid Flows, 1st ed.; Berichte aus dem Institut für Mehrphasenströmungen; Cuvillier Verlag: Göttingen, Germany, 2018; Volume 3. [Google Scholar]
  28. von Kameke, A.; Kexel, F.; Ruttinger, S.; Colombi, R.; Kastens, S.; Schluter, M. 3D-reconstruction of O2 bubble wake concentration fields. In Proceedings of the 13th International Symposium on Particle Image Velocimetry—ISPIV 2019, Munich, Germany, 22–24 July 2019. [Google Scholar]
  29. Sato, T.; Hamada, Y.; Sumikawa, M.; Araki, S.; Yamamoto, H. Solubility of Oxygen in Organic Solvents and Calculation of the Hansen Solubility Parameters of Oxygen. Ind. Eng. Chem. Res. 2014, 53, 19331–19337. [Google Scholar] [CrossRef]
  30. Padberg-Gehle, K.; Schneide, C. Network-based study of Lagrangian transport and mixing. Nonlinear Process. Geophys. 2017, 24, 661–671. [Google Scholar] [CrossRef]
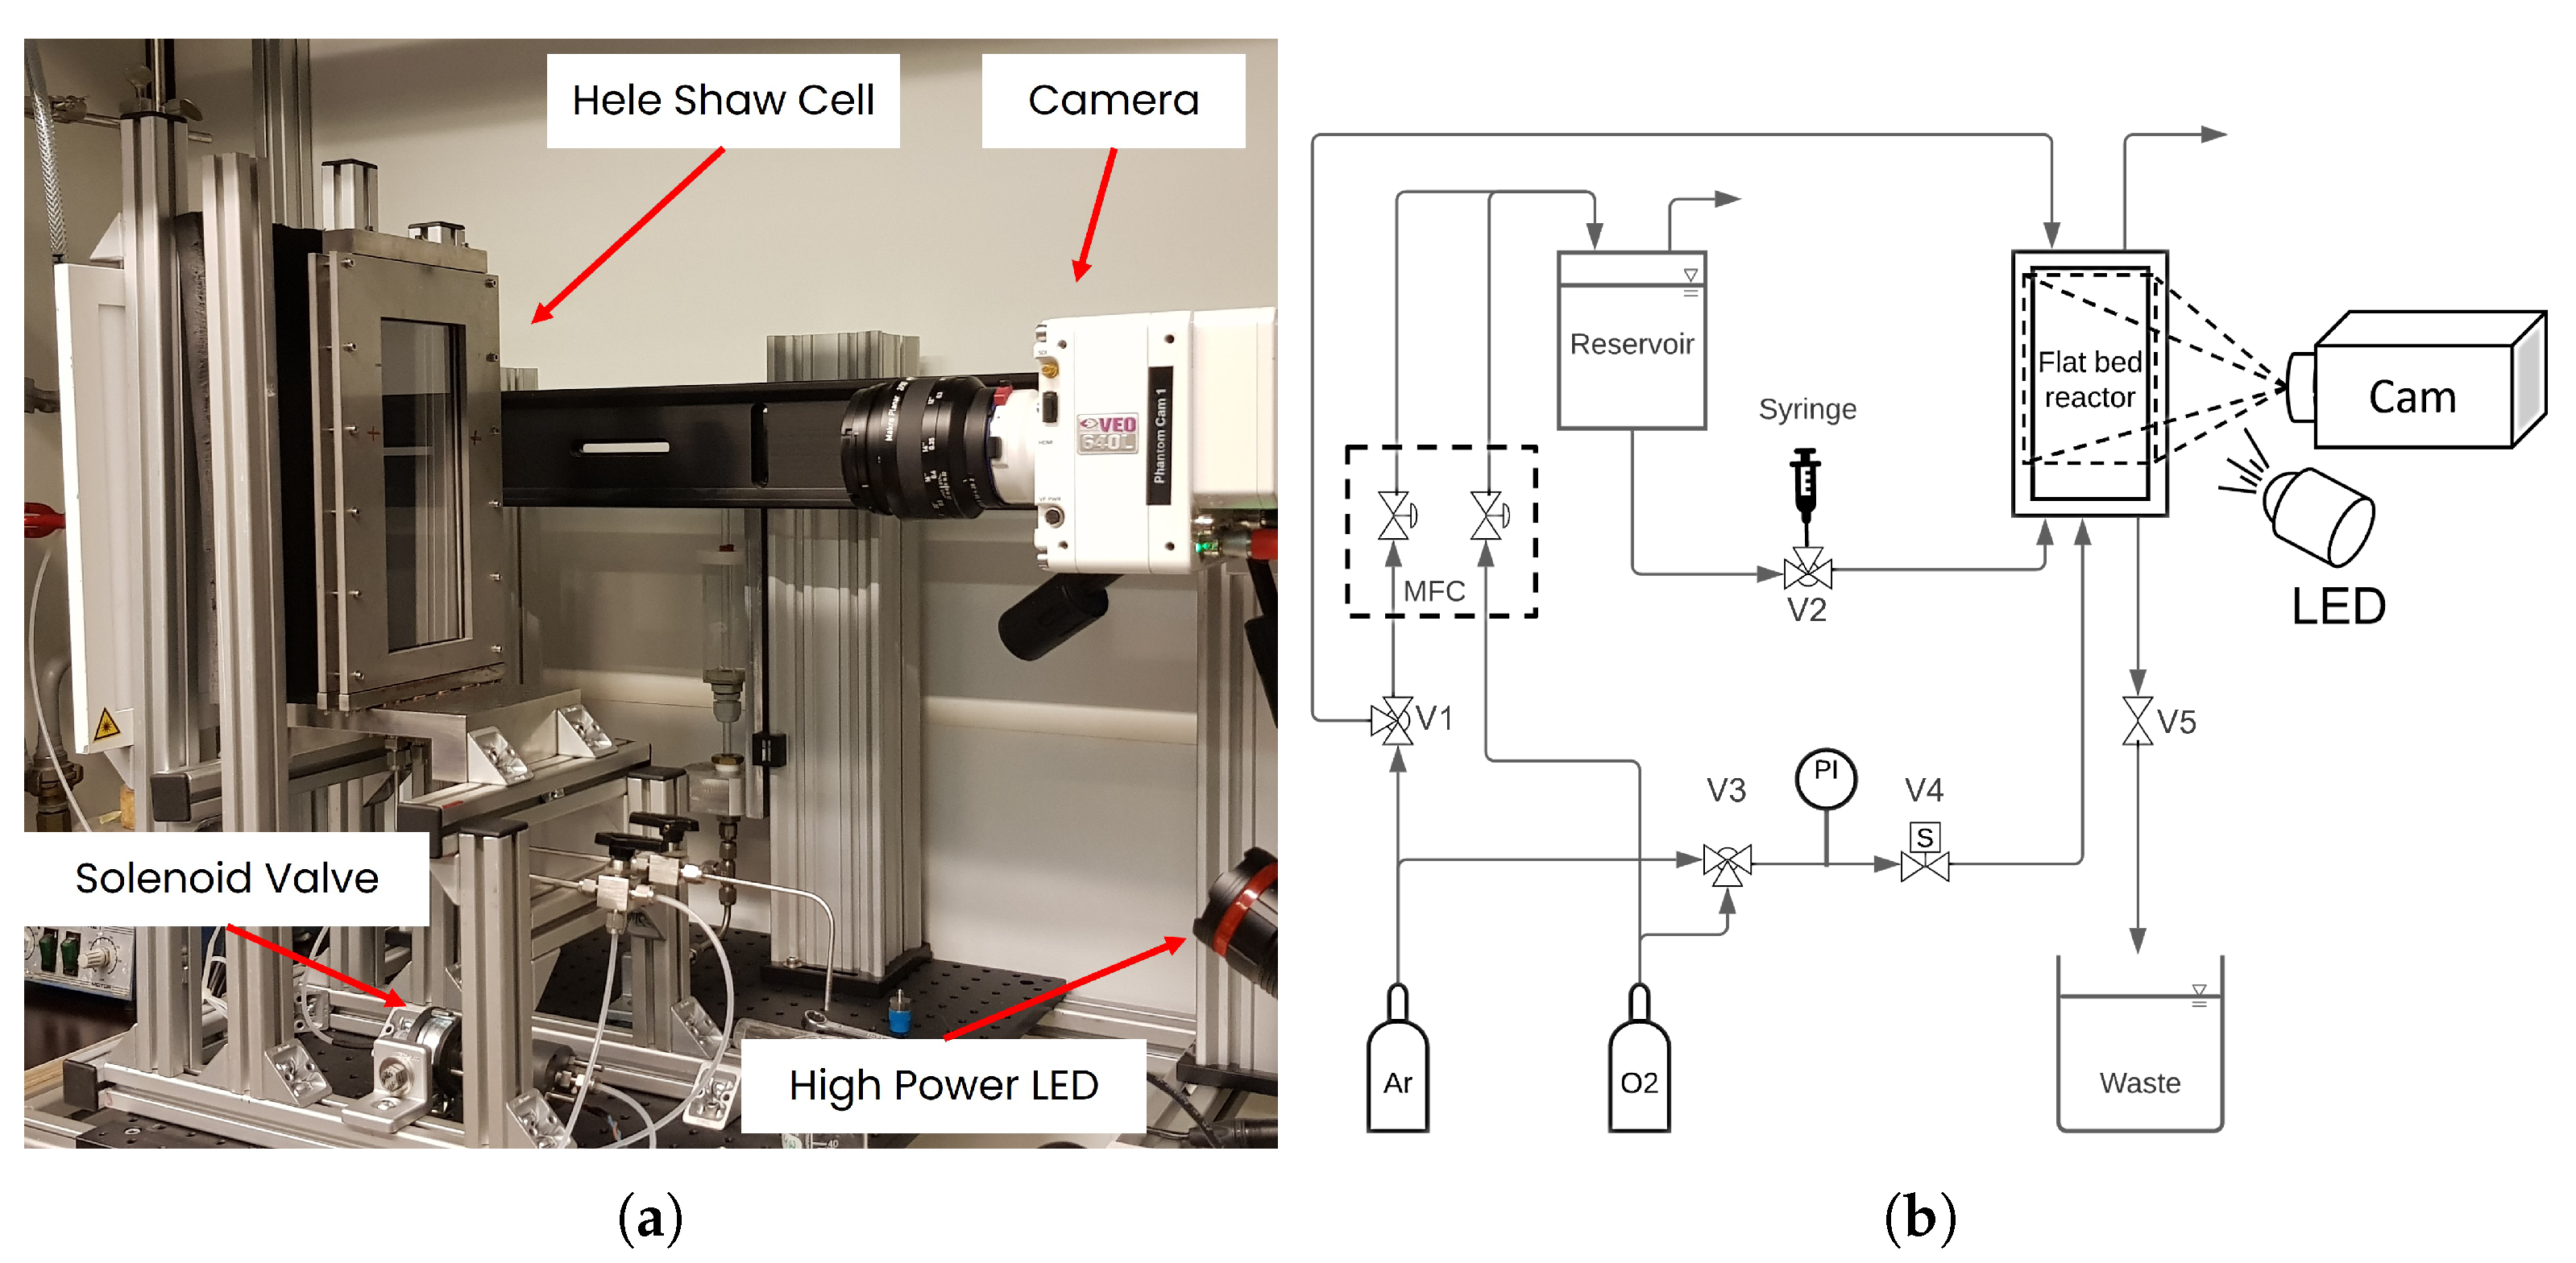
Figure 1. (a) Experimental setup of the flat-bed reactor used for the PIV and LEDIF measurements at the TUHH and (b) schematic sketch of the used setup.
Processes 10 02686 g001
Figure 2. Exemplary fields of the velocity magnitude for (a) a wobbling bubble and (b) an ellipsoidal bubble. The bubble outlines are denoted in black.
Processes 10 02686 g002
Figure 3. (a) Raw image of a rising oxygen bubble in the methanol-dye solution. (b) Processed image, yielding the concentration field behind a rising oxygen bubble (wobbling). (c) Example of a calibration fit (dashed line) through measurement points (black x) used for concentration determination according to [29].
Processes 10 02686 g003aProcesses 10 02686 g003b
Figure 4. Evaluated concentration fields for (a) a wobbling bubble and (b) an ellipsoidal bubble. The liquid film attached to the glass wall is exemplarily highlighted in (a) within the red box where the arrow denotes the width of the veil.
Processes 10 02686 g004
Figure 5. FTLE fields for the entire finite-time intervals studied. (a) fFTLE wobbling bubble τ [0 s, 0.408 s], (b) bFTLE wobbling bubble τ [0.408 s, 0 s], (c) fFTLE ellipsoidal bubble τ [0 s, 0.524 s] and (d) bFTLE ellipsoidal bubble τ [0.524 s, 0 s].
Processes 10 02686 g005
Figure 6. Comparison of concentration and bFTLE fields. (a) Concentration field wobbling bubble at t = 0.324 s, (b) bFTLE field wobbling bubble for the finite-time interval τ [0.324 s, 0 s], (c) Concentration field ellipsoidal bubble at t = 0.360 s and (d) bFTLE field ellipsoidal bubble for the finite-time interval τ [0.360 s, 0 s].
Processes 10 02686 g006
Figure 7. Backwards tracking of fluid parcels transported into two single vortices from their final positions in (a) to their initial positions in (f). Red circles approximate the vortices. Fluid parcels in the approximated vortices (black) are tracked to their initial positions, blue denotes the rest of the liquid phase. The white area displays fluid parcels excluded due to nonphysical behavior.
Processes 10 02686 g007
Figure 8. Approximate identification of the parcels transported into the wake in the case of the ellipsoidal bubble. (a) Parcels (black) in two approximated vortices (red circles) at t = 0.524 s. (b) Parcels transported into two vortices (black) and repelling LCS (red lines) for τ [0 s, 0.524 s] at t = 0 s. The initial positions of the black parcels are bound by the repelling LCS. Green arrows point out areas, from which parcels are assumed to be transported into the wake as well. Blue parcels were removed from the analysis due to nonphysical behavior (therefore excluded in (a)).
Processes 10 02686 g008
Table 1. Characteristics of the methanol-argon-system for the PIV measurements.
ParameterWobbling (cf. Figure 4a)Ellipsoidal (cf. Figure 4b)
d/mm 5.20 ± 0.14 2.56 ± 0.04
u B /mms 1 134.5 ± 11.70 111.9 ± 18.0
h/d/- 0.19 0.39
Re /-949388
Ar /-1593550
St /-0.00280.0048
Publisher’s Note: MDPI stays neutral with regard to jurisdictional claims in published maps and institutional affiliations.