Abstract
The aim of this work is to evaluate thermal behaviors and develop a soft sensor for online prediction of LOD (loss-on-drying) in the segmented fluidized bed dryer (Seg-FBD) in the ConsiGma25 line, which is regarded as the intermediate critical quality attribute for the final drug product. Preheating and drying experiments are performed and heat transfers and conductions among the Seg-FBD are evaluated based on the temperature measurements from sensors and an infrared thermal camera. A temperature distribution in dryer cells and high heat conductions in walls are found. Considerable heat transfers between the neighboring dryer cells are determined, which equal approximately 7% of the energy provided from the heated air. The cell-to-cell heat transfers are implemented into the heat transfer and drying models of the Seg-FBD. The models are calibrated successively in gPROMS Formulated Products (gFP) and the temperature and LOD errors are less than 2 °C and 0.5 wt.%, respectively. Subsequently, a soft sensor is established by combining data sources, a real-time data communication method, and the developed drying model, and it shows the capability of predicting real-time LOD, where the error of end-point LOD is within 0.5 wt.%. The work provides detailed steps and applicable tools for developing a soft sensor, and the online deployment of the soft sensor could support continuous production in the Seg-FBD by enabling visualization of process status and determination of process end point.
1. Introduction
Continuous pharmaceutical manufacturing has increasingly drawn industrial and scientific attention because, compared to batch-wise manufacturing, it shows more flexibility, requires smaller equipment, needs less cost, reduces development time, and improves product quality [1]. Furthermore, continuous manufacturing technologies provide an opportunity to reduce or even eliminate the scale up issues compared to batch processing [2,3], since the knowledge from the continuous development can be directly applied to manufacturing [4,5].
The ConsiGma™-25 line (C25) is a continuous wet granulation line, which produces tablets from powders through pre-blending, twin-screw wet granulation, segmented fluidized-bed drying, granule handling (e.g., sieving and blending), tableting, and coating operations. For this continuous process, the residual moisture contents of granules, i.e., LOD (loss-on-drying), in the segmented fluidized-bed dryer (Seg-FBD) is considered as an intermediate critical quality attribute for the final drug product [6,7]. The LOD will affect the powder flow, tablet porosity, tensile strength, tablet ejection force, and hardness [8,9,10,11], and can have an impact on dissolution. Thus, it is necessary to investigate the factors that influence the LOD, and to monitor and determine the end-point LOD.
There are many factors that influence the final granule LOD, in which the process parameters of the twin-screw granulator (e.g., liquid-to-solid ratio, screw speed, temperature, mass flow) and the Seg-FBD (e.g., air flow, drying air temperature, filling and drying time of granules, dryer cell temperature), and granule properties (e.g., initial granule moisture, granule size and binder types) have been widely studied, and their effects on the LOD are qualitatively or quantitatively revealed [1,12,13,14].
Furthermore, the geometry of the Seg-FBD can also have an impact on the LOD. The dryer part of Seg-FBD commonly contains six cells, where a distribution of cell temperatures is observed. Computational fluid dynamics (CFD) simulations have shown that the distribution results from the air inlet design [15], which has potential effects on drying and thus the LOD. Meanwhile, to achieve continuous operation of the six-cell dryer, scheduling is required, where wet granules from twin screw granulation are consecutively filled into Seg-FBD cells and discharged after drying based on the settings for filling and drying time. In other words, the six cells are in three phases, i.e., filling, drying, and empty phases. The empty cells would have higher temperatures than non-empty cells (filling and drying cells), indicating heat transfer from empty cell to neighboring non-empty cells and heat conduction in the dryer walls. In addition to the dryer part, the Seg-FBD also has a base part under the dryer and an exhaust part above the dryer, and both have large masses and surface areas. All the heat transfer and conduction among the base, dryer and exhaust parts would also influence the drying process. Rehrl et al., Mortier et al., and Wang et al. have evaluated the energy balance for the Seg-FBD in terms of energy for evaporating water, heating up granules, and energy losses to environment or filter [6,16,17]; however, the heat loss in the base part and the heat transfers from cell to cell were not considered. This makes the inlet air temperature and cell temperatures for simulation higher and lower than the real ones, respectively. Moreover, the heat conduction in walls was not investigated in the work. Thus, it is necessary to understand the mentioned heat transfers and conductions for development of a robust drying model.
Two main solutions can be utilized for monitoring LOD: a Process Analytical Technology (PAT) method and soft sensing [6,18,19,20]. Soft sensing with a mechanistic drying model is preferred because the model contains fundamental scientific understanding of drying processes and can be used for process optimization [21], design of experiments, and model-based process transfer. There are several reported drying models including single-, two-, and three-phase models, where drying kinetics are implemented for estimation of drying rate [22,23]. The single-phase model is the simplest one and assumes perfect mixing of gas and granules, while the two- and three-phase models [24,25,26] are more complex and involve the effects of fluid dynamics such as by-pass or back-mixing of drying air. To include the effects of equipment geometry and better describe the bed hydrodynamics, the CFD approach could be applied [27]. Considering the complexity of model development, the single-phase model would be preferable, as it is simpler and has shown the ability to predict LOD values accurately [22].
The moisture evaporation from powder surface to gas phase has three typical periods: pre-warming, constant-, and falling-rate [24]. In the pre-warming and constant periods, moisture is sufficient on powder surface and the evaporation is controlled by external diffusion. The external drying rate coefficient can be estimated by the Sherwood number [22]. In the falling period, the moisture content on the powder surface is the limiting factor, and the evaporation is controlled by internal diffusion. Distributed and lumped models are commonly applied to describe the internal diffusion. The distributed model assumes the moisture diffusion in spherical particles and is solved by finite volume methods, where the internal diffusion rate is related to powder size, temperature, and moisture [24]. The lumped model assumes uniform granule moisture content and calculates the drying via a normalized drying rate, where the lumped model parameters can be fitted by drying experiments [28].
To build a soft sensor, a combination of hardware sensors and software model are necessary [29]. The hardware sensors equipped by the Seg-FBD are used to measure process variables (e.g., inlet air temperature and flowrate), which are transferred to the software model (e.g., fluidized bed drying model) for the real-time estimation of process variables (e.g., LOD) that are difficult to measure online. Another important part of soft sensor is real-time data communication, where OPC UA (Open Platform Communications Unified Architecture) is a standard commonly used in industry [30]. However, there are rare reports about how to develop a soft sensor by combining the models and tools in detail, which is desired to be addressed.
The objective of this work is to evaluate thermal behaviors and then develop a soft sensor for predicting real-time LOD in the Seg-FBD. Experiments involving preheating and drying periods are performed with varying inlet air temperatures, inlet air flowrates, granule mass flowrates, and loading/drying times. The temperatures of air and wall were measured by sensors and infrared camera, respectively, and the end-point LOD values were measured manually by the loss-on-weight method. The obtained data were used for evaluating the heat transfers and conductions in the base, dryer, and exhaust parts, especially for the heat transfers from heated air to base wall and from dryer cell to dryer cell, and the evaluation results were applied for developing robust heat transfer and drying models successively. Furthermore, detailed steps and applicable tools for developing a soft sensor were provided in this work, and the developed soft sensor was tested for online predictions of LOD.
2. Experiments and Models
2.1. Materials and Equipment
The utilized placebo formulation for all experiments consisted of 72 wt.% Lactose 200 M, 24 wt.% Corn Starch, and 4 wt.% Kollidon PVP K90, as in previous studies [12]. The material properties used for model development are listed in Table 1, and its sorption isotherm is shown in Figure 1, where the dots are the measured desorption data at 40 °C and the line is the fitted curve with the GAB model [31]. The three parameters C, K, and Wm in the GAB model are 13.68, 7.087 × 10⁻³, and 2.056, respectively. The necessary properties of the Seg-FBD for model development are also listed in Table 1.

Table 1.
Materials and equipment properties.
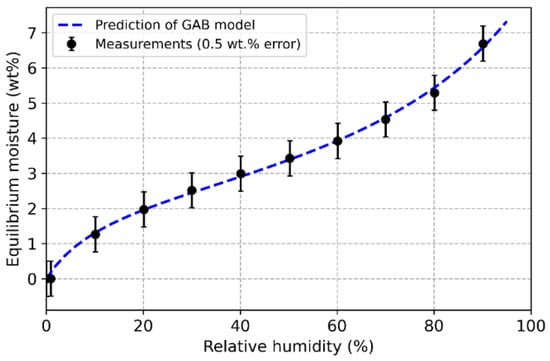
Figure 1.
Desorption data for the placebo formulation measured under 40 °C.
2.2. Experiments
Six drying experiments were performed on the GEA Cosigma line at RCPE (Research Center Pharmaceutical Engineering GmbH, Graz, Austria), and the experimental conditions are listed in Table 2. Each trial included empty equipment preheating period and drying period and used solid flowrate (msolid) of 12 kg/h and liquid to solid ratio (L/S ratio) of 12 wt.%. The inlet air temperature (Tin_set) and volume flowrate (Vin_set) were changed for development of the drying model. Since only the end-point LOD could be measured, a shorter drying time of 400 s was also applied for Trial 4.2 and Trial 5.2, separately, in order to obtain experimental data of the drying kinetics. Correspondingly, the solid loading time was decreased from 180 s to 120 s.

Table 2.
Experimental conditions for the 6 trials.
To investigate the thermal distribution of the Seg-FBD and drying behaviors in the dryer cells, the surface temperatures of the Seg-FBD and dryer cells were measured, as shown in Figure 2. Black tapes (3M 33+ Scotch vinyl tape) as shown in Figure 2a were placed onto the Seg-FBD surface since the metal is not a black-body radiator. The heat radiation from the tape was captured by an infrared camera (FLIR SC620, 640 × 480 px, f = 38 mm, spatial resolution: 0.65 mrad, minimal focus distance: 300 mm, spectral range: 7.5–13 µm, sensitivity: 40 mK), which were then transformed into temperature values applying an emissivity of ε = 0.95. The accuracy of ±2 K was confirmed by comparison to measurements of the surface temperature via a thermocouple in one region. The temperature stratification on the surface of black tapes is shown in Figure S1.
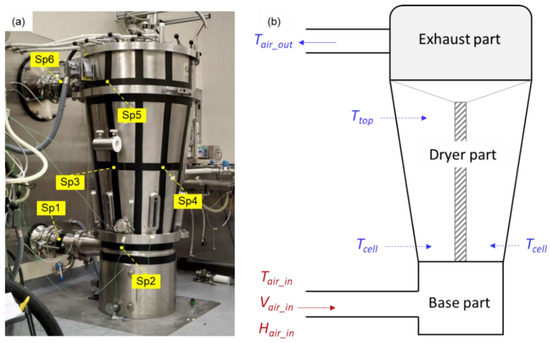
Figure 2.
(a) Seg-FBD with black tapes on surface for FLIR measurement, and (b) schematic diagram of the Seg-FBD and temperature measurement positions inside the Seg-FBD.
The temperatures of 6 spots named Sp1, 2, 3, 4, 5, and 6 were selected for analyzing the surface-temperature evolution. Meanwhile, the air temperatures near the bottom (Tcell) and top (Ttop) of the dryer part and at the outlet (Tair_out) were also measured, as shown in Figure 2b. After the materials were discharged, 3 samples of 5 g were taken and the end-point LOD in Cell3 and Cell5 were measured using the loss on drying method, where the mean error was less than 0.4 wt.%.
2.3. Drying Model
The drying model considers the mass balances of moisture, granules, air humidity, and energy balances among the base and dryer parts. Equations (1a)–(1c) and Equations (2a)–(2k) describe the energy balance in the base part and mass and energy balances in the dryer part, respectively. The energy balance includes heat transfer from air to wall, wall to environment, cell to cell (), and energies for heating granules () and filling solids involving water () and evaporated water () in the dryer part. The heat transfer coefficient from air to granules is estimated by the Nusselt number [22], and others such as heat transfer from cell to cell () and heat transfer from air to wall () were estimated from preheating and drying experiments. The mass transfer coefficient (hm) was estimated by the Sherwood number [17,22]. A lumped model was used to describe drying in the constant period and falling periods, where the drying rate is related to a normalized drying rate , as written in Equation (3b). The normalized drying rate is 1 in the constant-rate period, when granules’ moisture () is higher than the critical moisture (), and a function of the normalized moisture () as described in Equation (3c) in the falling-rate period, where is equilibrium moisture and can be calculated based on the fitted GAB model. The function could be polynomial [22] or a number of transfer units (NTU) [32], which describes how drying rate falls with the decrease of moisture.
2.4. Soft Sensor
A soft sensor combines data from physical sensors with software models. In this work, the Seg-FBD and hard sensors are simulated by historical data and a python replay server to generate live data every 10 s. The approach is shown schematically in Figure 3. The live data is transferred to the drying model in gFP through OPC UA. The python server for sending data and the client in the gFP for receiving data are provided in the Supporting Information. The received data is used in the drying model for prediction of LOD, thereby mimicking an online soft sensor.
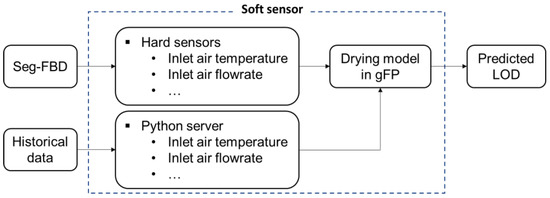
Figure 3.
Schematic diagram of a soft sensor.
3. Results and Discussion
3.1. Preheating and Drying Processes
The profiles of inlet air temperature (Tair_in), cell temperatures (Tcell1,2,3,4,5,6), and outlet air temperature (Tair_out) for preheating and drying periods are shown in Figure 4a,b and Figure S2. As excepted, the inlet air temperature has the highest value, followed by cell temperatures and then the outlet air temperature.
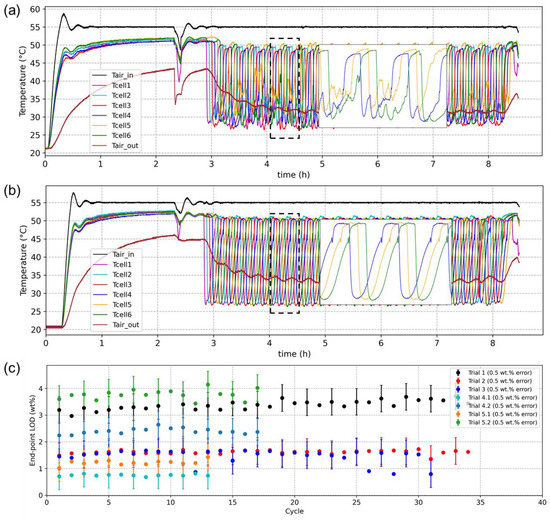
Figure 4.
Inlet air temperature (Tair_in), cell temperatures (Tcell), and outlet air temperature (Tair_out) of (a) Trial 1 and (b) Trial 2, and (c) average end-point LOD values in Cell3 and Cell5 of each cycle for Trial 1, 2, 3, 4.1, 4.2, 5.1, and 5.2.
In the preheating period, there is a sharp drop and increase of all temperatures near the end of preheating (e.g., around 2.4 h for Trial 1), which is caused by the unstable process control. This does not affect the drying process because the temperatures are already stable when filling commences (e.g., around 3.0 h for Trial 1). Moreover, it normally takes over 2 h to preheat the Seg-FBG, indicating the large mass and their potential effects on the drying process. Notably, a distribution of cell temperatures was observed for all trials during the preheating periods, where Cell1 and Cell6 have clearly higher temperatures than Cell2 and Cell5, while Cell3 and Cell4 have the lowest temperatures. The distribution is reported to be the result of the inlet air pipe design, based on CFD simulation results [15].
At the end of preheating, the cell temperature is lower than the inlet air temperature, indicating the heat losses from the base part and the cell to environment. The heat loss from cell to environment is considered in recent work [6,16,17], but it is also necessary to include the heat loss in the base part, which is studied in this work.
In the drying period, typical cell temperature profiles are observed for Trial 2, 4.1, 4.2, and 6, which are similar to those seen in other works [6,12]. The cell temperatures decline quickly, remain stable for a short period, then increase significantly until gradually reaching a stable point. This is caused by the scheduling of the Seg-FBG: material filling, drying, discharging, and waiting for the next filling. Herein, a completion of the above 4 steps for all 6 cells is called one cycle.
However, the cell temperatures for the remaining trials (e.g., Trial 1 in Figure 4a) show fluctuations during drying, which are most likely the result of lower inlet air flowrates (250 m3/h), and thus poor fluidization. Therefore, enough air flowrate is necessary, and 300 m3/h under the current operation conditions (mass flow and L/S ratio) seems to be enough according to the cell temperature profiles of Trial 6 (Figure S2). To ensure a good fluidization before experiments, the minimum inlet superficial air velocity can be estimated by using non-dimensional particle velocity and size and the Geldart particle classification chart [33,34], which can help to avoid experiments with insufficient fluidization and save cost. For the well-fluidized trials, there is small noise for each cell temperature due to the discharging of the cell. The outlet temperature also shows oscillations but is less affected by the scheduling compared to the cell temperatures.
In addition, the average end-point LOD values measured from samples in Cell3 and Cell5 of each cycle for Trial 1–5 are shown in Figure 4c. Generally, lower LOD values were observed under higher drying temperature, higher air flowrate or longer drying time. Their standard deviations are 0.35 wt.% (Trial 1), 0.07 wt.% (Trial 2), 0.26 wt.% (Trial 3), 0.12 wt.% (Trial 4.1), 0.12 wt.% (Trial 4.2), 0.11 wt.% (Trial 5.1), and 0.19 wt.% (Trial 5.2), separately, indicating the stable LOD measurements.
3.2. Thermal Behaviors
The thermal behaviors of the Seg-FBG are also important and will directly affect the drying because of the heat transfer and conduction for the base, dryer, and exhaust parts with large masses. Thus, it is worth understanding the effects of the heat transfer and conduction.
3.2.1. Cell to Cell Heat Transfer
The empty cell temperatures during the drying period are about 2 °C lower than those at the end of preheating, as shown in Figure 5a, indicating that there is heat transfer from an empty cell to its neighboring cells where drying is ongoing. A temperature gap was also observed in other work [16], but it was smaller probably due to lower inlet air temperature (45 °C) than that in this work (55–75 °C). Using cell states (filled or empty) and cell temperatures in Figure 5b,c as an example, Cell5 is empty and ready to be filled, while the neighboring Cell4 is in drying mode and Cell6 just finished discharging materials. Cell5 has a similar temperature to Cell6, which is more than 20 °C higher than that in Cell4. Thus, there will be heat transfer from Cell5 to Cell4 through the cell-to-cell plate.
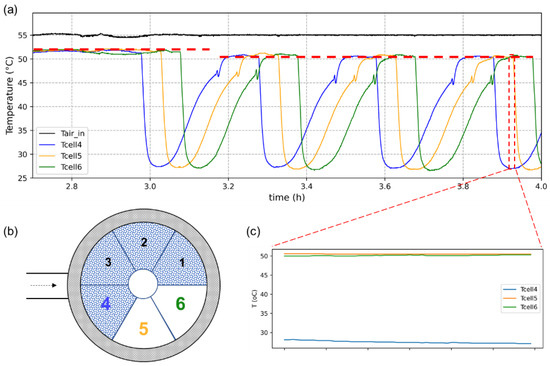
Figure 5.
(a) temperature profiles of inlet air, Cell4, 5, and 6 in preheating and drying, (b) schematic diagram of cell states (filled state in blue or empty state in white), and (c) temperature profiles of Cell4, 5 and 6.
To estimate the heat transfer from cell to cell (), it is assumed that the heat transfer coefficient () and area () are the same for each plate and are independent of temperature. Then, an energy balance equation could be built for the selected region as shown in Figure 5c:
Th Equation (4) means that the difference of the temperature in Cell5 between the end of preheating and the selected period is caused by heat transfer to Cell4 and Cell6, where the was calculated as 1.60 W/K. Through Equation (5), the ratio of the heat that transfers from Cell5 to Cell4 to the heat from inlet air is 7.02%, which should be considered into the drying model.
3.2.2. Heat Conductions among Base, Dryer, and Exhaust Parts
Subsequently, the heat conduction among the base, dryer, and exhaust parts were also investigated. Figure 6 shows the temperature profiles of points Sp1, Sp2, Sp5, and Sp6, which are highlighted in Figure 2a. Clearly, the temperature differences between Sp1 and Sp2 or Sp5 and Sp6 are not remarkable, especially during drying period. This indicates that there is considerable heat conduction inside both the base part and the exhaust part. Moreover, there are temperature oscillations for Sp2, Sp5, and Sp6 due to the scheduling, but there is no oscillation for Sp1 because it is close to the entrance of heated air and has a long distance to the dryer part. However, the largest oscillation leads to about 1 °C difference, which is small compared to the temperatures of these points, e.g., 30 °C for Sp6 and 42 °C for Sp1. That means the effects of heat conductions between base, dryer, and exhaust parts are not significant on the drying process. The temperature increase seen in Figure 6b for Sp5 and Sp6 after 8 h is because it was the end of the experiment, where the solids stopped filling and the hot drying air heated the empty cells. This phenomenon was also observed for the outlet air temperature in this (Figure 4a,b) and other works [16].

Figure 6.
Temperature profiles of (a) Sp1 and Sp2, and (b) Sp5 and Sp6.
Furthermore, the heat transfer and conduction in the dryer part were also studied. Figure 7 exhibits the temperature profiles of Cell5, Cell6, Sp3, and Sp4, and their differences. Sp3 and Sp4 (Figure 2a) are the center points of the wall surfaces of Cell5 and Cell6, respectively. The temperature oscillation of Sp3 compared to that of Tcell5 (Figure 7a) is small, indicating no significant heat transfer between cell and cell wall, which is also observed between Sp3 and Tcell6. The temperature difference between Cell5 and Cell6 (Figure 7b) could reach 25 °C, but the difference between Sp3 and Sp4 at that moment is about 2.0 °C. That implies good heat conduction between cell wall to cell wall.

Figure 7.
Temperature profiles of (a) Cell5, Cell6, Sp3, and Sp4, and (b) temperature difference between Cell5 and Cell6, and between Sp3 and Sp4.
All the above analyses show the good conduction in the walls, and therefore the wall temperature of each part can be considered as homogeneous. Moreover, the heat conduction between neighboring parts has limited effects on drying and can be ignored.
3.3. Heat Transfer Model Development
Based on the analyses of heat transfer and conduction in the Seg-FBD, the model for thermal behaviors was developed. The base and dryer parts were included, while the exhaust part was excluded because its thermal behaviors would not affect the drying. The model can be expressed by the equations in the Section 2.3. Due to the considerable heat conduction, the wall temperature for each part is assumed as homogeneous, which ignores the calculation for heat conductivity [16]. The heat transfer from heated air to wall, from wall to environment, and from cell to cell are included in the model for both base and dryer parts. To reduce the numbers of fitting parameters, the masses of base and dryer parts were set as 90 and 200 kg, respectively, their surface areas ( and ) were assumed as 1 m2, and the heat transfer coefficients from wall to environment () were assumed as 8 W/m2/K. The heat transfers from air to base wall () and dryer wall () were considered as the model parameters and calibrated by using the preheating experiments.
Since the model is not able to simulate the effects of pipe design on temperature distribution and the temperature distribution is not significant, the average temperature of the 6 cells is used for thermal model calibration. The initial guesses, lower and upper bounds, optimal value of the model parameters and calibration results are listed in Table 3, and the comparisons between experimental and predicted temperatures are shown in Figure 8. Clearly, the predicted temperatures are in good agreement with the experimental ones. The calibration outputs from gFP show that the t-values (95%) for the two parameters are 0.526 and 1.36, which are higher than the reference t-value (95%) of 1.65, indicating a high degree of confidence in the thermal model.

Table 3.
Initial guesses, lower and up bounds, optimal values of the model parameters, t-value (95%) and reference t-value (95%).
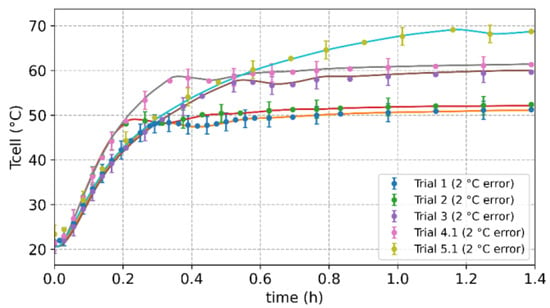
Figure 8.
Comparison between experimental and predicted average cell temperatures.
3.4. Drying Model Development
The drying model of the Seg-FBD was built by combining the obtained heat transfer model with drying kinetics. The calibration of the drying model was then performed by fitting the cell temperatures of Trial 2, Trial 4.1, and Trial 6, and the final LOD values of Trial 2, Trial 4.1, and Trial 4.2. Owing to the similar cell temperature profiles and small LOD deviation in each cycle of drying process, the first cycle of experimental cell temperatures and LOD was used for calibration to reduce the computational time. The two fitting parameters, the critical moisture and drying curve parameter D, and their initial guesses, lower and upper bounds, and optimal values are listed in Table 4, and the calibration results are plotted in Figure 9. Most of the predicted cell temperatures have error lower than 2 °C, while the error in the final LOD values is less than 0.5 wt.%, indicating good agreement with experimental measurements. Furthermore, the reference t-value 1.66 is lower than the t-values of critical moisture (5.41) and drying curve parameter D (2.33), indicating a high degree of confidence in the seg-FBD drying model.

Table 4.
Initial guesses, lower and upper bounds, optimal value of each parameter in seg-FBD drying model, t-value (95%), and reference t-value (95%).

Figure 9.
Comparison between predicted and experimental (a) cell temperature and (b) final LOD value.
The optimal critical moisture drying curve parameter D were determined as 10.1 wt.% and 0.888, respectively. Based on that, the relationship between drying rate and LOD could be visualized, as shown in Figure 10. When the normalized moisture is higher than 1.0, i.e., LOD higher than 10.1 wt.%, the drying is in the constant-rate period. When the normalized moisture is lower than 1.0, i.e., LOD lower than 10.1 wt.%, the drying is in the falling-rate period. As the normalized moisture decreases from 1.0, the drying rate rapidly decreases, and the rate of decrease slows as the normalized moisture falls. For comparison, the NTU function [32] was also applied and the drying curves were plotted, and it produces a similar curve to the polynomial equation in this case when the NTU value is −3.3. The result suggests that comparing to the drying kinetic models considering only falling rate period [17], it is better to involve both constant- and falling-rate periods.
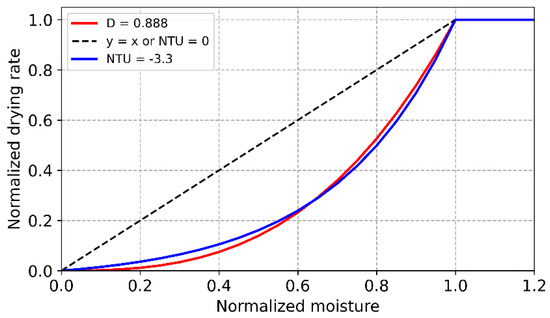
Figure 10.
Drying curve based on polynomial and NTU equations.
3.5. Soft Sensing
With the developed drying model, a soft sensor for predicting LOD and cell temperature is established by combining the live data from the python server and the model in gFP. Details of the data server and client are provided in the Supporting Information. LOD values and cell temperatures in Cell3 and Cell5 were used for testing the soft sensor, since LOD values were measured for the two cells.
As clearly shown in Figure 11, the predicted final LOD values and cell temperatures are in good agreement with the experimental ones for Cell3 and Cell5, indicating the ability of the soft sensor to provide accurate online predictions. Specifically, the errors of final LOD values are within 0.5 wt.% and are higher for Cell5. The reason could be the bigger gap between predicted and experimental cell temperatures in Cell5 at the end of material loading, leading to slightly more predicted drying in Cell5 than in the real process. It should be mentioned that the drying model does not consider the temperature distribution amongst cells, but still gives rise to excellent predictions of LOD values and cell temperatures, indicating the limited effects of the temperature distribution on the drying process. The possible reason could be the considerable cell-to-cell heat transfers and high heat conductions in the wall, which increase the uniformity of LOD and cell temperatures of the six cells. Comparing this to other work [6], better temperature predictions were presented here because the developed heat transfer model also considers heat capacity of walls and cell-to-cell heat transfers.
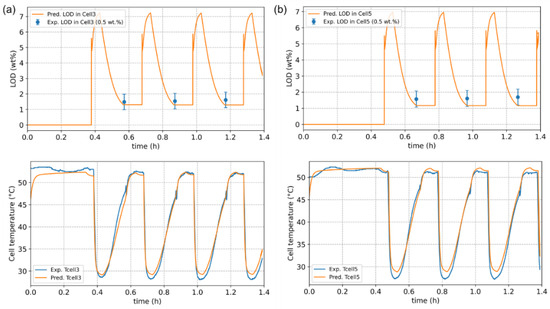
Figure 11.
Comparison of experimental and predicted cell temperatures and LOD values from soft sensing in (a) Cell3 and (b) Cell5, respectively.
4. Outlook
The above results showed the development of a robust mechanistic drying model and soft sensor for the Seg-FBD. The model calibration needed three or more pre-experiments, which consumed materials and time. To this end, a dynamic state estimation [35] can be introduced, which enables online calibration of the drying model and simultaneous prediction of state values such as LOD. This is already available in gFP and can be achieved without pre-experiments, saving costs and time. Meanwhile, a PAT method can be parallelly implemented for soft sensing, which can help to reduce the uncertainties of the process inputs and measurements. Furthermore, it can monitor solid states such as granules size and give more information of the process [18].
5. Conclusions
In summary, experiments including preheating and drying periods were performed for evaluating heat transfers and conductions in the Seg-FBD and developing the drying model. The evaluation results showed high heat conductions in walls, considerable heat losses from heated air to environment in the base part and cell wall, and considerable heat transfers from cell to cell, which was approximately 7% of the energy provided from the heated air. Based on that, a heat transfer model was developed in gFP, which predicted cell temperatures in the preheating periods very precisely. Then, a drying model was built combining the heat transfer model and drying kinetics, and the temperature and LOD errors are less than 2 °C and 0.5 wt.% respectively. The calibrated critical moisture and the drying curve parameter D indicated that the constant-rate drying period when LOD was higher than 10.1 wt.%, while falling-rate drying period when LOD was lower than 10.1 wt.%, where the drying rate fell quickly. Subsequently, a way to build a soft sensor by connecting data source, data communication method, and modeling software was explained in detail. The developed soft sensor for the Seg-FBD showed capability for accurate online predictions of LOD and cell temperatures, which could be used to guide the continuous production in the Seg-FBD and determine the end point of the drying process. Furthermore, a state estimation method was briefly introduced, which could help to reduce the time and costs of the pre-experiments for drying model development.
Supplementary Materials
The following supporting information can be downloaded at: https://www.mdpi.com/article/10.3390/pr10122609/s1, Figure S1: Temperature stratification on the surface of black tapes; Figure S2: Temperature profiles of Trial 3, 4.1, 4.2, 5.1, 5.2 and 6. Codes: Codes of OPC UA server in python for sending data and codes of OPC UA client in gFP for receiving data (json style).
Author Contributions
Conceptualization, M.L. and R.S.; methodology, M.L., P.K. and R.S.; software, M.L., P.K. and A.S.; validation, M.L., A.S., S.W. and R.S.; formal analysis, M.L.; investigation, M.L.; resources, R.S., A.S. and S.W.; data curation, M.L.; writing—original draft preparation, M.L.; writing—review and editing, M.L., P.K., A.S., S.W. and R.S.; visualization, M.L.; supervision, R.S.; project administration, M.L. and R.S.; funding acquisition, R.S. All authors have read and agreed to the published version of the manuscript.
Funding
This research received no external funding.
Data Availability Statement
Not applicable.
Conflicts of Interest
The authors declare no conflict of interest.
Nomenclature
| A | Surface area (m2) |
| Cp | Specific heat capacity (J/kg/K) |
| f | Fraction of granules |
| hm | Mass transfer coefficient (m/s) |
| hv | Latent heat of water evaporation (J/kg) |
| m | Mass (kg) |
| msolid | Solids input flowrate (kg/h) |
| M | Granule moisture or LOD (g/g dry basis) |
| Meq | Equilibrium moisture (g/g dry basis) |
| Mcr | Critical granules moisture (g/g dry basis) |
| Qevaporated water | Heat transfer from air to evaporated water (W) |
| Qcell2cell | Heat transfer from cell to cell (W) |
| Qgranules | Heat transfer from air to granules (W) |
| Qsolid | Heat transfer from air to filling solids (W) |
| Qwall | Heat loss from air to dryer wall (W) |
| Rdrying | Drying rate (kg/s) |
| t | Time (s) |
| T | Temperature (°C) |
| Tcell | Cell temperature (°C) |
| U | Heat transfer coefficient (W/m2/K) |
| Vair_in | Inlet air flowrate (m3/h) |
| Vair_in_cell_i | Inlet air flowrate of cell i (m3/h) |
| Vbase | Volume of base part (m3) |
| Vdryer | Volume of dryer part (m3) |
| y | Air humidity (kg/kg) |
| Greek Letters | |
| η | Normalized moisture |
| v | Normalized drying rate |
| ρ | Density (kg/m3) |
| Subscripts | |
| air | Air |
| air_in | Air at the inlet |
| air_base | Air in the bast part |
| air_dryer | Air in the dryer part |
| air_dryer_neighbor_cell | Air in the neighboring dryer cell |
| air_mesh | Air at the mesh distributor or bottom of the dryer part |
| base | Base part |
| base_in | Inner wall of base part |
| base_out | Outer wall of base part |
| cell | Dryer cell |
| cell2cell | Cell to cell |
| dryer | Dryer part |
| dryer_in | Inner wall of dryer part |
| dryer_out | Outer wall of dryer part |
| env | Environment |
| granules | Granules in dryer part |
| set | Set point |
| wall | Wall of base or dryer part |
References
- De Leersnyder, F.; Vanhoorne, V.; Bekaert, H.; Vercruysse, J.; Ghijs, M.; Bostijn, N.; Verstraeten, M.; Cappuyns, P.; Van Assche, I.; Vander Heyden, Y.; et al. Breakage and drying behaviour of granules in a continuous fluid bed dryer: Influence of process parameters and wet granule transfer. Eur. J. Pharm. Sci. 2018, 115, 223–232. [Google Scholar] [CrossRef] [PubMed]
- Mascia, S.; Heider, P.L.; Zhang, H.; Lakerveld, R.; Benyahia, B.; Barton, P.I.; Braatz, R.D.; Cooney, C.L.; Evans, J.M.B.; Jamison, T.F.; et al. End-to-end continuous manufacturing of pharmaceuticals: Integrated synthesis, purification, and final dosage formation. Angew. Chem. Int. Ed. 2013, 52, 12359–12363. [Google Scholar] [CrossRef] [PubMed]
- Ooi, S.M.; Sarkar, S.; van Varenbergh, G.; Schoeters, K.; Heng, P.W.S. Continuous processing and the applications of online tools in pharmaceutical product manufacture: Developments and examples. Ther. Deliv. 2013, 4, 463–470. [Google Scholar] [CrossRef] [PubMed]
- Rantanen, J.; Khinast, J. The future of pharmaceutical manufacturing sciences. J. Pharm. Sci. 2015, 104, 3612–3638. [Google Scholar] [CrossRef] [PubMed]
- Ierapetritou, M.; Escotet-Espinoza, M.S.; Singh, R. Process simulation and control for continuous pharmaceutical manufacturing of solid drug products. In Continuous Manufacturing Pharmaceuticals; Kleinebudde, P., Khinast, J., Rantanen, J., Eds.; John Wiley & Sons: Hoboken, NJ, USA, 2017; pp. 33–105. [Google Scholar]
- Rehrl, J.; Sacher, S.; Horn, M.; Khinast, J. End-point prediction of granule moisture in a ConsiGmaTM-25 segmented fluid bed dryer. Pharmaceutics 2020, 12, 452. [Google Scholar] [CrossRef] [PubMed]
- Pauli, V.; Elbaz, F.; Kleinebudde, P.; Krumme, M. Orthogonal redundant monitoring of a new continuous fluid-bed dryer for pharmaceutical processing by means of mass and energy balance calculations and spectroscopic techniques. J. Pharm. Sci. 2019, 108, 2041–2055. [Google Scholar] [CrossRef] [PubMed]
- Ghijs, M.; Schäfer, E.; Kumar, A.; Cappuyns, P.; Van Assche, I.; De Leersnyder, F.; Vanhoorne, V.; De Beer, T.; Nopens, I. Modeling of semicontinuous fluid bed drying of pharmaceutical granules with respect to granule size. J. Pharm. Sci. 2019, 108, 2094–2101. [Google Scholar] [CrossRef]
- Emery, E.; Oliver, J.; Pugsley, T.; Sharma, J.; Zhou, J. Flowability of moist pharmaceutical powders. Powder Technol. 2009, 189, 409–415. [Google Scholar] [CrossRef]
- Crouter, A.; Briens, L. The effect of moisture on the flowability of pharmaceutical excipients. Aaps PharmSciTech 2014, 15, 65–74. [Google Scholar] [CrossRef]
- Gabbott, I.P.; Al Husban, F.; Reynolds, G.K. The combined effect of wet granulation process parameters and dried granule moisture content on tablet quality attributes. Eur. J. Pharm. Biopharm. 2016, 106, 70–78. [Google Scholar] [CrossRef]
- Rehrl, J.; Hörmann-Kincses, T.; Sibanc, R.; Hsiao, W.K.; Franke, M.; Khinast, J. Fluidization characterization in the ConSigma 25 dryer via process data—A method of advanced quality assurance in continuous manufacturing. Int. J. Pharm. 2021, 607, 121041. [Google Scholar] [CrossRef] [PubMed]
- Ryckaert, A.; Ghijs, M.; Portier, C.; Djuric, D.; Funke, A.; Vervaet, C.; De Beer, T. The influence of equipment design and process parameters on granule breakage in a semi-continuous fluid bed dryer after continuous twin-screw wet granulation. Pharmaceutics 2021, 13, 293. [Google Scholar] [CrossRef] [PubMed]
- Vandevivere, L.; Denduyver, P.; Portier, C.; Häusler, O.; De Beer, T.; Vervaet, C.; Vanhoorne, V. The effect of binder types on the breakage and drying behavior of granules in a semi-continuous fluid bed dryer after twin screw wet granulation. Int. J. Pharm. 2022, 614, 121449. [Google Scholar] [CrossRef]
- Grelier, A.; Zadravec, M.; Remmelgas, J.; Forgber, T.; Colacino, F.; Pilcer, G.; Stauffer, F.; Hörmann-Kincses, T. Model-Guided Development of a Semi-Continuous Drying Process. Pharm. Res. 2022, 39, 2005–2016. [Google Scholar] [CrossRef] [PubMed]
- Mortier, S.T.F.; Gernaey, K.V.; De Beer, T.; Nopens, I. Analysing drying unit performance in a continuous pharmaceutical manufacturing line by means of mass–Energy balances. Eur. J. Pharm. Biopharm. 2014, 86, 532–543. [Google Scholar] [CrossRef] [PubMed]
- Wang, L.G.; Omar, C.; Litster, J.; Slade, D.; Li, J.; Salman, A.; Bellinghausen, S.; Barrasso, D.; Mitchell, N. Model driven design for integrated twin screw granulator and fluid bed dryer via flowsheet modelling. Int. J. Pharm. 2022, 628, 122186. [Google Scholar] [CrossRef]
- Fonteyne, M.; Gildemyn, D.; Peeters, E.; Mortier, S.T.F.; Vercruysse, J.; Gernaey, K.V.; Vervaet, C.; Remon, J.P.; Nopens, I.; De Beer, T. Moisture and drug solid-state monitoring during a continuous drying process using empirical and mass balance models. Eur. J. Pharm. Biopharm. 2014, 87, 616–628. [Google Scholar] [CrossRef]
- Fonteyne, M.; Arruabarrena, J.; de Beer, J.; Hellings, M.; Van Den Kerkhof, T.; Burggraeve, A.; Vervaet, C.; Remon, J.P.; De Beer, T. NIR spectroscopic method for the in-line moisture assessment during drying in a six-segmented fluid bed dryer of a continuous tablet production line: Validation of quantifying abilities and uncertainty assessment. J. Pharm. Biomed. Anal. 2014, 100, 21–27. [Google Scholar] [CrossRef]
- Avila, C.R.; Ferré, J.; de Oliveira, R.R.; de Juan, A.; Sinclair, W.E.; Mahdi, F.M.; Hassanpour, A.; Hunter, T.N.; Bourne, R.A.; Muller, F.L. Process monitoring of moisture content and mass transfer rate in a fluidised bed with a low cost inline MEMS NIR sensor. Pharm. Res. 2020, 37, 1–19. [Google Scholar] [CrossRef]
- Mortier, S.T.F.; De Beer, T.; Gernaey, K.V.; Remon, J.P.; Vervaet, C.; Nopens, I. Mechanistic modelling of fluidized bed drying processes of wet porous granules: A review. Eur. J. Pharm. Biopharm. 2011, 79, 205–225. [Google Scholar] [CrossRef]
- Gavi, E. Application of a mechanistic model of batch fluidized bed drying at laboratory and pilot scale. Drying Technol. 2019, 38, 1062–1078. [Google Scholar] [CrossRef]
- Kemp, I.C.; Oakley, D.E. Modelling of particulate drying in theory and practice. Drying Technol. 2002, 20, 1699–1750. [Google Scholar] [CrossRef]
- Wang, H.G.; Dyakowski, T.; Senior, P.; Raghavan, R.S.; Yang, W.Q. Modelling of batch fluidised bed drying of pharmaceutical granules. Chem. Eng. Sci. 2017, 62, 1524–1535. [Google Scholar] [CrossRef]
- Lee, D.H.; Kim, S.D. Mathematical model for batch drying in an inert medium fluidized bed. Chem. Eng. Technol. 1999, 22, 443–450. [Google Scholar] [CrossRef]
- Aly, S.E.; Fathalah, K.A. A three phase model of a batch fluidized bed. Heat and mass transfer. Heat Mass Transf. 1999, 34, 405–412. [Google Scholar] [CrossRef]
- Wang, H.G.; Yang, W.Q.; Senior, P.; Raghavan, R.S.; Duncan, S.R. Investigation of batch fluidized-bed drying by mathematical modeling, CFD simulation and ECT measurement. AIChE J. 2008, 54, 427–444. [Google Scholar] [CrossRef]
- Burgschweiger, J.; Groenewold, H.; Hirschmann, C.; Tsotsas, E. From hygroscopic single particle to batch fluidized bed drying kinetics. Can. J. Chem. Eng. 1999, 77, 333–341. [Google Scholar] [CrossRef]
- Zhu, X.; Rehman, K.U.; Wang, B.; Shahzad, M. Modern soft-sensing modeling methods for fermentation processes. Sensors 2020, 20, 1771. [Google Scholar] [CrossRef] [PubMed]
- Panda, S.K.; Majumder, M.; Wisniewski, L.; Jasperneit, J. Real-time industrial communication by using OPC UA field level communication. In Proceedings of the IEEE Conference on Emerging Technology and Factory Automation, Wien, Austria, 8–11 September 2020; pp. 1143–1146. [Google Scholar]
- Blahovec, J.; Yanniotis, S. GAB generalized equation for sorption phenomena. Food Bioprocess Technol. 2008, 1, 82–90. [Google Scholar] [CrossRef]
- Kemp, I.C.; Sohet, Q. Scale-up, optimization, and control of industrial batch fluidized bed dryers using multilevel theoretical models. Drying Technol. 2010, 28, 710–722. [Google Scholar] [CrossRef]
- Das, H.J.; Mahanta, P.; Saikia, R.; Aamir, M.S. Performance Evaluation of drying characteristics in conical bubbling fluidized bed dryer. Powder Technol. 2020, 374, 534–543. [Google Scholar] [CrossRef]
- Das, H.J.; Saikia, R.; Mahanta, P. Effects of spiral and cone angles on drying characteristics and energy consumption of fluidized bed paddy dryer. Drying Technol. 2022, 40, 852–863. [Google Scholar] [CrossRef]
- Zhao, J.; Netto, M.; Huang, Z.; Yu, S.S.; Gómez-Expósito, A.; Wang, S.; Kamwa, I.; Akhlaghi, S.; Mili, L.; Terzija, V.; et al. Roles of dynamic state estimation in power system modeling, monitoring and operation. IEEE Trans. Power Syst. 2020, 36, 2462–2472. [Google Scholar] [CrossRef]
Publisher’s Note: MDPI stays neutral with regard to jurisdictional claims in published maps and institutional affiliations. |
© 2022 by the authors. Licensee MDPI, Basel, Switzerland. This article is an open access article distributed under the terms and conditions of the Creative Commons Attribution (CC BY) license (https://creativecommons.org/licenses/by/4.0/).