Abstract
Recently, a new swarm intelligence optimization algorithm called the remora optimization algorithm (ROA) was proposed. ROA simulates the remora’s behavior of the adsorption host and uses some formulas of the sailfish optimization (SFO) algorithm and whale optimization algorithm (WOA) to update the solutions. However, the performance of ROA is still unsatisfactory. When solving complex problems, ROA’s convergence ability requires further improvement. Moreover, it is easy to fall into local optimization. Since the remora depends on the host to obtain food and optimize ROA performance, this paper introduces the mutualistic strategy to strengthen the symbiotic relationship between the remora and the host. Meanwhile, chaotic tent mapping and roulette wheel selection are added to further improve the algorithm’s performance. By incorporating the above improvements, this paper proposes an improved remora optimization algorithm with a mutualistic strategy (IROA) and uses 23 benchmark functions in different dimensions and CEC2020 functions to validate the performance of the proposed IROA. Experimental studies on six classical engineering problems demonstrate that the proposed IROA has excellent advantages in solving practical optimization problems.
1. Introduction
One problem may have multiple solutions, but only one optimal solution exists. The process of finding the optimal solution can be called problem optimization. Traditional optimization schemes, such as the gradient descent method [1], can easily find the optimal solution when solving linear problems. However, for some complex nonlinear problems, due to involving high-dimensional data, having difficulty in obtaining gradient information, and/or being unable to know derivatives, it will be computationally expensive or time-consuming to achieve optimal results. While the metaheuristic algorithms (MAs) do not need derivative information and gradient information to solve these problems, they rely on their strong randomness to obtain an ideal solution under constraint conditions. Benefited by these factors, MAs have been praised by many scholars. Motivated by solving problems from industry, and enlightened by nature, many scholars have carried out detailed studies of in the field of interest [2,3]. There are also many complex problems in the fields of engineering. MAs have been applied to complex engineering problems by many scholars because of their simplicity, easy realization, and high accuracy [4]. It is precisely the great practical value of MAs that have attracted many scholars to conduct research and make continuous progress.
The inspiration for MAs comes from physical phenomena, mathematical principles, chemical reactions, animal behavior, human behavior, genetic variation theory, etc. Although general MAs can find global optimal solutions after enough iterations, there are an increasing number of MAs being proposed with higher efficiency and improved performance. For example, the multiverse optimizer (MVO) [5] establishes mathematical models by simulating white holes, black holes, and wormholes in the universe to conduct global search and local exploitation; simulated annealing (SA) [6] comes from the principle of solid annealing; the golden ratio optimization method (GROM) [7] is inspired by the golden ratio of plant growth; the artificial chemical reaction optimization algorithm (ACROA) [8] is inspired by different types of chemical reactions; the whale optimization algorithm (WOA) [9] imitates whales’ behavior to defend prey and obtain food through bubble net attack; the slime mold algorithm (SMA) [10] is based on the spread and foraging behavior of slime molds; the aquila optimizer (AO) [11] establishes a mathematical model based on the aquila’s hunting behavior to solve optimization problems; the inspiration of teaching- and learning-based optimization (TLBO) [12] comes from the teaching behavior between teachers and students and the self-learning behavior among students; and harmony search (HS) [13] simulates the improvisation of musicians.
The remora optimization algorithm (ROA) is a swarm intelligence optimization algorithm proposed by Jia et al. in 2021 [14]. As one of the smartest fish in the sea, the remora will obtain food from hosts or avoid enemy hosts. The ROA selects sailfish and whales as hosts. It carries out global exploration through some formulas of the sailfish optimization (SFO) algorithm [15] and carries out local exploitation through the bubble net attack method of the whale optimization algorithm (WOA). At the same time, it switches hosts based on the experience attack. Finally, ROA simulates the remora’s foraging behavior after the host finds food. Although ROA has been used to solve various problems, the NFL theorem [16] shows that when an algorithm significantly affects one group of optimization problems, the effect on another group of optimization problems may be insufficient. Therefore, it is necessary to improve the existing ROA for more applications, considering that ROA quickly falls into local optimum when solving complex problems. Many scholars have improved ROA. For example, Zheng et al. added an autonomous foraging mechanism (AFM) to ROA, inspired by the remora’s autonomous predatory behavior. AFM can effectively expand the search space, make the remora obtain better food, and improve the accuracy of the algorithm [17]. Wen et al. proposed a new host-switching mechanism to balance ROA’s exploration and exploitation capacities and combined joint opposite selection and restart strategy to improve ROA’s convergence behavior [18]; Wang et al. improved ROA through Levy flight, an adaptive dynamic factor, and a restart strategy [19]; Liu et al. improved ROA through Brownian motion and lens opposition-based learning for multi-image segmentation [20]. All the above improvements have contributed to the enhancement of the traditional ROA.
In ROA, the remora uses random attachment of marine organisms to obtain food, which leads to insufficient connection between remoras and insufficient accuracy of the value. In order to improve the performance of ROA to achieve better effectiveness by considering the shortcomings of ROA, this paper proposes an improved remora optimization algorithm with a mutualistic strategy (IROA). The mutualistic strategy comes from symbolic organisms search (SOS) [21]. The inspiration for SOS comes from the harmonious symbiosis of different parts of the ecosystem, similar to the relationship between the remora and the host in ROA. In order to improve the connection between the remora and the host, the accuracy of the algorithm is enhanced. In this paper, we use a mutualistic strategy to strengthen the relationship with the host, so that the remora can be optimized for food search. Tent chaotic mapping [22] and roulette selection [23] are commonly used optimization strategies. Adding a tent chaotic map in the initialization phase can enable IROA to have a more uniform population distribution and improve the optimization ability of the algorithm. After that, the roulette wheel selection is added to simulate the behavior of remora randomly selecting directions to find food, which enhances the randomness of the algorithm. The experiment shows that the improved IROA has a better optimization effect. Therefore, this paper uses the symbiosis idea in SOS, tent chaotic mapping, and wheel selection to modify ROA and improve its global optimization capability.
The contributions of this paper are as follows:
- IROA is proposed by incorporating the mutualistic strategy, tent chaotic mapping, and roulette wheel selection.
- The performance of IROA is evaluated through 23 benchmark functions in different dimensions (30 and 500) and CEC2020 functions in 10 dimensions.
- IROA is applied to six common engineering problems to investigate its effectiveness.
The rest of the paper is organized as follows: Section 2 introduces ROA; Section 3 introduces the mutualistic strategy, tent chaotic mapping, roulette wheel selection, and the specific details of IROA; Section 4 shows the performance of IROA in the test functions; Section 5 shows IROA’s behavior in solving engineering problems; Section 6 is a summary of this paper.
2. Remora Optimization Algorithm (ROA)
ROA is a newly proposed swarm intelligent optimization algorithm inspired by the remora’s adsorbing host in the ocean. For the remora, it is much easier to obtain food by relying on the host than depending on the remora itself. In the ROA, sailfish and whales are selected as the main hosts. Therefore, ROA updates the positions through some formulas of the SFO algorithm and WOA, considering global exploration and local exploitation. Moreover, ROA will also judge whether the remora needs to switch hosts through an experience attack. If the host can find food, the remora will look for food residues around the host, which is called host feeding. Figure 1 shows the detailed process of the remora’s absorbing host, switching host, and searching for food.
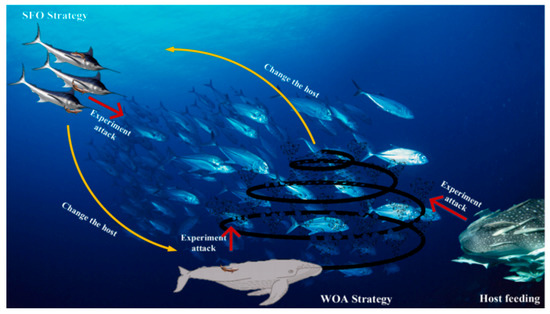
Figure 1.
The schematic diagram of different stages of ROA.
2.1. Initialization
The initialization is to generate a group of random solutions in the search space, and each solution is initialized by Formula (1) in each dimension.
In the Formula, i represents the index value of the solution; lbj and ubj represent the upper and lower bounds of the jth dimension in the search space, respectively; and rand can take random numbers between intervals [0, 1].
2.2. Free Travel (Exploration)
2.2.1. Sailfish Optimization (SFO) Strategy
Considering the fast-swimming speed of sailfish in the ocean, ROA chooses sailfish as the main host in the exploration stage. The position of the remora is updated through the elite strategy of the SFO algorithm. The updated Formula is as follows:
where Posit+1 represents the ith remora’s position after moving, t represents the current number of iterations, PosBestt represents the current optimal position, and Posrandt represents the position of the random individual in the current population.
2.2.2. Experience Attack
The remora mainly depends on the host to obtain food. If the host cannot provide food for the remora, the remora will choose to switch to another host. Therefore, the remora will carry out a small range of exploratory movements around the host. This process is called an experience attack. The specific Formula is as follows:
Posiatt refers to the remora’s position after the exploratory movement, Posit refers to the current position of the ith remora, Posipre refers to the ith remora’s position in the previous generation, and randn can generate a random number in the range of [0, 1] that conforms to the normal distribution.
f() is used to evaluate the fitness value of the current position, so f(Posiatt) and f(Posit) represent the fitness values of Posiatt and Posit,, respectively. If Posiatt’s fitness value exceeds Posit’s, the remora will choose to switch hosts. The Formula for switching host is as follows:
S(i) will determine the ith remora’s host. If S(i) is equal to 1, the remora will select a whale as the host and absorb it. Otherwise, the sailfish will be selected as the host. The round has the function of rounding.
2.3. Eat Thoughtfully (Exploitation)
2.3.1. Whale Optimization Algorithm (WOA) Strategy
Part of the WOA’s formulas is used to simulate the behavior of the remora adsorbing on the whale. At this time, the population updates their position through the following Formula:
where D represents the distance between the current individual and the optimal individual, e is an infinite noncyclic decimal with a value of (2.71828), a is a random number between [−1, 1], and h decreases linearly from 1 to −2.
2.3.2. Host Feeding
After the host finds food, the remora will also look for food around the host, which we call host feeding. The specific mathematical Formula is as follows:
In the Formula, A represents the distance at which the remora will move, B and V simulate the host’s volume and the remora’s volume, and C represents the remora factor with a value of 0.1.
The pseudocode of ROA is as follows Algorithm 1:
| Algorithm 1: The pseudocode of ROA |
| 1. Initialize parameters (population size: N, total iteration: T, remora factor: C) |
| 2. Initialize the population by using Formula (1) |
| 3. While (t < T) |
| 4. Pull search agents outside the search space back to the boundary |
| 5. Calculate each search agent’s fitness value and update PosBest |
| 6. For i in 1 to N |
| 7. If S(i) == 0 then |
| 8. Choose a sailfish as the host for position update by Formula (2) |
| 9. Else if S(i) == 1 |
| 10. Choose a whale as the host for position update by Formulas (5)–(8) |
| 11. End if |
| 12. Move to a small area around the host by Formula (3) |
| 13. If f(Posiatt) < f(Posit) |
| 14. Switch hosts by Formula (4) and update Posit |
| 15. Else |
| 16. Host feeding by Formulas (9)–(12) |
| 17. End if |
| 18. End for |
| 19. t = t + 1 |
| 20. End While |
| 21. Return PosBestt |
3. The Proposed Approach
Although ROA has achieved satisfactory performance in some optimization problems and test functions, with an increase in the problem’s dimension and complexity, ROA can easily fall into local optimum and cannot converge continuously. Despite ROA being able to update the positions by two hosts, it does not take full advantage of the host. Therefore, this paper uses the mutualistic strategy in reference [17] to improve ROA by enhancing the symbiosis relationship between the remora and host. In addition, tent chaos mapping initialization and roulette wheel selection are also added to enhance the randomness of the algorithm.
3.1. Mutualism Strategy
The mutualistic idea is that two organisms in the ecosystem depend on each other for survival [17]. In ROA, the remora depends on the host to obtain food, which is consistent with the mutualistic idea. In order to further strengthen the relationship between the remora and enhance their symbiosis relationship, this paper adds a mutualistic strategy after the remora’s host feeding. The specific formulas of the mutualistic strategy are as follows:
In the above formulas, New1 and New2 are two new positions, which come from the interaction between the remora and the host. Mutual represents a mutualistic factor between the host and the remora. BF1 and BF2 are randomly selected, being either 0 or 1, indicating the degree of influence on the remora or the host. Postrandi is the current random individual’s position.
3.2. Tent Chaotic Mapping
Because ROA adopts the traditional initialization method, the initial population’s randomness and diversity cannot be guaranteed. Unlike traditional initialization methods, tent chaotic mapping [18] is ordered and ergodic. Therefore, using tent chaotic mapping for initialization can significantly preserve the diversity of the population. The mathematical model of tent chaotic mapping is as follows:
When i is 1, y1,j is a random number between 0 and 1. The Formula for initializing the ith search agent through tent chaotic mapping is as follows:
In order to further investigate the advantages of tent chaotic mapping initialization, Figure 2 is the comparison chart of a two-dimensional diagram presenting the traditional initialization method and tent chaotic mapping initialization method. It is not difficult to observe that the initial positions obtained based on tent chaos mapping initialization are more evenly distributed in the search space.
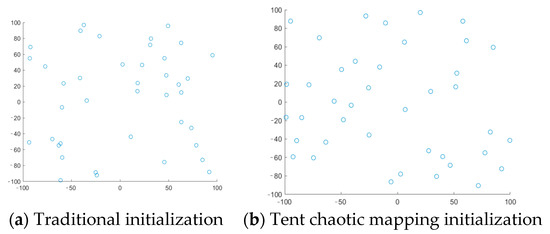
Figure 2.
Two initialization methods’ two-dimensional comparison chart.
3.3. Improved Whale Optimization Algorithm (WOA) Strategy with Roulette Wheel Selection
Roulette wheel selection [19] is a random selection strategy that is widely used in various optimization algorithms. It can increase the randomness of the search agent’s position in movement. In order to further enhance the exploitation capability of the algorithm, this paper uses roulette wheel selection to improve the WOA strategy. The specific Formula is as follows:
where θ is the angle selected by the roulette selection method; adding the angle θ can make the search agent obtain a random direction. While approaching the optimal value, it avoids falling into the local optimum to some extent.
3.4. The proposed IROA
Based on the above methods, this paper proposed IROA. Inspired by the idea of mutualism, we added a mutualistic strategy in the host feeding stage of ROA. At the same time, we replaced the original initialization method with tent chaotic mapping initialization, and improved the WOA strategy with roulette selection. The pseudocode of IROA is shown in Algorithm 2, and the flow chart is shown in Figure 3:
| Algorithm 2: The pseudocode of ROA |
| 1. Initialize parameters (population size: N, total iteration: T, remora factor: C) |
| 2. Initialize the population by using Formula (17) |
| 3. While (t < T) |
| 4. Pull search agents outside the search space back to the boundary |
| 5. Calculate each search agent’s fitness value and update PosBest |
| 6. For i in 1 to N |
| 7. If S(i) == 0 then |
| 8. Update positions by Formula (2) |
| 9. Else if S(i) == 1 |
| 10. Update positions by Formula (18) |
| 11. End if |
| 12. Move a small area around the host by Formula (3) |
| 13. If f(Posiatt) < f(Posit) |
| 14. Switch hosts by Formula (4) and update Posit |
| 15. Else |
| 16. Host feeding by Formulas (9)–(12) |
| 17. Generate two positions (New1 and New2) by Formulas (13)–(15) |
| 18. If f(New1) < f(Posit) |
| 19. Posit = New1 |
| 20. End if |
| 21. If f(New2) < f(Posrandit) |
| 22. Posrandit = New2 |
| 23. End if |
| 24. End if |
| 25. End for |
| 26. t = t + 1 |
| 27. End While |
| 28. Return PosBestt |
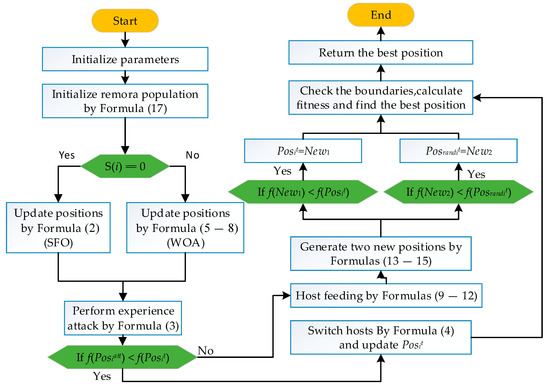
Figure 3.
The flowchart of the IROA.
3.5. The Computational Complexity
To better understand ROA, this section provides the IROA complexity analysis. The initialization complexity is O (N × dim), where N is the population size and dim is the dimension. The complexity of the SFO and WOA strategies is O (N × dim × T). The complexity of the experience attack is O (N × dim × T). The complexity of host feeding and mutualism strategy is uncertain; but the maximum value is O (3 × N × dim × T). Tent chaos mapping initialization and roulette wheel selection do not increase the algorithm’s computational complexity. To sum up, the maximum computational complexity of ROA is O (3 × N × dim × (T + 1)), and the maximum complexity of IROA is O (5 × N × dim × (T + 1)). Although the computational complexity of IROA is slightly increased, the performance of IROA has been greatly improved, and the mutualism strategy is also probabilistic. In practice, the actual complexity difference between ROA and IROA will be smaller.
4. Experimental Results and Discussion
This section selects the CEC2020 and 23 standard benchmark functions to test the optimization effect of IROA and selects the remora optimization algorithm (ROA) [14], arithmetic optimization algorithm (AOA) [24], whale optimization algorithm (WOA) [9], chimp optimization algorithm (ChOA) [25], bald eagle search (BES) [26], sand cat swarm optimization (SCSO) [27], and single cosine algorithm (SCA) [28] for comparative experiments. The parameter design of these algorithms is shown in Table 1.

Table 1.
Parameter design of each algorithm.
All the experiments in this paper were completed on a computer equipped with the 11th Gen Intel(R) Core(TM) i7-11700 processor having the primary frequency of 2.50 GHz, 16 GB memory, and the operating system of 64-bit Windows 11 using matlab2021a.
4.1. Experiments on 23 Standard Benchmark Functions
The 23 standard benchmark functions comprise 7 unimodal, 6 multimodal, and 10 fixed-dimension multimodal functions. See Table 2 for details. Where Function is the mathematical function, dim is the dimension, Range is the interval of the search space, and Fmin is the optimal value the corresponding function can achieve.

Table 2.
Specific description of 23 standard benchmark functions.
4.1.1. Result of the Statistical Analysis of 23 Standard Benchmark Functions
Table 3 shows the statistical data obtained by 8 algorithms running 30 times in 23 standard benchmark functions, where min represents the best fitness value, mean represents the average fitness value, and std represents the standard deviation. In F1, the IROA, ROA, and BES algorithms all obtain theoretical optimum values, which have strong convergence ability. In F2, the result of IROA in 30 dimensions is slightly lower than that of AOA. However, in 500 dimensions, IROA is superior to other comparison algorithms, which shows that IROA has a good optimization effect in high dimensions. The results of IROA in F3 and F4 are better than other comparison algorithms. In F5, IROA can obtain the better min and mean, but the std is larger. In F6, IROA achieves remarkable results, and the statistical value obtained is superior to the comparison algorithm. AOA achieves good results in F7, which proves that the algorithm has good optimization ability in F7. ROA obtains the best min at F8, but IROA obtains a better mean and std, which indicates that IROA can obtain better fitness value more stably. In F9-F11, many algorithms obtain theoretical optimal values, and the IROA, ROA, and SCSO algorithms obtain theoretical optimal values in these functions. The AOA and BES algorithms also achieve good results. In the fixed-dimension multimedia benchmark functions, IROA obtains significant results, showing good optimization effects in these functions. Compared with ROA, IROA has a better optimization effect.

Table 3.
Statistical results of 23 standard reference functions.
4.1.2. Convergence Curve Analysis of 23 Standard Benchmark Functions
The statistical results of 8 algorithms are analyzed above. To more clearly show the convergence effect of each algorithm, Figure 4, Figure 5, Figure 6 and Figure 7 show the convergence curves of each algorithm in 23 standard benchmark functions. In F1–F4, IROA has a very significant convergence ability. ChOA, WOA, and SCA have insufficient convergence ability and cannot find a better fitness value. In F5–F7, IROA can obtain more detailed results. Other algorithms cannot converge better, resulting in poor fitness values obtained by the algorithm. In multimodal benchmark functions, IROA is more global. IROA in F12 and F13 can jump out of the local optimum and obtain better fitness values. In F9–F11, IROA also has a strong convergence effect. Each algorithm can obtain a better fitness value in fixed-dimension multimedia benchmark functions, but IROA can also obtain better results and find a better solution in the early stage.
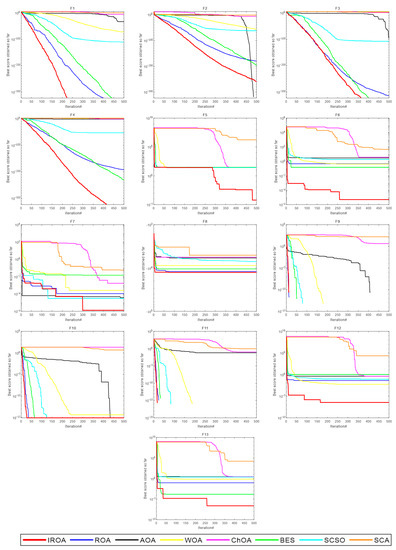
Figure 4.
Convergence curves of each algorithm for standard benchmark functions (F1–F13) at dim = 30.
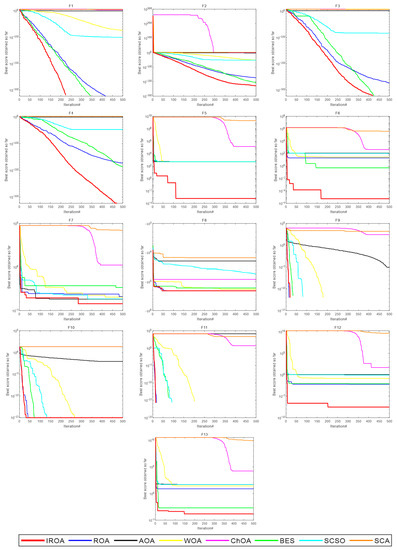
Figure 5.
Convergence curves of each algorithm for standard benchmark functions (F1–F13) at dim = 500.
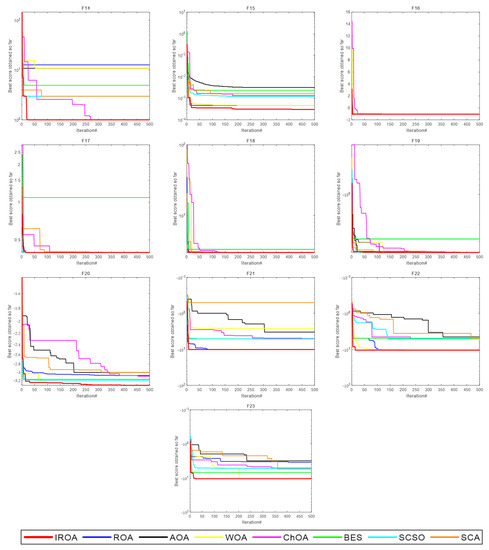
Figure 6.
Convergence curves of each algorithm for standard benchmark functions (F14–F23).
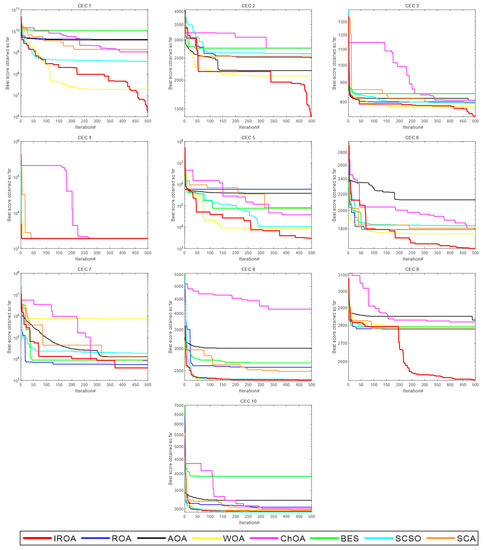
Figure 7.
This is a figure. Schemes follow the same formatting.
4.1.3. Analysis of Wilcoxon Rank Sum Test Results
Wilcoxon rank sum test is a nonparametric statistical test that can detect each optimization algorithm’s similarity. Table 4 shows the experimental results obtained after 30 runs of IROA and seven optimization algorithms. Among them, the significance level is 5%, and a value less than 5% indicates a significant difference between the two algorithms. In Table 4, most results are less than 5%. Among them, the optimization effects of IROA and ROA are significantly different, and only F1 and F9–F11 have high similarities. Because of these, IROA and ROA can find the theoretical optimal value, resulting in a high similarity between the optimization effects of the two algorithms. In F9–F11, because many algorithms can find the theoretical optimal value, many results are 1. Among other functions, only BES has a high similarity between F1 and F3, but as a whole, IROA obtains good results in the Wilcoxon rank sum test, most of which are less than 5%.

Table 4.
Experimental results of Wilcoxon rank sum test on 23 standard benchmark functions.
Combining the above analysis, it is proven that IROA has a good optimization effect in 23 standard benchmark functions.
4.2. Experiments on CEC2020 Benchmark Function
To verify the optimization effect of IROA in complex functions, in the experiment in this section, set the population size N = 30, the number of iterations T = 500, and the population dimension dim = 10. This summary uses IEEE Evolutionary Computation 2020 (CEC2020) to further verify the optimization effect of IROA. CEC2020 is shown in Table 5.

Table 5.
Details of CEC2020 benchmark functions.
4.2.1. CEC2020 Benchmark Function Results in Statistics Analysis
IROA has achieved good results in most functions. Table 6 shows the statistical results obtained by IROA and seven comparison algorithms running independently for 30 times, where min represents the best fitness, mean represents average fitness, and std represents standard deviation. In CEC1, the min of the SCSO algorithm is less than that of IROA, but the mean and std of IROA are both minimized. IROA among CEC2, CEC3, CEC6, and CEC9, IROA has only std deficiency and achieves the best results in min and mean. Among CEC4, CEC5, CEC7, CEC8, and CEC10, IROA achieves the best results in min, mean, and std. It can be concluded that IROA is greatly improved compared with ROA.

Table 6.
Statistical results of 23 standard reference functions.
4.2.2. Analysis of CEC2020 Benchmark Function Convergence Curve
Figure 7 shows the convergence curve of eight algorithms in the CEC2020 benchmark function. In CEC1 and CEC2, IROA can converge quickly and obtain better fitness values. In CEC3 and CEC9, other comparison algorithms are trapped in the local optimum, which leads to the algorithm’s inability to converge. However, IROA can jump out of the local optimum and find a better fitness value in the late iteration. The eight algorithms can obtain the theoretical optimal solution in CEC4. In CEC4, CEC5, and CEC6, IROA shows a ladder convergence and is superior to other comparison algorithms. In CEC8 and CEC10, IROA, WOA, and SCSO algorithms achieve good results and are superior to other algorithms.
4.2.3. Analysis of Box Plot Results
A box chart is a statistical chart that uses five statistics in data—minimum, upper quartile, median, lower quartile, and maximum—to describe data. The box chart’s top and bottom line segments represent the data’s maximum and minimum values, respectively. The upper and lower segments of the box chart represent the third quartile and the first quartile, respectively. The thick line in the middle of the box chart represents the median of the data. It can intuitively display the abnormal value of data, the dispersion degree of distribution, and the symmetry of data. In Figure 8, "+" indicates abnormal value. The boxplot obtained by IROA is obviously superior to other comparison algorithms. In CEC1, the box graph of IROA is significantly lower than other algorithms and very narrow. It shows that the fitness value obtained by IROA is less than that of other algorithms, and the standard deviation is less than that of other algorithms. In CEC2, CEC3, and CEC6, although the width of the IROA box graph is close to other algorithms, the box graph is obviously lower than other algorithms. It shows that IROA can find a better solution with the same error. From the box graph of CEC4, it can be seen that the eight algorithms can obtain very relative fitness values in CEC4, so the box graphs obtained by each algorithm are consistent. In CEC5, CEC7, and CEC8, the box graph of IROA is very narrow, which shows that IROA can obtain better fitness values in these functions. The box chart of IROA in CEC9 is wide, indicating that the standard variance of IROA in this function is large. However, this box chart is obviously lower than other comparison algorithms, which proves that IROA can find a better fitness value, but the standard variance is large. In CEC10, the box graph of IROA is close to that of WOA but superior to other comparison algorithms.
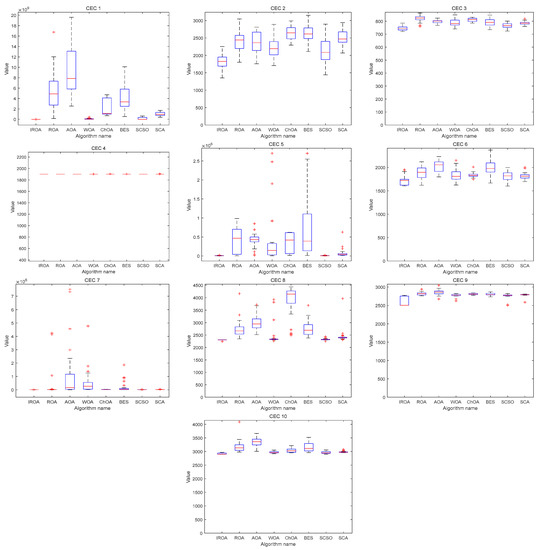
Figure 8.
Box diagram of eight algorithms in CEC2020 benchmark function.
4.2.4. Analysis of Wilcoxon Rank Sum Test Results
Table 7 shows the statistical results of IROA and seven comparison algorithms in the Wilcoxon rank sum test. It can be seen that most of the obtained results are less than 5%, which is at a significant difference level. However, many results in CEC4 are more significant than 5%. Because the function of CEC4 is relatively simple, many algorithms can obtain a better fitness value, resulting in the final results being very close. Among other functions, only in CEC5 are the IROA and SCSO algorithms greater than 5%. It is less than 5% in other functions.

Table 7.
Wilcoxon rank sum test results of each algorithm in CEC2020 benchmark function.
Through the above experimental analysis, it is fully proven that IROA has an excellent optimization effect.
5. Constrained Engineering Design Problems
To verify the optimization effectiveness of IROA in engineering problems, this section selects six engineering problems to verify the engineering practicability of IROA. The details are as follows.
5.1. Pressure Vessel Design Problem
The pressure vessel design problem is selected to minimize the total cost of the pressure vessel. The problem has four variables: shell thickness (Ts), head thickness (Th), inner diameter (R), and vessel length (L). The optimization design is constrained by the material, forming, and shaping of the cylindrical container. Figure 9 is a schematic diagram of pressure vessel design.
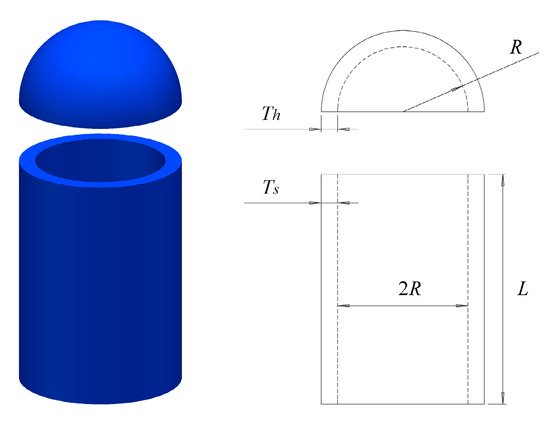
Figure 9.
Schematic diagram of pressure vessel design.
Consider:
Objective function:
Subject to:
Variable range:
It can be seen from Table 8 that the shell thickness Ts = 0.746312767, head thickness Th = 0.370321575, inner diameter R = 40.35880379, and vessel length L = 199.4947161 are obtained by IROA. The final total cost is 5738.193409. Compared with other comparison algorithms, IROA has a better optimization effect.

Table 8.
Experimental results of pressure vessel design.
5.2. Welded Beam Design Problem
There are four variables in the design of welded beams: weld width h, connecting beam length l, beam height t, and connecting beam thickness b. This problem is selected to minimize the cost of welded beams under four decision variables and seven constraints, as shown in Figure 10.
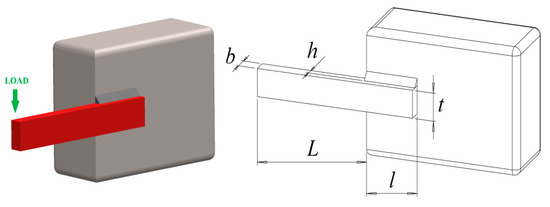
Figure 10.
Schematic diagram of welded beam design.
Consider:
Objective function:
Subject to:
where:
Boundaries:
Table 9 shows that the minimum cost of IROA is 1.6989155. Most of the other algorithms are greater than 1.7. The cost of MROA is 1.699058, slightly greater than IROA. According to the experiment, IROA has good optimization ability in the design of welded beams.

Table 9.
Experimental results of welded beam design.
5.3. Speed Reducer Design Problem
The reducer design problem has seven variables: tooth surface width x1, gear module x2, number of teeth on the pinion x3, length of the first shaft between bearings x4, length of the second shaft between bearings x5, diameter of the first shaft x6, and diameter of the second shaft x7. The variable diagram is shown in Figure 11. The goal of the reducer design problem is to find the minimum weight of the reducer by satisfying four design constraints. The four design constraints are bending stress of gear teeth, covering stress, lateral deflection of shaft, and stress in the shaft.
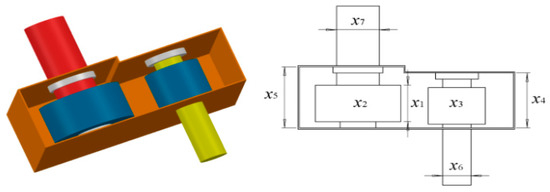
Figure 11.
Schematic diagram of speed reducer design.
Consider:
Objective function:
Subject to:
Boundaries:
IROA obtains the minimum weight of 2995.92942 in Table 10, which is also improved compared with the latest algorithms, AOA and RSA. It is proven that IROA has a good optimization effect in reducer design.

Table 10.
Experimental results of speed reducer design problem.
5.4. Tension/Compression Spring Design Problem
The tension/pressure spring design problem’s purpose is to reduce the spring’s weight under four constraints. Constraints include minimum deviation (g1), shear stress (g2), impact frequency (g3), outer diameter limit (g4), and corresponding decision variables include wire diameter d, average coil diameter D, and appropriate coil number N. See Figure 12 for details.
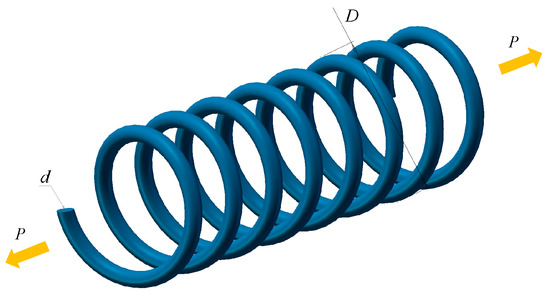
Figure 12.
Schematic diagram of tension/compression spring design.
Consider:
Minimize:
Subject to:
Variable range:
The results of the tension/compression spring design problem are shown in Table 11. IROA obtains the wire diameter d = 0.05, the average coil diameter D = 0.374368742, and the appropriate number of coils N = 8.55137154. The minimum weight of 0.009875259 is finally obtained. The weight of other algorithms is greater than IROA. It can be concluded that IROA has good engineering practicability on this issue.

Table 11.
Experimental results of tension/compression spring design.
5.5. Three-Bar Truss Design Problem
The purpose of the three-bar truss design problem is to reduce the weight of the structure under the action of the total support load P. Figure 13 shows the geometry of the problem, where the cross-sectional area represents the design variables. Due to the system’s symmetry, the cross sections of A1 (=x1) and A2 (=x2) must be determined.
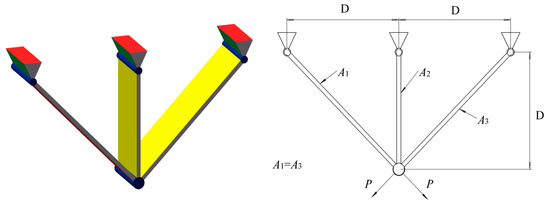
Figure 13.
Schematic diagram of three-bar truss design.
Consider:
Minimize:
Subject to:
Variable range:
Table 12 shows the statistical results of the three-bar truss design. It can be seen that the weight difference obtained by each algorithm is small. This problem further tests the accuracy of the algorithm. IROA obtains a minimum weight of 263.8523651. It is proven that IROA has a more accurate optimization ability in this problem.

Table 12.
Experimental results of three-bar truss design.
5.6. Car Crashworthiness Design Problem
Figure 14 shows the model of the car crashworthiness design problem. The problem has 10 constraints and 11 decision variables. The 10 constraints include the upper viscosity criterion, middle viscosity criterion, lower viscosity criterion, abdominal load, pubic joint force, upper rib deflection, middle rib deflection, lower rib deflection, B-pillar midpoint velocity, and B-pillar front door velocity. The 11 decision variables include the interior material of the B-pillar, the thickness of the B-pillar reinforcement, the interior thickness of the B-pillar, the thickness of the beam, the interior thickness of the floor, the thickness of the door beam, the interior material of the floor, the width of the door safety belt line reinforcement, the thickness of the roof rail, the impact position of the obstacle, and the height of the obstacle. The conditions of this engineering problem are referred to in [29].
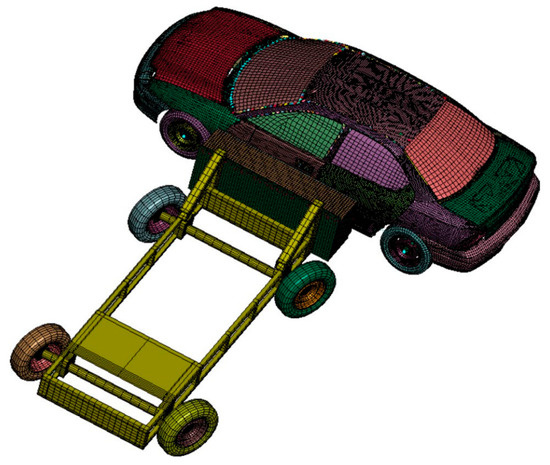
Figure 14.
Schematic diagram of car crashworthiness design.
Minimize:
Subject to:
Variable range:
Table 13 shows the statistical results of the car crashworthiness design problem. IROA obtains a minimum weight of 23.19501639. It is close to MPA, ROLGWO, and MALO. However, due to WOA and HHOCM, in general, IROA also has good results in this issue.

Table 13.
Experimental results of car crashworthiness design.
6. Conclusions
This paper proposed an improved remora optimization algorithm with a mutualistic strategy. The overall performance of traditional ROA was enhanced by introducing the mutualistic strategy. Then, a tent chaotic mapping strategy was added to make the distribution of each individual more uniform. To enhance the mobility of the algorithm, each individual chose the direction of food searching through roulette wheel selection. In order to verify the optimization effect of IROA, 23 standard benchmark functions and CEC2020 benchmark functions were tested in this paper. The experimental results illustrate that IROA had a good optimization effect. Then, IROA was applied to six engineering problems. The results also showed that IROA had an improved optimization ability in solving engineering problems. In future work, IROA will be used for solving more complex optimization problems, such as 3D path planning of UAVs, feature selection, scheduling in cloud computing, image segmentation, intrusion detection, and so on.
Author Contributions
Conceptualization, S.W. and H.R.; methodology, S.W.; software, H.J., H.R. and C.W.; validation, S.W. and H.R.; formal analysis, D.W., H.R., and C.W.; investigation, S.W., and H.R; resources, Q.L. and S.W.; data curation, H.R. and C.W.; writing—original draft preparation, S.W. and H.J.; writing—review and editing, H.J. and L.A.; visualization, C.W. and H.J.; supervision, H.J. and H.R.; funding acquisition, S.W. and D.W. All authors have read and agreed to the published version of the manuscript.
Funding
This work was funded by Harbin Normal University Doctoral Research Initiation Fund Project (XKB2020014), National Education Science Planning Key Topics of the Ministry of Education—”Research on the core quality of applied undergraduate teachers in the intelligent age” (DIA220374).
Data Availability Statement
Not applicable.
Acknowledgments
The authors would like to thank the anonymous reviewers for helping us improve this paper’s quality.
Conflicts of Interest
The authors declare no conflict of interest.
References
- Osher, S.; Wang, B.; Yin, P.; Luo, X.; Barekat, F.; Pham, M.; Lin, A. Laplacian smoothing gradient descent. Res. Math. Sci. 2022, 9, 1–26. [Google Scholar] [CrossRef]
- Rajabpour, E.; Fathi, M.R.; Torabi, M. Analysis of factors affecting the implementation of green human resource management using a hybrid fuzzy AHP and type-2 fuzzy DEMATEL approach. Environ. Sci. Pollut. Res. 2022, 29, 48720–48735. [Google Scholar] [CrossRef] [PubMed]
- Nasrollahi, M.; Fathi, M.R.; Hassani, N.S. Eco-innovation and cleaner production as sustainable competitive advantage antecedents: The mediating role of green performance. Int. J. Bus. Innov. Res. 2020, 22, 388–407. [Google Scholar] [CrossRef]
- Phung, M.D.; Ha, Q.P. Safety-enhanced UAV path planning with spherical vector-based particle swarm optimization. Appl. Soft Comput. 2021, 107, 107376. [Google Scholar] [CrossRef]
- Mirjalili, S.; Mirjalili, S.M.; Hatamlou, A. Multi-verse optimizer: A nature-inspired algorithm for global optimization. Neural Comput. Appl. 2015, 27, 495–513. [Google Scholar] [CrossRef]
- Kirkpatrick, S.; Gelatt, C.D.; Vecchi, M.P. Optimization by Simulated Annealing. Science 1983, 220, 671–680. [Google Scholar] [CrossRef]
- Nematollahi, A.F.; Rahiminejad, A.; Vahidi, B. A novel meta-heuristic optimization method based on golden ratio in nature. Soft Comput. 2020, 24, 1117–1151. [Google Scholar] [CrossRef]
- Alatas, B. ACROA: Artificial chemical reaction optimization algorithm for global optimization. Expert Syst. Appl. 2011, 38, 13170–13180. [Google Scholar] [CrossRef]
- Mirjalili, S.; Lewis, A. The whale optimization algorithm. Adv. Eng. Softw. 2016, 95, 51–67. [Google Scholar] [CrossRef]
- Li, S.; Chen, H.; Wangm, M.; Heidari, A.A.; Mirjalili, S. Slime mould algorithm: A new method for stochastic optimization. Future Gener. Comput. Syst. 2020, 111, 300–323. [Google Scholar] [CrossRef]
- Laith, A.; Dalia, Y.; Mohamed, A.E.; Ahmed, A.E.; Mohammed, A.A.A.; Amir, H.G. Aquila Optimizer: A novel meta-heuristic optimization algorithm. Comput. Ind. Eng. 2021, 157, 107250. [Google Scholar]
- Rao, R.V.; Savsani, V.J.; Vakharia, D.P. Teaching–learning-based optimization: A novel method for constrained mechanical design optimization problems. Comput. Aided Design. 2011, 43, 303–315. [Google Scholar] [CrossRef]
- Zong, W.G.; Kim, J.H.; Loganathan, G.V. A new heuristic optimization algorithm: Harmony search. Simulation 2001, 76, 60–68. [Google Scholar] [CrossRef]
- Jia, H.; Peng, X.; Lang, C. Remora optimization algorithm. Expert Syst. Appl. 2021, 185, 115665. [Google Scholar] [CrossRef]
- Shadravan, S.; Naji, H.R.; Bardsiri, V.K. The Sailfish Optimizer: A novel nature-inspired metaheuristic algorithm for solving constrained engineering optimization problems. Eng. Appl. Artif. Intel. 2019, 80, 20–34. [Google Scholar] [CrossRef]
- Wolpert, D.H.; Macready, W.G. No free lunch theorems for optimization. IEEE Trans. Evol. Comput. 1997, 1, 67–82. [Google Scholar] [CrossRef]
- Zheng, R.; Jia, H.; Abualigah, L.; Wang, S.; Wu, D. An improved remora optimization algorithm with autonomous foraging mechanism for global optimization problems. Math. Biosci. Eng. 2022, 19, 3994–4037. [Google Scholar] [CrossRef]
- Wen, C.; Jia, H.; Wu, D.; Rao, H.; Li, S.; Liu, Q.; Abualigah, L. Modified Remora Optimization Algorithm with Multistrategies for Global Optimization Problem. Mathematics 2022, 10, 3604. [Google Scholar] [CrossRef]
- Wang, S.; Hussien, A.G.; Jia, H.; Abualigah, L.; Zheng, R. Enhanced Remora Optimization Algorithm for Solving Constrained Engineering Optimization Problems. Mathematics 2022, 10, 1696. [Google Scholar] [CrossRef]
- Liu, Q.; Li, N.; Jia, H.; Qi, Q.; Abualigah, L. Modified Remora Optimization Algorithm for Global Optimization and Multilevel Thresholding Image Segmentation. Mathematics 2022, 10, 1014. [Google Scholar] [CrossRef]
- Cheng, M.Y.; Prayogo, D. Symbiotic organisms search: A new metaheuristic optimization algorithm. Comput. Struct. 2014, 139, 98–112. [Google Scholar] [CrossRef]
- Li, C.; Luo, G.; Qin, K.; Li, C. An image encryption scheme based on chaotic tent map. Nonlinear Dynam. 2017, 87, 127–133. [Google Scholar] [CrossRef]
- Wu, D.; Rao, H.; Wen, C.; Jia, H.; Liu, Q.; Abualigah, L. Modified Sand Cat Swarm Optimization Algorithm for Solving Constrained Engineering Optimization Problems. Mathematics 2022, 10, 4350. [Google Scholar] [CrossRef]
- Abualigah, L.; Diabat, A.; Mirjalili, S.; Elaziz, M.A.; Gandomi, A.H. The Arithmetic Optimization Algorithm. Comput. Methods Appl. Mech. Eng. 2021, 376, 113609. [Google Scholar] [CrossRef]
- Khishe, M.; Mosavi, M.R. Chimp optimization algorithm. Expert Syst. Appl. 2020, 149, 113338. [Google Scholar] [CrossRef]
- Alsattar, H.A.; Zaidan, A.A.; Zaidan, B.B. Novel meta-heuristic bald eagle search optimisation algorithm. Artif. Intel. Rev. 2020, 53, 2237–2264. [Google Scholar] [CrossRef]
- Seyyedabbasi, A.; Kiani, F. Sand Cat swarm optimization: A nature-inspired algorithm to solve global optimization problems. Eng. Comput. 2022, 1–25. [Google Scholar] [CrossRef]
- Mirjalili, S. SCA: A Sine Cosine Algorithm for Solving Optimization Problems. Knowl. Based Syst. 2016, 96, 120–133. [Google Scholar] [CrossRef]
- Rao, H.; Jia, H.; Wu, D.; Wen, C.; Liu, Q.; Abualigah, L. A Modified Group Teaching Optimization Algorithm for Solving Constrained Engineering Optimization Problems. Mathematics 2022, 10, 3765. [Google Scholar] [CrossRef]
- Gandomi, A.H.; Yang, X.; Alavi, A.H.; Talatahari, S. Bat algorithm for constrained optimization tasks. Neural Comput. Appl. 2013, 22, 1239–1255. [Google Scholar] [CrossRef]
- Mirjalili, S.; Mirjalili, S.M.; Lewis, A. Grey wolf optimizer. Adv. Eng. Softw. 2014, 69, 46–61. [Google Scholar] [CrossRef]
- Gandomi, A.H.; Yang, X.S.; Alavi, A.H. Cuckoo search algorithm: A metaheuristic approach to solve structural optimization problems. Eng. Comput. 2013, 29, 17–35. [Google Scholar] [CrossRef]
- Dorigo, M.; Birattari, M.; Stutzle, T. Ant colony optimization. IEEE Comput. Intel. Mag. 2006, 1, 28–39. [Google Scholar] [CrossRef]
- Hussien, A.G.; Amin, M.; Abd El Aziz, M. A comprehensive review of moth-flame optimisation: Variants, hybrids, and applications. J. Exp. Theor. Artif. Intell. 2020, 32, 705–725. [Google Scholar] [CrossRef]
- Rashedi, E.; Nezamabadi-Pour, H.S. GSA: A Gravitational Search Algorithm. Inform. Sci. 2009, 179, 2232–2248. [Google Scholar] [CrossRef]
- Kaveh, A.; Khayatazad, M. A new meta-heuristic method: Ray optimization. Comput. Struct. 2012, 112, 283–294. [Google Scholar] [CrossRef]
- Abualigah, L.; Elaziz, M.A.; Sumari, P.; Zong, W.G.; Gandomi, A.H. Reptile search algorithm (RSA): A nature-inspired meta-heuristic optimizer. Expert Syst. Appl. 2021, 191, 116158. [Google Scholar] [CrossRef]
- Hussien, A.G. An enhanced opposition-based salp swarm algorithm for global optimization and engineering problems. J. Ambient. Intell. Humaniz. Comput. 2022, 13, 129–150. [Google Scholar] [CrossRef]
- Beyer, H.G.; Schwefel, H.P. Evolution strategies–A comprehensive introduction. Nat.Comput. 2002, 1, 3–52. [Google Scholar] [CrossRef]
- Holland, J.H. Genetic algorithms. Sci. Am. 1992, 267, 66–73. [Google Scholar] [CrossRef]
- Heidari, A.A.; Mirjalili, S.; Faris, H.; Aljarah, I.; Mafarja, M.; Chen, H. Harris hawks optimization: Algorithm and applications. Future. Gener. Comput. Syst. 2019, 97, 849–872. [Google Scholar] [CrossRef]
- Sadollah, A.; Bahreininejad, A.; Eskandar, H.; Hamdi, M. Mine blast algorithm: A new population based algorithm for solving constrained engineering optimization problems. Appl. Soft. Comput. 2013, 13, 2592–2612. [Google Scholar] [CrossRef]
- Min, Z.; Luo, W.; Wang, X. Differential evolution with dynamic stochastic selection for constrained optimization. Inf. Sci. 2008, 178, 3043–3074. [Google Scholar]
- Saremi, S.; Mirjalili, S.; Lewis, A. Grasshopper Optimisation Algorithm: Theory and application. Adv. Eng. Softw. 2017, 105, 30–47. [Google Scholar] [CrossRef]
- Faramarzi, A.; Heidarinejad, M.; Mirjalili, S.; Gandomi, A.H. Marine predators algorithm: A nature-inspired metaheuristic. Expert Syst. Appl. 2020, 152, 113377. [Google Scholar] [CrossRef]
- Wang, S.; Sun, K.; Zhang, W.; Jia, H. Multilevel thresholding using a modified ant lion optimizer with opposition-based learning for color image segmentation. Math. Biosci. Eng 2021, 18, 3092–3143. [Google Scholar] [CrossRef] [PubMed]
- Houssein, E.H.; Neggaz, N.; Hosney, M.E.; Mohamed, W.M.; Hassaballah, M. Enhanced Harris hawks optimization with genetic operators for selection chemical descriptors and compounds activities. Neural. Comput. Appl. 2021, 33, 13601–13618. [Google Scholar] [CrossRef]
- Long, W.; Jiao, J.; Liang, X.; Cai, S.; Xu, M. A random opposition-based learning grey wolf optimizer. IEEE Access 2019, 7, 113810–113825. [Google Scholar] [CrossRef]
Publisher’s Note: MDPI stays neutral with regard to jurisdictional claims in published maps and institutional affiliations. |
© 2022 by the authors. Licensee MDPI, Basel, Switzerland. This article is an open access article distributed under the terms and conditions of the Creative Commons Attribution (CC BY) license (https://creativecommons.org/licenses/by/4.0/).