Article

Numerical Investigation of Fracture Morphology Characteristics in Heterogeneous Reservoirs

College of Civil Engineering, Nanjing Tech University, Nanjing 211816, China
*
Author to whom correspondence should be addressed.
Processes 2022, 10(12), 2604; https://doi.org/10.3390/pr10122604
Submission received: 19 October 2022 / Revised: 10 November 2022 / Accepted: 24 November 2022 / Published: 5 December 2022

Abstract

:
Highly heterogeneous glutenite reservoirs with large amounts of gravel and weak interfaces pose a great challenge to predicting the trajectory of hydraulic fractures during the fracturing process. Based on the phase field method, a fully coupled numerical model of hydraulic fracturing is established. This paper is devoted to investigating the variation in the overall expansion pattern of hydraulic fractures in reservoirs considering randomly distributed gravel and weak interfaces. The numerical results demonstrate that the existence of gravel and a weak interface could alter the extending paths of the hydraulic fractures as well as the value of critical bifurcation injection rate. As the fracture energy of the weak interface is large enough, the hydraulic fracture tends to cross the gravel and the weak interface between the rock matrix and the gravel, forming a planar fracture. Deflection and branching of the hydraulic fracture are more likely to occur in reservoirs containing large gravels. The presented results extend the understanding of fractures propagating in heterogeneous reservoirs.

1. Introduction

Hydraulic fracturing technology combined with horizontal wells significantly improves formation permeability and is widely applied in reservoir stimulation [1,2,3,4]. The reservoir is heterogeneous, containing enormous natural weaknesses such as natural fractures [5,6], vugs [7,8], and gravels [9]. The heterogeneity of reservoirs has been confirmed regardless of grain scale [10] and macroscopic scale [11]. Non-uniform distribution of in situ stress induced by reservoir heterogeneity affects the evolution of hydraulic fractures [12]. There are several pieces of evidence that show an irregular fracture trajectory is influenced by the non-uniform distribution of in situ stress [13,14,15]. As hydraulic fractures intersect natural fractures or bedding planes, several intersection modes could be observed, such as penetration, deflection, and branching [16,17]. Therefore, the diversity of natural weak interface materials makes complex fracture geometries more likely to be formed when hydraulic fractures interact with natural weak interfaces. [18]. The ignorance of reservoir heterogeneity in the numerical model has been confirmed to cause huge deviations from actual hydraulic fracture propagation [19].
At present, the non-uniform distribution of in situ stress and the diversity of interfacial strength have a significant effect on the propagation of hydraulic fractures in heterogeneous reservoirs [20]. The effect of the heterogeneity of in situ stress on the bifurcation mechanism of hydraulic fractures has been quantitatively analyzed by scholars using the phase field method [21]. The embedded blocks with different strengths cause the redistribution of reservoir stress, leading to the deflection of hydraulic fractures [22]. The effect of gravel properties on fracture growth is studied by scholars using the damage mechanics method in a glutenite reservoir [23], while the interfaces between gravels and the rock matrix are neglected. Natural fractures play a significant role in the creation of fracture networks [24]. Hydraulic fracture growth depends on the shear slip of natural fractures or bedding planes with different cement strengths, which is documented by both numerical results and tri-axial hydraulic fracturing experiments [25,26]. A study demonstrates that after intersecting hydraulic fractures, failure modes within cemented natural fractures may change from tensile regime to mixed-mode or shear regime in heterogeneous reservoirs [27]. Wan et al. [28] found that the interaction between large-size natural fractures and hydraulic fractures facilitates the formation of complex fracture meshes through laboratory experiments. The propagation trajectories of fractures are changed for the case of the existence of natural fractures during the fracturing process, resulting in multibranch cracks, which enhance the complexity of the fracture network [29,30]. Shale gas is transported into horizontal wells through microporous media during hydraulic fracturing since the shale rock is composed of multi-scale pores [31]. Different fracture mechanisms of hydraulic fractures are obtained in the phase model that takes into account the permeability effect of the porous structure [32]. It is found that the coalescence between hydraulic fractures and natural fractures is affected by stress regimes and fluid leak-off [33]. The influence of stress difference and approaching angle on the interaction between hydraulic fractures and natural fractures in naturally fractured reservoirs is discussed [34]. Hydraulic fractures can propagate asymmetrically and in segments or multiple strands in heterogeneous reservoirs containing bedding planes [35,36]. However, the effect of gravel properties as well as interface strength on fracture morphology are yet to be estimated.
In recent years, there have been some studies on the propagation characteristics of hydraulic fractures in heterogeneous reservoirs [37,38]. Li et al. proposed a numerical method for constructing glutenite heterogeneity by embedding digital image technology (DIP) into a numerically coded rock failure process analysis to study the effect of gravel on hydraulic fracture propagation [39]. Tang et al. established a two-dimensional numerical model based on the discrete element method to study the effects of permeability, gravel strength and stress difference on hydraulic fracture propagation in glutenite reservoirs [40]. In addition, some studies focus on the influence of single heterogeneous particles and discrete heterogeneous particles on the evolution of hydraulic fractures in heterogeneous formations based on the finite–discrete element method [12]. Based on the above studies, it is found that the previous studies neglect the weak interfaces of the gravel. Therefore, this paper considers the weak interface between gravel and the rock matrix, and studies the influence of gravel with a weak interface on the morphology of hydraulic fractures. It was found that hydraulic fractures are more likely to deflect and bifurcate in the reservoirs where weak interfaces were considered, and at the same time, the fluid pressure within the fractures was reduced. This provides guidance on hydraulic fracturing design in practical engineering.
Many numerical models have been developed and used to simulate the fracture propagation, such as the finite element model [41], the extended finite element model [42] and the displacement discontinuity model [43]. The cohesive elements can simulate the propagation of hydraulic fractures in heterogeneous reservoirs, but the propagation direction is limited to predefined paths. The extended finite element model does not require mesh reconstruction and can simulate hydraulic fractures propagating along arbitrary paths on a fixed mesh. However, the convergence of the model is very poor especially for three-dimensional problems. A displacement discontinuity model could simulate crack propagation with high accuracy, but it fails in dealing with the anisotropy and heterogeneity of material. The phase field model [44] used in this paper can simulate anisotropic formations and handle complex intersection behaviors such as hydraulic fracture bifurcation and coalescence.
In this paper, a two-dimensional fluid–solid coupling hydraulic fracturing model based on the phase field method is established in heterogeneous reservoirs considering gravels and weak interfaces between the gravels and the rock matrix. The governing equations for the propagation of multi-fractures are solved by using an implicit staggered scheme. The shape functions used to discretize the displacement and pressure field are linear, since it has been widely used in hydraulic fracture simulations [45,46]. The arbitrary distribution of gravel in the model is generated through a developed code. The accuracy of the presented model is verified by comparing the numerical results with an analytical solution [47]. The propagation of fractures is independent of the mesh. The fluid flow in porous media and nonlinear constitutive models can be modeled by the model. In addition, the presented model can be used for three-dimensional problems without major modifications.

2. Mathematical Model

2.1. Governing Equations in Porous Media

We assume that the rheological property of hydraulic fluid is incompressible Newtonian fluid and that the solid matrix is linear elastic. Biot’s elastic theory is used to introduce the deformation of saturated porous media under quasi-static loading [48,49].
The mechanical equilibrium equation for a saturated medium is
σ + b = 0
where b is defined as the body force on the domain, and σ is defined as the total stress expressed as
σ = σ e f f α p 1
where α , σ e f f and p are Biot’s effective stress coefficient, Biot’s effective stress as well as pore fluid pressure, respectively, and 1 = [ 1   1   0 ] T under two-dimensional conditions. The linear elastic constitutive equation is written as
σ e f f = D ε
Note that D is the linear elastic constitutive matrix. Under the plane strain assumption, it is written as
D = E ν ( 1 + ν ) ( 1 2 ν ) [ 1 ν ν 0 ν 1 ν 0 0 0 ( 1 2 ν ) / 2 ]
where ν is Poisson’s ratio, and E is Young’s modulus.

2.2. Phase Field Simulation for Fracture

The phase field method approximates displacement discontinuities in materials by means of a continuous scalar function. A sharp fracture is smeared by the phase field in the whole domain which can greatly facilitate the tracking of complex fracture trajectories [50]. The phase field ϕ ( x , t ) [ 0 , 1 ] represents cracks and the conditions are listed as follows
ϕ = { 0 ,   if   material   is   intact 1 ,   if   material   is   cracked
The article by Miehe et al. [51] unfolds in more detail. The one-dimensional phase field is given in an exponential form
ϕ ( x ) = e | x | / l 0
Note that l 0 is the length scale which determines the transition zone between the intact material and the fracture.
For the problems in two and three dimensions, the crack surface density function per unit volume is defined as [51].
γ ( ϕ , ϕ ) = ϕ 2 2 l 0 + l 0 2 ϕ x i ϕ x i
Therefore, combined with Equation (7), according to the ideas [52], the fracture energy is given by
Γ G c d S = Ω G c [ ϕ 2 2 l 0 + l 0 2 ϕ x i ϕ x i ] d Ω
The total Cauchy stress over the entire domain by using the phase field is given as
σ i j = σ i j e + g ( ϕ ) σ 0 i j α P f ,   i n   Ω
In the above formula, g ( ϕ ) = ( 1 k ) ( 1 ϕ ) 2 + k is defined as a degenerate function, where k = 10 9 is a stability parameter which avoids numerical singularity when ϕ = 0 or g ( ϕ ) = 1 .
The elastic energy density ψ ε can be used to derive the stress induced by hydraulic fracturing. The strain ε used in the paper does not consider the initial stress field. The anisotropic form of the elastic energy function proposed by Miehe et al. [51] is used. The strain and elastic energy are given as
{ ε = ε + + ε = 1 2 ( u + u T ) ε ± = a = 1 d ε a ± n a n a ψ ε ± ( ε ) = λ 2 t r ( ε ) ± 2 + μ t r ( ε ± 2 )
where ε and ε + are the linear strain tensors of compression and tension, respectively, and ε is the strain tensor. ε a is the principal strain and n a is the direction. λ and μ > 0 are Lame’ constants, ψ ε and ψ ε + refer to the compressive and tensile parts of the parametric elastic energy. Additionally, the operators + and represent max ( , 0 ) and min ( , 0 ) .
The compressive and tensile parts of elastic energy density are written as [53]
ψ ε ( ε ) = g ( ϕ ) ψ ε + ( ε ) + ψ ε ( ε )
According to Equation (11), only the tensile part of the elastic energy is affected by the phase field and the stress tensor is expressed as
σ i j e = ψ ε ε = [ ( 1 k ) ( 1 ϕ ) 2 + k ] [ λ t r ( ε ) + I + 2 μ ε + ] + λ t r ( ε ) I + 2 μ ε
Note that I is the identity tensor.
Combining the modified Cauchy stress (9) and neglecting the body force, the equilibrium equation as well as the boundary conditions for the solid matrix are demonstrated as
σ i j , j = 0
σ i j n j = f t i ,   on   Ω t
In the numerical implementation, the elastic matrix D i j k l is written as
D i j k l = [ D 1111 D 1122 D 1133 D 1112 D 1123 D 11113 D 2211 D 2222 D 2233 D 2212 D 2223 D 2213 D 3311 D 3322 D 3333 D 3312 D 3323 D 3313 D 1211 D 1222 D 1233 D 1212 D 1223 D 1213 D 2311 D 2322 D 2333 D 2312 D 2323 D 2313 D 1311 D 1322 D 1333 D 1312 D 1323 D 1313 ]
With D i j k l = D ¯ i j k l + D ˜ i j k l .
The component D ¯ i j k l is written as
D ¯ i j k l = λ { [ ( 1 k ) ( 1 ϕ ) 2 + k ] H ε ( t r ( ε ) ) + H ε ( t r ( ε ) ) } δ i j δ k l
where H ε Χ is a Heaviside function and when H ε Χ = 1 , Χ > 0 and H ε Χ = 0 , Χ 0 , δ i j and δ k l represent Kroencker deltas.
According to Zhou et al. [53], the component D ¯ i j k l is decomposed into
D ˜ i j k l = 2 μ { [ ( 1 k ) ( 1 ϕ ) 2 + k ] P i j k l + + P i j k l }
With
P i j k l + = a = 1 3 b = 1 3 H ε ( ε a ) δ a b n a i n a j n b k n b l + a = 1 3 b a 3 1 2 ε a + ε b + ε a ε b n a i n b j ( n a k n b l + n b k n a l )
and
P i j k l = a = 1 3 b = 1 3 H ε ( ε a ) δ a b n a i n a j n b k n b l + a = 1 3 b a 3 1 2 ε a ε b ε a ε b n a i n b j ( n a k n b l + n b k n a l )
where n a i is a component of vector n a .

2.3. The Continuity Equation for Flow Field

The fluid domain can be divided into three sub-domains: the fracture domain Ω f ( t ) , transition domain Ω t ( t ) and unbroken domain Ω r ( t ) [54]. The phase field values c 1 and c 2 are used to divide the three domains. ϕ c 1 characterizes the unbroken domain, and c 1 < ϕ < c 2 represents the transition domain, and ϕ c 2 corresponds to the fracture domain. Therefore, the two indicator functions χ f and χ r can be constructed smoothly in the phase field ϕ [52].
χ r ( , ϕ ) = { 1 , ϕ c 1 c 2 ϕ c 2 c 1 c 1 < ϕ < c 2 , 0 , ϕ c 2   χ f ( , ϕ ) = { 0 , ϕ c 1 ϕ c 1 c 2 c 1 c 1 < ϕ < c 2 , 1 , ϕ c 2
In the whole domain, the mass conservation of the flow field expressed by Darcy’s law can be written as [54]
ρ S p t + ( ρ ν ) = q m ρ α χ r ε vol t
Note that ν , ρ , ε vol and S are flow rate, fluid density, volumetric strain and energy storage coefficient, respectively. Where ρ = ρ r χ r + ρ f χ f . In the fracture domain, α = 1 , α = α r χ r + α f χ f , where αr is the Biot coefficient in Ω r . Additionally, ε v o l satisfies the formula ε vol = u .
S is the storage coefficient which can be decomposed into [54].
S = ε P c + ( α ε p ) ( 1 α ) K V r
Note that c , ε p and K V r are the fluid compressibility, porosity, and bulk modulus in Ω r , respectively. In addition, the fluid compressibility on Ω r and Ω f is c r and c f , respectively. We set ε p = 1 in Ω f . Therefore, ε p = ε p r χ r + χ f , where ε p r is defined as the porosity in the reservoir domain.
ν is the Darcy’s velocity which is written as
ν = K μ ( p + ρ g )
Note that μ and K refer to the viscosity and effective permeability of the fluid, respectively. Naturally, K = K r χ r + K f χ f , with K f and K r in Ω f and Ω r , respectively. In addition, μ = μ r χ r + μ f χ f , with μ f and μ r being the fluid viscosity of Ω f and Ω r , respectively. g represents gravity.
Furthermore, the formula for controlling the flow rate on the P side can be expressed as
ρ S p t ρ K μ ( p + p g ) = q m ρ α χ r ε vol t
The presented formula is affected by Neumann and Dirichlet conditions [54].

2.4. Initial Boundary Condition

The initial boundary conditions applied are given by
{ u ( x , 0 ) = u 0 ( x ) x Ω p ( x , 0 ) = p 0 ( x ) x Ω ϕ ( x , 0 ) = ϕ 0 ( x ) x Ω
ϕ 0 = 1 is the initial phase field representing pre-existing cracks in localized regions [55]. In addition, in terms of fluid pressure, Ω D Ω N = results in the boundary conditions of Dirichlet and von Nenmann on Ω D and Ω N being expressed as
p = p D on Ω D × ( 0 , T ] m ρ ν = M N on Ω N × ( 0 , T ]
where p D is the specified pressure on the Dirichlet boundary and the mass flux M N on the Neumann boundary.

3. Model Validation

In order to verify the rationality of the proposed model, a numerical model with a size of 60 m × 30 m and an initial fracture of 1.2 m is established and the injection rate is 0.001 m2/s. Uniform quadrilateral elements are used to discretize the rectangular domain. The displacement component normal to the surface, the pressure at the outer boundary of the rectangular domain as well as the in situ stress are assumed to be 0. The analytical solution proposed by Santillan et al. [47] is selected to validate the proposed model. The parameters in Table 1 are used in the case.
Figure 1 demonstrates that the simulation results match well with the analytic solution besides subtle differences. The difference may be due to the fluid flow in porous media being ignored by the analytical solution.
In this paper, we adopt a toughness-dominated asymptotic solution of the KGD model proposed by Santillan et al. [47] for verification. Analytical solutions of hydraulic fracture have been adopted to verify the numerical models based on the extended finite element method and the displacement discontinuity method [56,57,58]. The minor difference between the analytical results and numerical predictions implies that our numerical model achieves the same order of accuracy with the classical models.

4. Numerical Results and Discussion

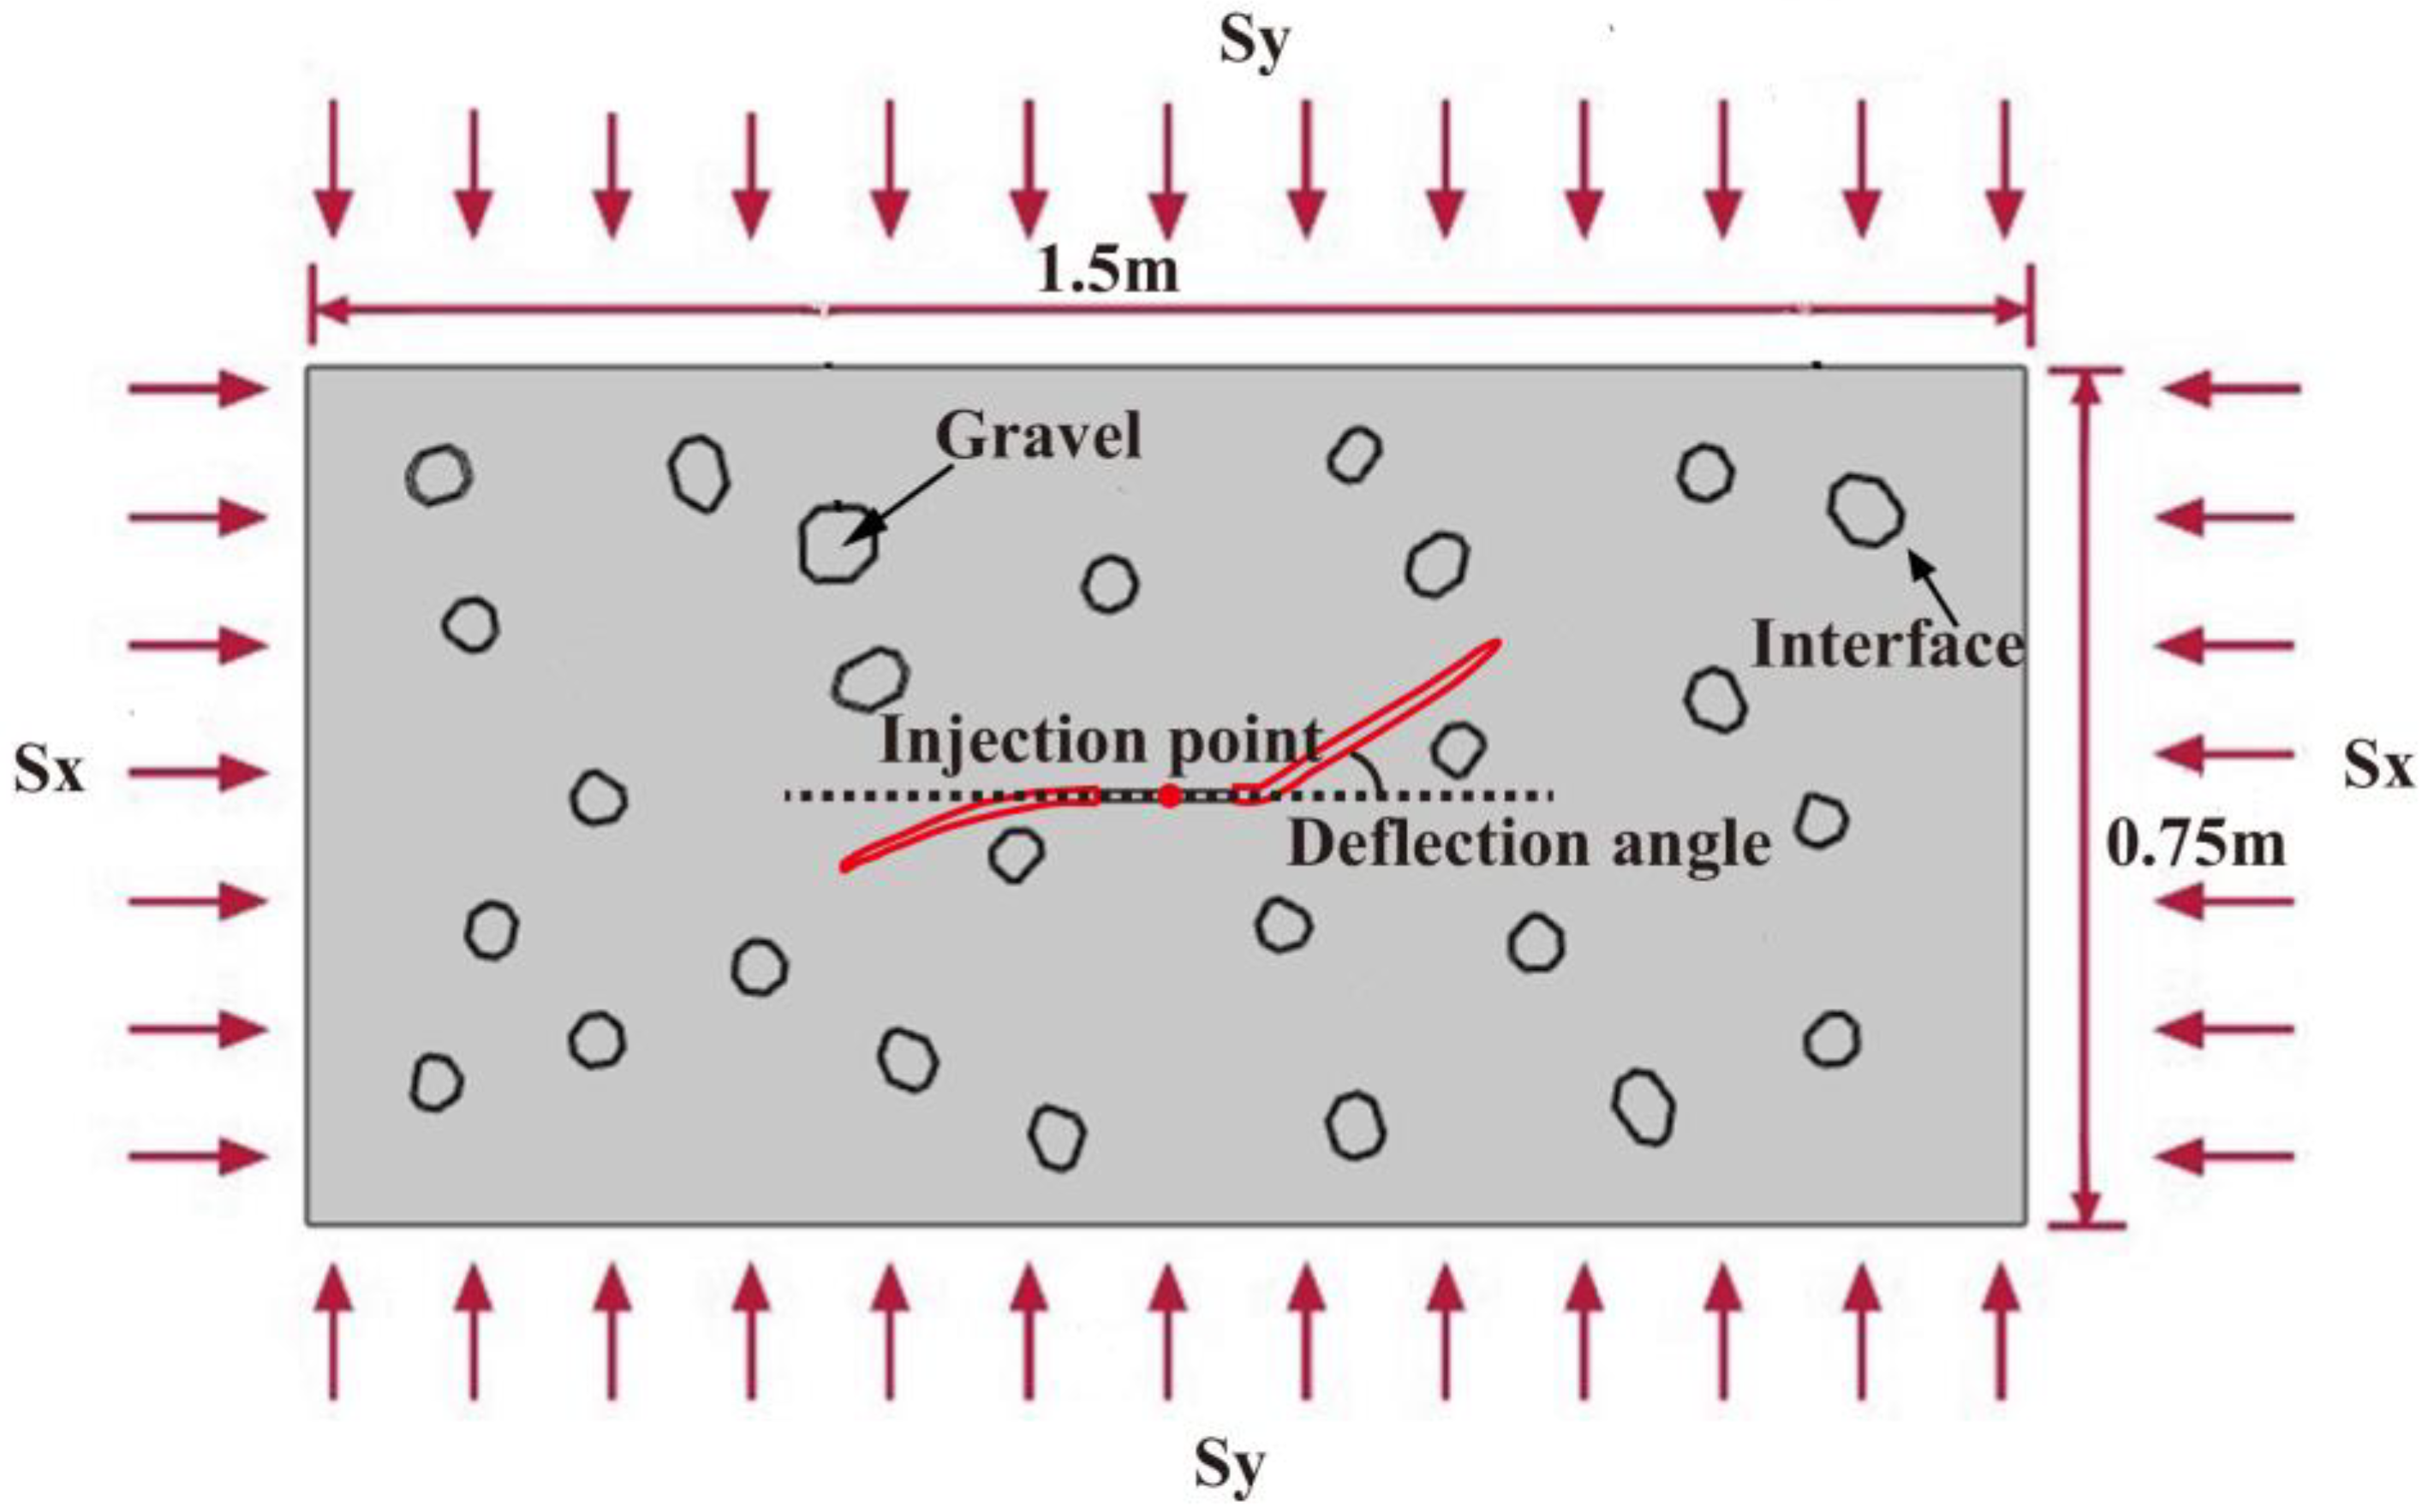
The proposed model was constructed based on the properties of glutenite reservoirs. Glutenite reservoirs are characterized by deep burial, low permeability and low porosity. To investigate the influence of gravel and its weak interface on the trajectory of hydraulic fractures, we established a two-dimensional plane strain model with a size of 1.5 m × 0.75 m, as shown in Figure 2. Randomly distributed irregular gravels are embedded on the simulation domain. Some parameters in the model, such as the gravel size and properties of the rock matrix, are set by referring to the previous literature [23,40]. The characteristic length of gravel ranges from 0.04 m to 0.06 m. An initial crack with a length of 0.12 m is put in the center of the rectangular domain with an injection rate of 0.0002 m2/s. The displacement component normal to the boundary surface and the fluid pressure on the boundary of the domain are both set to 0. The in situ stresses are denoted by Sx and Sy, respectively. In this study, the reservoir parameters listed in Table 2 are used. In addition, the different material properties of the gravels as well as the weak interfaces are shown in Table 3.

4.1. Influence of Gravels on Fracture Deflection

The deflection characteristics of hydraulic fractures under the conditions of different Young’s modulus of the gravel and the vertical distance between the gravel and the initial fracture are studied. As shown in Figure 3, due to the symmetry of the model, only half of the geometry is presented and the gravels are even spaced at the same height. For simplification and without loss generalization, the geometry of the gravel is simplified to a circle. The effect of Young’s modulus of the gravels on hydraulic fracture extension is presented in Figure 3, where E g / E r is defined as the ratio of the Young’s modulus between the gravels and the rock matrix. It is demonstrated that the hydraulic fracture deflects into the gravel zone as the value of the E g / E r is less than 1. As E g / E r is equal to 1, the properties of the formation are homogeneous and isotropic, and then hydraulic fracture extends along the initial direction. When E g / E r is larger than 1, the hydraulic fractures propagate apart from the gravels, and the deflection is accentuated by the further increase in the E g / E r .
The effect of the vertical distance between the center of the gravel and the center of the initial crack ranging from 0.05 m to 0.14 m on hydraulic fracture propagation is studied, where E g / E r is set to 0.67. The simulation results are given in Figure 4. Since the E g / E r is less than 1, hydraulic fractures are attracted by the gravels. As the vertical distance increases, the deflection angle of the hydraulic fracture decreases, showing the decrease in the mechanical interaction between the gravel and the hydraulic fracture.

4.2. Critical Bifurcating Injection Rate

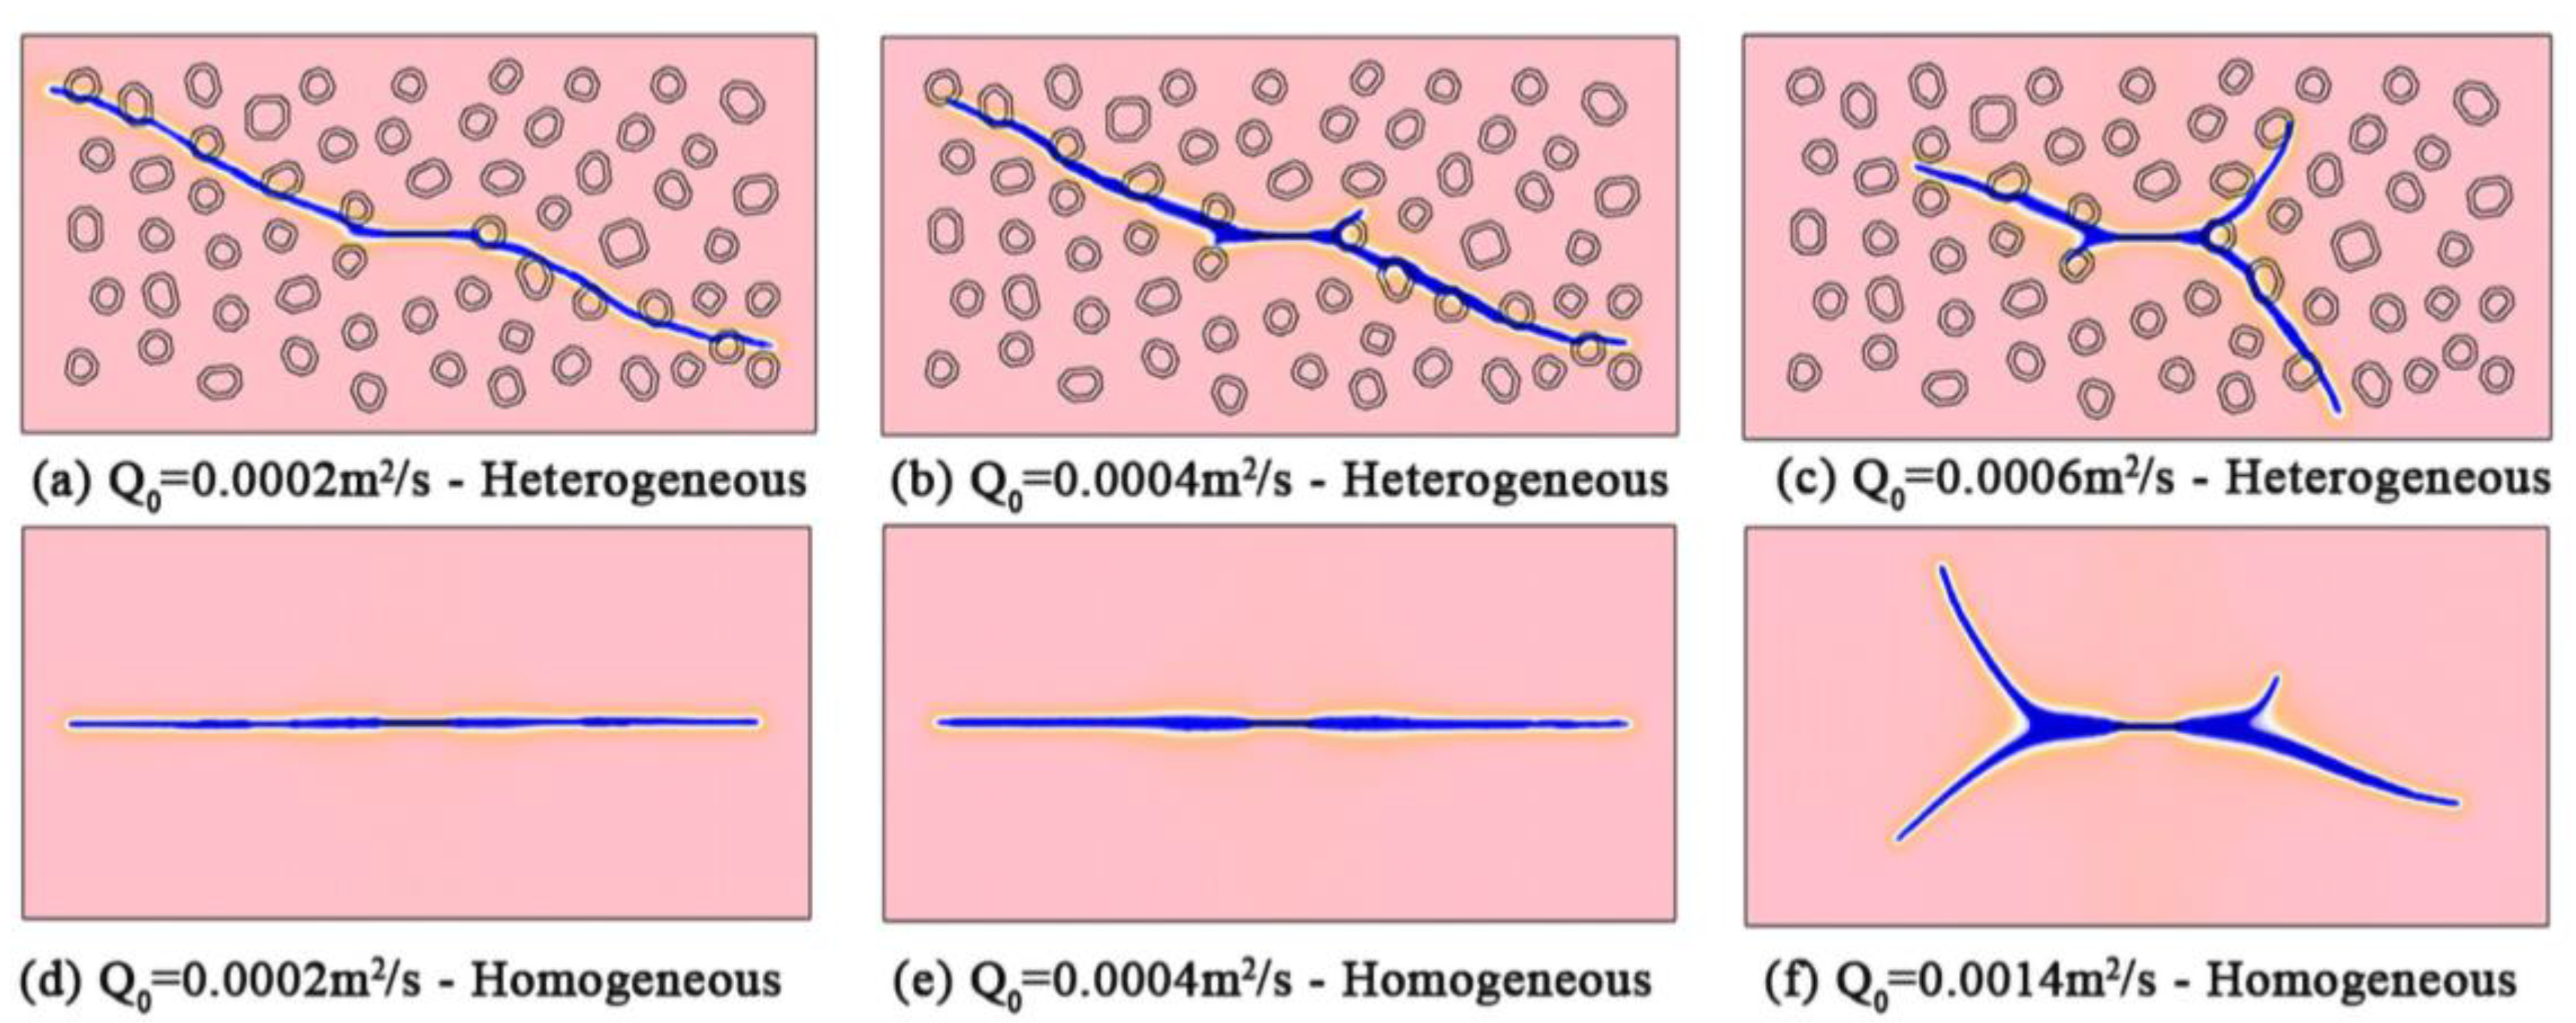
Injection rate is an important controllable parameter during the fracturing process. Hydraulic fractures are likely to bifurcate as the injection rate is large enough, resulting in complex fracture geometries. In this section, we study hydraulic fracture propagation in heterogeneous and homogeneous reservoirs for different injection rates. As shown in Figure 5a,d, the propagation direction of hydraulic fracture in heterogeneous reservoir is altered by randomly distributed gravels as well as weak interfaces in the formation, which will lead to non-uniform distribution of in situ stress. As the injection rate increases continuously, in Figure 5b,e, bifurcation is observed in the heterogeneous formation after the hydraulic fracture intersects the gravels. The length of the branch fractures increases with the injection rate in the heterogeneous formation as shown in Figure 5c. It is noted that a similar branching pattern cannot be observed in a homogeneous media until we increase the injection rate to Q0 = 0.0014 m2/s as shown in Figure 5f, implying the significant contribution of heterogeneity on the bifurcation. Therefore, the heterogeneity of the formation facilitates to decrease the critical bifurcation injection rate.
Hydraulic fracture propagation in a heterogenous formation usually leads to complex trajectories based on cohesive zone method and discrete element method [23,40], which is coincident with our simulation results. Moreover, since we consider the weak interfaces of the gravel in the model, more complex extending paths such as branching as well as intersections with many weak interfaces are observed in the numerical results shown in Figure 5b,c.
The variation in fluid pressure of each fracture with different injection rates is given in Figure 6. The results show that the fluid pressure at the injection point increases with the injection rate in both homogeneous and heterogeneous reservoirs. Moreover, the fluid pressure in the heterogeneous reservoir is lower than that in the homogeneous reservoir due to the hydraulic fracture being arrested by weak interfaces in the heterogeneous reservoir.
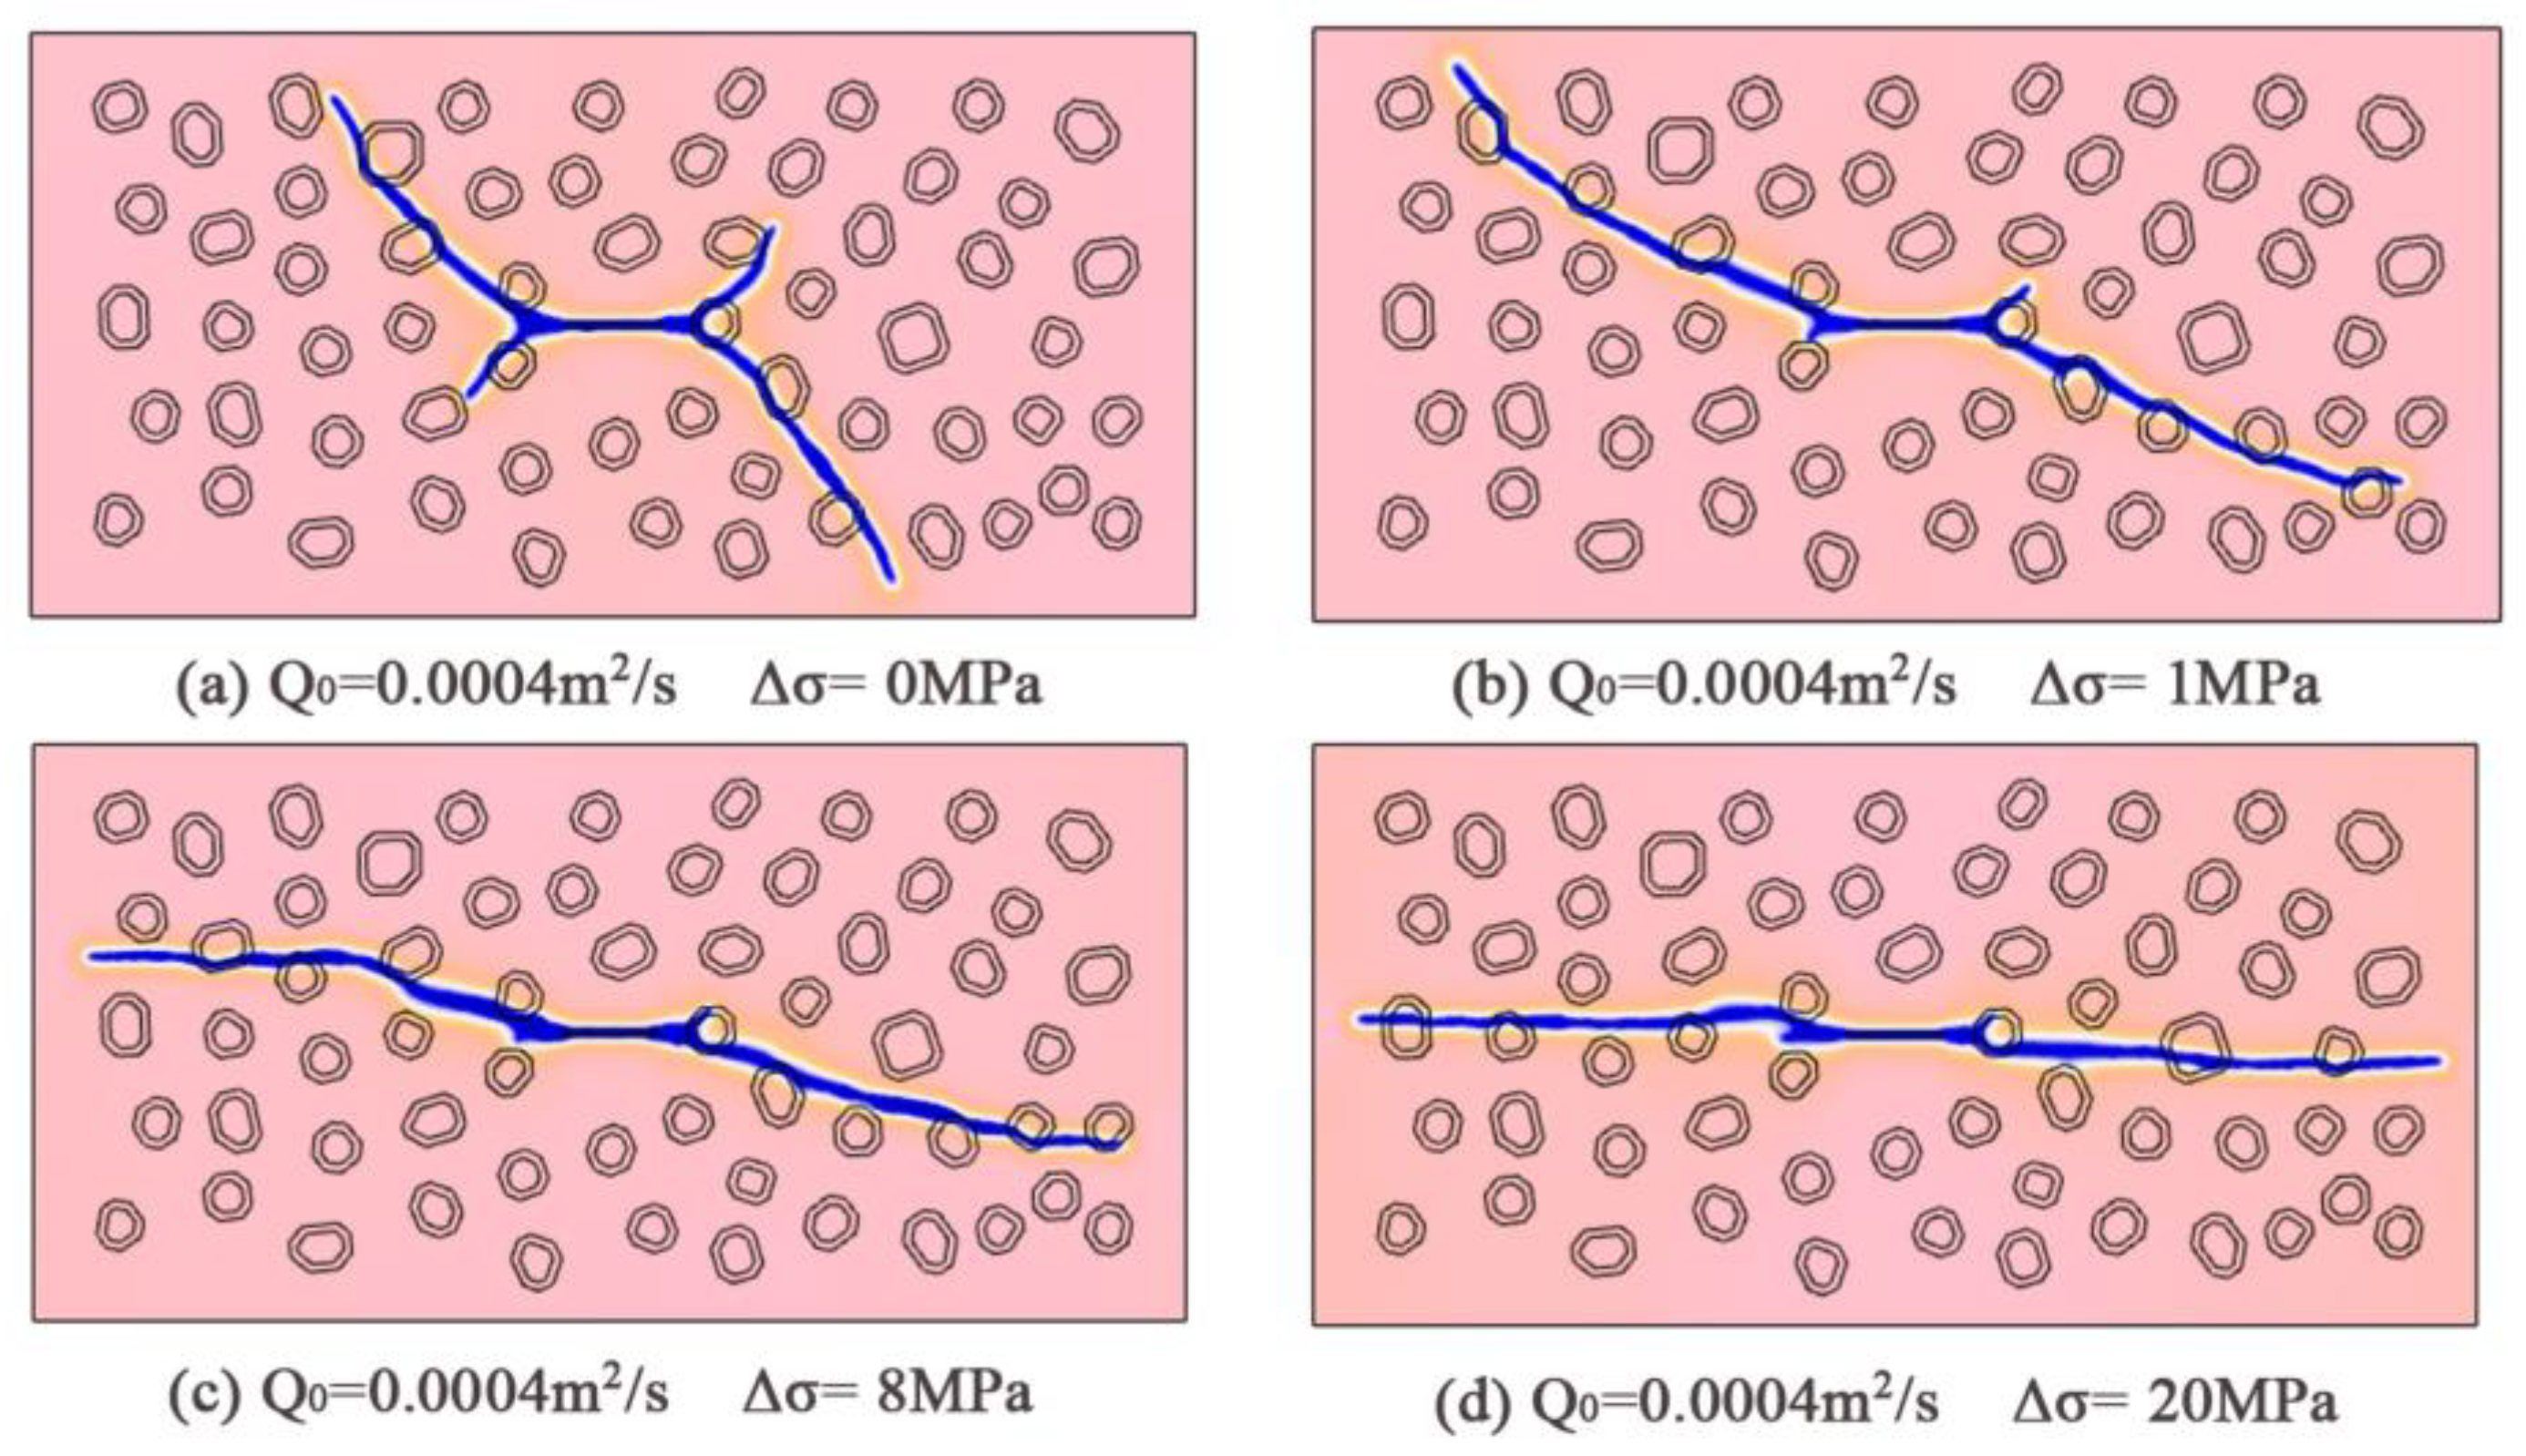
In order to investigate the dependence of the critical bifurcation injection rate on the horizontal stress difference Δσ, a series of numerical simulations for different stress differences, 0 MPa, 1 MPa, 8 MPa and 20 MPa, were carried out, and the results are shown in Figure 7. The other parameters remained the same. It was observed that the bifurcation starts as the stress difference was equal to 1 MPa, and the length of branch fractures increased with the decreasing of stress difference (Figure 7a,b), implying the dependence of the critical bifurcation injection rate on the stress difference. In Figure 7c,d, the deflection of the crack decreases with the stress difference, showing the decrease in the effect of gravel on the propagation of hydraulic fractures.

4.3. Bifurcating due to Fluid Viscosity

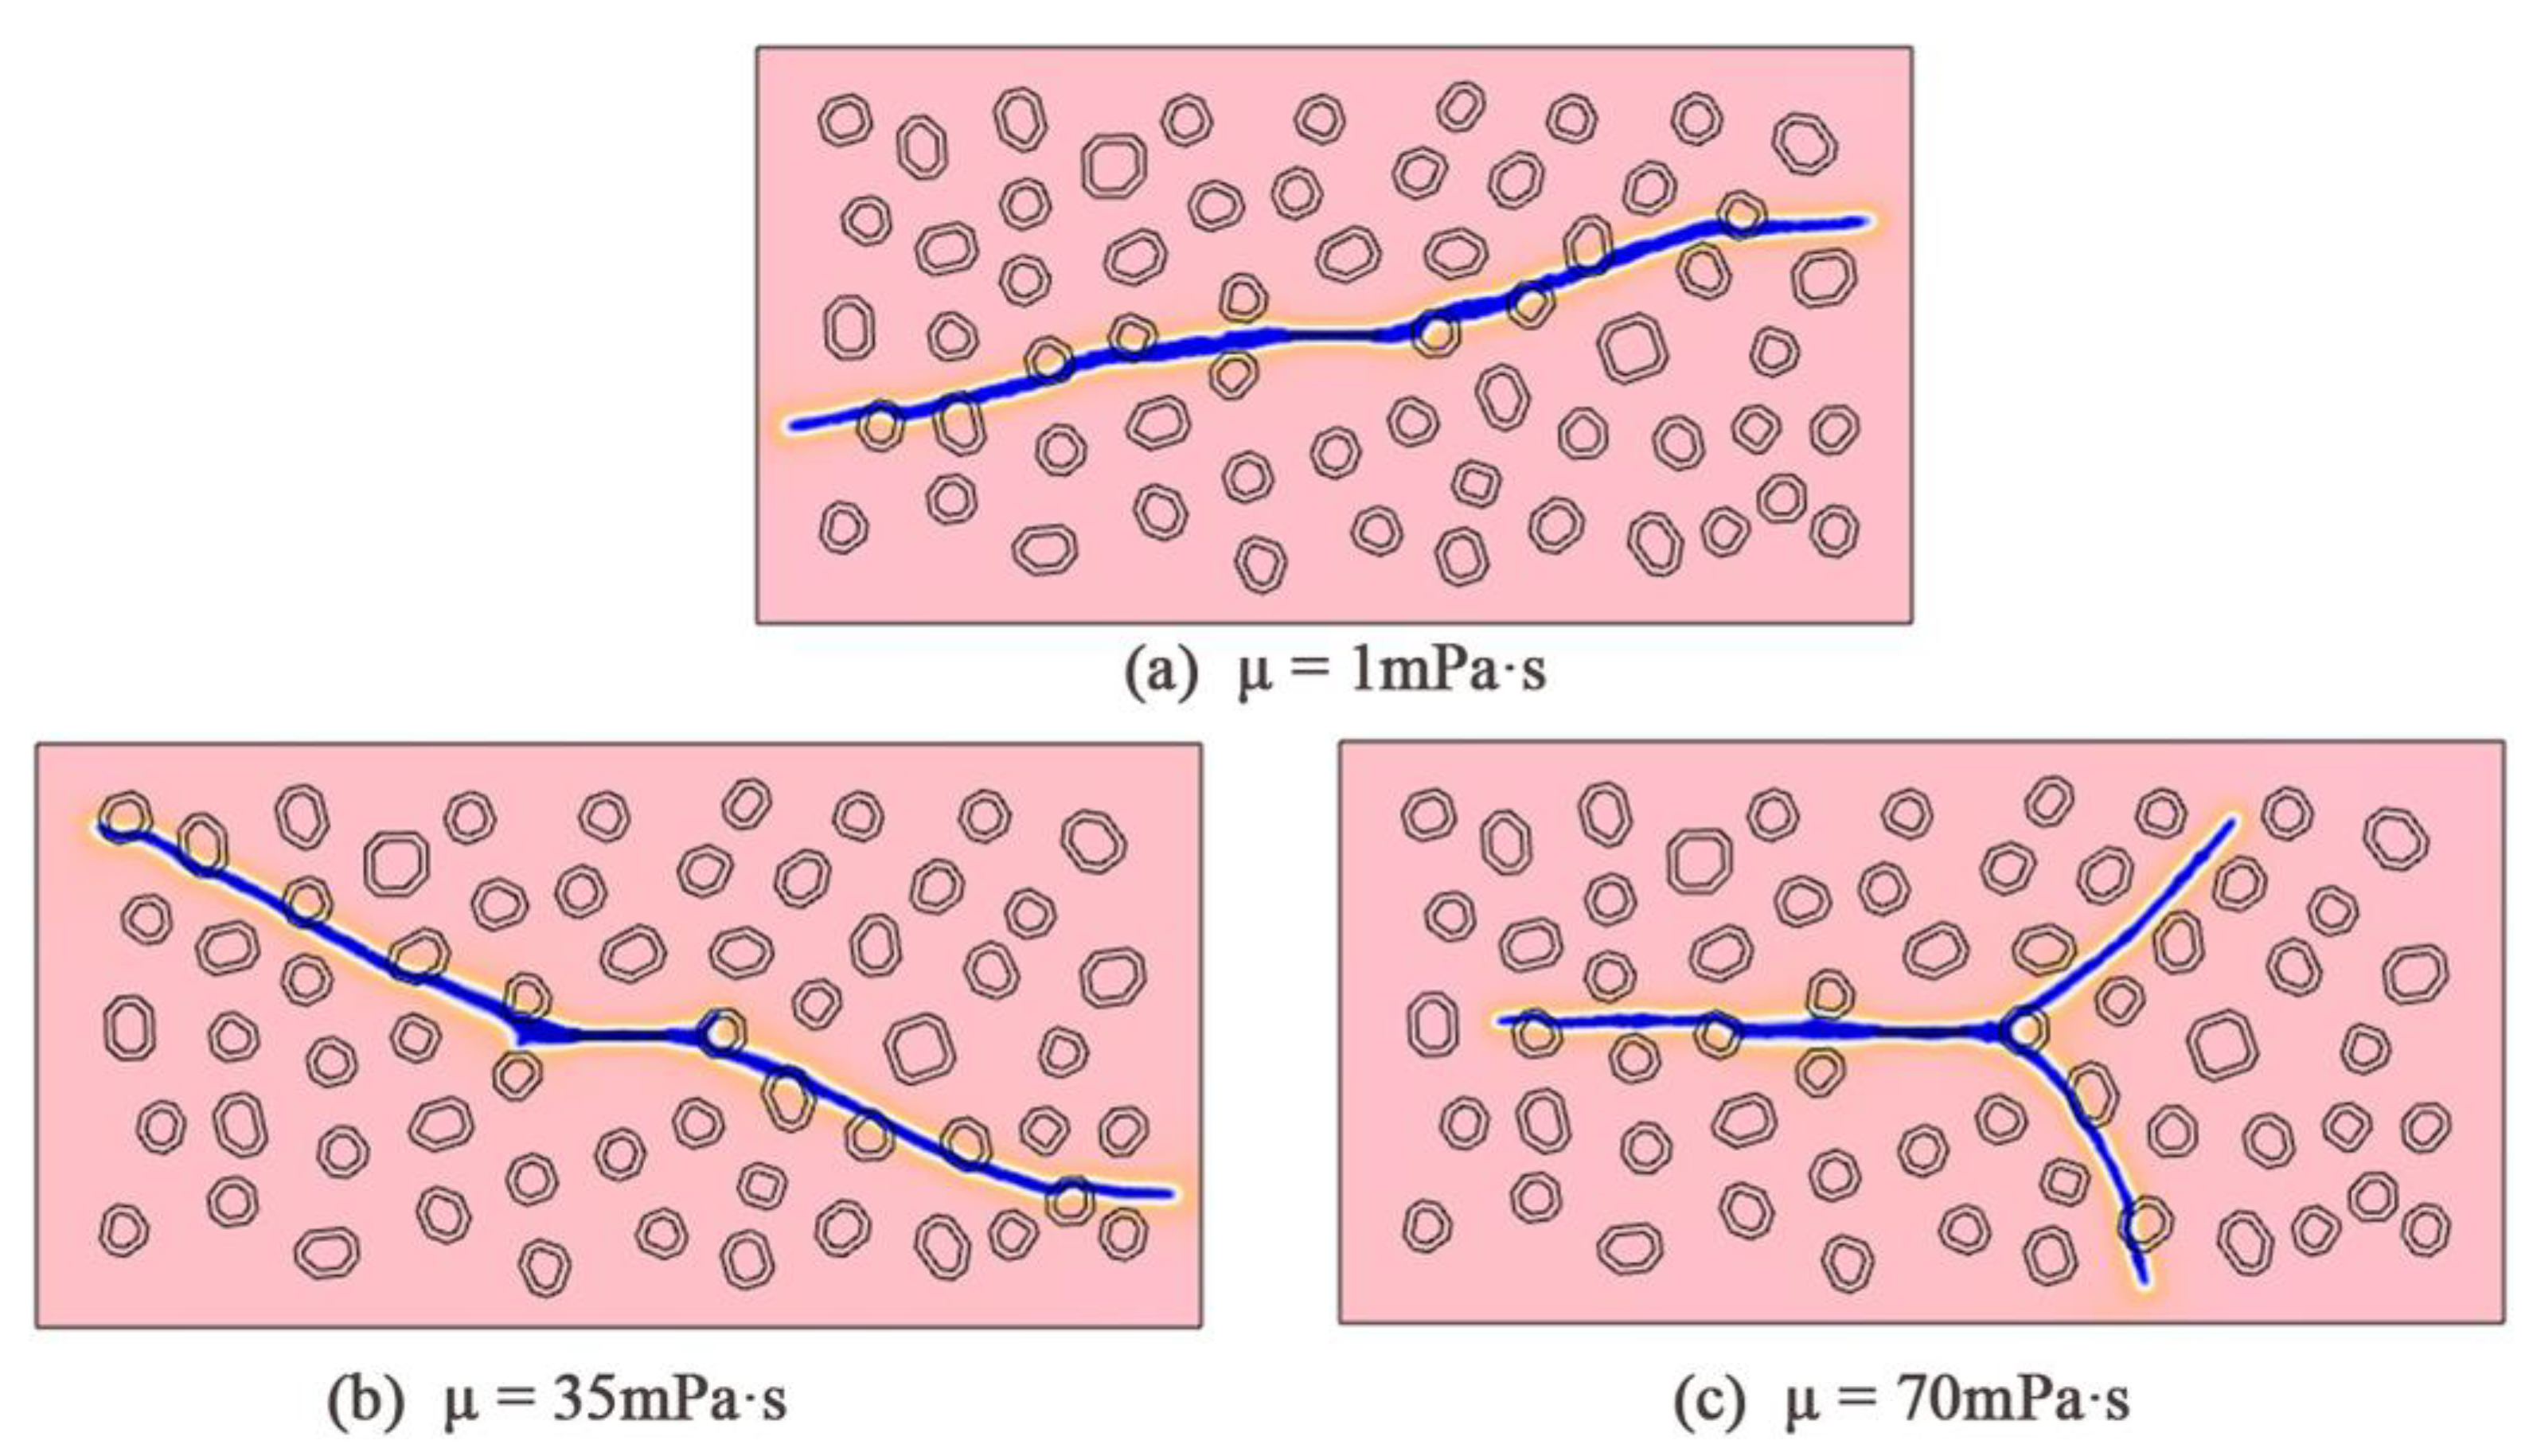
The final morphology of the hydraulic fracture depends on the fracturing fluid viscosity during the fracturing process. As illustrated in Figure 8, three cases with different fracturing fluid viscosities, 1 mPa·s, 35 mPa·s and 70 mPa·s, were chosen to investigate the evolution characteristics of the hydraulic fracture morphology. The fracture energy ratio between the weak interface and the rock matrix in the reservoir is set to 0.5. For the low viscosity of the fracturing fluid shown in Figure 8a, the hydraulic fracture extends obliquely with a small deflection angle. The fluid viscosity continued to increase, 35 mPa·s, resulting in a slight bifurcation of the hydraulic fracture as shown in Figure 8b. As the fluid viscosity reached 70 mPa·s, a significant branch crack was observed (Figure 8c). The results show the significant role of fluid viscosity on branch fractures. It is noted that the branching phenomenon depends on the fracture toughness. The effect of the wide variety of fracture energies of the rock matrix on the branch fractures needs further work.

4.4. Effects of Fracture Energy of Gravels and Interfaces

The mechanical properties of gravels vary widely in different formations. Gravels with low fracture energy provide potential extending paths for the hydraulic fracture. In this section, a wide fracture energy ratio between rock matrix and gravel, G r / G g , ranging from 1.5 to 0.375 is adopted to study the evolution characteristics of hydraulic fracture morphology as shown in Figure 9. The fracture energy of the weak interface, G i , is assumed to be less than G g and G r It is observed that the hydraulic fracture could penetrate the gravel when the ratio G r / G g is equal to 1.5. As we decrease the ratio, the trajectories of the hydraulic fractures are within the space between gravels and the weak interfaces as shown in Figure 9b,c.
As we remove the weak interfaces in the model, the fracture extending paths are presented in Figure 9d. The other parameters are the same as the case in Figure 9c. There is a significant difference for the hydraulic fracture patterns that a single wing fracture is observed in the case of Figure 9d. This is because the gravels enhance the fracture propagation resistance, while the weak interfaces control the hydraulic fractures propagation. The large difference in the fluid pressure in Figure 9e verifies the increased fracture propagation resistance for the case without a weak interface. It is noted that the case without weak interface characterizes the toughness of the interface is large enough that it cannot be reinitiated during the stimulation process. However, the toughness of the interface varies in a wide range in practical engineering. The neglecting of the weak interfaces in previous literatures [9,23] leads to inaccurate predictions of fracture geometries.
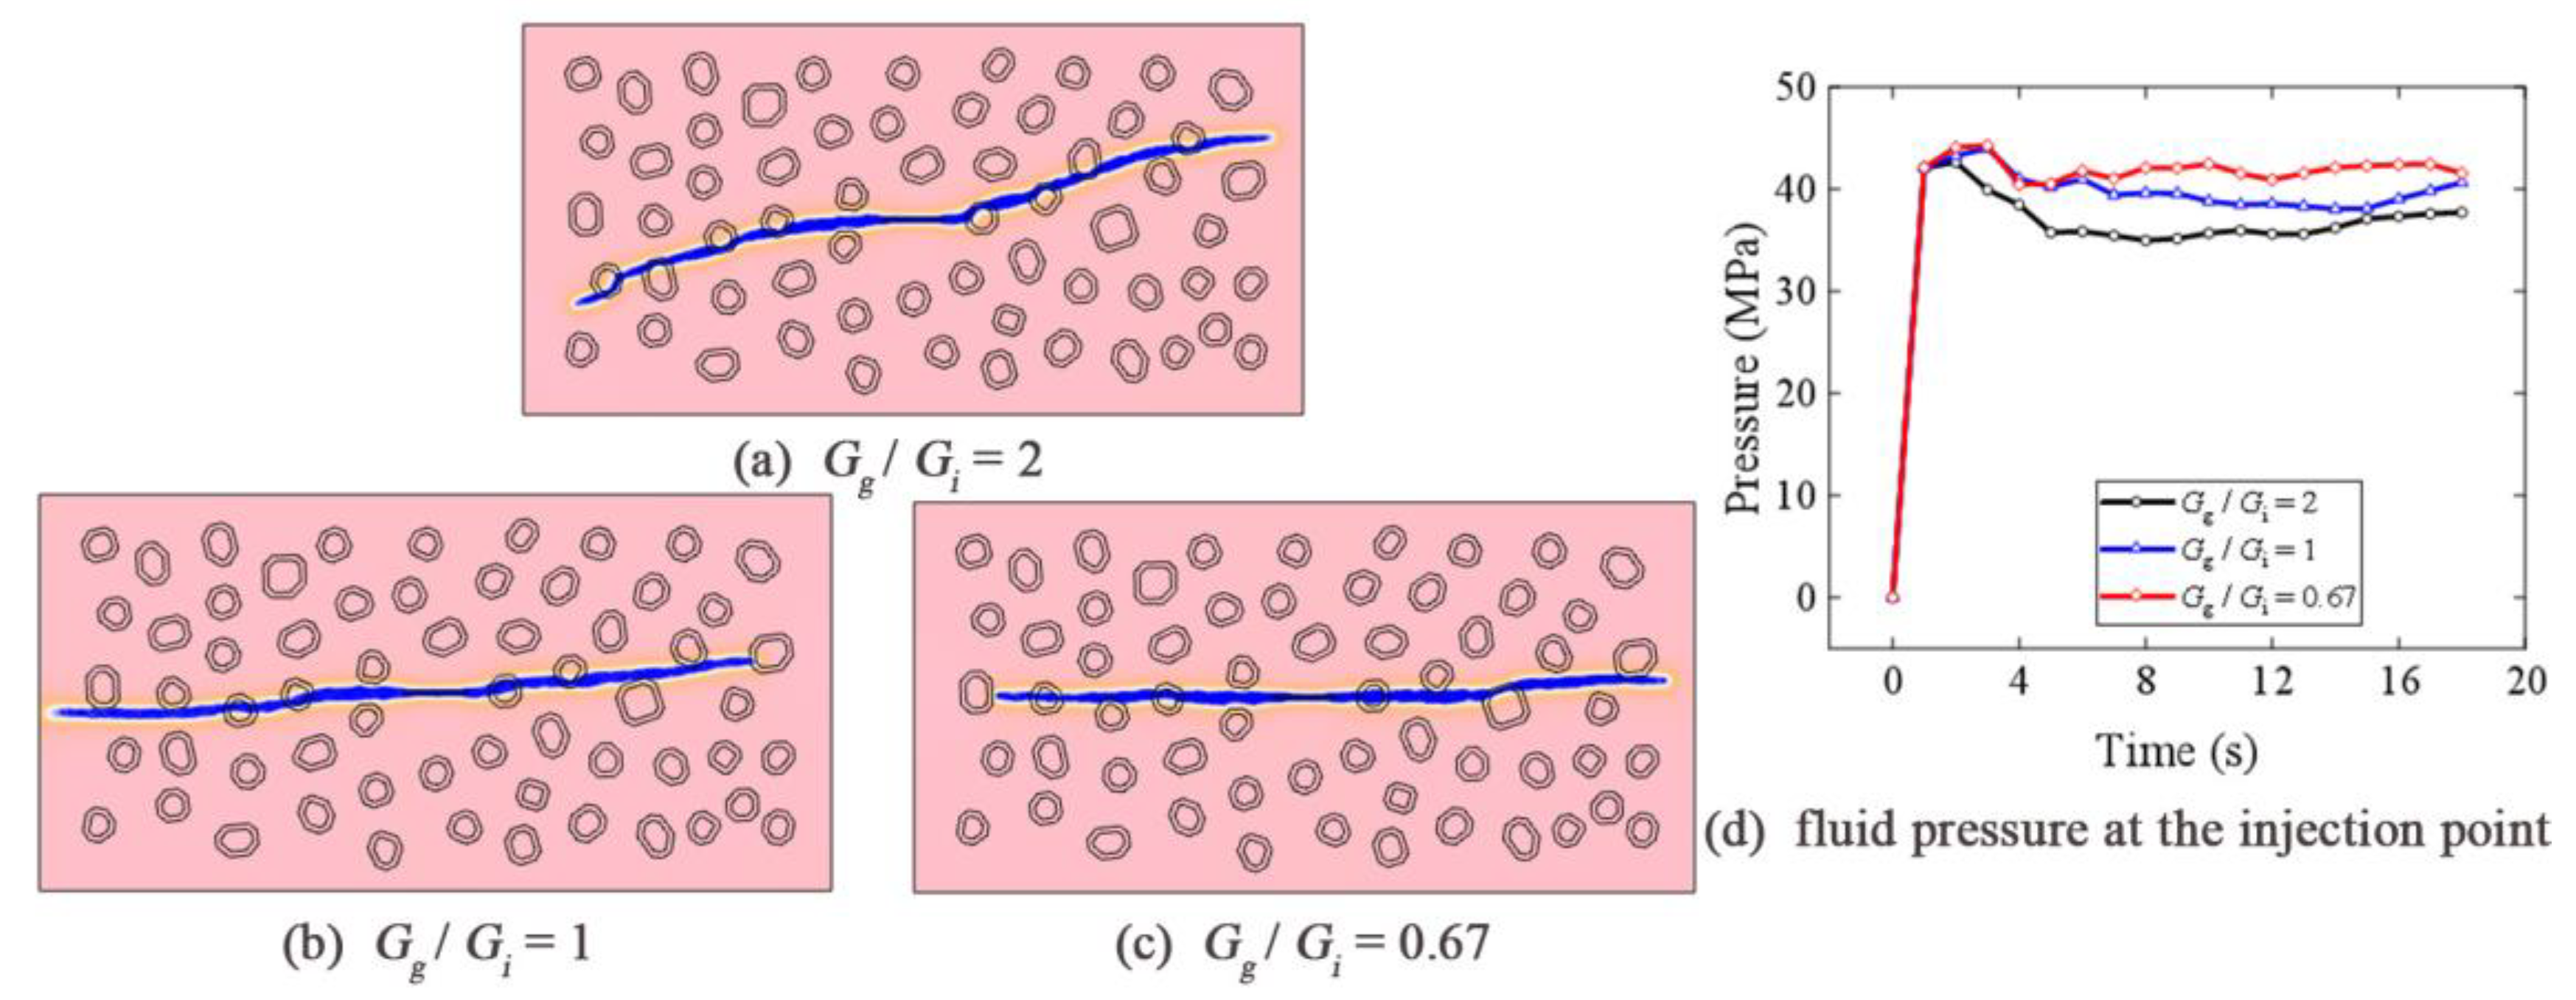
Furthermore, the effect of interfacial fracture energy, G i , on fracture propagation is established in Figure 10. The fracture energy ratio, G g / G i , varies from 2 to 0.67. As shown in Figure 10a, hydraulic fracture mainly extends along the paths with more weak interfaces for a small value of G i . As the G i is greater than G g (Figure 10c), the propagation of hydraulic fractures is controlled by the gravels. Figure 10d shows the variations in the fluid pressure corresponding to each case. It is shown that the fluid pressure at injection point increases with the decreasing of the G g / G i , implying the difference of fracture propagation resistance. When the gravel intersects the hydraulic fracture, the breaking of the gravel mainly depends on the strength of the gravel and the interface, and the simulations in this paper show that the gravel could be split into two separate parts by the hydraulic fracture (the blue line denotes the fracture as shown in Figure 9a and Figure 10c). More complex cases such as the heterogeneity and anisotropy of the gravel are not considered, which needs further work.

4.5. Effects of Rock Permeability

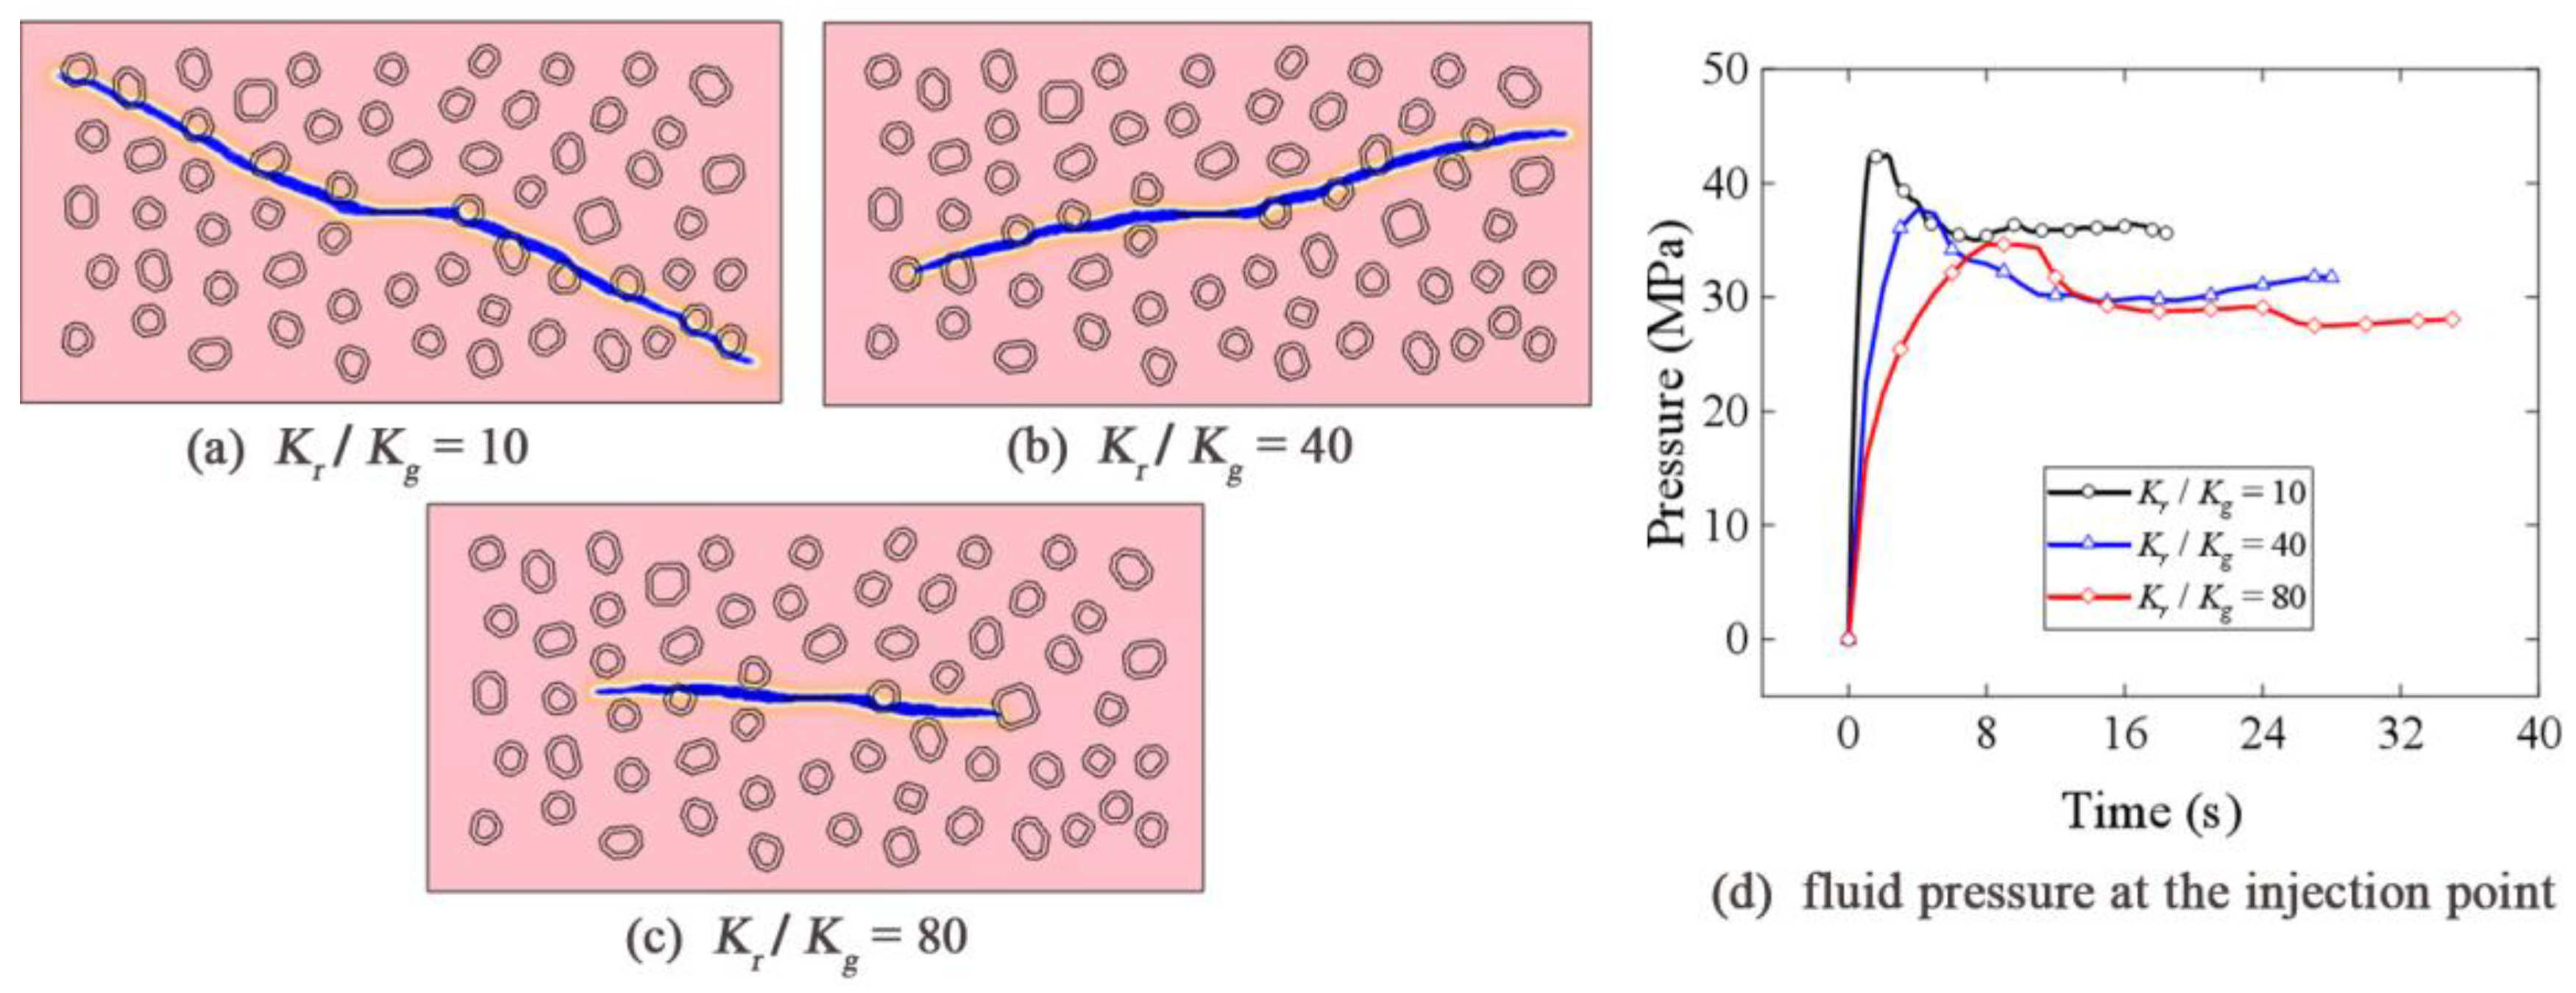
Three cases of permeability ratios, K r / K g ranging from 10 to 80, were conducted to study the effect of gravel permeability on fracture propagation, where K g and K r denote the permeability of the gravel and the rock matrix, respectively. The simulation results are shown in Figure 11. When K r / K g is equal to 10, a significant deflection of the hydraulic fracture is observed in Figure 11a. The reason is that the propagation of the hydraulic fracture at low permeability of the rock matrix requires a higher fracture net pressure as shown in Figure 11d, and then large in situ stress reorientation is induced by the non-uniformly distributed gravels. As K r / K g increases, the deflection of the hydraulic fracture as well as the length of the fracture decreases (Figure 11b,c). Figure 11d illustrates the variations in the fluid pressure for different K r / K g . It is observed that, with the increasing of K r / K g , the fluid pressure at injection point decreases, and the time required to reach the breakdown pressure is prolonged.

4.6. Influence of Content and Size of the Randomly Distributed Gravels

Gravels with different contents are embedded in the proposed model to study the evolution characteristics of the hydraulic fracture morphology. Five cases of the gravel contents (0%, 5%, 10%, 20% and 40%) are considered for the simulations as shown in Figure 12. The gravel content ρ c denotes the ratio between the area of gravel and the entire simulated area. It is demonstrated that the hydraulic fracture extends horizontally in the isotropic media (content = 0%). As the content increases, (Figure 12b,c), the non-uniform distribution of the gravels result in non-planar hydraulic fractures. As the ρ c increases to 20% and 40%, (Figure 12d,e), the deflection of the hydraulic fractures is accentuated significantly. Figure 12f demonstrates the variation in fluid pressure at the injection point with different gravel contents. The results show that the fluid pressure within the fracture decreases with the content of the gravels due to the decrease in the average strength of the formation as the number of the weak interfaces increase. The results illustrate the significance of heterogeneity on the deflection of the hydraulic fracture.
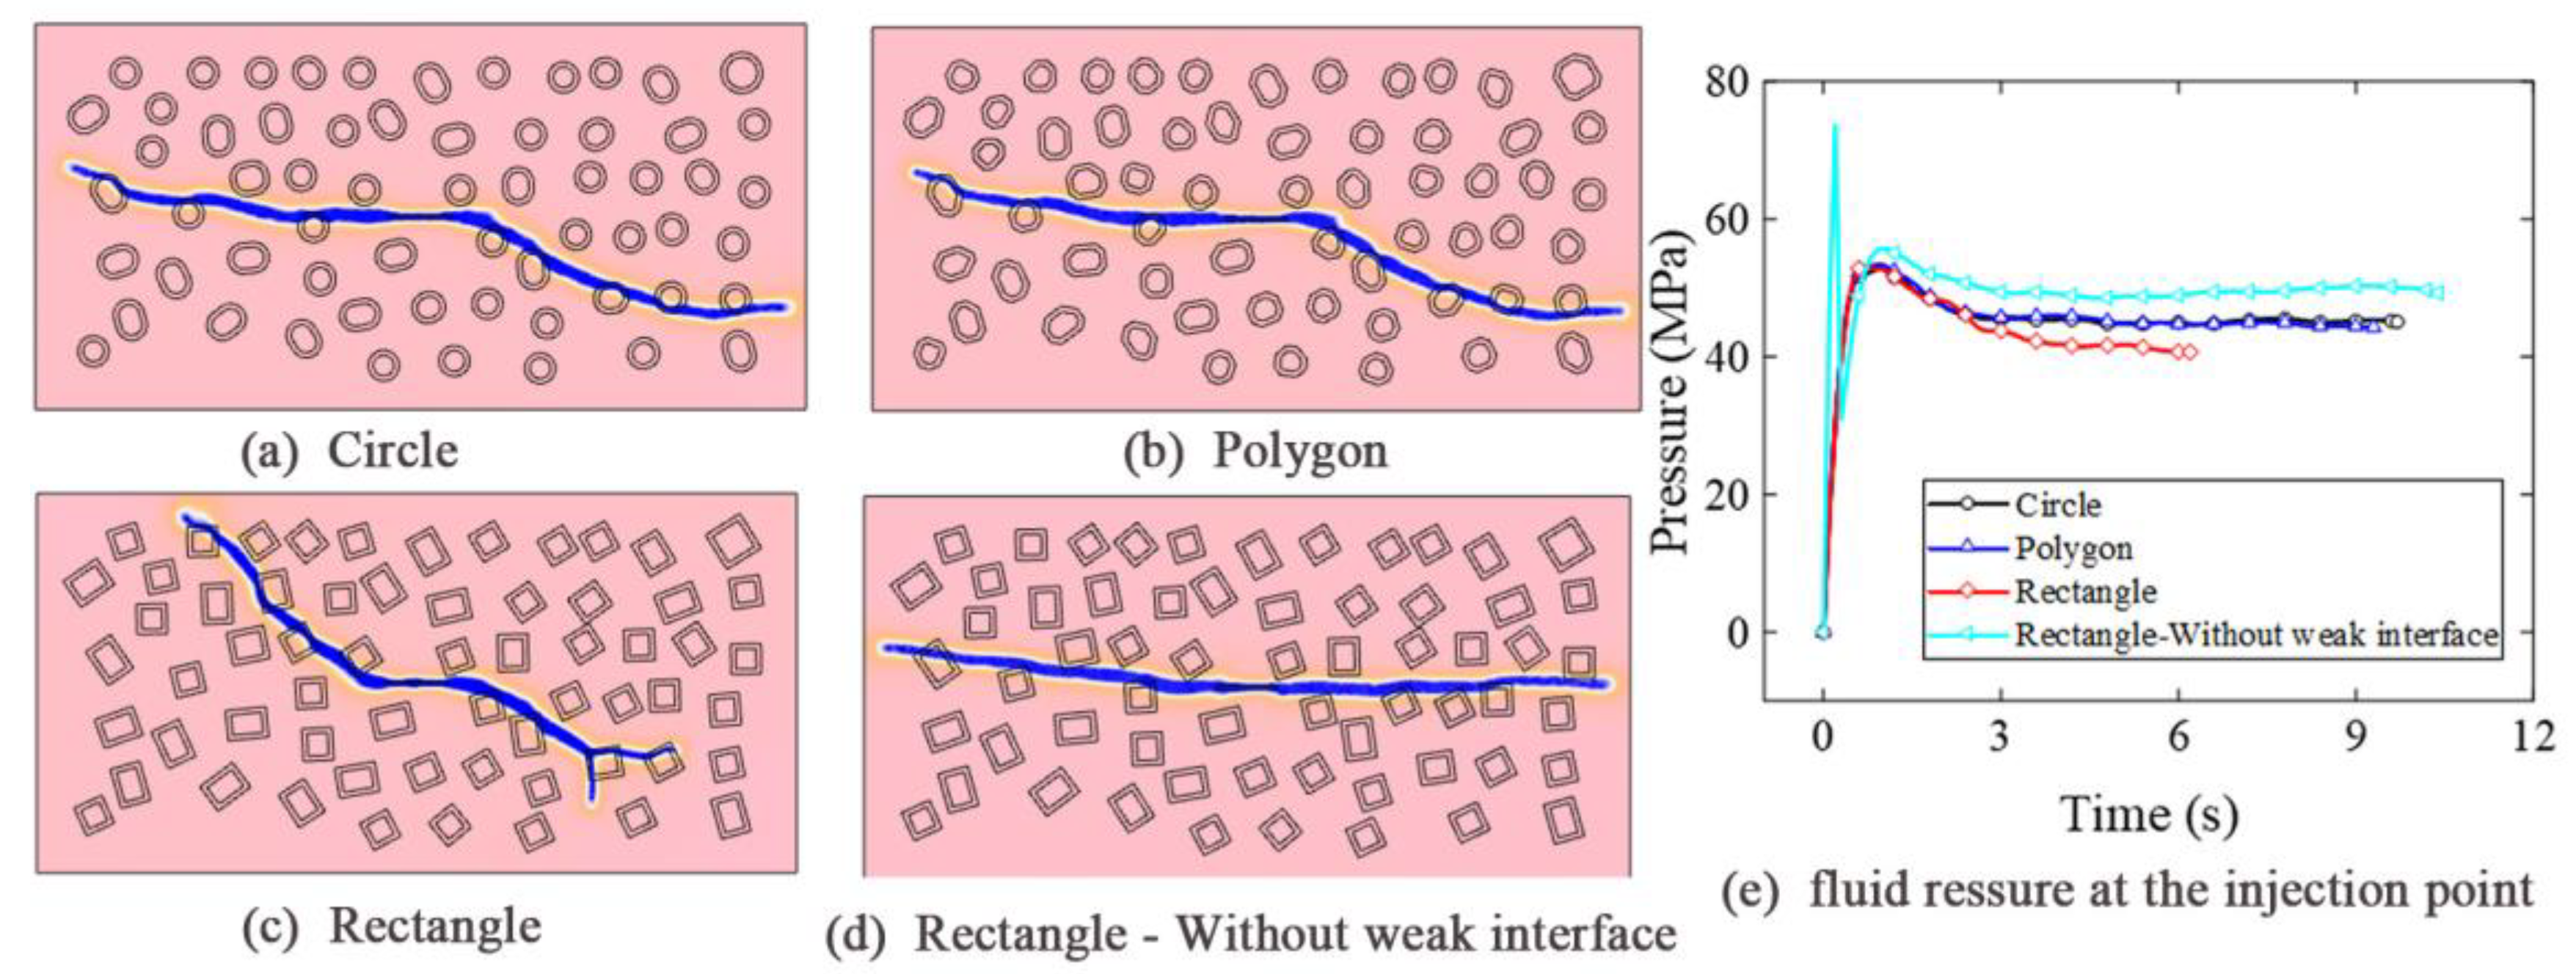
The shape of the gravel in glutenite reservoirs varies in a wide range, including detritus, well round cobble as well as angular breccia. Here, we study the effect of the roundness of the gravels on the fracture geometries. The shape of the gravels is simplified to two-dimension for simplicity. Three cases of different roundness of gravels, circle, polygon and rectangle, are adopted for the simulations. In this section, the gravel in the three cases have the same position and character length. In Figure 13a,b, the hydraulic fractures show coinciding trajectories. As the roundness decreases, the deflection of the hydraulic fracture increases significantly and the branch fracture is observed in a wing. It implies that the roundness of the gravels may affect stimulation parameters such as clusters’ spacing in a horizontal well; therefore, the spacing should be optimized to avoid the intersections between hydraulic fractures.
When we removed the weak interfaces, the significant difference of the fracture extensions was also observed in Figure 13d compared with the case of Figure 13c. The variation in the fluid pressure at the injection point is shown in Figure 13e. It was observed that the fluid pressure in reservoirs without weak interfaces was slightly higher than that in the reservoir with weak interfaces.
We further present the effect of gravel size on the fracture geometries. Three distinct ranges of the gravel sizes, 0.2–0.4 m, 0.4–0.6 m, 0.6–0.8 m, were used for the simulations. As shown in Figure 14a, the extending path did not show a significant deviation from the horizontal line as the gravel size ranges from 0.2 m to 0.4 m. Figure 14b demonstrates that the branch fracture appeared as the hydraulic fractures encountered larger size gravels ranging from 0.4 to 0.6 m. The length of the branch fracture increased with the gravel size, as demonstrated in Figure 14c. The reason is that the large gravels could significantly alter fractures’ propagation direction, which facilitates inducing branch fractures. The variation in fluid pressure at the injection point for different gravel sizes is illustrated in Figure 14d. The fluid pressure within the fracture decreased with the gravel size.

5. Conclusions

Based on the phase field method, a coupled hydraulic fracturing fluid–solid model in a glutenite reservoir is established. Although nonlinear constitutive models can be included in the numerical model, glutenite formation is assumed to be isotropic and linear elastic for simplicity. The fluid injected into each fracture is assumed to be incompressible and Newtonian, and the fluid lag at the tips of the cracks is not considered. The effect of gravel properties and treatment parameters on fracture morphology is investigated in heterogeneous deformation with weak interfaces. The presented model can be used to simulate fractures extending trajectories in glutenite reservoirs. The results are summarized as follows.
(1)
Hydraulic fracture is arrested by gravels as the Young’s modulus of the gravels is less than the rock matrix, and apart from the gravels if the Young’s modulus of the gravels is larger than rock matrix. The deflection of the hydraulic fracture is weakened as the distance between gravels and fracture increases.
(2)
The critical bifurcation injection rate is found to depend on the heterogeneity of the formation; the value of the critical bifurcation injection rate decreases with the decreasing of stress difference.
(3)
Weak interfaces between gravels and the rock matrix have a significant effect on the fracture propagation such as deflection and bifurcating.
(4)
Hydraulic fractures are more likely to bifurcate as the size of gravels is large enough.

Author Contributions

Conceptualization, C.L. and Y.C.; methodology, C.L., Y.C., and Q.H.; software, C.L., Y.C., and Q.H.; validation, Y.C.; formal analysis, Y.C.; investigation, Y.C.; resources, C.L., Y.C., and Q.H.; data curation, Y.C.; writing—original draft preparation, C.L. and Y.C.; writing—review and editing, C.L. and Q.H.; visualization, C.L., Y.C., and Q.H.; supervision, C.L.; project administration, C.L.; funding acquisition, C.L. All authors have read and agreed to the published version of the manuscript.

Funding

This work was jointly supported by National Natural Science Foundation of China (12102173), Anhui Provincial Natural Science Foundation (1908085QA32) and General Project of Natural Science Research in Universities of Jiangsu Province (21KJB130001).

Institutional Review Board Statement

Not applicable.

Informed Consent Statement

Not applicable.

Data Availability Statement

Not applicable.

Conflicts of Interest

The authors declare no conflict of interest.

References

  1. Gordeliy, E.; Abbas, S.; Peirce, A. Modeling nonplanar hydraulic fracture propagation using the XFEM: An implicit level-set algorithm and fracture tip asymptotics. Int. J. Solids Struct. 2019, 159, 135–155. [Google Scholar] [CrossRef]
  2. Rui, Z.; Peng, F.; Ling, K.; Chang, H.; Chen, G.; Zhou, X. Investigation into the performance of oil and gas projects. J. Nat. Gas. Sci. Eng. 2017, 38, 12–20. [Google Scholar] [CrossRef]
  3. Wang, D.; Zlotnik, S.; Diez, P.; Ge, H.; Zhou, F.; Yu, B. A Numerical Study on Hydraulic Fracturing Problems via the Proper Generalized Decomposition Method. Comput. Model Eng. Sci. 2020, 122, 703–720. [Google Scholar] [CrossRef]
  4. Zou, J.; Chen, W.; Yuan, J.; Yang, D.; Yang, J. 3-D numerical simulation of hydraulic fracturing in a CBM reservoir. J. Nat. Gas. Sci. Eng. 2017, 37, 386–396. [Google Scholar] [CrossRef]
  5. Ji, Y.; Wu, W.; Zhao, Z. Unloading-induced rock fracture activation and maximum seismic moment prediction. Eng. Geol. 2019, 262, 105352. [Google Scholar] [CrossRef]
  6. Yang, T.H.; Tham, L.G.; Tang, C.A.; Liang, Z.Z.; Tsui, Y. Influence of Heterogeneity of Mechanical Properties on Hydraulic Fracturing in Permeable Rocks. Rock Mech. Rock Eng. 2004, 37, 251–275. [Google Scholar] [CrossRef]
  7. Shi, F.; Wang, D.; Chen, X. A Numerical Study on the Propagation Mechanisms of Hydraulic Fractures in Fracture-Cavity Carbonate Reservoirs. Comput. Model Eng. Sci. 2021, 127, 575–598. [Google Scholar] [CrossRef]
  8. Zeng, Q.; Liu, W.; Yao, J. Effect of Vugs on Hydraulic Fracture Propagation with Phase Field Method. Lithosphere 2021, 2021, 4496747. [Google Scholar] [CrossRef]
  9. Li, M.; Tang, S.; Guo, T.; Qi, M. Numerical investigation of hydraulic fracture propagation in the glutenite reservoir. J. Geophys. Eng. 2018, 15, 2124–2138. [Google Scholar] [CrossRef] [Green Version]
  10. Lan, H.; Martin, C.D.; Hu, B. Effect of heterogeneity of brittle rock on micromechanical extensile behavior during compression loading. J. Geophys. Res. 2010, 115, B01202. [Google Scholar] [CrossRef]
  11. Zhang, Y.-Z.; Dusseault, M.B.; Yassir, N.A. Effects of rock anisotropy and heterogeneity on stress distributions at selected sites in North America. Eng. Geol. 1994, 37, 181–197. [Google Scholar] [CrossRef]
  12. Wu, M.; Wang, W.; Song, Z.; Liu, B.; Feng, C. Exploring the influence of heterogeneity on hydraulic fracturing based on the combined finite–discrete method. Eng. Fract. Mech. 2021, 252, 107835. [Google Scholar] [CrossRef]
  13. Jeffrey, R.G.; Bunger, A.P.; Lecampion, B. Measuring Hydraulic Fracture Growth in Naturally Fractured Rock. In All Days; SPE: New Orleans, LA, USA, 2009; SPE-124919-MS. [Google Scholar]
  14. Nasehi, M.J.; Mortazavi, A. Effects of in-situ stress regime and intact rock strength parameters on the hydraulic fracturing. J. Pet. Sci. Eng. 2013, 108, 211–221. [Google Scholar] [CrossRef]
  15. Yan, C.; Zheng, H. FDEM-flow3D: A 3D hydro-mechanical coupled model considering the pore seepage of rock matrix for simulating three-dimensional hydraulic fracturing. Comput. Geotech. 2017, 81, 212–228. [Google Scholar] [CrossRef]
  16. Yi, L.P.; Waisman, H.; Yang, Z.Z.; Li, X.G. A consistent phase field model for hydraulic fracture propagation in poroelastic media. Comput. Methods Appl. Mech. Eng. 2020, 372, 113396. [Google Scholar] [CrossRef]
  17. Yoshioka, K.; Mollaali, M.; Kolditz, O. Variational phase-field fracture modeling with interfaces. Comput. Methods Appl. Mech. Eng. 2021, 384, 113951. [Google Scholar] [CrossRef]
  18. Xia, L.; Yvonnet, J.; Ghabezloo, S. Phase field modeling of hydraulic fracturing with interfacial damage in highly heterogeneous fluid-saturated porous media. Eng. Fract. Mech. 2017, 186, 158–180. [Google Scholar] [CrossRef] [Green Version]
  19. Ju, Y.; Liu, P.; Chen, J.; Yang, Y.; Ranjith, P.G. CDEM-based analysis of the 3D initiation and propagation of hydrofracturing cracks in heterogeneous glutenites. J. Nat. Gas. Sci. Eng. 2016, 35, 614–623. [Google Scholar] [CrossRef]
  20. Sarmadivaleh, M.; Rasouli, V. Test Design and Sample Preparation Procedure for Experimental Investigation of Hydraulic Fracturing Interaction Modes. Rock. Mech. Rock. Eng. 2015, 48, 93–105. [Google Scholar] [CrossRef]
  21. Guo, J.; Lu, Q.; Chen, H.; Wang, Z.; Tang, X.; Chen, L. Quantitative phase field modeling of hydraulic fracture branching in heterogeneous formation under anisotropic in-situ stress. J. Nat. Gas. Sci. Eng. 2018, 56, 455–471. [Google Scholar] [CrossRef]
  22. Zou, J.; Jiao, Y.Y.; Tang, Z.; Ji, Y.; Yan, C.; Wang, J. Effect of mechanical heterogeneity on hydraulic fracture propagation in unconventional gas reservoirs. Comput. Geotech. 2020, 125, 103652. [Google Scholar] [CrossRef]
  23. Rui, Z.; Guo, T.; Feng, Q.; Qu, Z.; Qi, N.; Gong, F. Influence of gravel on the propagation pattern of hydraulic fracture in the glutenite reservoir. J. Pet. Sci. Eng. 2018, 165, 627–639. [Google Scholar] [CrossRef]
  24. Zhou, J.; Huang, H.; Deo, M. Simulation of Hydraulic and Natural Fracture Interaction Using a Coupled DFN-DEM Model. In 50th US Rock Mechanics/Geomechanics Symposium; OnePetro: online, 2016. [Google Scholar]
  25. Chang, X.; Guo, Y.; Zhou, J.; Song, X.; Yang, C. Numerical and Experimental Investigations of the Interactions between Hydraulic and Natural Fractures in Shale Formations. Energies 2018, 11, 2541. [Google Scholar] [CrossRef] [Green Version]
  26. Zhang, Y.; Liu, Z.; Han, B.; Zhu, S.; Zhang, X. Numerical study of hydraulic fracture propagation in inherently laminated rocks accounting for bedding plane properties. J. Pet. Sci. Eng. 2022, 210, 109798. [Google Scholar] [CrossRef]
  27. Wang, D.; Shi, F.; Qin, H.; Sun, D.; Yu, B. Failure Patterns and Mechanisms of Hydraulic Fracture Propagation Behavior in the Presence of Naturally Cemented Fractures. Comput. Model Eng. Sci. 2021, 126, 891–914. [Google Scholar] [CrossRef]
  28. Wan, L.; Chen, M.; Hou, B.; Kao, J.; Zhang, K.; Fu, W. Experimental investigation of the effect of natural fracture size on hydraulic fracture propagation in 3D. J. Struct. Geol. 2018, 116, 1–11. [Google Scholar] [CrossRef]
  29. Tiedeman, C.R.; Barrash, W. Hydraulic Tomography: 3D Hydraulic Conductivity, Fracture Network, and Connectivity in Mudstone. Groundwater 2020, 58, 238–257. [Google Scholar] [CrossRef] [Green Version]
  30. Zhao, X.; Rui, Z.; Liao, X.; Zhang, R. The qualitative and quantitative fracture evaluation methodology in shale gas reservoir. J. Nat. Gas. Sci. Eng. 2015, 27, 486–495. [Google Scholar] [CrossRef]
  31. Yu, H.; Xu, H.; Fan, J.; Zhu, Y.B.; Wang, F.; Wu, H. Transport of Shale Gas in Microporous/Nanoporous Media: Molecular to Pore-Scale Simulations. Energy Fuels. 2021, 35, 911–943. [Google Scholar] [CrossRef]
  32. Xu, W.; Yu, H.; Zhang, J. Phase-field method of crack branching during SC-CO2 fracturing: A new energy release rate criterion coupling pore pressure gradient. Comput. Methods Appl. Mech. Eng. 2022, 399, 115366. [Google Scholar] [CrossRef]
  33. Taheri-Shakib, J.; Ghaderi, A.; Hosseini, S.; Hashemi, A. Debonding and coalescence in the interaction between hydraulic and natural fracture: Accounting for the effect of leak-off. J. Nat. Gas. Sci. Eng. 2016, 36, 454–462. [Google Scholar] [CrossRef]
  34. Zi, G.; Belytschko, T. New crack-tip elements for XFEM and applications to cohesive cracks. Int. J. Numer. Methods Eng. 2003, 57, 2221–2240. [Google Scholar] [CrossRef]
  35. Kim, J.; Moridis, G.J. Numerical analysis of fracture propagation during hydraulic fracturing operations in shale gas systems. Int. J. Rock. Mech. Min. Sci. 2015, 76, 127–137. [Google Scholar] [CrossRef]
  36. Yushi, Z.; Xinfang, M.; Shicheng, Z.; Tong, Z.; Han, L. Numerical Investigation into the Influence of Bedding Plane on Hydraulic Fracture Network Propagation in Shale Formations. Rock. Mech. Rock. Eng. 2016, 49, 3597–3614. [Google Scholar] [CrossRef]
  37. Liu, L.; Li, L.; Elsworth, D.; Zhi, S.; Yu, Y. The Impact of Oriented Perforations on Fracture Propagation and Complexity in Hydraulic Fracturing. Processes 2018, 6, 213. [Google Scholar] [CrossRef] [Green Version]
  38. Shi, S.; Zhuo, R.; Cheng, L.; Xiang, Y.; Ma, X.; Wang, T. Fracture Characteristics and Distribution in Slant Core from Conglomerate Hydraulic Fracturing Test Site (CHFTS) in Junggar Basin, Northwest China. Processes 2022, 10, 1646. [Google Scholar] [CrossRef]
  39. Li, Z.; Li, L.; Zhang, Z.; Li, M.; Zhang, L.; Huang, B.; Tang, C. The Fracturing Behavior of Tight Glutenites Subjected to Hydraulic Pressure. Processes 2018, 6, 96. [Google Scholar] [CrossRef] [Green Version]
  40. Tang, J.; Liu, B.; Zhang, G. Investigation on the Propagation Mechanisms of a Hydraulic Fracture in Glutenite Reservoirs Using DEM. Energies 2022, 15, 7709. [Google Scholar] [CrossRef]
  41. Chen, Z. Finite element modelling of viscosity-dominated hydraulic fractures. J. Pet. Sci. Eng. 2012, 88–89, 136–144. [Google Scholar] [CrossRef]
  42. Ren, Q.; Dong, Y.; Yu, T. Numerical modeling of concrete hydraulic fracturing with extended finite element method. Sci. China Ser. E Technol. Sci. 2009, 52, 559–565. [Google Scholar] [CrossRef]
  43. Dong, C.Y.; de Pater, C.J. Numerical implementation of displacement discontinuity method and its application in hydraulic fracturing. Comput. Methods Appl. Mech. Eng. 2001, 191, 745–760. [Google Scholar] [CrossRef]
  44. Ni, L.; Zhang, X.; Zou, L.; Huang, J. Phase-field modeling of hydraulic fracture network propagation in poroelastic rocks. Comput. Geosci. 2020, 24, 1767–1782. [Google Scholar] [CrossRef] [Green Version]
  45. Zhou, S.; Zhuang, X.; Rabczuk, T. Phase-field modeling of fluid-driven dynamic cracking in porous media. Comput. Methods Appl. Mech. Eng. 2019, 350, 169–198. [Google Scholar] [CrossRef]
  46. Zou, J.; Jiao, Y.Y.; Tan, F.; Lv, J.; Zhang, Q. Complex hydraulic-fracture-network propagation in a naturally fractured reservoir. Comput. Geotech. 2021, 135, 104165. [Google Scholar] [CrossRef]
  47. Santillán, D.; Juanes, R.; Cueto-Felgueroso, L. Phase field model of fluid-driven fracture in elastic media: Immersed-fracture formulation and validation with analytical solutions. J. Geophys. Res. Solid. Earth. 2017, 122, 2565–2589. [Google Scholar] [CrossRef] [Green Version]
  48. Biot, M.A. Theory of Elasticity and Consolidation for a Porous Anisotropic Solid. J. Appl. Phys. 1955, 26, 182–185. [Google Scholar] [CrossRef]
  49. Biot, M.A. General Theory of Three-Dimensional Consolidation. J. Appl. Phys. 1941, 12, 155–164. [Google Scholar] [CrossRef]
  50. Zhou, S.; Ma, J. Phase field characteristic of multizone hydraulic fracturing in porous media: The effect of stress boundary. Eur. J. Environ. Civ. Eng. 2022, 26, 3043–3063. [Google Scholar] [CrossRef]
  51. Miehe, C.; Hofacker, M.; Welschinger, F. A phase field model for rate-independent crack propagation: Robust algorithmic implementation based on operator splits. Comput. Methods Appl. Mech. Eng. 2010, 199, 2765–2778. [Google Scholar] [CrossRef]
  52. Lee, S.; Wheeler, M.F.; Wick, T. Pressure and fluid-driven fracture propagation in porous media using an adaptive finite element phase field model. Comput. Methods Appl. Mech. Eng. 2016, 305, 111–132. [Google Scholar] [CrossRef]
  53. Zhou, S.; Rabczuk, T.; Zhuang, X. Phase field modeling of quasi-static and dynamic crack propagation: COMSOL implementation and case studies. Adv. Eng. Softw. 2018, 122, 31–49. [Google Scholar] [CrossRef] [Green Version]
  54. Zhou, S.; Zhuang, X.; Rabczuk, T. A phase-field modeling approach of fracture propagation in poroelastic media. Eng. Geol. 2018, 240, 189–203. [Google Scholar] [CrossRef] [Green Version]
  55. Borden, M.J.; Verhoosel, C.V.; Scott, M.A.; Hughes, T.J.R.; Landis, C.M. A phase-field description of dynamic brittle fracture. Comput. Methods Appl. Mech. Eng. 2012, 217–220, 77–95. [Google Scholar] [CrossRef]
  56. Escobar, R.G.; Sanchez, E.C.M.; Roehl, D.; Romanel, C. Xfem modeling of stress shadowing in multiple hydraulic fractures in multi-layered formations. J. Nat. Gas. Sci. Eng. 2019, 70, 102950. [Google Scholar] [CrossRef]
  57. Luo, Z.; Xie, Y.; Zhao, L.; Cheng, L.; Wen, G.; Wang, C.; Gao, Y.; Wang, N. A Random-XFEM technique modeling of hydraulic fracture interaction with natural void. Energy Sci. Eng. 2022, 10, 2637–2660. [Google Scholar] [CrossRef]
  58. Fan, H.; Li, S.; Feng, X.T.; Zhu, X. A high-efficiency 3D boundary element method for estimating the stress/displacement field induced by complex fracture networks. J. Pet. Sci. Eng. 2020, 187, 106815. [Google Scholar] [CrossRef]
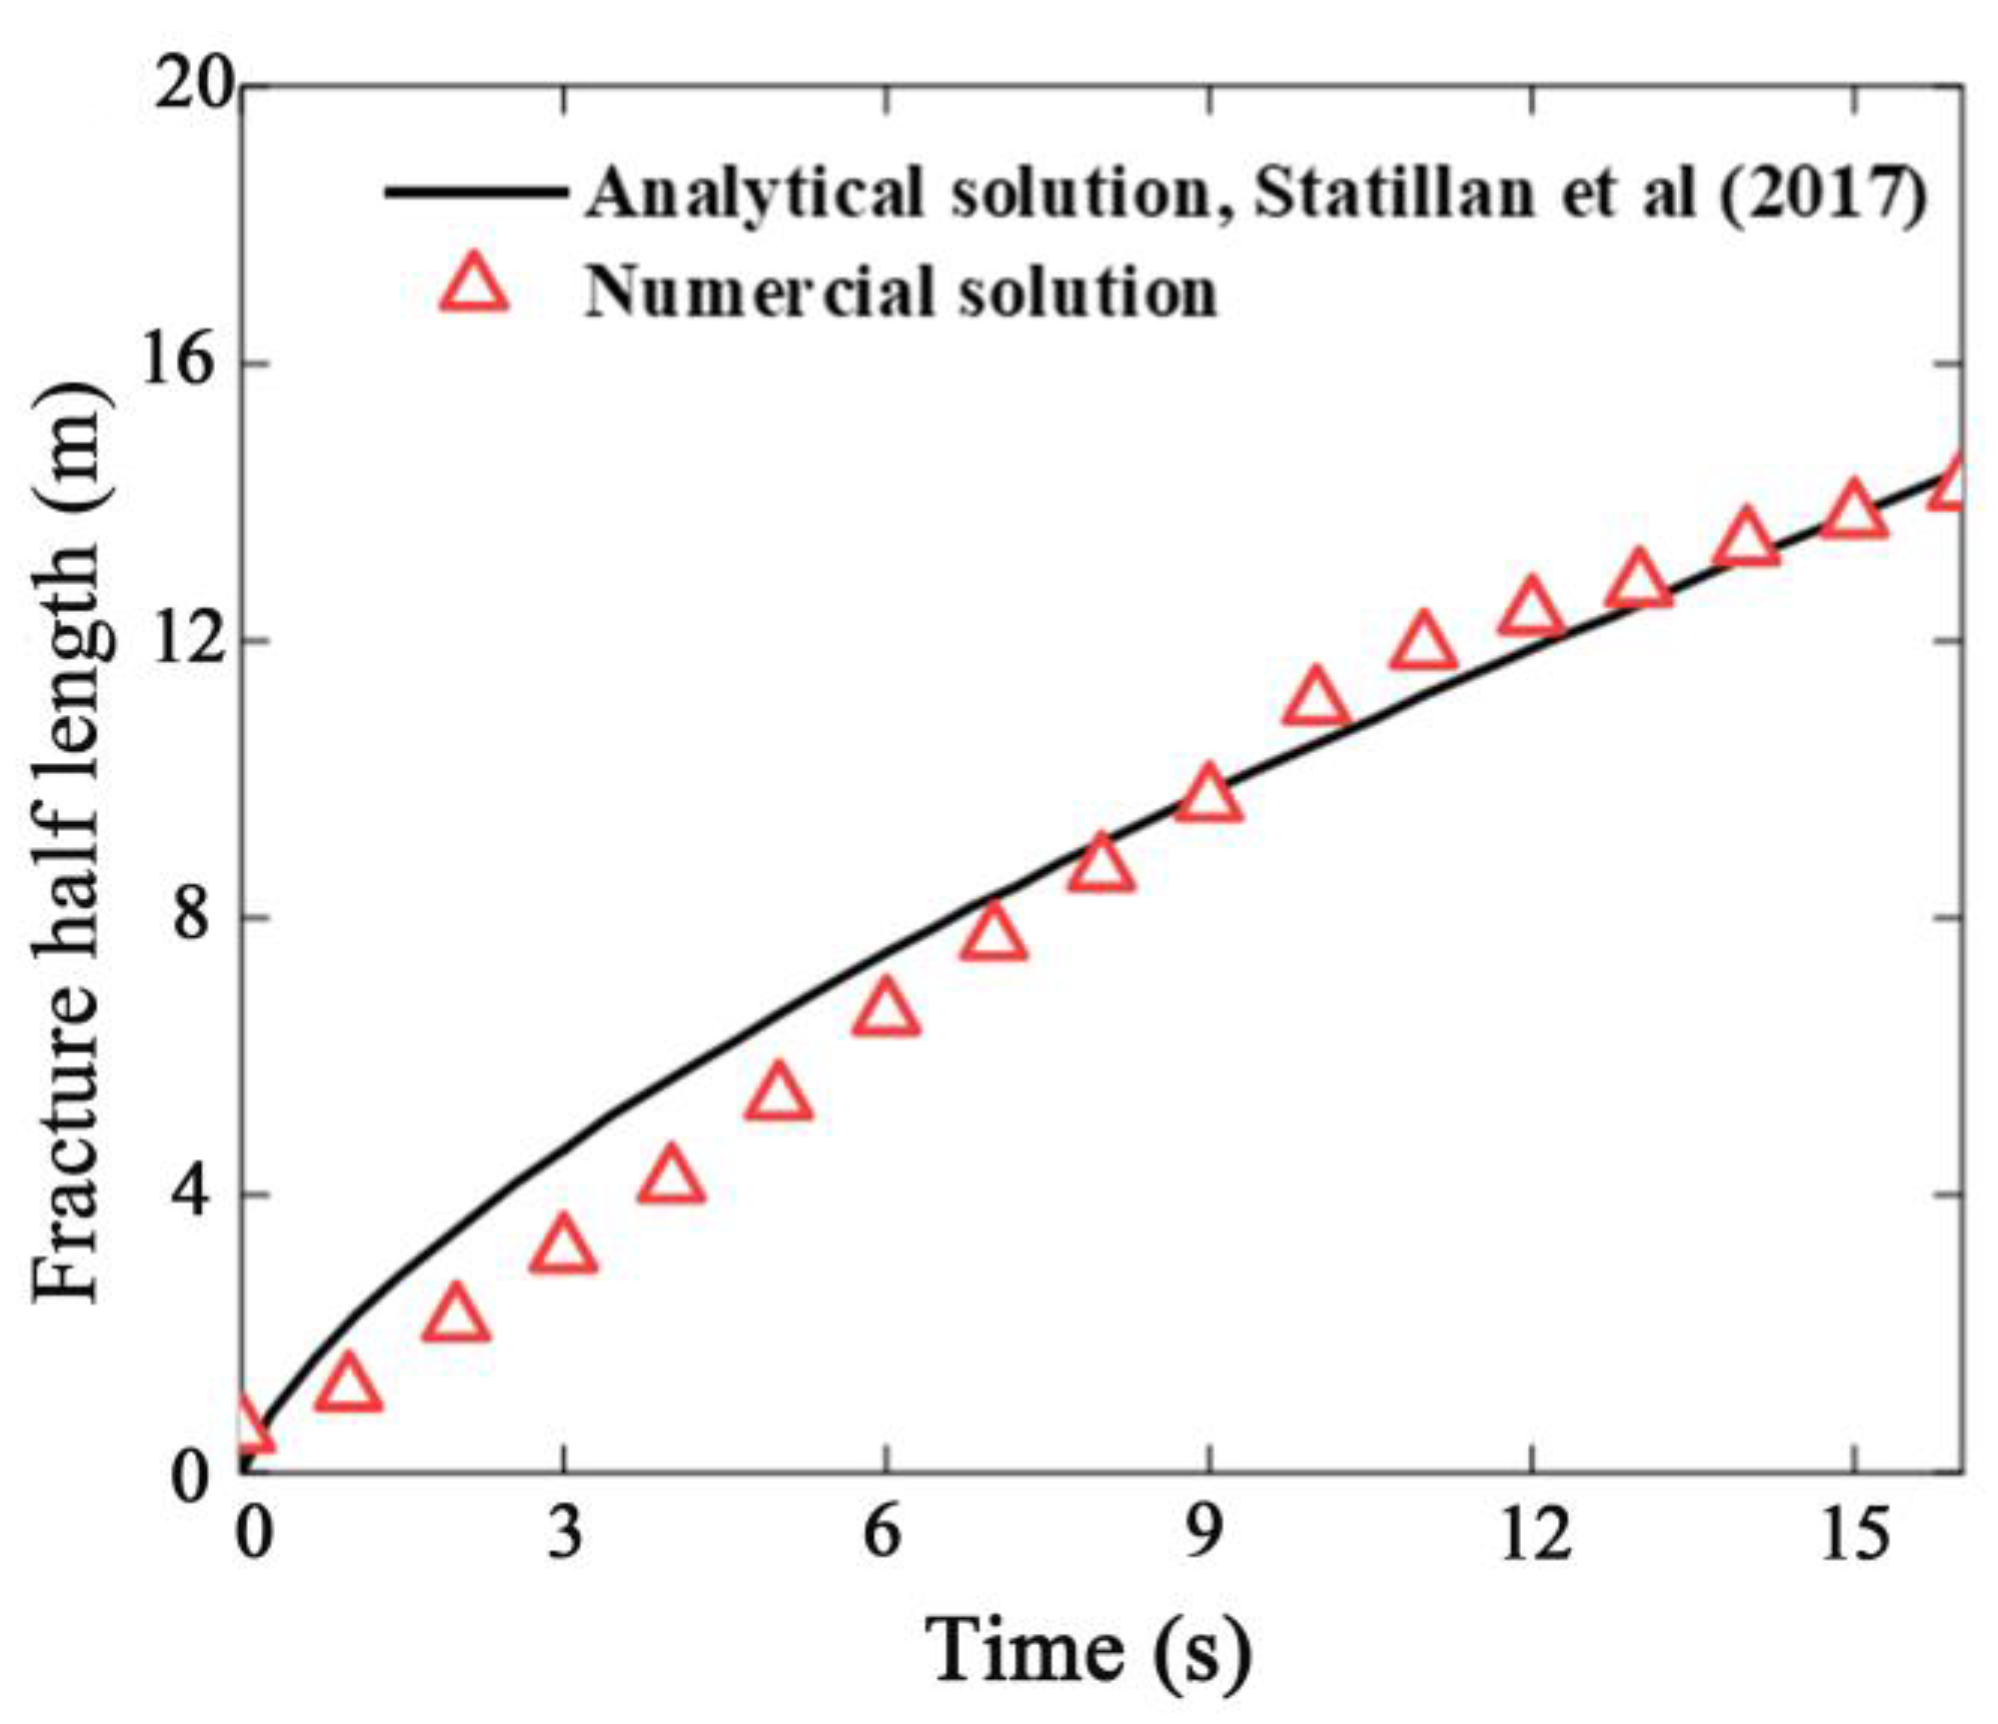
Figure 1. Comparison with the analytical solution [47].
Processes 10 02604 g001
Figure 2. Illustrations of geometry containing gravels and weak interfaces and boundary conditions.
Processes 10 02604 g002
Figure 3. Deflection patterns of the fracture versus the varying of the E g / E r .
Processes 10 02604 g003
Figure 4. Deflection angle of the cracks under different vertical distances.
Processes 10 02604 g004
Figure 5. Fracture morphologies for different injection rates in homogeneous and heterogeneous reservoirs, respectively.
Processes 10 02604 g005
Figure 6. Pressure curves at injection point under different injection rates in heterogeneous and homogeneous reservoir.
Processes 10 02604 g006
Figure 7. Fracture evolution under different stress differences. (a) Δσ = 0 Mpa; (b) Δσ = 1 MPa; (c) Δσ = 8 MPa; (d) Δσ = 20 MPa.
Processes 10 02604 g007
Figure 8. Fracture propagation under different fracturing fluid viscosities. (a) μ = 1 mPa·s; (b) μ = 35 mPa·s; (c) μ = 70 mPa·s.
Processes 10 02604 g008
Figure 9. Fracture propagation and pressure curves at injection point for different G r / G g .
Processes 10 02604 g009
Figure 10. Fracture propagation and fluid pressure at the injection point for various G g / G i .
Processes 10 02604 g010
Figure 11. Fracture propagation and fluid pressure at the injection point for different.
Processes 10 02604 g011
Figure 12. Fracture geometries and fluid pressure at the injection point for different contents ρ of the gravels.
Processes 10 02604 g012
Figure 13. Fracture propagation and fluid pressure at the injection point in case of gravels with different roundness or without weak interfaces.
Processes 10 02604 g013
Figure 14. Fracture geometries and fluid pressure at the injection point for different sizes of gravels.
Processes 10 02604 g014
Table 1. The input parameters for validation.
μ 4.722 GPa λ 7.083 GPa C 1 0.4 c 2 1.0
G C 120 N/m k 1 × 10⁻⁹ l 0 0.28 m ε p 0.06
ρ r 1.0 × 10³ kg/m3 ρ f 1.0 × 10³ kg/m3 α r 0.06 μ f r 1.0 × 10⁻³ Pa·s
μ f f 1.0 × 10⁻⁶ Pa·s c a 105 c b 2 c r , c f 1 × 10⁻⁸ 1/Pa
Table 2. The reservoir parameters.
E r 30 GPa ν 0.25 C 1 0.4 C 2 1.0
c a 1 × 10⁵ c b 2 ρ r 1.0 × 10³ kg/m3 ρ f 1.0 × 10³ kg/m3
μ f r 1.0 × 10⁻³ Pa·s μ f f 1.0 × 10⁻³ Pa·s G r 3000 N/m K r 0.2 × 10⁻¹⁵ m2
α r 0.05 c r , c f 1 × 10⁻⁸ 1/Pa ε p 0.05 l 0 0.008 m
Table 3. The parameters of gravel and weak interface.
GravelInterface
E g 40 GPa E i 15 GPa
G g 4000 N/m G i 2000 N/m
K g 0.1 × 10⁻¹⁵ m2 K i 0.1 × 10⁻¹⁵ m2
Publisher’s Note: MDPI stays neutral with regard to jurisdictional claims in published maps and institutional affiliations.