Article

Optimal Scheduling of Virtual Power Plant Based on Latin Hypercube Sampling and Improved CLARA Clustering Algorithm

1
School of Electric Power, North China University of Water Resources and Electric Power, Zhengzhou 450045, China
2
Electric Power Scientific Research Institute of State Grid Henan Province Electric Power Company, Zhengzhou 450002, China
*
Authors to whom correspondence should be addressed.
Processes 2022, 10(11), 2414; https://doi.org/10.3390/pr10112414
Submission received: 24 October 2022 / Revised: 11 November 2022 / Accepted: 12 November 2022 / Published: 16 November 2022

Abstract

:
In the context of the “Carbon peak, Carbon neutral” target, the introduction of carbon trading and the connection of new energy generation such as wind power and photovoltaics to the power grid have become important means to achieve a reduction to low carbon emissions. To this end, a virtual optimization model is established to take into account both low-carbon and economic aspects. Firstly, based on the basic concept of a virtual power plant, a virtual power plant model containing wind power, photovoltaic power, a gas turbine, and energy storage is established. Then, considering the uncertainty factors of wind power and PV power generation, Latin hypercube sampling (LHS) is used to simulate wind power and PV output scenarios, combined with the improved CLARA clustering algorithm to reduce the scenarios to form a classical scenario set to reduce the influence of wind power and PV output volatility. Finally, a carbon-trading mechanism and time-sharing tariff are introduced, and the model is solved with the objective function of maximizing the net benefit and minimizing the carbon emission of the Virtual Power Plant. Using arithmetic examples for verification, the results show that the introduction of carbon-trading mechanism can improve the net benefits of the Virtual Power Plant while promoting energy saving and emission reduction.

1. Introduction

As the demand for electricity continues to grow and the problems of energy scarcity and environmental pollution become increasingly severe worldwide, the drawbacks of traditional energy generation are becoming increasingly apparent. Within the background of “Carbon peak, Carbon neutral”, renewable energy represented by wind power and photovoltaic power generation has become the main direction of China’s future energy development. However, at the same time, its small-scale, wide distribution and many kinds of characteristics also bring certain troubles to grid scheduling and stable operation. The unified and coordinated management of new energy output through a Virtual Power Plant (VPP) can not only reduce the impact of random fluctuations in renewable energy on the grid, but also reduce the difficulty of distributed generation scheduling, so that distributed generation can better participate in grid scheduling and operation.
VPP have been studied in great depth in many literatures. The literature [1,2,3] provides a detailed introduction to the definition, control methods, and model framework of a VPP, pointing out the urgent problems to be solved in a VPP, including the coordinated control of the VPP based on multi-agent systems, the use of efficient aggregation management methods to achieve collaboration among the VPP, the establishment of an open and reliable information interaction system, and an outlook on the future development of the VPP. In the literature [4,5,6], a linear programming control allocation model for a virtual power plant containing at least one conventional power generation plant and renewable energy sources together was developed; a mixed-integer linear programming model was created with the objective of minimizing the cost of a conventional power plant, and the feasibility of the method was verified by an intelligent optimization algorithm. In the literature [7], a probability distribution inscription method for the scheduling boundary of VPP taking into account the uncertainty of distributed new energy sources is proposed based on multi-parameter planning theory; the proposed method uses the new energy random variables as the planning parameters, studies the segmental analytical mapping of the virtual power plant gate limit exchange power and the new energy power, and calculates the cumulative distribution function of the virtual power plant dispatch boundary based on the principle of full probability. In order to reduce the heavy computational burden caused by the growth of random variables, the paper proposes a key random variable identification method based on the ranking of line transfer distribution factors to realize the fast inscription of the probability distribution of the virtual power plant dispatch boundary, and applies the proposed probability distribution of the virtual power plant dispatch boundary to the virtual power plant–main network cooperative optimization dispatch. The validity and accuracy of the proposed method are demonstrated by simulation calculations based on an IEEE 136-node distribution network. In the paper [8], a two-stage coordinated optimal scheduling method based on economic model predictive control is proposed for multi-virtual power plants on a day-ahead basis. The analysis shows that the total profit of multi-virtual power plant joint operation is improved compared with a single virtual power plant only trading with the grid, and the proposed dispatching scheme can effectively cope with the uncertain wind power output, improve the dispatching accuracy, and realize the overall optimal economic operation of a multi-virtual power plant, thus verifying the correctness and feasibility of the model. The literature [9] proposed a virtual power plant optimization model considering demand response, which can effectively improve scenic intermittent power consumption, reduce the peak-to-valley load difference, smooth the load curve, and maximize the economic return of the virtual power plant, verifying the effectiveness of the proposed method. The literature [10] uses pumped-storage plants to deal with uncertainties in wind and PV output and proposes a mixed-integer linear programming model, which is verified by arithmetic examples to maximize the profitability of the VPP under long-term bilateral contracts and technical constraints. The combination of pumped-storage power plants with wind and photovoltaic greatly improves the output stability of the integrated energy system. In the literature [11], a multi-timescale coordinated operation strategy for virtual power plant (VPP) clusters considering electric energy interaction and sharing was proposed to effectively improve the electric energy balance problem of VPP cluster systems and significantly improve the overall operation economy through multi-VPP coordinated interaction and multi-timescale rolling optimization. At the same time, it also improves the problem of uneven output of each output unit, and this operation method is more reasonable.
With the development of electric vehicles, the impact of electric vehicle charging and discharging on the power grid cannot be ignored. In the literature [12,13,14,15], several problems of large-scale electric vehicles in the form of energy storage to participate in the dispatch management of VPP and to participate in the electricity market were studied, and an optimal dispatch model of a VPP with electric vehicles was constructed. Electric vehicles can be used as both a load and a power source, and several of these papers have studied the charging and discharging problems of electric vehicles more fully, but have ignored the effects of peak ridership. In the literature [16], a master–slave game model for a VPP containing EVs was developed to improve the overall economy of system operation by guiding the charging and discharging behavior of EVs through tariff signals; however, the cost of battery losses in EVs and energy storage systems was ignored. In order to reduce the high energy storage costs, the literature [17] used energy routers to implement the conversion of natural gas to electricity and to participate in market regulation services, effectively increasing the average profit of energy router participants.
At present, most of the research on VPP is focused on the economic dispatch side, but there is little consideration of other aspects such as environmental impact, and in the context of China’s “Carbon peak, Carbon neutral” goal and the global efforts to reduce energy consumption, research on the environmental aspects of VPP is equally important.
The literature [18] models the integrated carbon–electricity trading strategy of a VPP, and the introduction of a carbon-trading mechanism will significantly reduce the level of bidding output of high-carbon units. In the literature [19], an optimal scheduling model for carbon-containing capture and waste incineration virtual power plants that takes into account the power-to-gas synergy was proposed. The simulation results show that the proposed model and method can reduce the cost and carbon emissions of the virtual power plant by enhancing the consumption of renewable energy with peak-shaving and valley-filling effects. In the literature [20,21,22], an optimal dispatch model considering demand response and carbon emission constraints was developed to study the impact of environmental friendliness on the economics of a VPP. In the literature [22], an integrated energy system optimal dispatch model considering stepped carbon trading and flexible dual response of supply and demand was proposed, adding the consideration of gas carbon emissions and introducing a stepped carbon-trading mechanism; a flexible dual response mechanism of supply and demand was proposed, introducing an organic Rankine cycle on the supply side to achieve a flexible response of cogeneration and electric output, and on the demand side, while considering that electric, thermal, and gas loads all have demand in the time dimension. Finally, an optimal dispatch model was constructed with the objectives of minimizing carbon emission cost, energy purchase cost, wind abandonment cost, and demand response cost. The results show that under the ladder carbon-trading mechanism, the total operating cost and carbon emission were reduced by 5.18% and 13.5%, respectively, when the carbon-trading cost was considered in the optimization target compared to when the carbon-trading cost was not considered in the optimization target. The results show that under the stepped carbon-trading mechanism, the total operating costs and carbon emissions were reduced by 5.18% and 13.96%, respectively, compared with those of the optimization target without carbon-trading costs, and the total operating costs and carbon emissions were reduced by 16.93% when the dual response mechanism was considered. The total operating costs and carbon emissions were reduced by 16.93% and 27.35%, respectively, when the dual response mechanism was considered. The simulation results verified the validity of the proposed model.
Although the above literature considers the impact of environmental friendliness, it idealizes the wind and PV output and does not take into account the impact of the volatility of wind and PV output on virtual power plant dispatch.
In this paper, an optimal scheduling model for a VPP considering carbon trading is developed. Firstly, based on the basic concept of a virtual power plant, a virtual power plant model containing wind power, photovoltaic power, a gas turbine, and energy storage is established. Then, considering the uncertainties of wind power and PV power generation, Latin hypercubic sampling is used to simulate wind power and PV output scenarios, combined with the improved CLARA clustering algorithm to reduce the scenarios to form a classical scenario set to reduce the impact of wind power and PV output volatility. Finally, a carbon-trading mechanism is introduced to solve the model with the objective function of maximizing the net benefit and minimizing the carbon emissions of the virtual power plant. Using arithmetic examples for verification, the results show that the introduction of a carbon-trading mechanism can improve the net benefits of a VPP while promoting energy saving and emission reduction.

2. Model Building

2.1. Wind Power Modeling

The power of the wind turbine is inextricably linked to the real-time wind speed, and the existing literature has studied the probabilistic model for wind speed in some depth. The most widely used probabilistic model is the two-parameter Weibull distribution [23].
The probabilistic model for the wind speed of the Weibull distribution can be expressed as:
f v ( v ) = k c × v c k 1 × e v c k
The rated power of the fan is:
P r = 1 2 π r 2 ρ v 3 × ( 1 + v 0 v ) [ 1 ( v 0 v ) 2 ] 2
The relationship between the wind speed and the output power of the fan satisfies the following equation.
P w ( v ) = { 0 , v < v i n   or   v > v o u t g ( x ) , v i n v v r P r , v r v v o u t
g ( x ) = P r v v i n v r v i n
where c and k are denoted as the scale and shape parameters of the Weibull distribution, respectively, v denotes the actual wind speed, and r is the radius of the turbine. ρ is the air density, P w ( v ) is the output power of the fan, P r is the rated power of the fan, v r indicates rated wind speed, v i n indicates the cut-in wind speed, and v o u t indicates the cut-out wind speed.

2.2. Photovoltaic Power Generation Modeling

Photovoltaic power generation is not only related to local climatic conditions, geographical location, and light intensity, but also to its own working characteristics. The most commonly used light intensity distribution in the existing literature is the beta distribution (Beta) [24], and the probability density function of the beta distribution can be expressed as:
f ( E ) = Γ ( α + β ) Γ ( α ) + Γ ( β ) ( E E M A X ) α 1 ( 1 E E M A X ) β 1
where Γ is the gamma function, E and E M A X represent the actual light intensity and maximum light intensity, respectively. α and β are beta distribution shape parameters that can be calculated from the average light intensity for each time period.
The output power of photovoltaic power generation is not only related to the intensity of light, but also related to the effective area of photovoltaic panels and the photoelectric conversion efficiency of photovoltaic panels. The output power of photovoltaic power generation can be expressed as:
P P V = η S C A E
It can be seen that the output of PV is proportional to the light intensity, and therefore the output of PV also obeys the beta distribution.
f ( P P V ) = Γ ( α + β ) Γ ( α ) + Γ ( β ) ( P P V P P V M A X ) α 1 ( 1 P P V P P V M A X ) β 1
where Γ is the gamma function, and E and E M A X represent the actual light intensity and maximum light intensity, respectively. α and β are beta distribution shape parameters that can be calculated from the average light intensity for each time period. S C A is the area of the PV panel, η is the energy conversion efficiency of the solar panel, and P P V and P P V M A X denote the actual PV output and the maximum PV output, respectively.

2.3. Carbon-Trading Modeling

There are currently two main ways of allocating carbon-trading quotas worldwide: free allocation according to specific rules, and paid allocation by auction. At the beginning of China’s low-carbon emission reduction policy, most of the carbon-trading quotas were allocated to the units in a free way. Domestic power producers generally adopt two allocation methods, namely the historical method and the baseline method [25].
In this paper, the baseline method is used for carbon emission allowances, i.e., the carbon emission allowances of the VPP at a moment are shown in Equation (8).
E V P P = 1 m η P m
where m is the number of carbon-producing generators in VPP. P m is the output of the carbon-producing generator at time t . η is the emission allocation factor per unit of VPP according to the “regional grid baseline emission factor” issued by the National Development and Reform Commission [26].
VPP’s carbon emissions are mainly generated from gas turbines and CO2 from buying electricity from the main grid. The benefits of the VPP’s participation in the carbon-trading market are as follows.
R C = λ C ( E V P P E M T E G )
where λ C is the price of the VPP’s participation in carbon trading. E M T is the carbon emission of the gas turbine. E G is the carbon emissions generated by the VPP buying electricity from the main grid. E V P P is the carbon emission allowance allocated to the VPP.

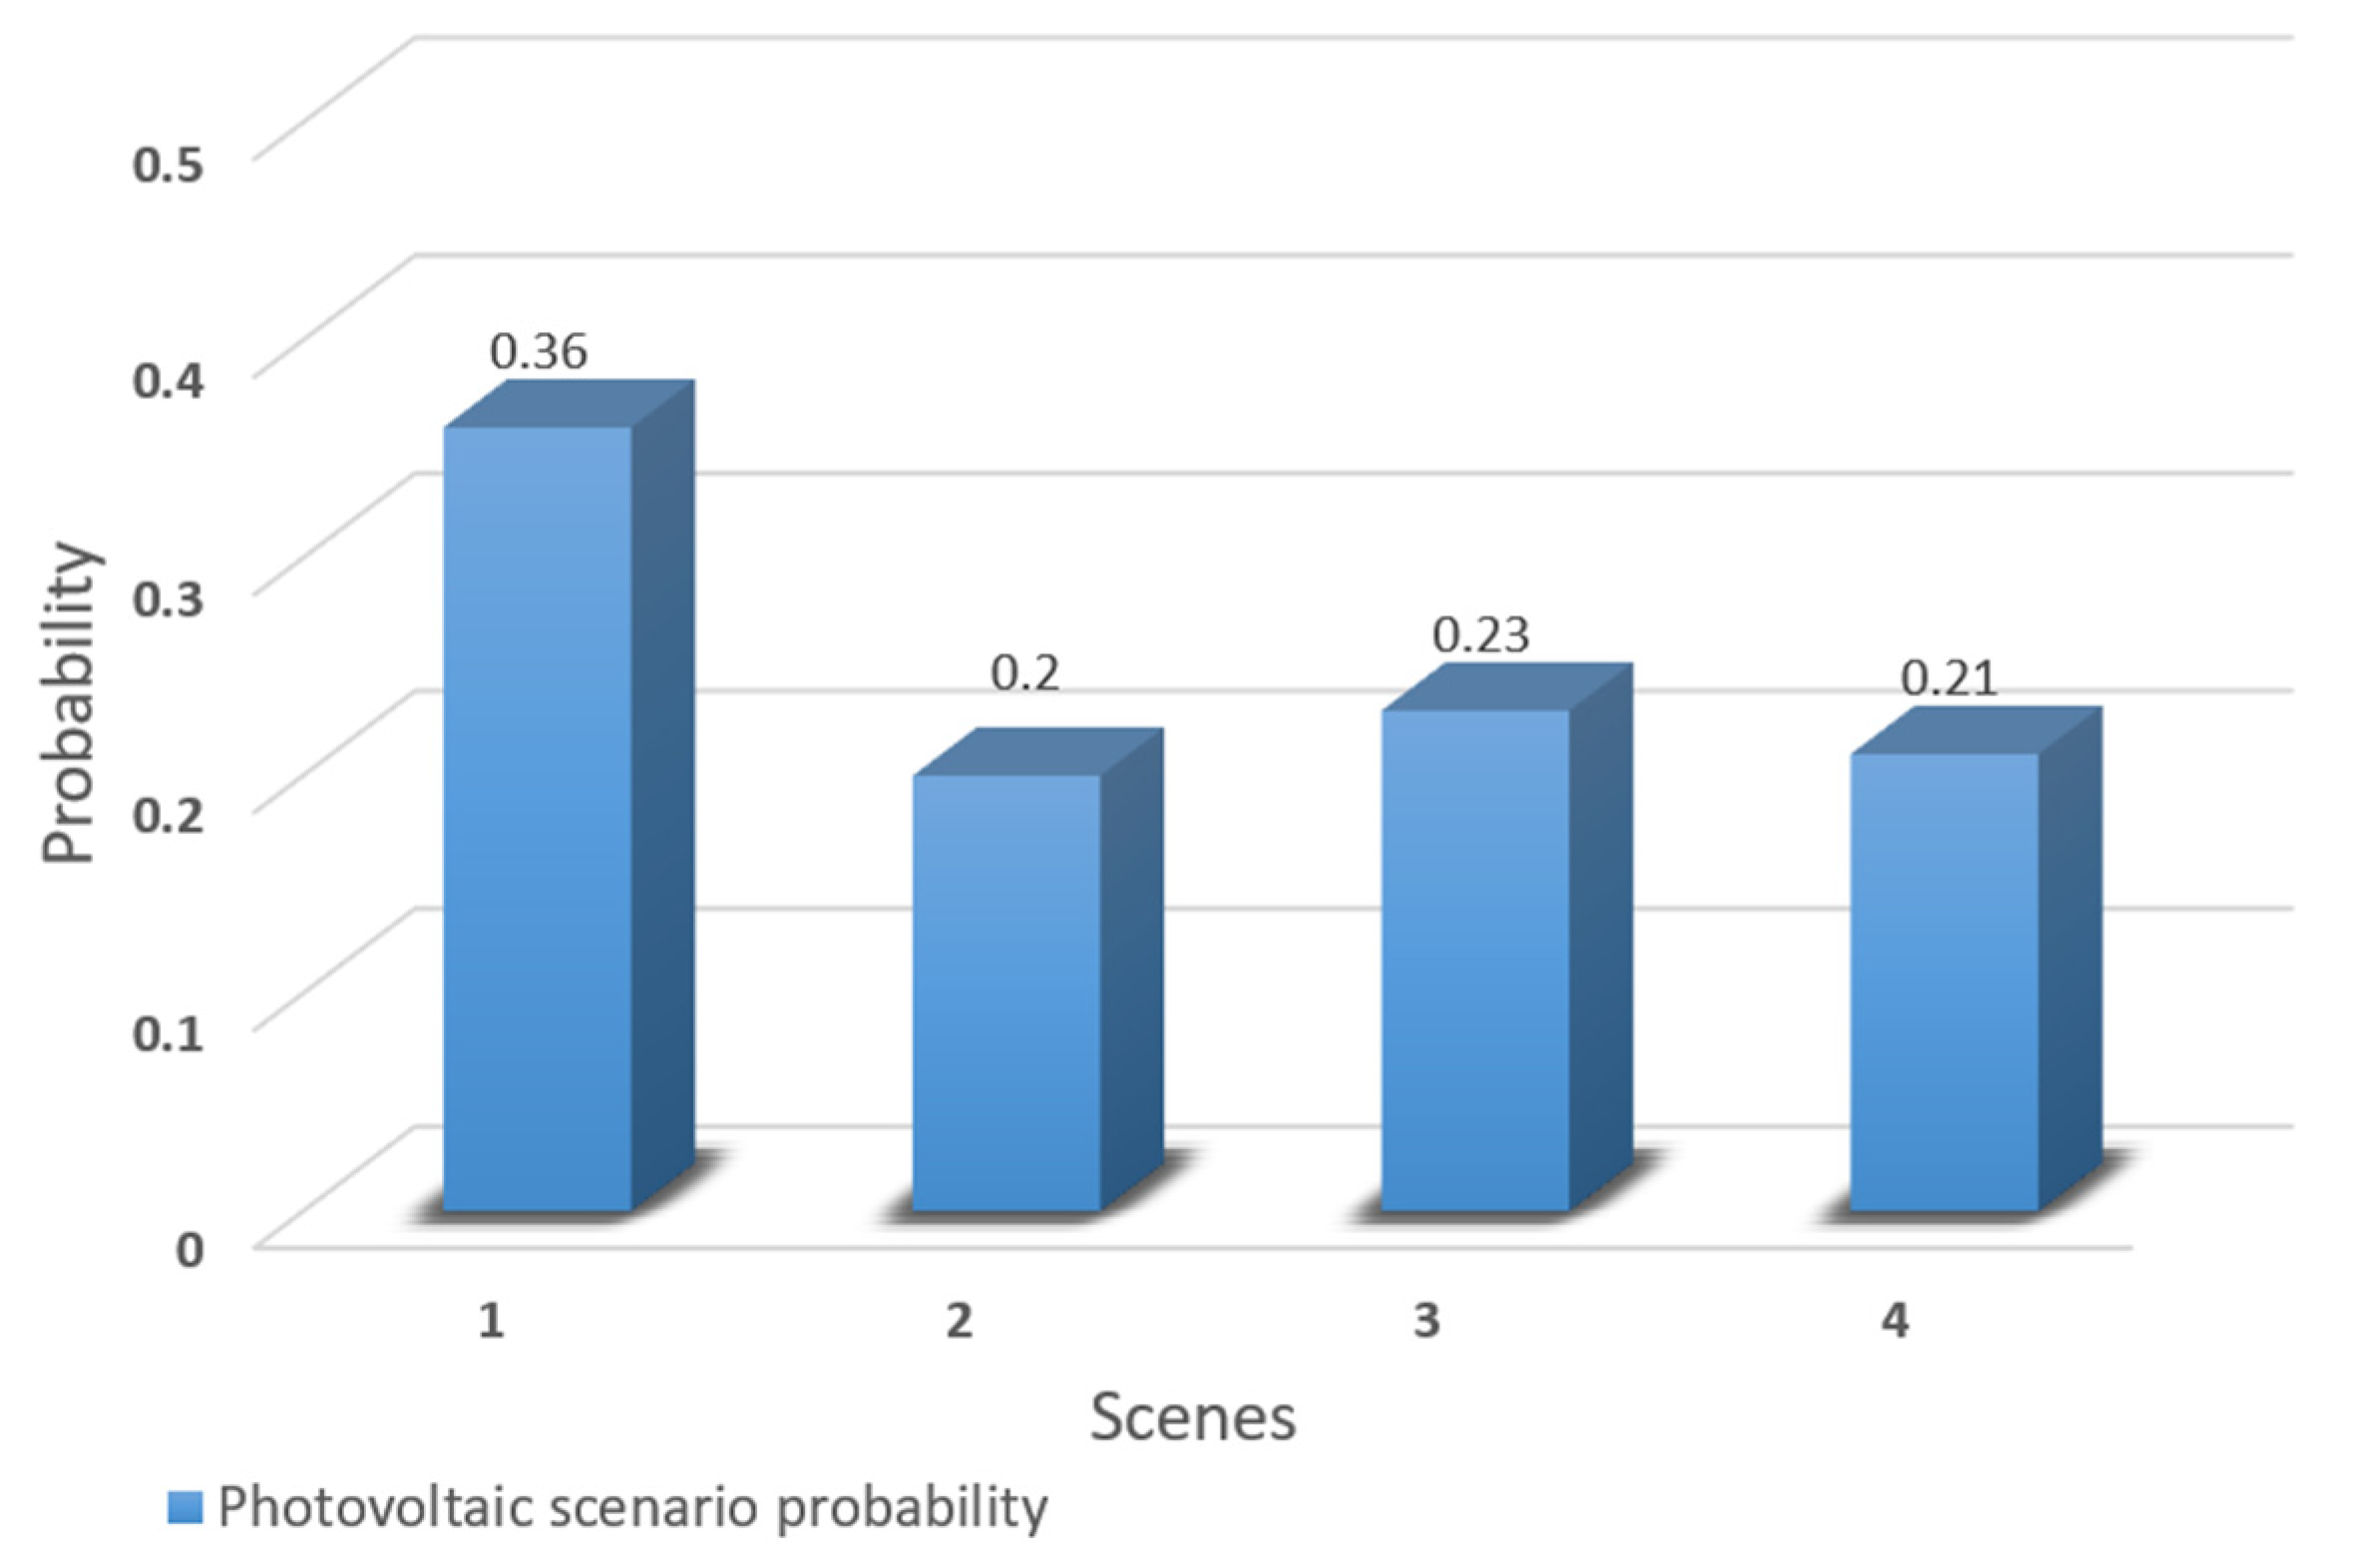
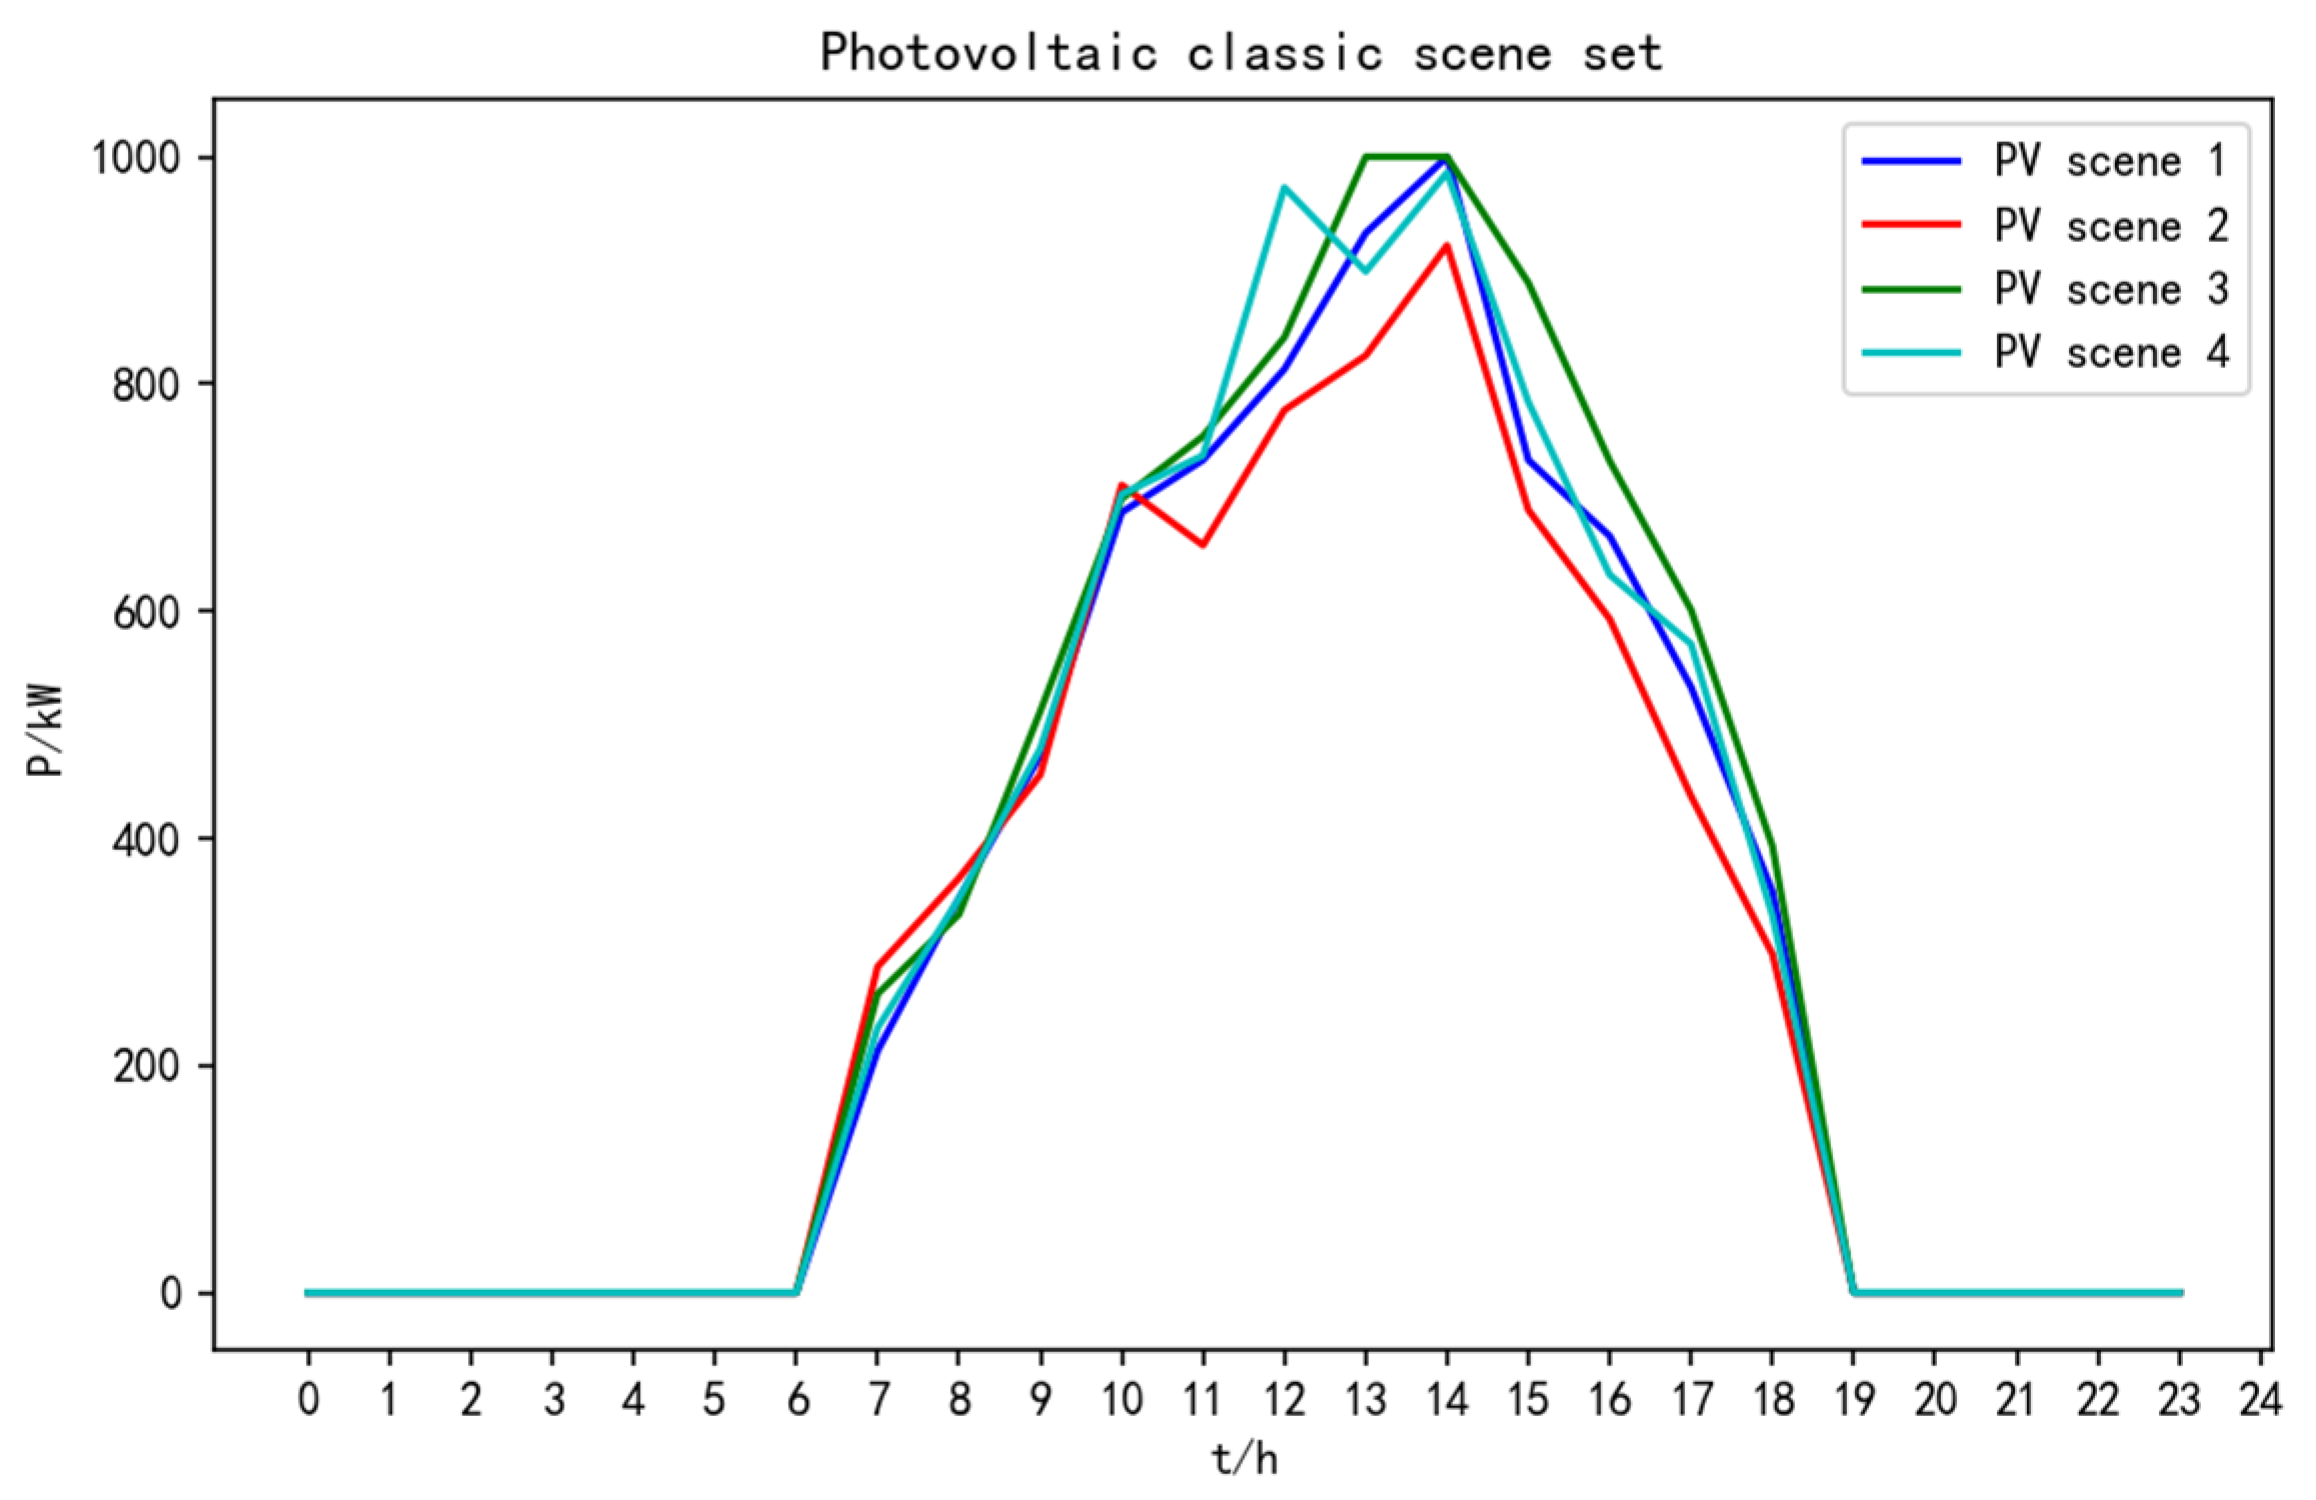
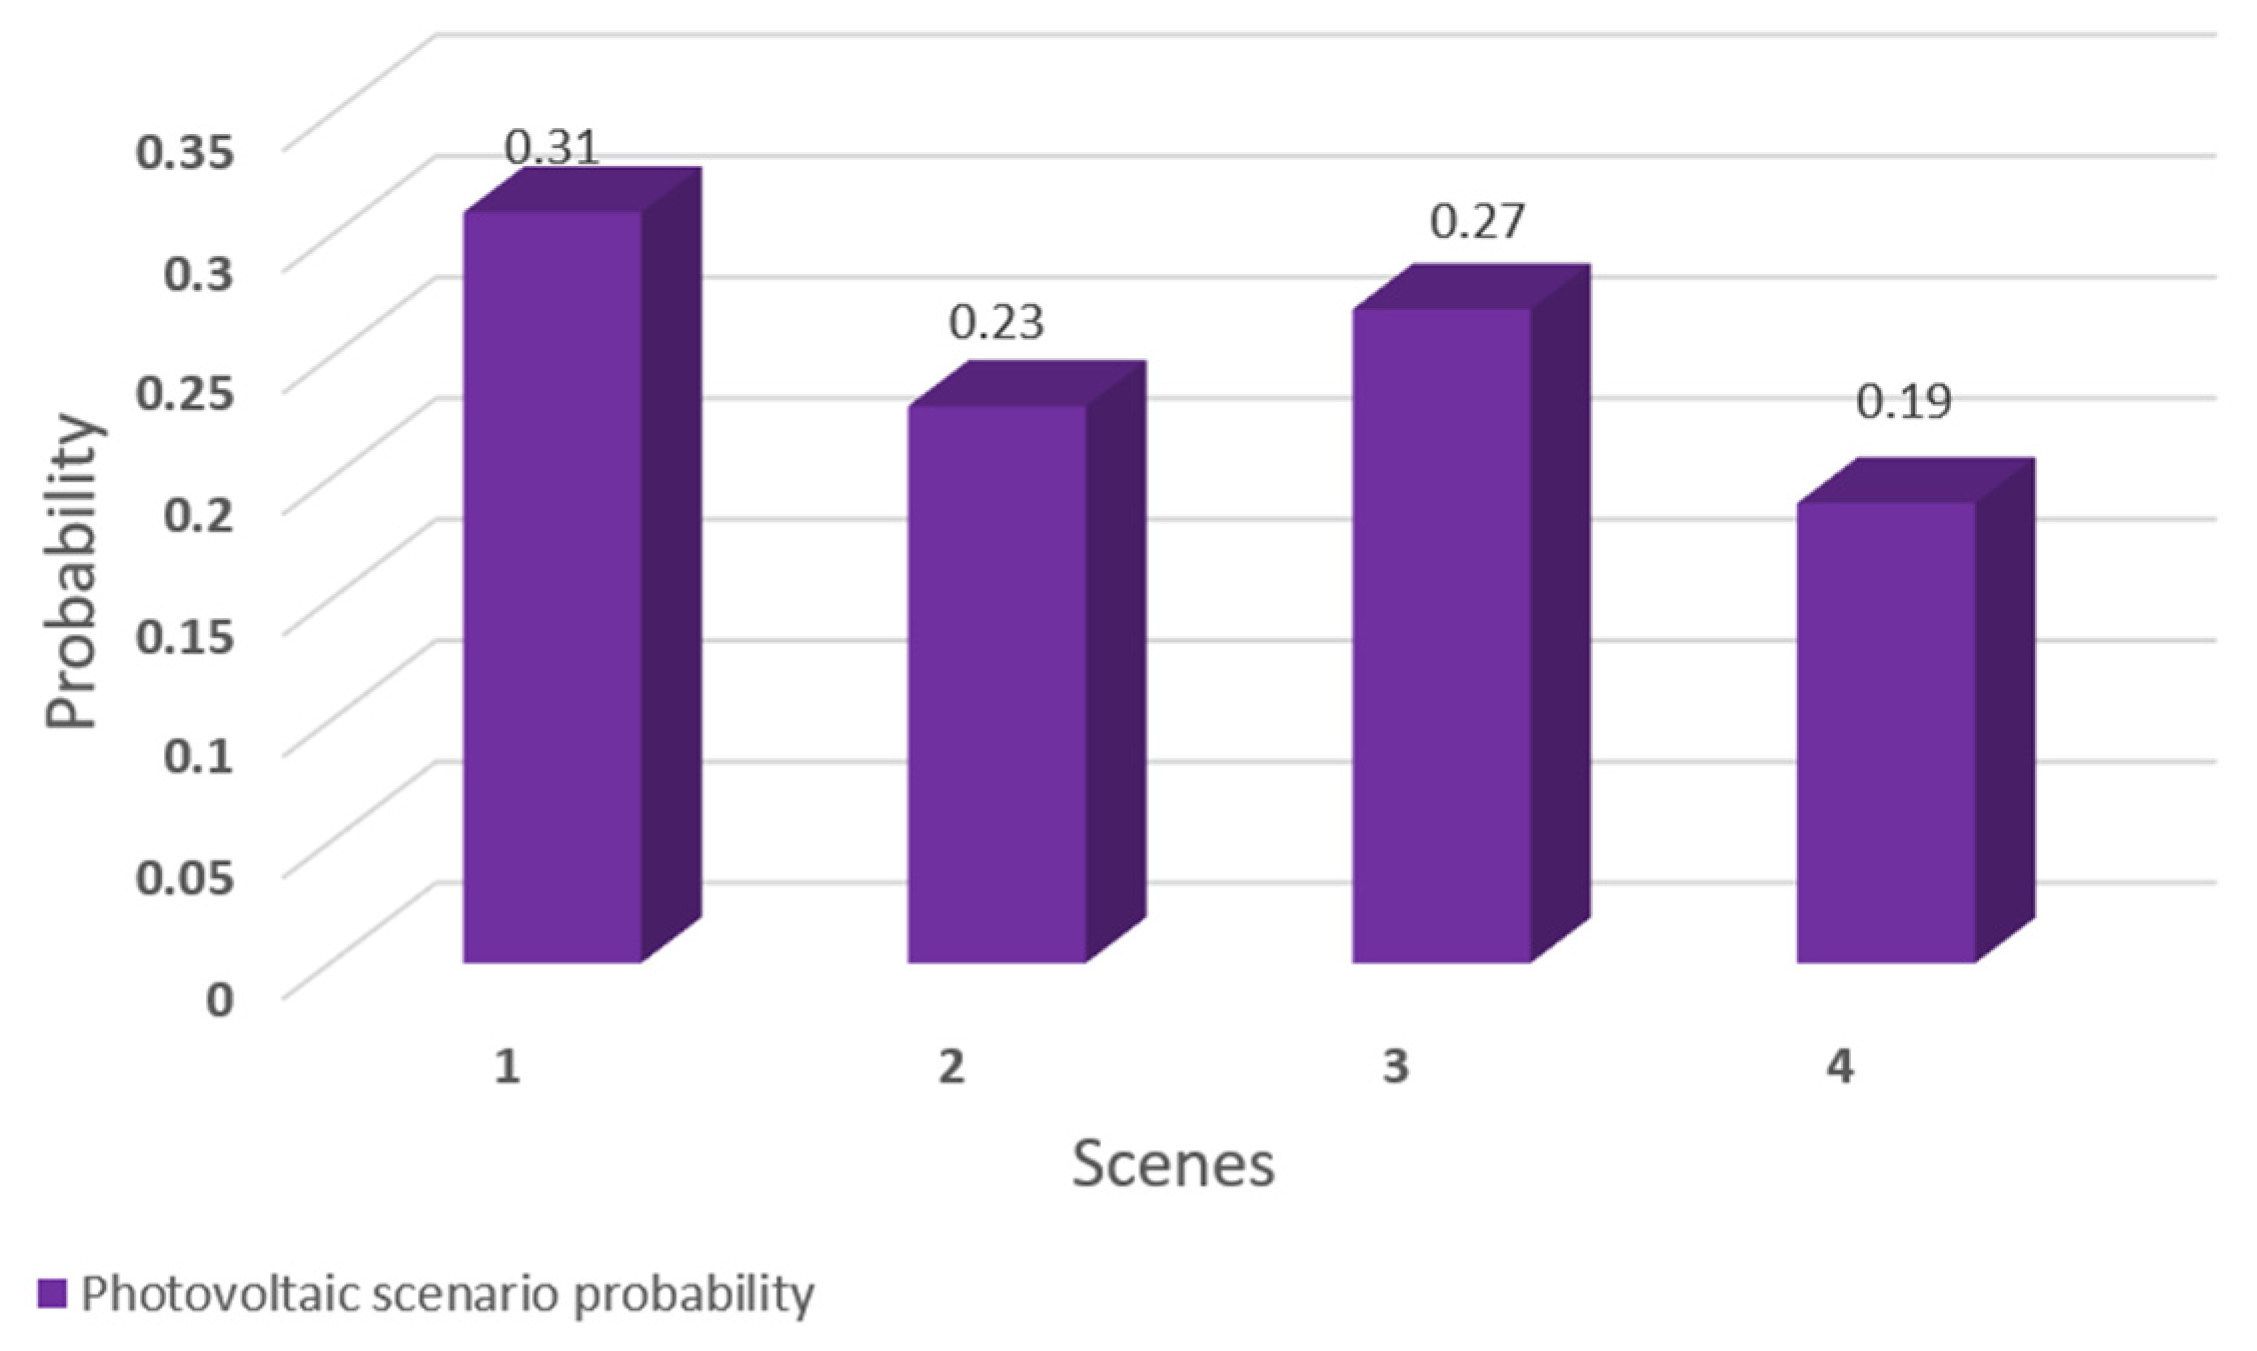
3. Generation of Classic Scene Sets

3.1. Latin Hypercube Sampling

Latin hypercube sampling is a method proposed by M. D. McKay, R. J. Beckman, and W. J. Conover in 1979 that can effectively use the distribution of sample response random variables [27]. Latin hypercube sampling is a typical stratified sampling, which can be covered by a smaller and unduplicated sample for all sampling areas. The sampling is carried out in the following steps:
(1)
Dividing the sample into equal intervals on the cumulative probability scale 0 to 1.
Y = F ( A )  
Let B be the number of samples; then, the vertical axis of Y = F ( A ) is divided into B equal intervals, each interval is independent of each other without repetition, and the width of the interval is 1/B.
(2)
Generate random numbers on each interval
( i 1 B , i B ) , 1 i B  
Generating a random number u in the interval shown in Equation (11), where u is a random variable obeying uniform distribution on the interval (0,1), a random number d i can be generated for the ith interval, which can be expressed as:
d i = u B + i 1 B
(3)
Inverting to generate sample values
The sampled values are calculated by the inverse function as:
A i = F 1 ( d i )
The above steps lead to the B sample values.

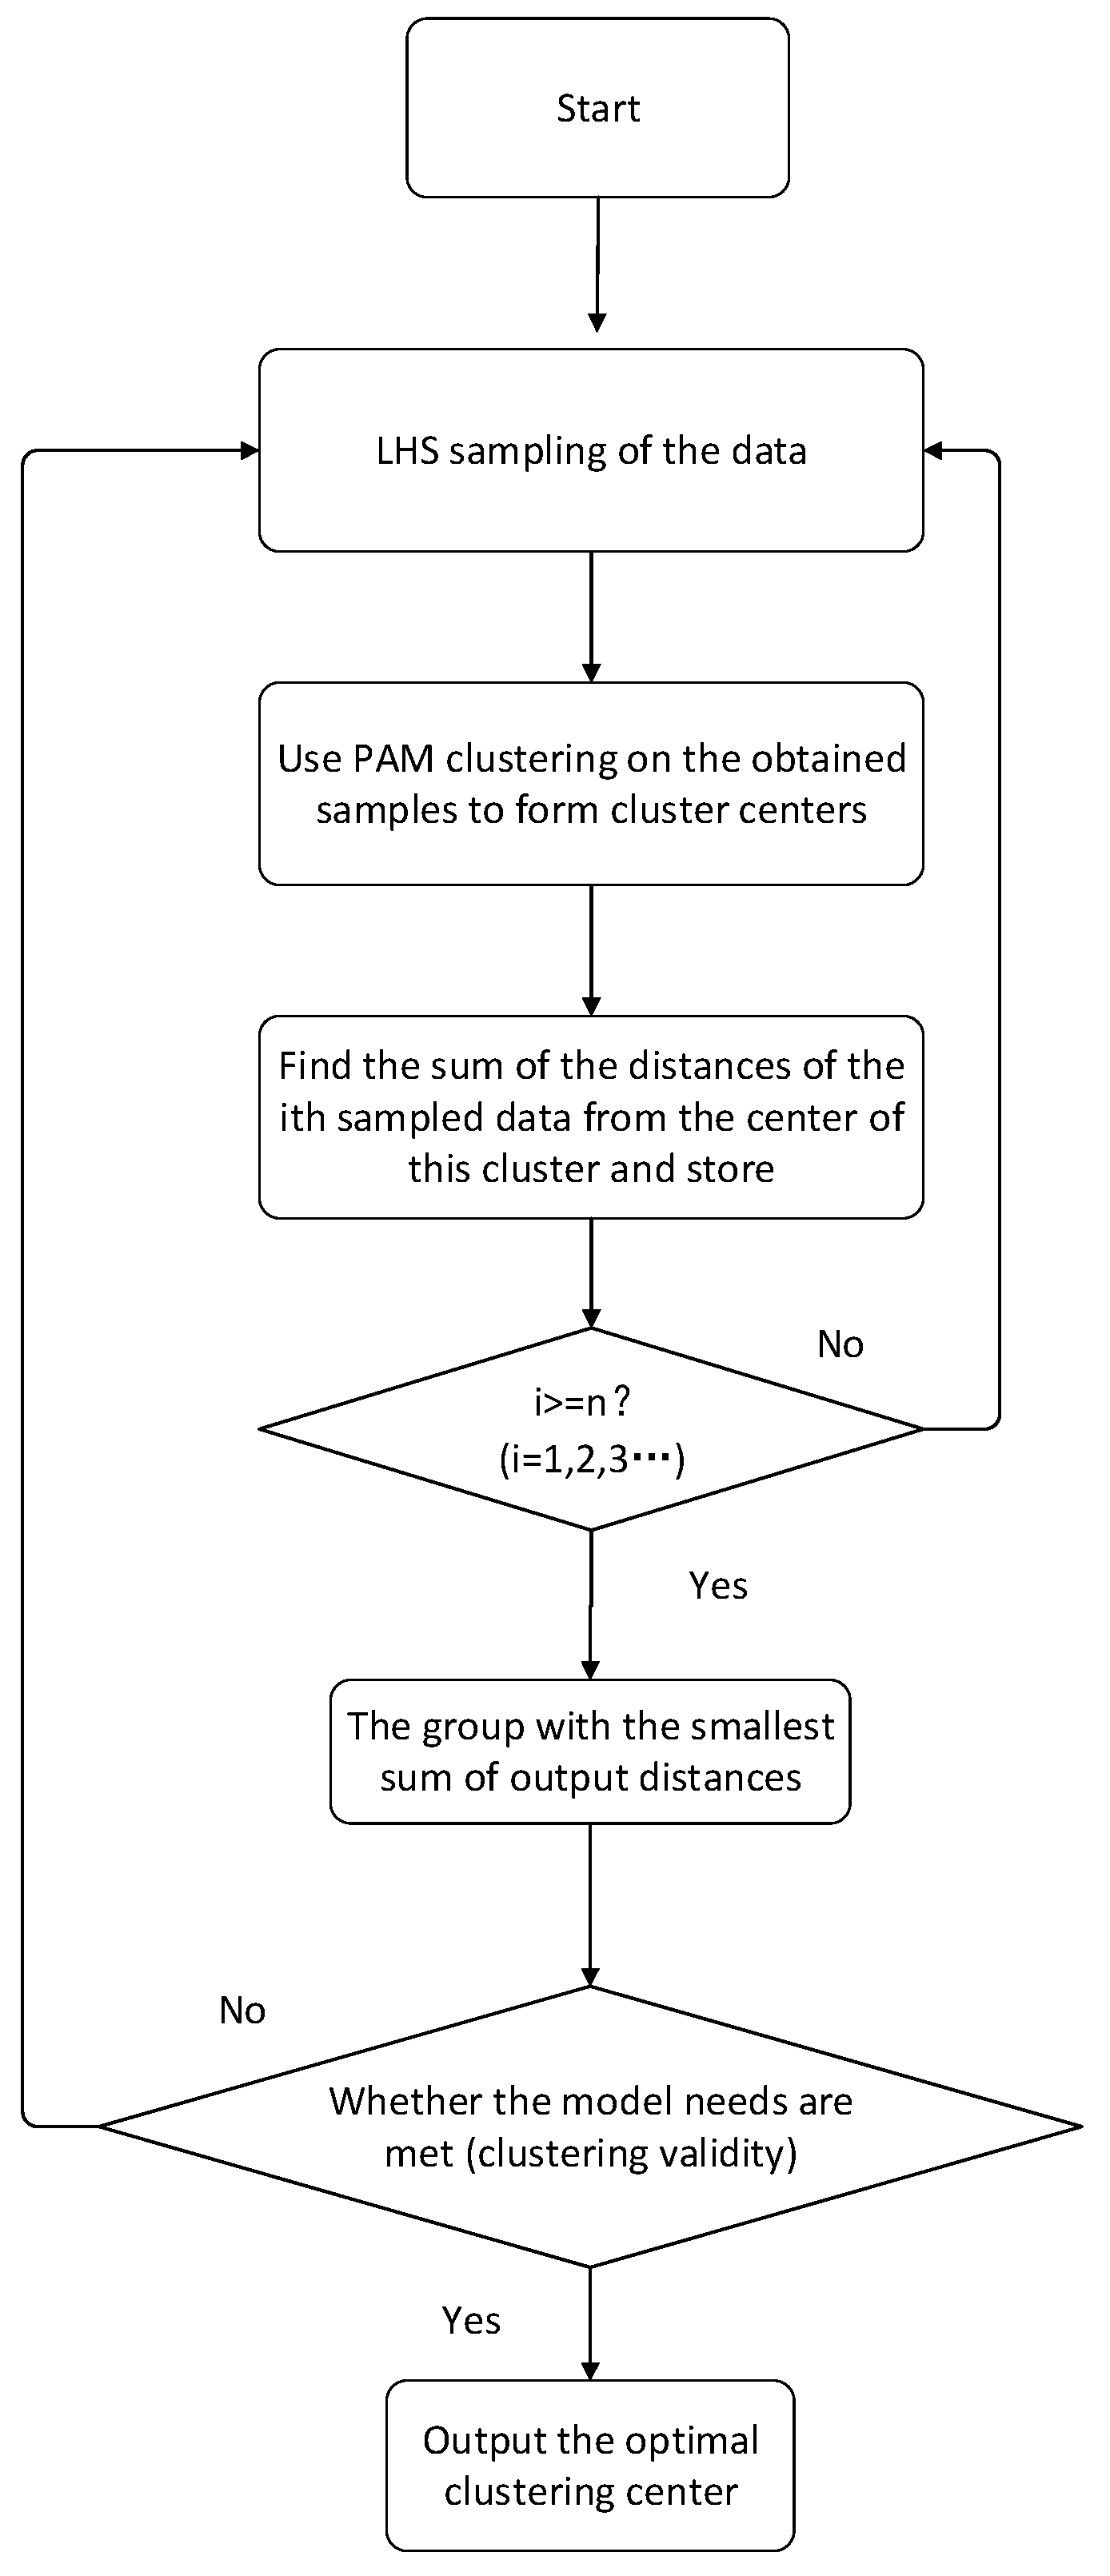
3.2. Improved CLARA Clustering Algorithm

The CLARA clustering algorithm is a k-centroid clustering algorithm, which is a clustering algorithm proposed to deal with larger data sets.
The CLARA clustering algorithm first uses random sampling to randomly select a small fraction of the sample size at a time for PAM clustering, and then the remaining samples are grouped according to the minimum central distance. Among the results of each repetitive sampling clustering, the result with the smallest error, i.e., the centroid substitution cost, is selected as the final result. The core is, firstly, the large-scale data are sampled several times, and each sampled sample is clustered by PAM, and then the cluster centers of the multiple sampled samples are compared to select the optimal cluster center.
Algorithm disadvantage: The validity of CLARA depends on the size, distribution, and quality of the sample, so the algorithm will depend, to some extent, on the quality of the initial sampling. In addition, CLARA’s algorithm is to determine the center and then not to change it, which will have a certain element of luck. Suppose the k objects determined are far from the best center; then, CLARA will not get the best clustering center in the end how to choose the center.
Improvement: Considering the shortcomings of the CLARA algorithm, an improved CLARA clustering algorithm is proposed by combining the characteristics of Latin hypercube sampling. The random sampling in the first step of the CLARA clustering algorithm is replaced by Latin hypercube sampling, and the characteristics of stratified sampling of Latin hypercube sampling are used to stratify the wind power and PV output scenario samples, and then some samples are taken from each stratum for CLARA clustering, and the whole sample is covered by using limited and non-repetitive sampling. This method improves the accuracy of CLARA clustering results to a certain extent.
The steps to improve the CLARA algorithm are as follows.
(1)
Multiple Latin hypercube sampling of large-scale data to obtain the sampled samples is conducted.
(2)
PAM clustering of each sampled sample is conducted to obtain multiple sets of clustering centers.
(3)
The sum of distances from the center of each group of clusters to all other points is found.
(4)
The minimum value of the distance sum of these groups is found, and the group with the smallest distance sum is the optimal clustering center.
(5)
The large-scale data are then clustered by distance to this set of optimal clustering centers.
The flow chart of the improved CLARA algorithm is shown in Figure 1 below.

4. Optimal Scheduling of VPP Considering Carbon Trading

4.1. Objective Function

In this paper, the objective function is to maximize the net benefit and minimize the carbon emission of the virtual power plant.
(1)
Net income from VPP
F = max s = 1 N α ( s ) ( P s + R s C s )
where F denotes the net income of the VPP. N indicates the number of classical scenes. α ( s ) denotes the probability of occurrence of scenario s. P s denotes the gain of the VPP in scenario s. R s denotes the gain of the VPP in scenario s. C s denotes the cost of the VPP in scenario s.
where P s can be expressed as:
P s = t = 1 24 A 1 , t ( P P W , t s + P P V , t s + P G T , t s + P D i s c h arg e , t s + P S e l l , t s - P C h arg e , t s - P B u y , t s )  
where t represents the time series. A 1 , t denotes the price of electricity sold in time period t. P P W , t s , P P V , t s , P G T , t s , P D i s c h arg e , t s , and P C h arg e , t s denote the power of wind power generation, photovoltaic power generation, gas turbine, energy storage, etc., at time t under scenario s, respectively. P S e l l , t s and P B u y , t s denote the power sold and power bought by the VPP to the main grid at moment t under scenario s, respectively.
C s = C o m , t s + C e s , t s + C p u , t s
C o m , t s = t = 1 24 [ E o m , P W P P W , t s + E o m , P V P P V , t s + E o m , G T P G T , t s + E o m , B a t t t r y ( P D i s c h arg e , t s P C h arg e , t s ) ]
C e c , t s = t = 1 24 P G T P G T , t s
C p u , t s = n = 1 24 A 2 , t D n P P W , t s P P V , t s P G T , t s P D i s c h a r g e , t s
where C O m , t s , C e s , t s , and C p u , t s denote operation and management costs, energy costs, and penalty costs, respectively. E o m , P W , E o m , P V , E o m , G T , and E o m , B a t t t r y denotes cost factor. A 2 , t denotes the purchased electricity price for time period t. P G T denotes the gas turbine unit fuel cost for electricity generation and the gas turbine unit cost of electricity generation [28].
P G T = P N G η L N G
where P N G denotes the price of natural gas. η indicates power generation efficiency. L N G denotes the low-level calorific value of natural gas.
The VPP declares capacity plans to the grid.
D = { D P W + D P V + η P G T , t max ; A 2 , t > P G T , t D P W + D P V ; A 2 , t < P G T , t
where D P W and D P V denote the planned output of wind power and photovoltaic power, respectively, in time t. P G T , t max indicates the maximum output power of the gas turbine.
(2)
Carbon Emissions
Only the gas turbine units in the virtual power plant can generate carbon emissions, and also taking into account the carbon emissions generated by the portion of electricity purchased by the virtual power plant from the main grid, the carbon emissions of the virtual power plant can be expressed as:
Q C O 2 = Q m + Q g
where Q m denotes the carbon emissions from the gas turbine. Q g indicates the carbon emissions generated by purchasing electricity from the main network.
Q m = s = 1 N t = 1 T a + b P G T , t s + c ( P G T , t s ) 2
Q g = s = 1 N t = 1 T P B u y , t s γ c o 2 π c o 2
where a , b , and c denote the carbon emission factors of gas turbine power generation. γ c o 2 and π c o 2 denote the average share of carbon-containing power sources and the carbon emission factor per kWh, respectively. Currently, China’s coal-fired thermal power accounts for 70% and the carbon emission factor per kWh is about 0.997 (meaning that for every 1 kWh of electricity generated, 0.997 kg of CO2 is produced).

4.2. Binding Conditions

(1)
Power balance constraint
D t + P C h arg e , t s = P P W , t s + P P V , t s + P G T , t s + P D i s c h arg e , t s
where D t denotes the amount of electricity interacting between the VPP and the grid at time t.
(2)
Gas turbine constraint
P G T , min P G T , t s P G T , max
where P G T , max and P G T , min represent the upper and lower extremes of the gas turbine during normal operation, respectively.
(3)
Gas turbine climbing rate constraint
R g A Δ t P G T , t s P G T , t 1 s R g B Δ t
where R g A and R g B represent the upward climb rate and downward climb rate of the gas turbine, respectively.
(4)
Battery Capacity Constraints for Energy Storage Systems
The energy storage system must comply with the law of conservation of energy in the process of dispatching, i.e., the electrical energy stored now is equal to the sum of the electrical energy stored in the previous moment and the charging and discharging energy in the process of two moments. That is:
S c a , t s = S c a , t 1 s + Δ t ( η 1 P C h arg e , t s - P D i s c h arg e , t s / η 2 ) E b a t
It is also necessary to satisfy Equation (29).
S c a , min S c a , t s S c a , max
where S c a , t s and S c a , t 1 s denote the capacity of the energy storage battery at time t and time t − 1, respectively. ∆t denotes the time interval. η 1 and η 2 denote the charging efficiency and discharging efficiency, respectively. E b a t denotes the installed capacity of the energy storage system. S c a , max and S c a , min represent the upper and lower extremes of the energy storage capacity, respectively.
(5)
Charging and discharging constraints of energy storage batteries
P C h arg e , min P C h arg e , t s P C h arg e , max
P D i s c h arg e , min P D i s c h arg e , t s P D i s c h arg e , max  
M C h arg e , t s + M D i s c h arg e , t s 1  
where P D i s c h arg e , max and P D i s c h arg e , min represent the upper and lower extremes of the charging power of the energy storage system, respectively. P D i s c h arg e , max and P D i s c h arg e , min represent the upper and lower extremes of the discharge power of the energy storage system, respectively. M C h arg e , t s and M D i s c h arg e , t s denote the charging and discharging state variables of the energy storage system at time t under scenario s, taking the values 0 or 1, respectively.

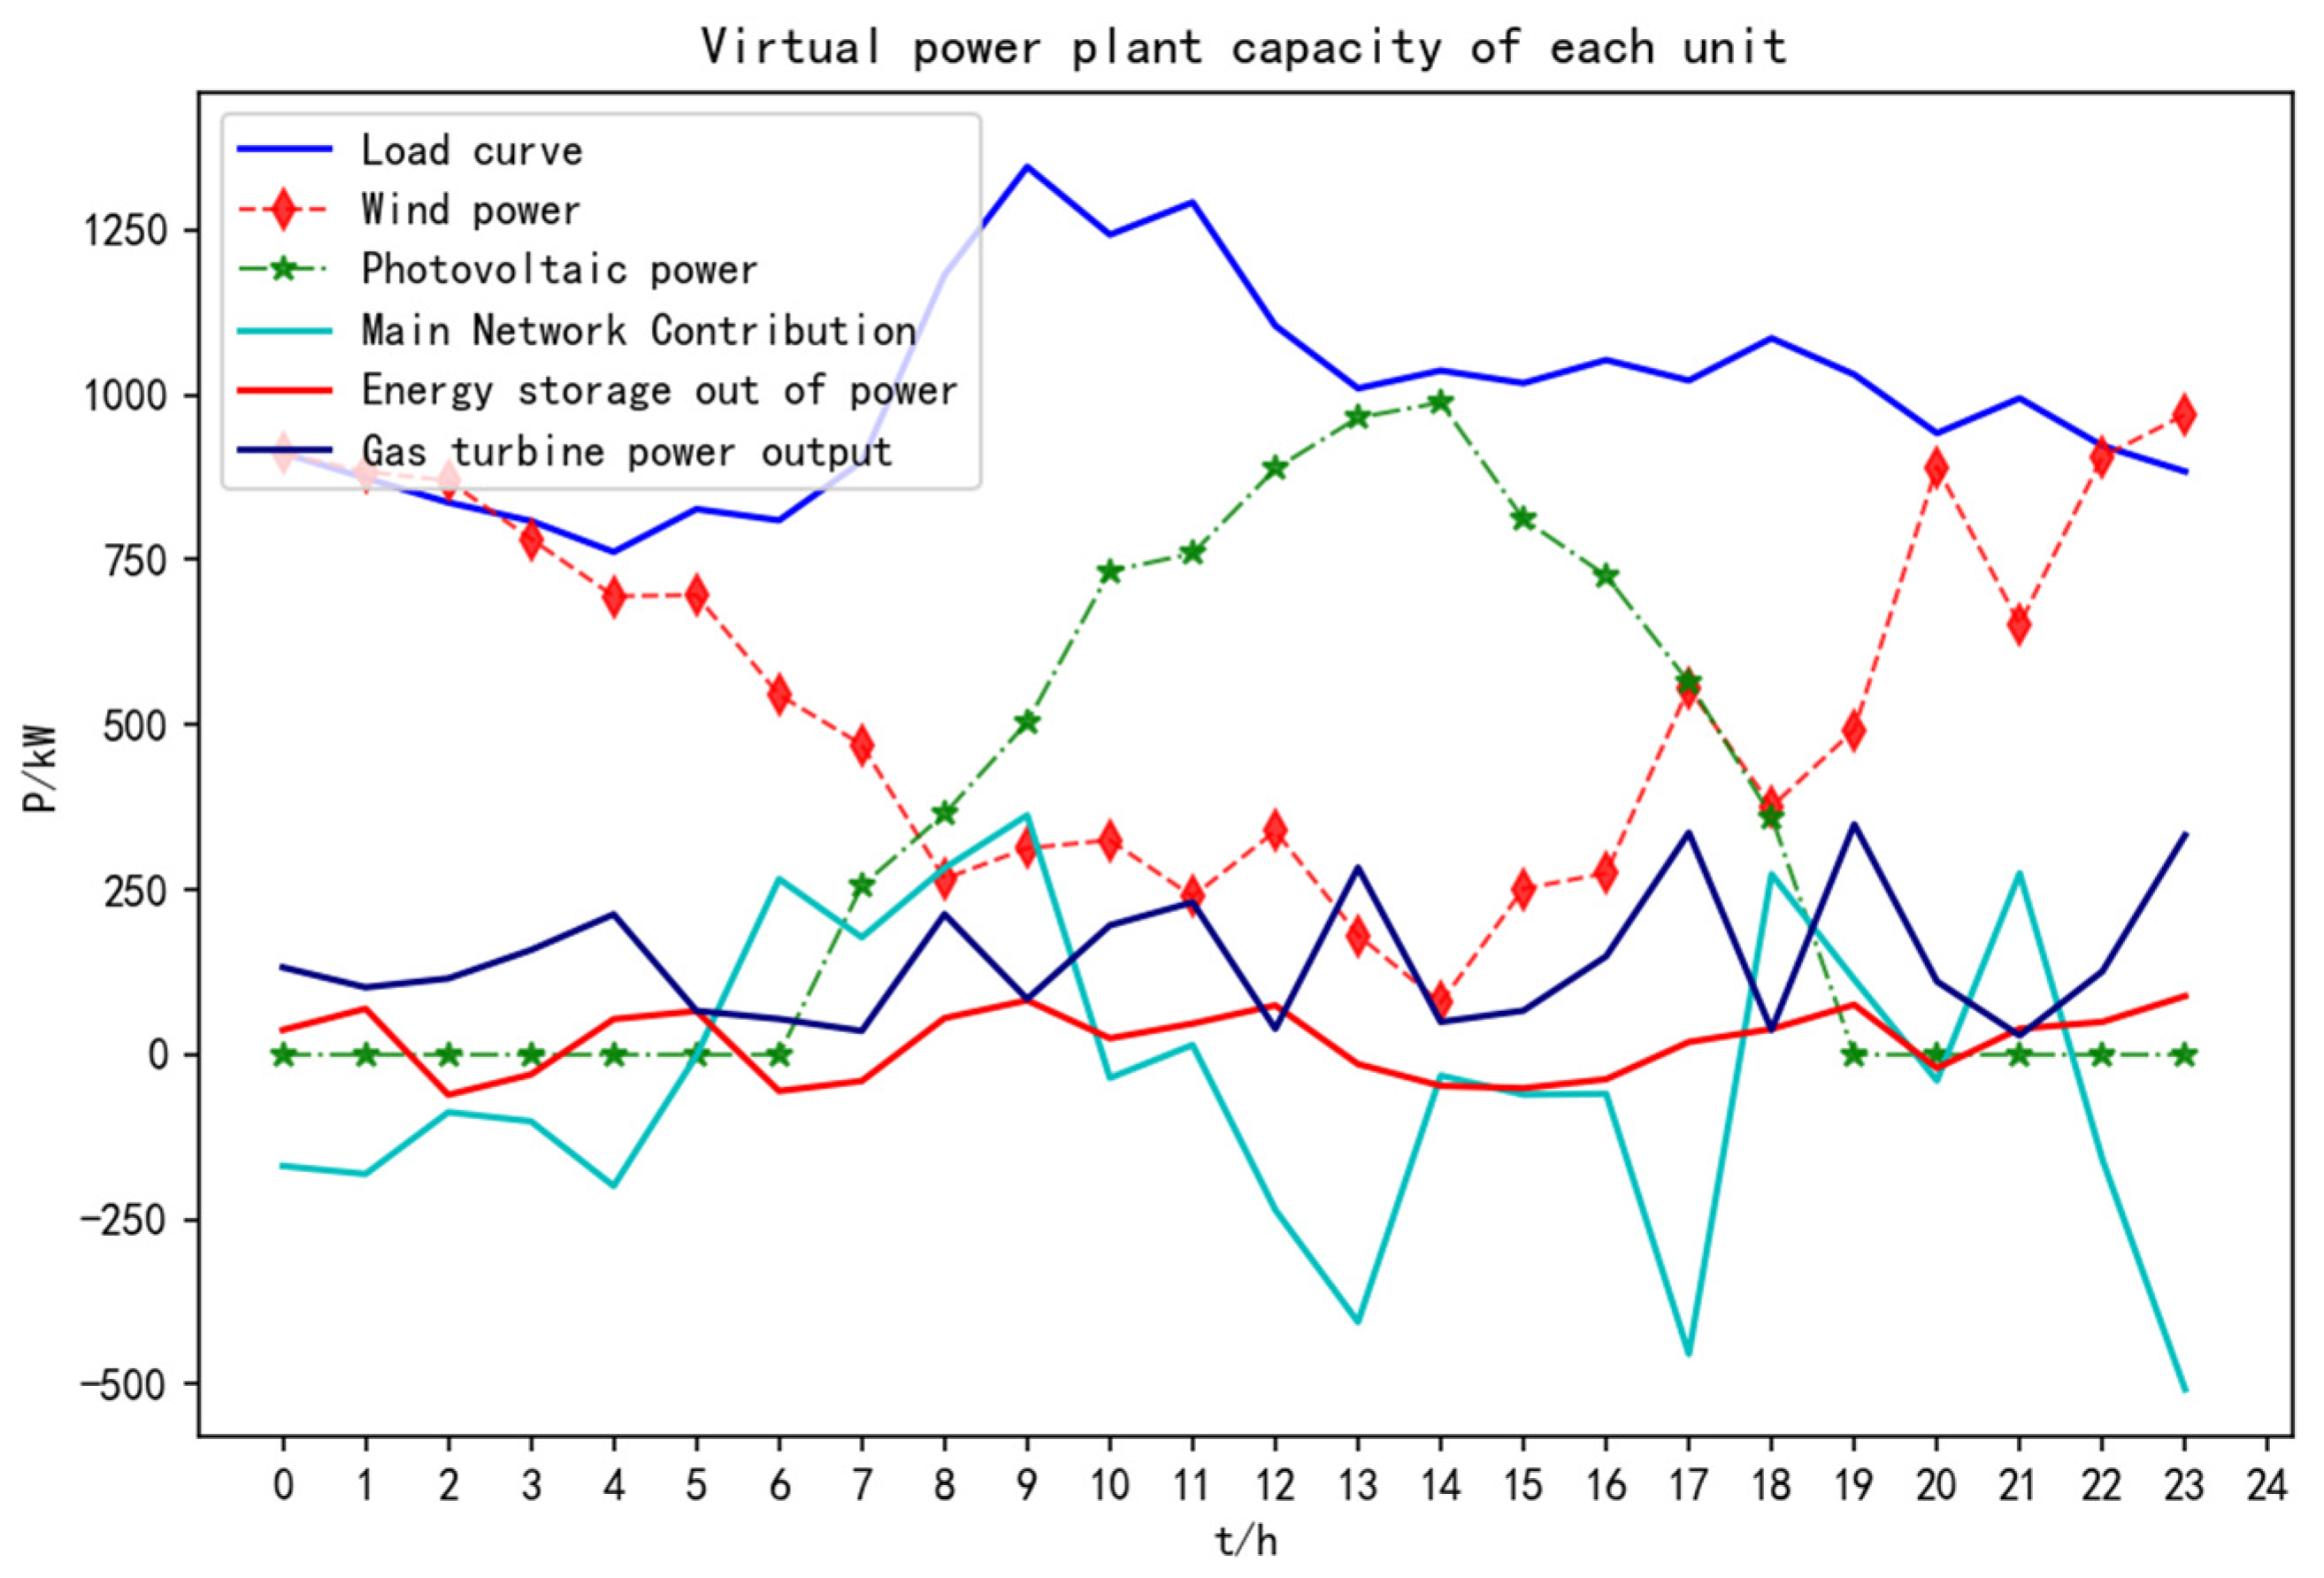
5. Simulation Example

5.1. Case Setup

A virtual power plant was selected to contain a 400 kW combustion turbine, a 1000 kW wind turbine, a 1000 kW photovoltaic unit, and an energy storage system with a rated capacity of 1600 kWh, and detailed parameter information is shown in Table 1, Table 2, Table 3 and Table 4.
The time-sharing tariff is selected for non-summer commercial and industrial and other electricity consumption in Shanghai as shown in Table 5, and each distributed energy operation and management cost coefficient is referred to in the literature [29]. In this paper, a typical daily load curve of a location is selected as the load forecast, and the results are shown in Figure 2.
Based on the historical data of wind speed and light at a certain location, Latin hypercube sampling is used to generate scenes, and then the improved CLARA clustering algorithm is used for scene reduction, and the optimal number of clusters is calculated as 4 using the elbow method, i.e., the number of classical scenes for wind power output and PV output is 4 each.
As shown in Figure 3 and Figure 4, the four wind power and photovoltaic output curves and their probabilities of occurrence obtained by the Latin hypercube sampling algorithm and the improved CLARA clustering algorithm (Figure 5 and Figure 6) show that these four output cases can accurately represent all wind power and photovoltaic output possibilities, and thus the uncertainty of wind power and photovoltaic output can be transformed into certainty by this method. This method can, to a certain extent, solve the problem of wind and photovoltaic power output fluctuations due to climate effects.
From Figure 5 and Figure 6, it can be seen that these four output scenarios cover all possible output scenarios of wind power and photovoltaic, among which wind power has the highest possibility of working under scenario 3 and photovoltaic has the highest possibility of working under scenario 1. Therefore, in the scheduling, the output curves of wind power and photovoltaic can be combined according to the probability of the output of these four scenarios by appropriately selecting the weight values, thus solving the problem that the output of wind power and photovoltaic is difficult to predict.
Compared with the fuzzy clustering algorithm, the improved CLARA algorithm based on LHS proposed in this paper is more suitable for occasions with larger sample data. The fuzzy clustering algorithm may be difficult to handle data with larger sample size due to its relatively large computation. In terms of computational accuracy, the improved CLARA is also more accurate, while fuzzy clustering may lead to local convergence or non-convergence for some reasons. Figure 7 and Figure 8 show the classical output scenarios of wind power and PV obtained using fuzzy clustering.
By comparing Figure 9 and Figure 5, it can be seen that the probability of the wind farm obtained by fuzzy clustering is too average, which we do not want to see. We know that when the clustering effect is better, the probability obtained will be particularly high. When the ideal clustering effect is reached, the probability will be close to one, which means that the clustering result is accurate. Similarly, comparing Figure 10 and Figure 6, the same conclusion can be drawn. Therefore, the proposed CLARA algorithm based on the LHS algorithm is more widely used and more accurate than fuzzy clustering.

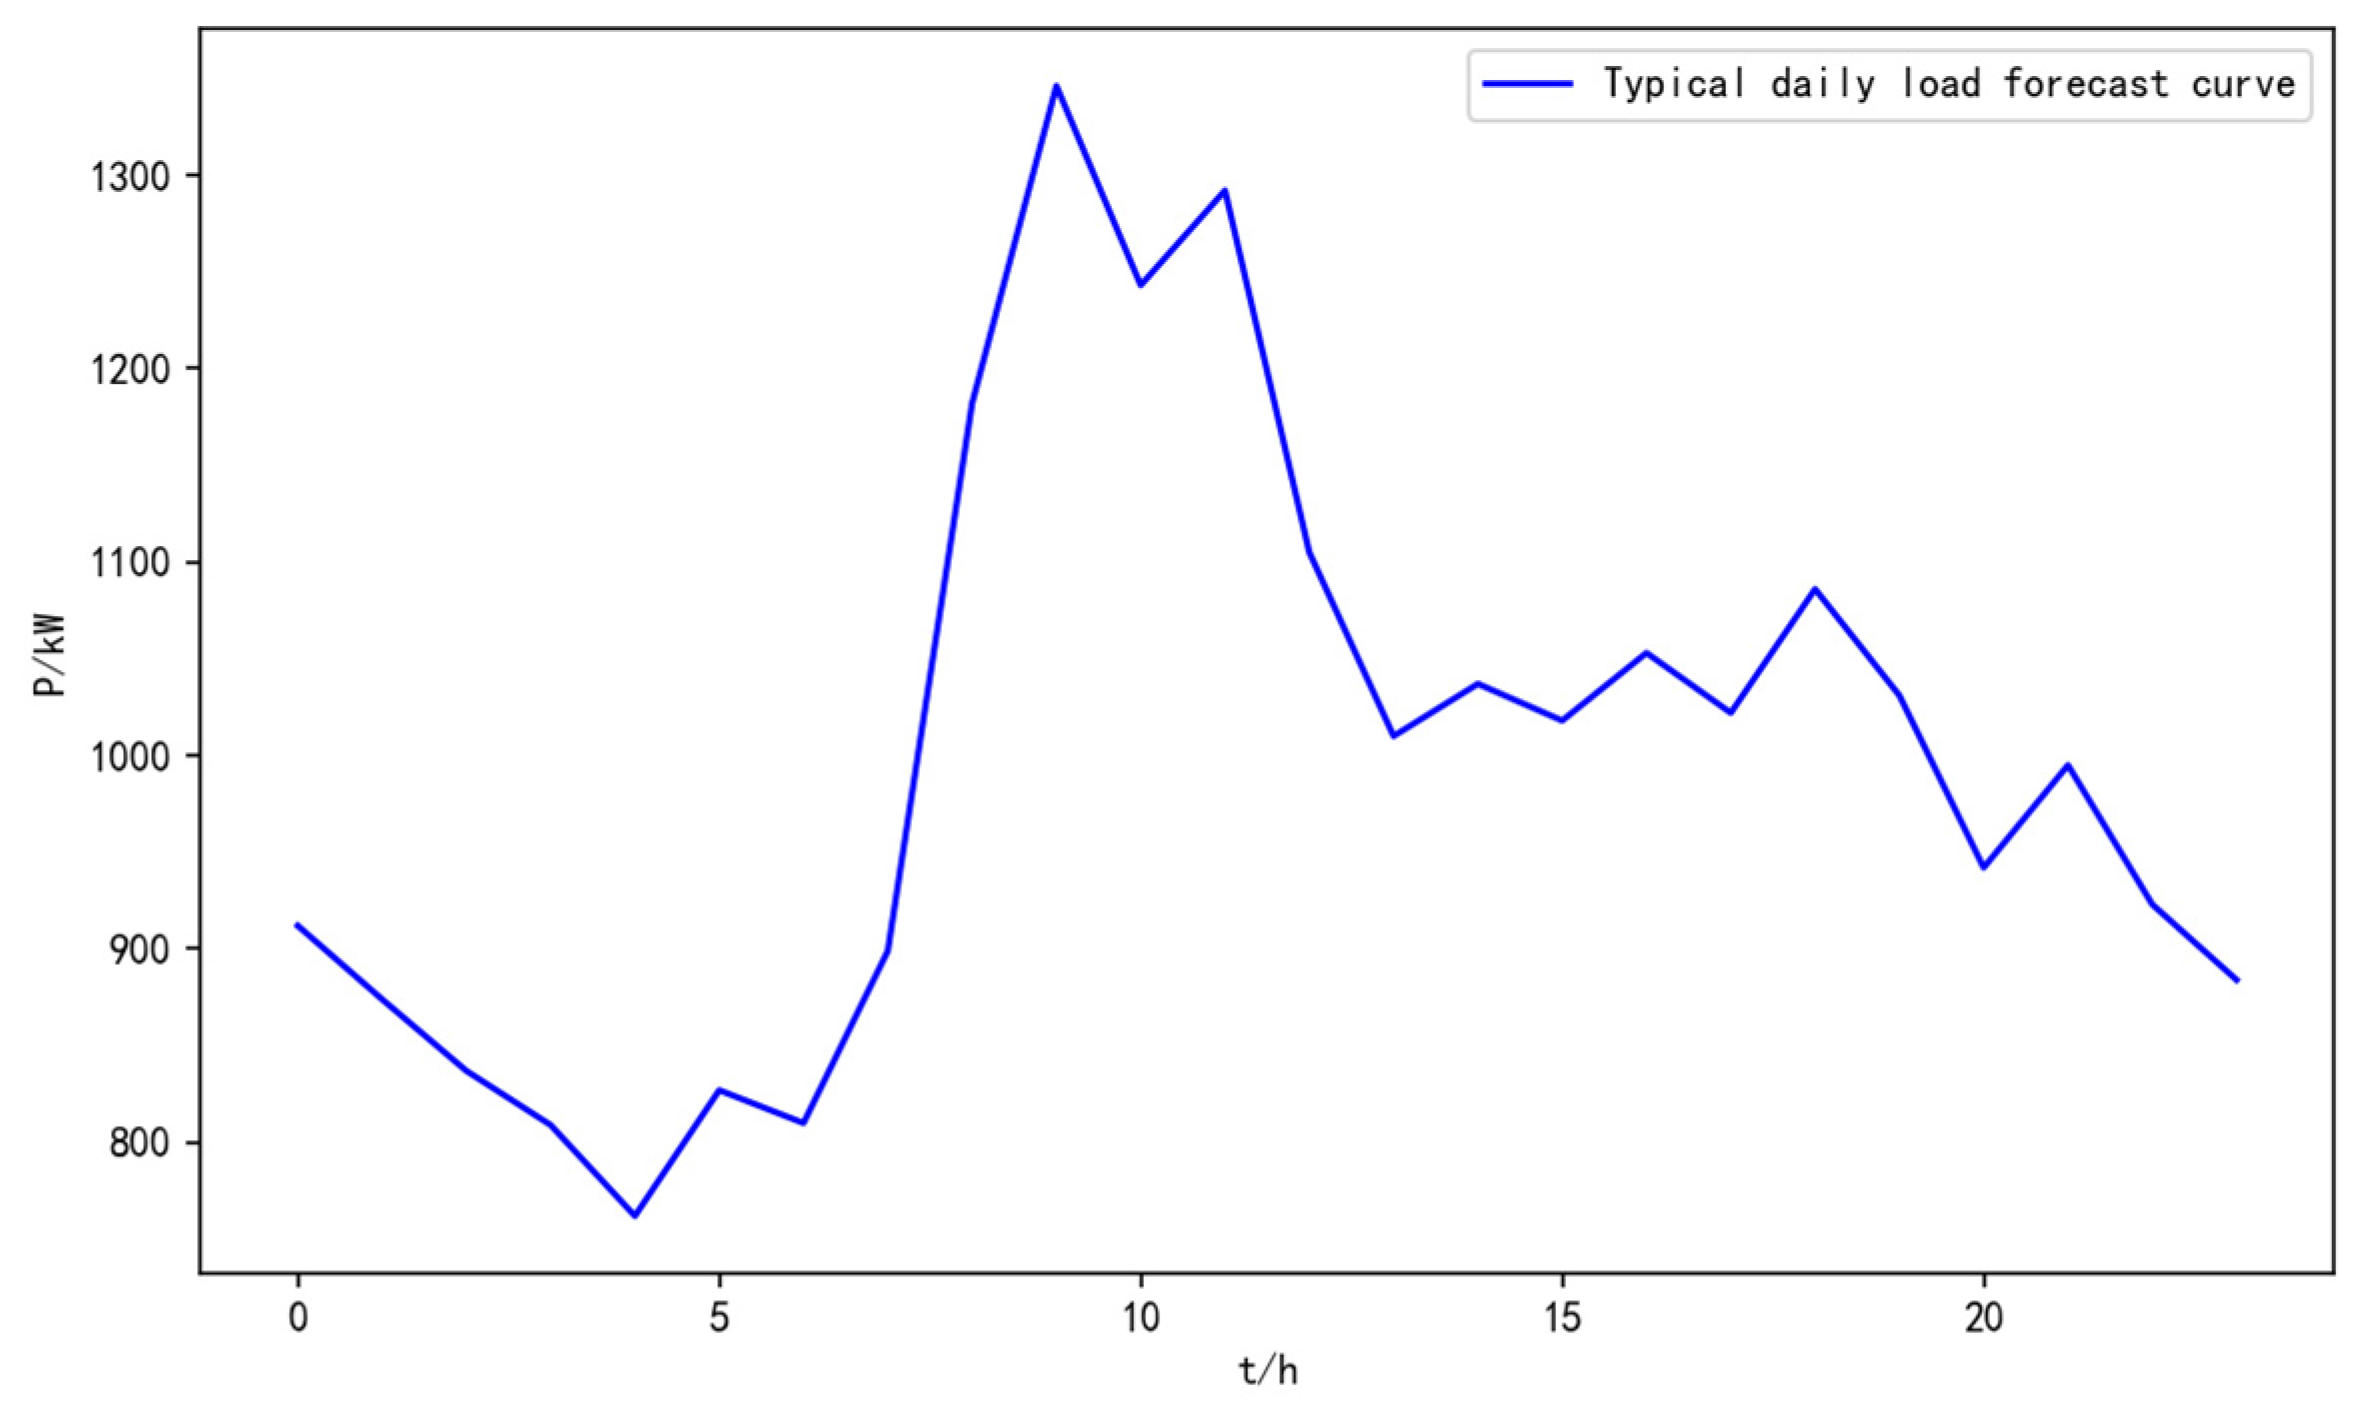
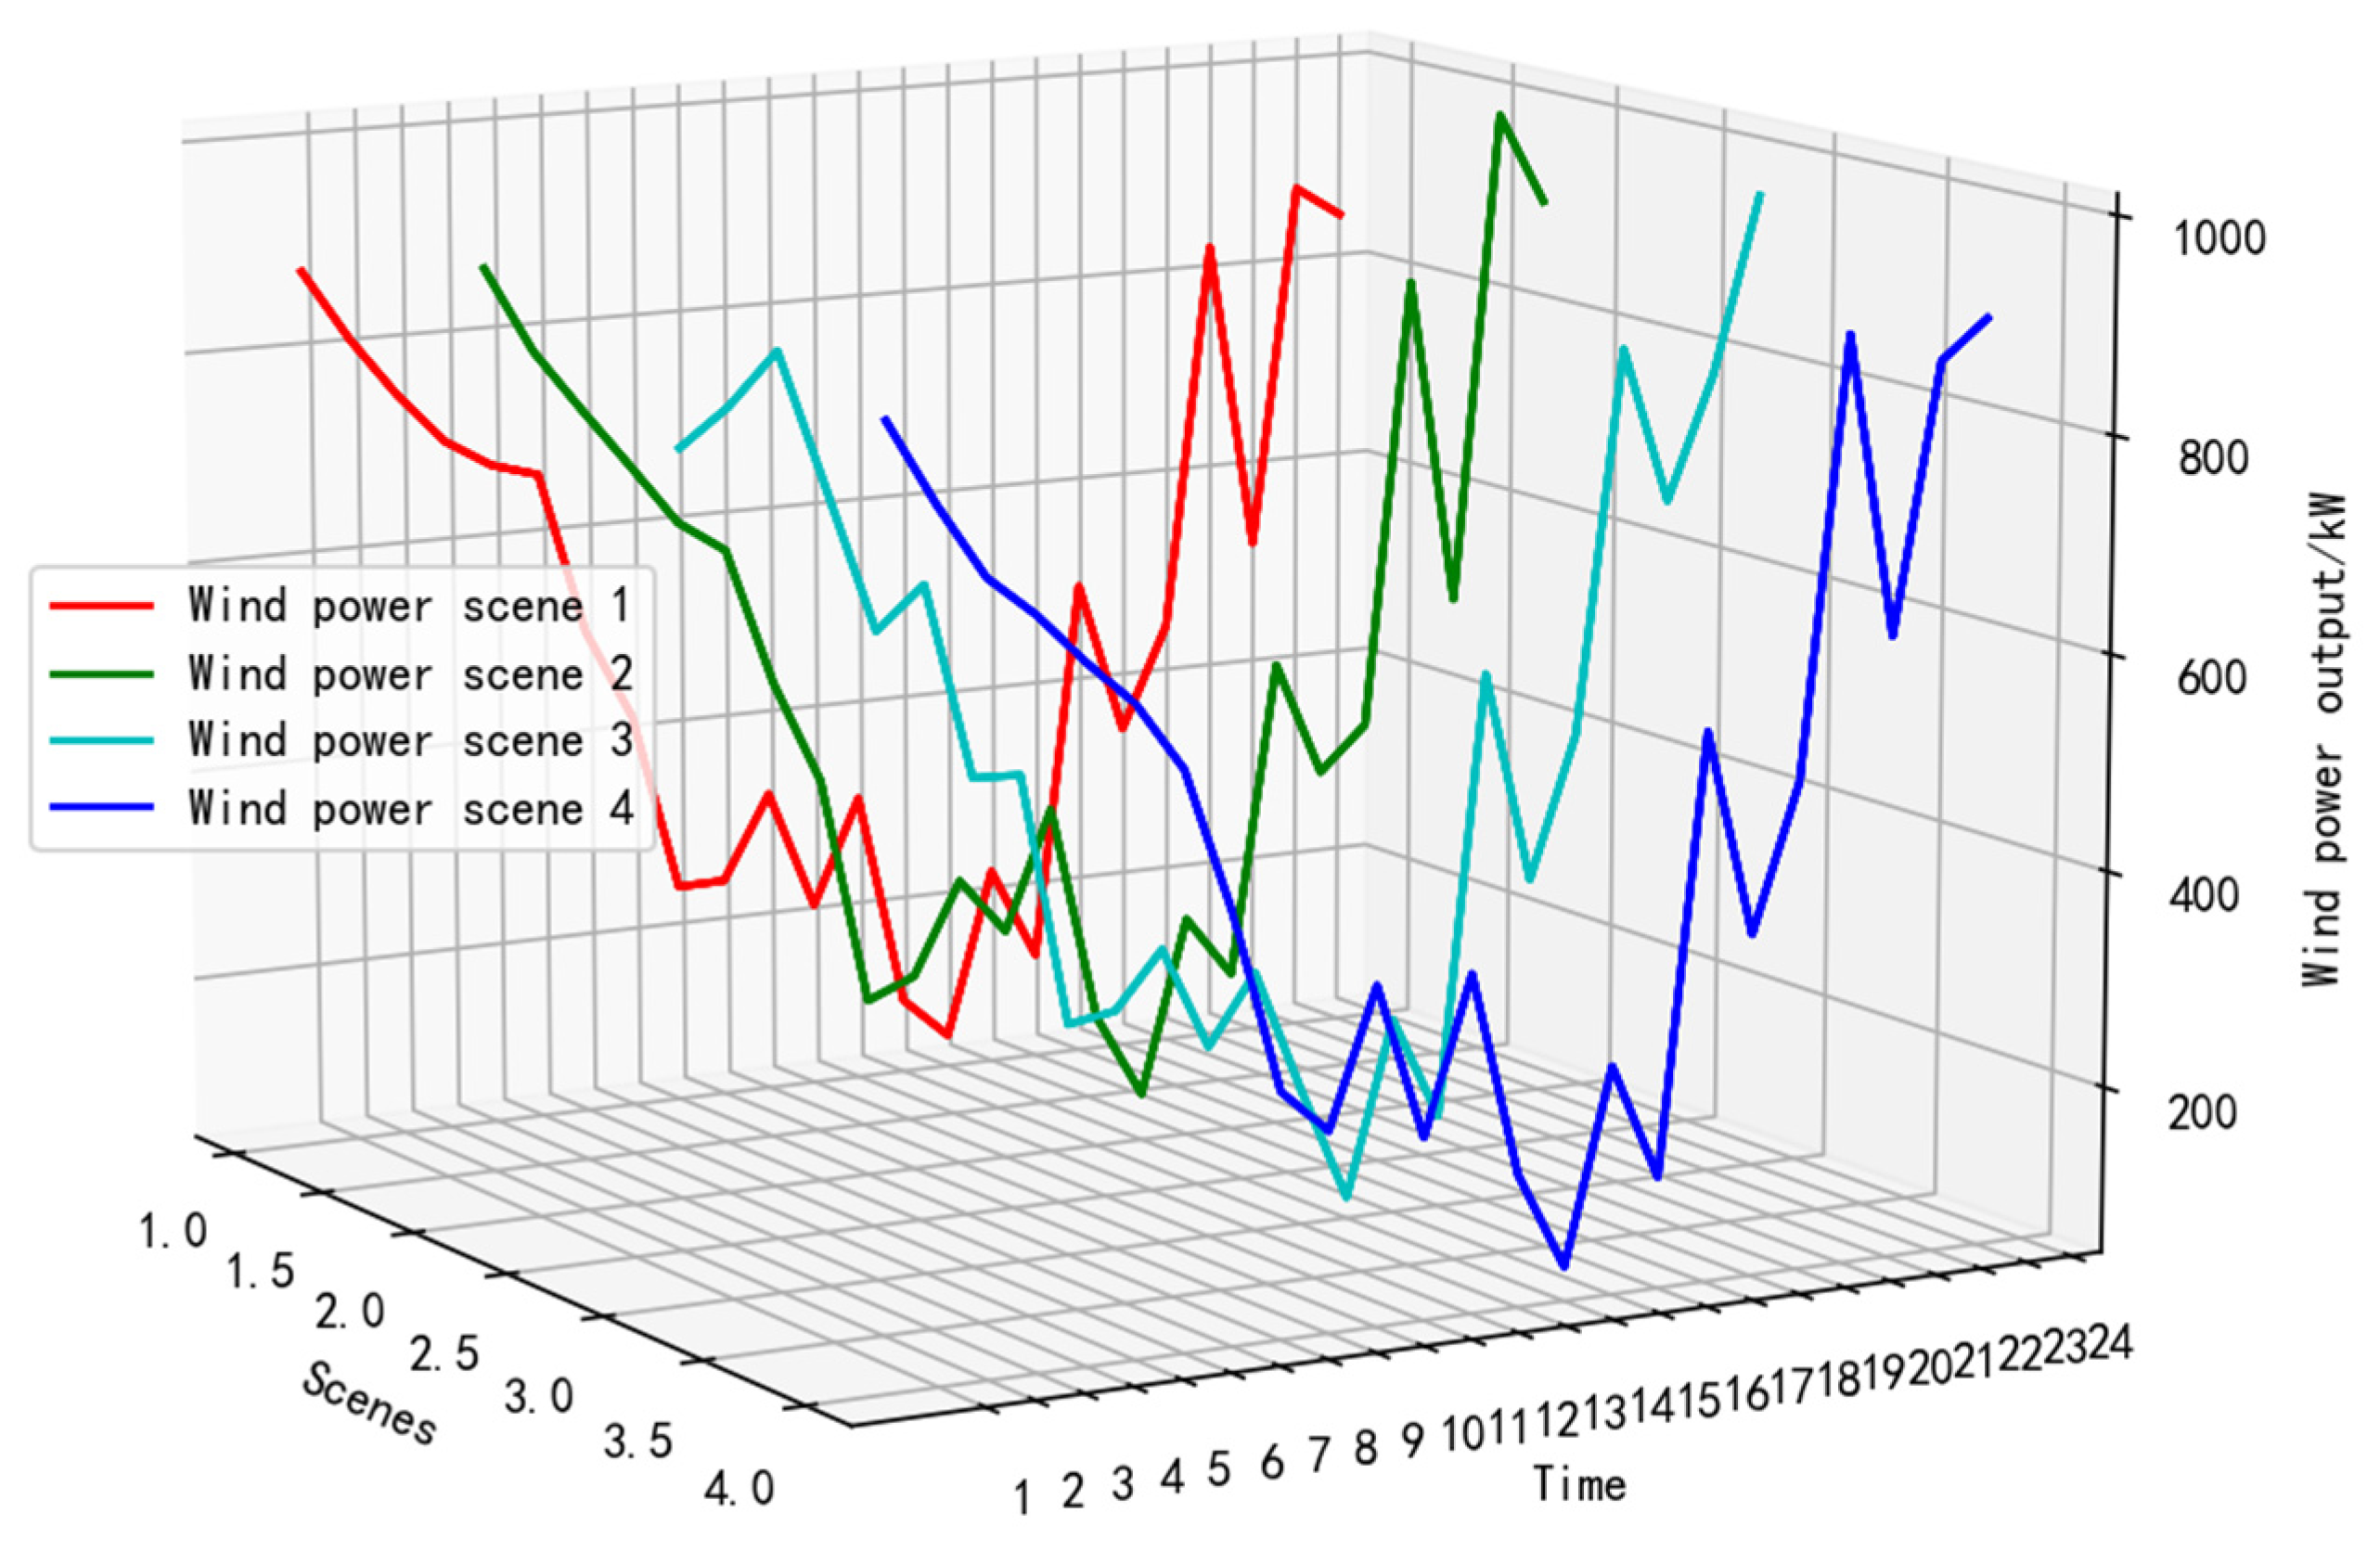
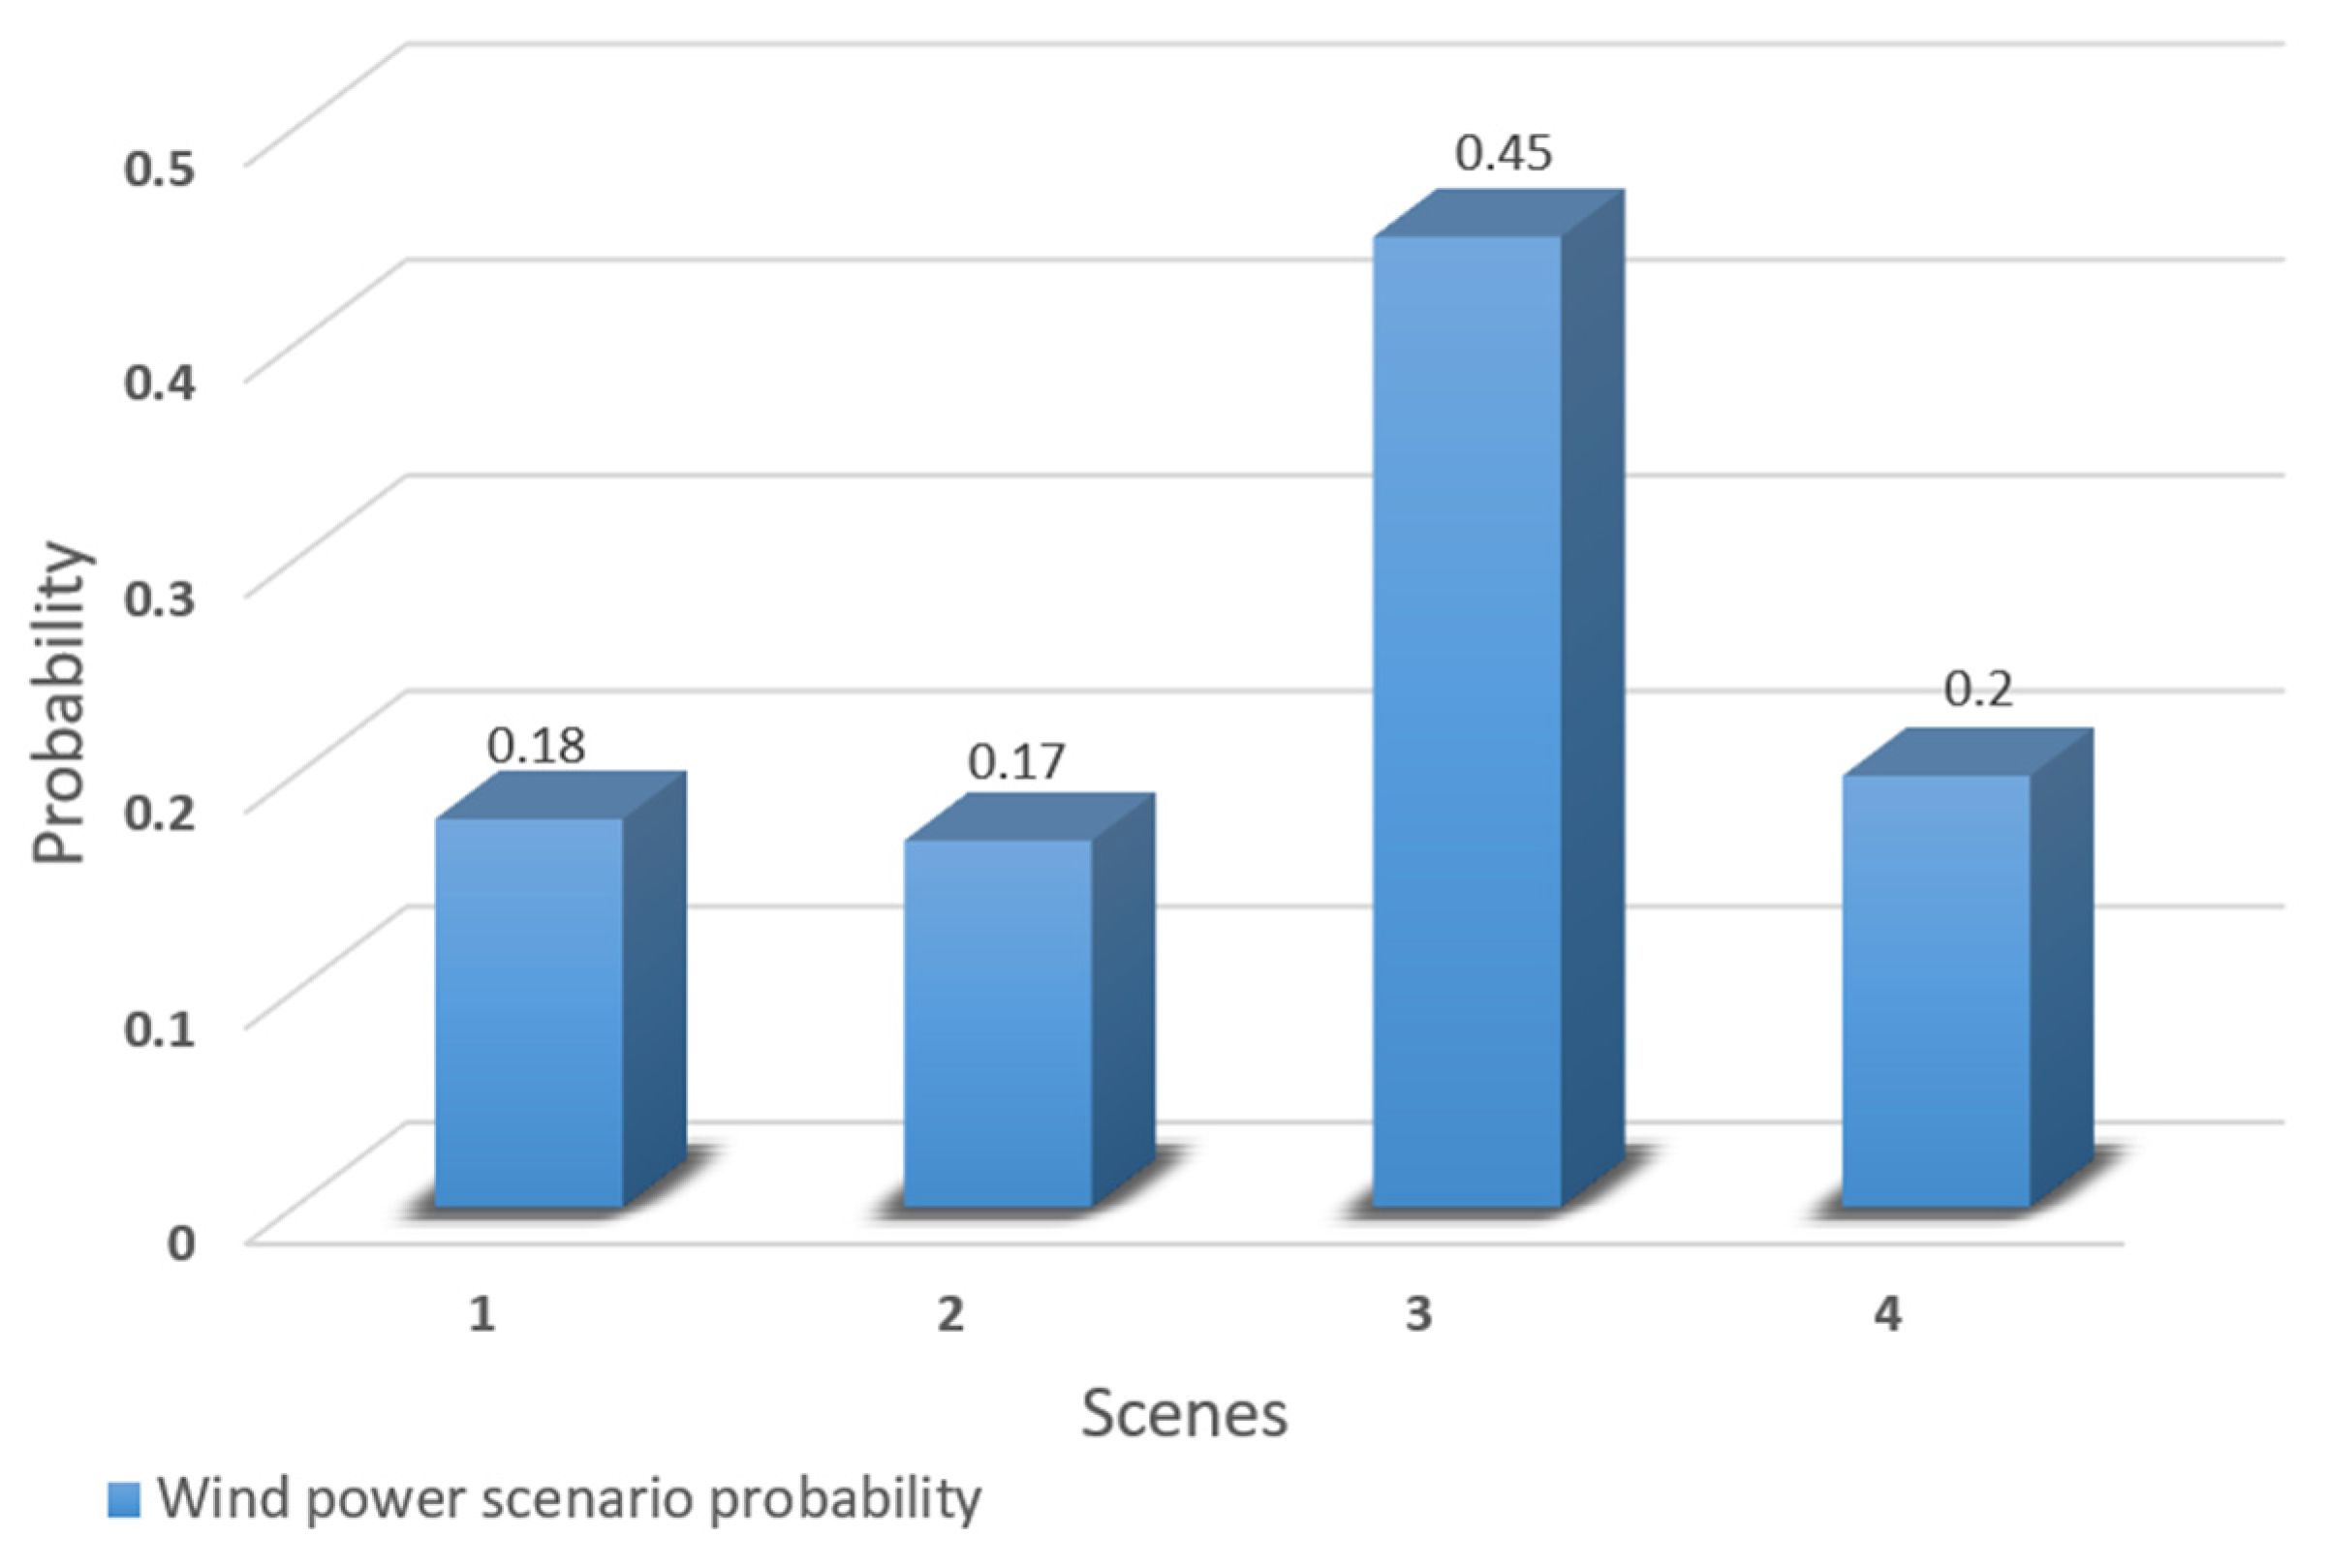
5.2. Simulation Results and Analysis

According to the established model, two operation modes are set up, the first one considers carbon-trading mechanism; the second one does not consider the carbon-trading mechanism. The improved particle swarm optimization algorithm is applied to solve for the two operation modes, and the net benefits and carbon emissions of the virtual power plant under the two operation modes are shown in Table 6.
As can be seen from Table 6, the net profit of the virtual power plant increases while the carbon emissions decrease when carbon trading is considered. It shows that the virtual power plant model considering carbon trading balances economy and environmental protection, which promotes energy saving and emission reduction of the virtual power plant while also improving the profit of the virtual power plant.
Without considering carbon trading, the output of each component of the virtual power plant in one dispatch cycle (24 h) is shown in Figure 6.
From Figure 11, it can be seen that in the period of 22:00–5:00 of the next day, the electricity price is in the valley time, but the cost of gas turbine generation is less than the electricity price at this time, so the gas turbine does not shut down but continues to work and sells the electricity generated to the grid to earn profit. During the period of 6:00–11:00, wind, PV, and gas turbines are not enough to meet the load requirements due to the increase in load, so they have to buy electricity from the grid. At 11:00–18:00, due to the higher PV output at this time, and wind and PV output is sufficient to meet the load requirements, so the gas turbine continues to sell power to the grid at this time. At 18:00–22:00, the PV is not producing and the wind power is not sufficient to meet the load requirements, so the gas turbine continues to work while buying power from the grid.
The treatment of the various components of the virtual power plant, considering carbon trading, is shown in Figure 11.
As shown in Figure 12, in order to reduce carbon emissions, gas turbine output increases and the VPP minimizes buying electricity from the main grid, because the carbon emissions from gas turbines are much smaller than those from coal-fired thermal power in the distribution network for the same amount of electricity generated. At the same time, the gas turbine output can obtain more carbon emission allowances, and according to the carbon-trading mechanism, the excess carbon emission allowances can be sold according to the carbon-trading price to improve the revenue of the virtual power plant.

6. Conclusions

(1)
A virtual power plant model that takes into account the economic line and environmental protection is established. Considering the uncertainty of wind power and PV output, Latin hypercube sampling and an improved CLARA clustering algorithm are applied to generate classical scenario sets to reduce the influence of wind power and PV output volatility.
(2)
A carbon-trading mechanism and a time-sharing tariff are introduced, and two different scenarios are set up for comparison and analysis through arithmetic simulation. In the classical scenario set, the optimal scheduling of the VPP considering the carbon-trading mechanism can reduce carbon emissions while increasing the net benefit of VPP. As shown in Table 6, compared to the VPP without carbon trading, the net profit of the VPP with carbon trading increased by 10.03% and CO2 emissions decreased by 17.36%.
(3)
Under the goal of “Carbon peak, Carbon neutral”, a large amount of wind power and photovoltaic power generation connected to the grid is an important means to achieve energy saving and emission reduction. The introduction of carbon trading can promote the energy saving and emission reduction of the grid, and also improve its economy.

Author Contributions

W.C. and S.W. completed the modeling of the VPP and the simulation and reduction in the wind power PV output scheme. S.W. completed the debugging of the algorithm, S.W. completed the graphing, and M.X. read the paper and corrected the syntax errors. All authors have read and agreed to the published version of the manuscript.

Funding

This work was supported by the Educational Reform Project of Henan Province (2021SJGLX078Y), the Program of Key Scientific Research Projects in Higher Education Institutions of Henan Province (19A470006) and the Training Program for Young Backbone Teachers in Higher Education Institutions of Henan Province (2019GGJS104).

Data Availability Statement

The data that support the findings of this study are available from the corresponding author upon reasonable request.

Conflicts of Interest

The authors declare that the research was conducted in the absence of any commercial or financial relationships that could be construed as a potential conflict of interest.

References

  1. Fang, Y.; Ai, Q.; Fan, S. A review of VPP research. Power Supply 2016, 33, 8–13. [Google Scholar]
  2. Xia, Y.; Liu, J. A review of VPP research based on distributed generation. Power Autom. Equip. 2016, 36, 100–106+115. [Google Scholar]
  3. Min, C. Distributed cooperative control technology for VPP. Electron. Technol. Softw. Eng. 2021, 12, 208–209. [Google Scholar]
  4. Hropko, D.; Lvanecky, J.; Turcek, J. Optimal dispatch of renewable energy sources included in VPP using Accelerated particle swarm optimization. In Proceedings of the ELEKTRO, Rajecke Teplice, Slovakia, 21–22 May 2012; pp. 196–200. [Google Scholar]
  5. Kuzle, I.; Zdrilic, M.; Pandzic, H. VPP dispatch optimization using linear programming. In Proceedings of the Environment and Electrical Engineering (EEEIC), Rome, Italy, 8–11 May 2011; pp. 1–4. [Google Scholar]
  6. Zdrilic, M.; Pandzic, H.; Kuzle, I. The mixed-integer linear optimization model of VPPoptimization. In Proceedings of the 8th International Conference on the European Energy Market (EEM), Zagreb, Croatia, 25–27 May 2011; pp. 467–471. [Google Scholar]
  7. Jiang, H.; Yang, Z.F.; Lin, W.; Yu, J. A VPP scheduling boundary probability distribution inscription method accounting for distributed new energy uncertainty[J/OL]. Chin. J. Electr. Eng. 2022, 42, 5565–5575. [Google Scholar] [CrossRef]
  8. Sun, L.; Han, S.; Wu, W.; Guo, X. Two-stage coordinated optimal scheduling of multiVPP based on economic model predictive control. Energy Storage Sci. Technol. 2021, 10, 1845–1853. [Google Scholar]
  9. Gao, M.; Zeng, P.-L.; Li, Y.-L.; Dai, Q. Optimal scheduling of VPP considering demand-side response. Power Sci. Eng. 2020, 36, 45–52. [Google Scholar]
  10. Hrvoje, P.; Igor, K.; Tomislav, C. VPP mid-term dispatch optimization. Appl. Energy 2013, 101, 134–141. [Google Scholar]
  11. Galusm, D.; Koch, S.; Andersson, G. Provision of Load Frequency Control by PHEVs, Controllable Loads, and a Cogeneration Unit. IEEE Trans. Ind. Electron. 2011, 58, 4568–4582. [Google Scholar] [CrossRef]
  12. Raab, A.F.; Ferdowsi, M.; Karfopoulos, E. VPP Control concepts with Electric Vehicles. In Proceedings of the Intelligent System Application to Power Systems (ISAP), Hersonissos, Greece, 25–28 September 2011; pp. 1–6. [Google Scholar]
  13. Binding, C.; Gantenbein, D.; Jansen, B.; Sundstrom, O.; Andersen, P.B.; Marra, F.; Poulsen, B.; Traeholt, C. Electric vehicle fleet integration in the danish EDISON project-AVPP on the island of Bornholm. In Proceedings of the Power and Energy Society General Meeting, Detroit, MI, USA, 24–29 July 2010; pp. 1–8. [Google Scholar]
  14. Wang, A.; Zhang, H.; Zhang, S. Game model of wind power and electric vehicles forming a VPP to participate in the electricity market. Power Syst. Autom. 2019, 43, 155–162. [Google Scholar]
  15. Vaya, M.G.; Andersson, G. Sself scheduling of Plug-In electric vehicle aggregator toprovide balancing services for wind power. IEEE Trans. Sustain. Energy 2015, 7, 1–14. [Google Scholar]
  16. Zhang, G.; Wang, X.; Jiang, C.W. Coordinated scheduling of VPP containing electric vehicles based on master-slave game. Power Syst. Autom. 2018, 42, 48–55. [Google Scholar]
  17. Bahrami, S.; Aminifar, F. Exploiting the potential of energy hubs in power systemsregulation services. IEEE Trans. Smart Grid 2019, 10, 5600–5608. [Google Scholar] [CrossRef]
  18. Jia, D.-X.; Liu, Z.; Gao, Q.; Wu, J. A bidding strategy for VPP accounting for integrated carbon-electricity trading. J. Electr. Power Sci. Technol. 2021, 36, 89–97. [Google Scholar] [CrossRef]
  19. Sun, H.; Liu, Y.; Peng, C.; Meng, J. Optimal scheduling of carbon-containing capture and waste incineration VPP with electricity-to-gas synergy. Power Grid Technol. 2021, 45, 3534–3545. [Google Scholar] [CrossRef]
  20. Zhou, R.; Sun, H.; Tang, X.; Zhang, W.; Yu, H. Low carbon economic dispatch of wind power-carbon capture VPP under double carbon volume constraint. Chin. J. Electr. Eng. 2018, 38, 1675–1683+1904. [Google Scholar]
  21. Mei, G.Y.; Gong, J.X.; Zheng, Y.L. Scheduling strategy of multi-energy complementary VPP considering scenery output correlation and carbon emission limit. J. Power Syst. Autom. 2021, 33, 62–69. [Google Scholar]
  22. Chen, J.-P.; Hu, C.-K.; Chen, J.-B.; Chen, Y.-G.; Gao, M.-X.; Lin, M.-R. Optimal scheduling of integrated energy system considering stepped carbon trading and flexible dual response of supply and demand. High Volt. Technol. 2021, 47, 3094–3106. [Google Scholar] [CrossRef]
  23. Lv, M. Multi-Timescale Optimal Scheduling of Micro-Networks Considering Scenery Uncertainty. Master’s Thesis, Xi’an University of Technology, Xi’an, China, 2021. [Google Scholar] [CrossRef]
  24. Zhou, N.; Liu, N.; Zhang, J. A comparative study of PV microgrid operations considering multiple feed-in tariff regulations. Power Constr. 2016, 37, 82–89. [Google Scholar]
  25. Yanfeng, M.; Zhenya, F.; Weidong, L.; Shuqiang, Z. Environmental economic dispatch considering carbon trading and wind load forecast error stochasticity. Power Grid Technol. 2016, 40, 412–418. [Google Scholar] [CrossRef]
  26. Lei, R. Research on Optimal Operation and Revenue Allocation of VPP Considering Carbon Trading. Master’s Thesis, North China Electric Power University (Beijing), Beijing, China, 2021. [Google Scholar] [CrossRef]
  27. McKay, M.D.; Beckman, R.J.; Conover, W.J. A comparison of Three Methods for Selecting Values of Input Variables in the Analysis of Output from a Computer Code: Proceedings of the 37th conference on winter simulation. Technimetrics 2012, 42, 202–208. [Google Scholar]
  28. Cui, H.; Guo, Y.; Xia, C. Study on the optimal allocation of distributed power supply considering environmental benefits. East China Power 2010, 38, 1968–1971. [Google Scholar]
  29. Zhao, F.M.; Fan, Y.F. Multi-energy VPP with two-level optimal dispatch under the influence of time-sharing tariff. Power Syst. Prot. Control 2019, 47, 62–73. [Google Scholar]
Figure 1. Flow chart of improved CLARA algorithm based on the Latin hypercube sampling algorithm.
Processes 10 02414 g001
Figure 2. Typical daily load curve of non-summer industrial and commercial in Shanghai.
Processes 10 02414 g002
Figure 3. Four wind power classic scene curves.
Processes 10 02414 g003
Figure 4. Four photovoltaic classic scene curves.
Processes 10 02414 g004
Figure 5. The probability corresponding to each wind power classic scene.
Processes 10 02414 g005
Figure 6. The probabilities corresponding to each photovoltaic classic scenario.
Processes 10 02414 g006
Figure 7. Wind power output scenario generated by fuzzy clustering algorithm.
Processes 10 02414 g007
Figure 8. Photovoltaic output scenario generated by fuzzy clustering algorithm.
Processes 10 02414 g008
Figure 9. Wind power scenario probability.
Processes 10 02414 g009
Figure 10. Photovoltaic scenario probability.
Processes 10 02414 g010
Figure 11. Capacity of VPP components without carbon trading.
Processes 10 02414 g011
Figure 12. Considering the power output of each component of the VPP under the carbon-trading scenario.
Processes 10 02414 g012
Table 1. The basic parameters of the fan.
ParameterNumerical Value
Rated power (kW)1000
Wind operation and management cost coefficient/ CNY ( kWh ) 1 0.0306
Table 2. The Basic parameters of photovoltaic.
ParameterNumerical Value
Rated power (kW)1000
Photovoltaic operation management cost coefficient/ CNY ( kWh ) 1 0.0098
Table 3. The specific parameters of gas turbine.
ParameterNumerical Value
Output range/kW[0,400]
Power generation efficiency0.92
Natural gas price/ CNY m 3 2.05
Natural gas status calorific value/ MJ m 3 40
Uphill rate/(MW/h)0.1
Downhill rate/(MW/h)0.2
Cost coefficient of gas turbine operation management/ CNY ( kWh ) 1 0.12
Table 4. The partial parameters of energy storage system.
ParameterNumerical Value
Charge and discharge power (kW)400
Charge and discharge efficiency0.87
S O C max /%0.9
S O C min /%0.1
Energy storage operation management cost coefficient/ CNY ( kWh ) 1 0.083
Table 5. Peak and valley tariffs for non-summer commercial and other electricity consumption in Shanghai.
Time Period Electricity   Price / ( CNY / kWh )
Peak hours (8:00–11:00, 18:00–22:00)1.14
Normal hours (6:00–8:00, 11:00–18:00)0.72
Valley hours (22:00–6:00)0.34
Table 6. Peak and valley tariffs for non-summer commercial and other electricity consumption in Shanghai.
Operation MethodCarbon Emissions (kg)Net Income (RMB)
Consider carbon trading2502.7819,548.23
Not considering carbon trading3028.4917,766.13
Publisher’s Note: MDPI stays neutral with regard to jurisdictional claims in published maps and institutional affiliations.

