Article

Effects of Container Design on the Temperature and Moisture Content Distribution in Pork Patties during Microwave Heating: Experiment and Numerical Simulation

1
Department of Food Science and Biotechnology, College of Agriculture and Life Sciences, Kangwon National University, Chuncheon 24341, Korea
2
Elderly-Friendly Food Research Center, Agriculture and Life Science Research Institute, Kangwon National University, Chuncheon 24341, Korea
*
Author to whom correspondence should be addressed.
Processes 2022, 10(11), 2382; https://doi.org/10.3390/pr10112382
Submission received: 24 October 2022 / Revised: 10 November 2022 / Accepted: 11 November 2022 / Published: 13 November 2022
(This article belongs to the Special Issue Processing Foods: Process Optimization and Quality Assessment (II))

Abstract

:
Effects of the container design on the heat transfer rate and food quality during microwave heating were explored and validated with numerical simulations and experiments. The uniformity of moisture content and temperature was investigated, and to describe microwave heating patterns, a simulation model was created. Pork patties with different moisture and salt contents were heated in three different containers (center and edge-perforated lid as well as without lid) to achieve 80 °C using a domestic microwave oven. Compared to the center or mid-way positions, the temperatures at the edge of the patties rose quickly. By containing the evaporated vapor from the heated pork patties inside the container, the container with a center-perforated lid decreased the heating rate and non-uniformity in temperature and moisture content. A simplified numerical model for the electromagnetics, heat, and momentum transfer coupling simulation was developed to understand the moisture and temperature distribution of the pork patties after microwave heating. Heating uniformity and the final quality of the pork patties could be improved by a container with a center-perforated lid. The proposed model was able to describe the microwave warming process for ready-to-eat products; thus, it is a useful tool for designing microwavable ready meals.

1. Introduction

Fast heating rates are achieved through microwave heating, which is the generation of volumetric heat in materials that can internally absorb microwave energy and transform it into heat. The main chemical composition of food materials such as water, salt, proteins, and fats is known to be dielectric components [1]. For several decades, microwave heating has been used extensively in the field of food processing [1]. Microwave applications constitute an important segment of domestic household and industrial production [2]. Due to its high heating rates, quick cooking times, and practical handling and operation, microwave heating is extensively used in the food processing industry [3,4].
Despite the prevalence and exceptional growth of microwave ovens, there are several challenges, such as rubbery or soggy texture, non-uniform temperature distribution, edge overheating, lack of browning, microbial safety concerns, and unfavorable flavor after heating [5,6,7]. To adequately address these challenges, a better understanding of the heating mechanism is required. In particular, the textural quality, which is highly influenced by the temperature and moisture of food after heating, is the most important concern in domestic applications of the microwave. The factors affecting microwave heating are the oven (design, microwave field distribution, size, turntables, oven power, power cycling, mode stirrers, and feed location) [8,9,10,11], food (dielectric and thermophysical properties, penetration depth, thickness, shape, and size) [12,13], and container (materials, shapes, dimensions, and places and directions in the oven) [14]. In most cases, microwave heating patterns are determined by a combination of those factors. In order to increase the uniformity of microwave heating, numerous studies have been carried out, for instance, combining microwave and conventional heating, managing food geometry, using metals to produce shielding and field modification, designing suitable microwave ovens, manipulating the heating cycle, and reducing microwave power and heating time [15].
Despite the fact that there is a large amount of literature on microwave processing, the effects of packaging containers’ design on microwave heating have been rarely studied. When a microwave oven cooks food, the pressure and the humidity in the container increase due to vapor produced from the food at high temperatures. Thus, the cover of the container must be perforated or opened to release the vapor pressure within the container to prevent bursts. Notably, an understanding of the relationship between the food properties and the packages is required before the package designs development and production, and establishing the heating conditions [16]. In microwave heating, the vapor from food causes a pressure-driven flow of moisture from the inside of the food to the surface. Depending on the porosity of the food structure and airflow conditions at the surface, the pressure-driven moisture can make the surface soggy or lose too much moisture, resulting in tough texture and shrinkage of foods [17].
The packaging containers’ design, such as the position and size of the apertures, plays a significant role in modifying the moisture loss and temperature distribution within the containers. The quality of the prepared or processed food after microwave heating can be remarkably improved with a suitable container design. However, considering the factors mentioned above, to achieve an improved homogenous heating pattern from the microwave heating process, it is unfeasible to optimize the heating condition merely by experimental approach because of the complicated interactions between food components and the containers. Computer simulation can be a promising tool for understanding these complex microwave heating conditions with effective numerical methods and strong computational techniques [18]. A computer-based simulation and modeling of the microwave heating process can help to fully understand the phenomena and predict the heating patterns [19]. Properly designed microwavable food product packages can improve microwave heating performance and food quality [20]. Foods have a multiphase system; thus, the phase change of water during evaporation should be taken into account in addition to heat and mass transfer in the model [21]. Such multiphase microwave heating models have been developed and used in simulations for heating mashed potato [21], thawing frozen rice [22], dehydrating bananas [23], and drying Chinese jujube [24]. Recently, there has been an attempt to simplify the complicated evaporation model to predict microwave heating for food process design [25]. The simplified models that incorporate only the most essential underlying physics can reliably evaluate the microwave heating of food products while saving computation time. A simple evaporation model, proposed by Ni et al. [26], successfully predicted moisture loss for reheating food, and has been used as an effective model in recent studies [22,25]. The model takes into account the non-uniformity of temperature during microwave heating. Despite this model assuming no diffusional limitations of vapor, the heating process of food (not a drying process), such as reheating frozen or cold foods, with a domestic microwave oven does not lose total moisture.
This study aimed to understand the effect of the container design on the temperature and the moisture content in food during the microwave heating process, experimentally, and numerically. The objective of our study was (1) to determine the influence of moisture level and salt content, and the lid design, such as the location of an aperture and presence of a lid, on the uniformity of microwave heating of cooked pork patties evaluated by physical properties, and (2) to develop a simplified three dimensional (3D) model to estimate the temperature profiles during microwave heating based on the iterative coupling of the heat and momentum transfer equations with Maxwell’s equation using numerical analysis, and also to validate the simulated results using the data from the experiment.

2. Materials and Methods

2.1. Sample Preparation

Pork loins, purchased from a local market in Chuncheon, South Korea, were processed using an 8 mm grinding plate. The ground pork was chilled and preserved at 4 °C in a refrigerator until used for making pork patties. Four types of patties were prepared to investigate the impact of patty composition on microwave heating properties (Table 1). The ground pork loins were mixed with/without 2.0% NaCl or 10% water, or both, in a mixer (Thermomix, Vorwerk & Co. KG, Wuppertal, Germany) for 2 min at low speed. Then, the pH of the samples was measured using a pH sensor (pH-BTA, Vernier, Beaverton, OR, USA). The mixtures were molded into patties (90 g each) with 15 mm height and 90 mm diameter. Each patty inside the Petri dish was vacuum-packed in Nylon/PE film pouches using a vacuum machine (AZ-600E-D, AIRZERO, Ansan-si, Korea) and cooked to the internal temperature of 76 °C by sous vide cooking in a water bath (Precision Scientific, Chicago, IL, USA) according to the guidelines for cooked pork [27]. The water bath and patties’ temperature was accurately controlled using copper/constantan thermocouples. The patties were then taken out of the water bath and immediately cooled in a mixture of cold water and crushed ice until each patty reached a temperature of 4 °C. Before being used again, the cooked patties were kept in a refrigerator at 4 °C.

2.2. Microwave Heating and Temperature Measurement

For the microwave heating, the refrigerated patties were transferred in a microwaveable plastic container (126 mm upper diameter and 110 mm lower diameter with 35 mm height) covered with a perforated lid having a small aperture at the center (CP) or edge (EP), or without a lid (WL). Through the preliminary test, the size of the aperture was determined to be the minimum diameter of 6 mm, which can prevent the distortion or bursting of the container due to vapor generated during heating. The container was heated in a home microwave oven (489 × 275 × 328 mm, Model RE-C20JS, Samsung Electronics Co. Ltd., Suwon, Korea) positioned in the middle of a glass turntable. The microwave was operated with 700 W power at 2450 MHz until the temperature at the measurement point reached 80 °C, which shows the slowest heating rate among the measuring locations of the patty. A fiber-optic sensor (Opsens, Quebec, QC, Canada) was used to acquire the real-time temperatures at three points (center, edge, and mid-way between the center and the edge position with 7.5 mm depth) of the pork patties (10 ± 1 °C initial temperature) during microwave heating (Figure 1). The sample was taken out of the microwave after 30 s of heating and used for analysis.

2.3. Moisture Content

The pork patty was cut into small pieces representing the outside (i.e., approximately 10% lower from the top side surface of the patty) and the inside of the patty (i.e., under 10% lower from the top of the patty). The Association of Official Analytical Chemists (AOAC) method of No. 950.46B was used to determine the moisture content [28]. The samples of each trial were analyzed in triplicate.

2.4. Scanning Electron Microscopy

Microwave-heated patties were cut into 1 to 2 mm cubes and fixed with 4% glutaraldehyde and 1% paraformaldehyde solution in 0.1 M cacodylate buffer (pH 7.4) for 3 to 4 h. The samples were dehydrated in a graded series of ethanol solutions (50, 60, 70, 80, 90, and 100%). The specimens were observed using a VP-FESEM scanning electron microscope (Carl Zeiss, Oberkochen, Germany).

2.5. Statistical Analyses

The average and standard deviation (SD) of the results were used. Each experiment was conducted at least in triplicate and evaluated using SAS 9.3 (SAS Institute Inc., Cary, NC, USA). Analysis of variance (ANOVA) with the Duncan test was used to determine the statistical significance (p < 0.05).

3. Numerical Simulation

3.1. Governing Equations

Numerical modeling of microwave heating was conducted using COMSOL software (COMSOL Multiphysics®, v.5.1, Stockholm, Sweden) that includes the coupling of three physics phenomena (heat and momentum transfer. and electromagnetism), which can be accomplished by resolving the following governing equations.
The following Maxwell’s equations were solved to determine the distribution of the electric field in a microwave cavity [29]:
× μ r 1 ( × E ) k 0 2 ( ε r j σ ω ε 0 ) E = 0
where μr is the relative permeability of the material, E is the electric field intensity (V/m), k0 is the wave number, εr is the relative permittivity or dielectric constant of a material, ε0 is the relative dielectric loss of a material, j is the complex constant, ω is the angular wave frequency (2πf, rad/s), and σ is the electrical conductivity of the material (S/m).
Calculating the volumetric power generation (Q), defined as the absorbed power of the dielectric material from the incident microwave energy, requires the material properties and the electric field intensity from Equation (1) [30]:
Q = σ | E | 2 = 2 π ε f ε r f | E | 2
where εf is the free space permittivity (8.854 × 10⁻¹² F/m), and f is the frequency (Hz).
In order to determine the temperature distribution resulting from conduction and convection, Fourier’s energy balance equation (Equation (3)) is solved using the volumetric power generation term calculated above as the energy source term:
ρ C P u · T = · ( k T ) + Q
where ρ is the material density (kg/m3), Cp is the specific heat (J/kg K), k is the thermal conductivity (W/mK), T is the temperature (K), and Q is the volumetric heat generation due to the incident microwave energy (W/m3).
When the temperature reaches its highest point (the boiling point), all dissipated energy is used to evaporate water. The continuity equation for the water in the material is written:
C w t = R w
where Cw is the water concentration (kg/m3) and Rw is the evaporation rate (kg/s m3).
The evaporation rate was calculated based on the assumption that once the boiling point is reached, evaporation consumes all the heat generated as long as there is water to evaporate [31]:
R w = Q L
where L is the latent heat of water for evaporation (kJ/kg). Recently, this simplified evaporation model has been widely used for simulations of microwave heating [22,25].

3.2. Development of COMSOL Model

The combined physics was solved by COMSOL software, and the calculations predicted the electric field, temperature, and moisture content of the patties. The Radio Frequency (RF) module (used to solve electromagnetic waves) was coupled iteratively with the Heat Transfer module (used to solve energy balance equations) and the Chemical Species Transfer module (used to solve momentum and continuity equations).
The microwave cavity geometry developed using the COMSOL software is shown in Figure 2, which includes the waveguide and quadrangular cavity with a dent. Next, the computational domain was meshed with a tetrahedral grid. For electromagnetic problems, the maximum element size was set to 0.2 m wavelengths or smaller. Based on the materials’ properties and these criteria, the mesh size used in this model was 0.03 m in the waveguide and cavity and 0.006 m in the pork patty. (Figure 2C). In addition, the geometry of the tray was developed to compare the heating characteristics depending on the container design (Figure 2D–F).
The boundary conditions for the RF module include perfect electric conductor walls of the waveguide, implying the tangential component of the electric field to zero ( n ^ × E = 0). At the port, 700 W of electromagnetic energy was supplied through a rectangular TE10 mode waveguide at an operating frequency of 2.45 GHz. Thermal and dielectric properties of the pork patty were obtained from the ASHRAE Handbook [32] and Sipahioglu et al. [33] (Table 2). Dielectric properties, consisting of the dielectric constant and loss, play important roles in microwave heating. The dielectric properties of meat products were measured and empirical relationships were proposed to estimate the dielectric properties of meat products from the compositions [33]. The dielectric constant and loss used in this study were estimated from the composition of patties (Table 1). The empirical equations used to calculate the dielectric properties are:
0.00214 ( A ) + 0.2725 ( M ) 0.2227 ( S ) + 28.965 = ε r
26.332   ( A ) + 0.8497 ( M ) + 25.6112 ( S ) + 105.364 = ε 0
where A, M, and S stand for the ash, moisture, and salt content, respectively.
The dielectric properties of pork in our study are within the range of dielectric constant and loss values reported in other studies. A comprehensive work on measuring the dielectric properties of pork muscle from various qualities of fresh pork has been reported [34]. According to their study, the dielectric constants of four different pork muscles were in the range of 45–55 in a fresh state and 43–51 in a frozen state. The dielectric loss was from 14 to 19 for fresh samples, and from 13 to 18 for frozen samples. The initial temperature was set at 10 °C. The electromagnetic module generated heat inside the material, and was included in the heat transfer model.
The wave equation was solved in the RF module using a generalized minimum residual solver (GMRES) to calculate the heat generation. The energy and mass balance equations were solved in the Fluid Dynamics and Heat Transfer module with a parallel direct linear solver (PARDISO), using the heat generated from the RF module to obtain the temperature profiles.
In this study, the following assumptions were made to simplify the microwave heating model:
  • It was assumed that the magnetron would run at a single frequency of 2.45 GHz.
  • Since the fan continuously ventilated the oven cavity, it was assumed that the air temperature would remain constant throughout the microwave heating process.
  • It was assumed that all water can be evaporated when the boiling point is reached.
  • Structure changes such as shrinks or expands are assumed not to take place during the microwave heating.
  • Some model parameters assigned constant values in the model based on the existing literature, and are assumed to be constant with the temperature change during the microwave heating.
  • The simulation focused on evaluating the temperature distribution of the patty. Due to the limitation of the computational power to deal with the multi-phase physics models, the flow pattern and the temperature of the air were assumed to be constant, and the major calculation power was allocated to estimate the temperature distribution of the patty based on the physical changes in the patty, such as the heat generation, phase transition, evaporation, and diffusion of water.

3.3. Model Accuracy Measurement

By comparing the transient temperature difference of the simulation and experiment, model accuracy was determined. The validity of simulation results was evaluated by root mean square error (RMSE):
RMSE = 1 n i = 1 n ( T e x p e r i m e n t a l T s i m u l a t e d ) 2

4. Results and Discussion

4.1. Effect of Pork Patty Composition and Container Design on Temperature Profiles

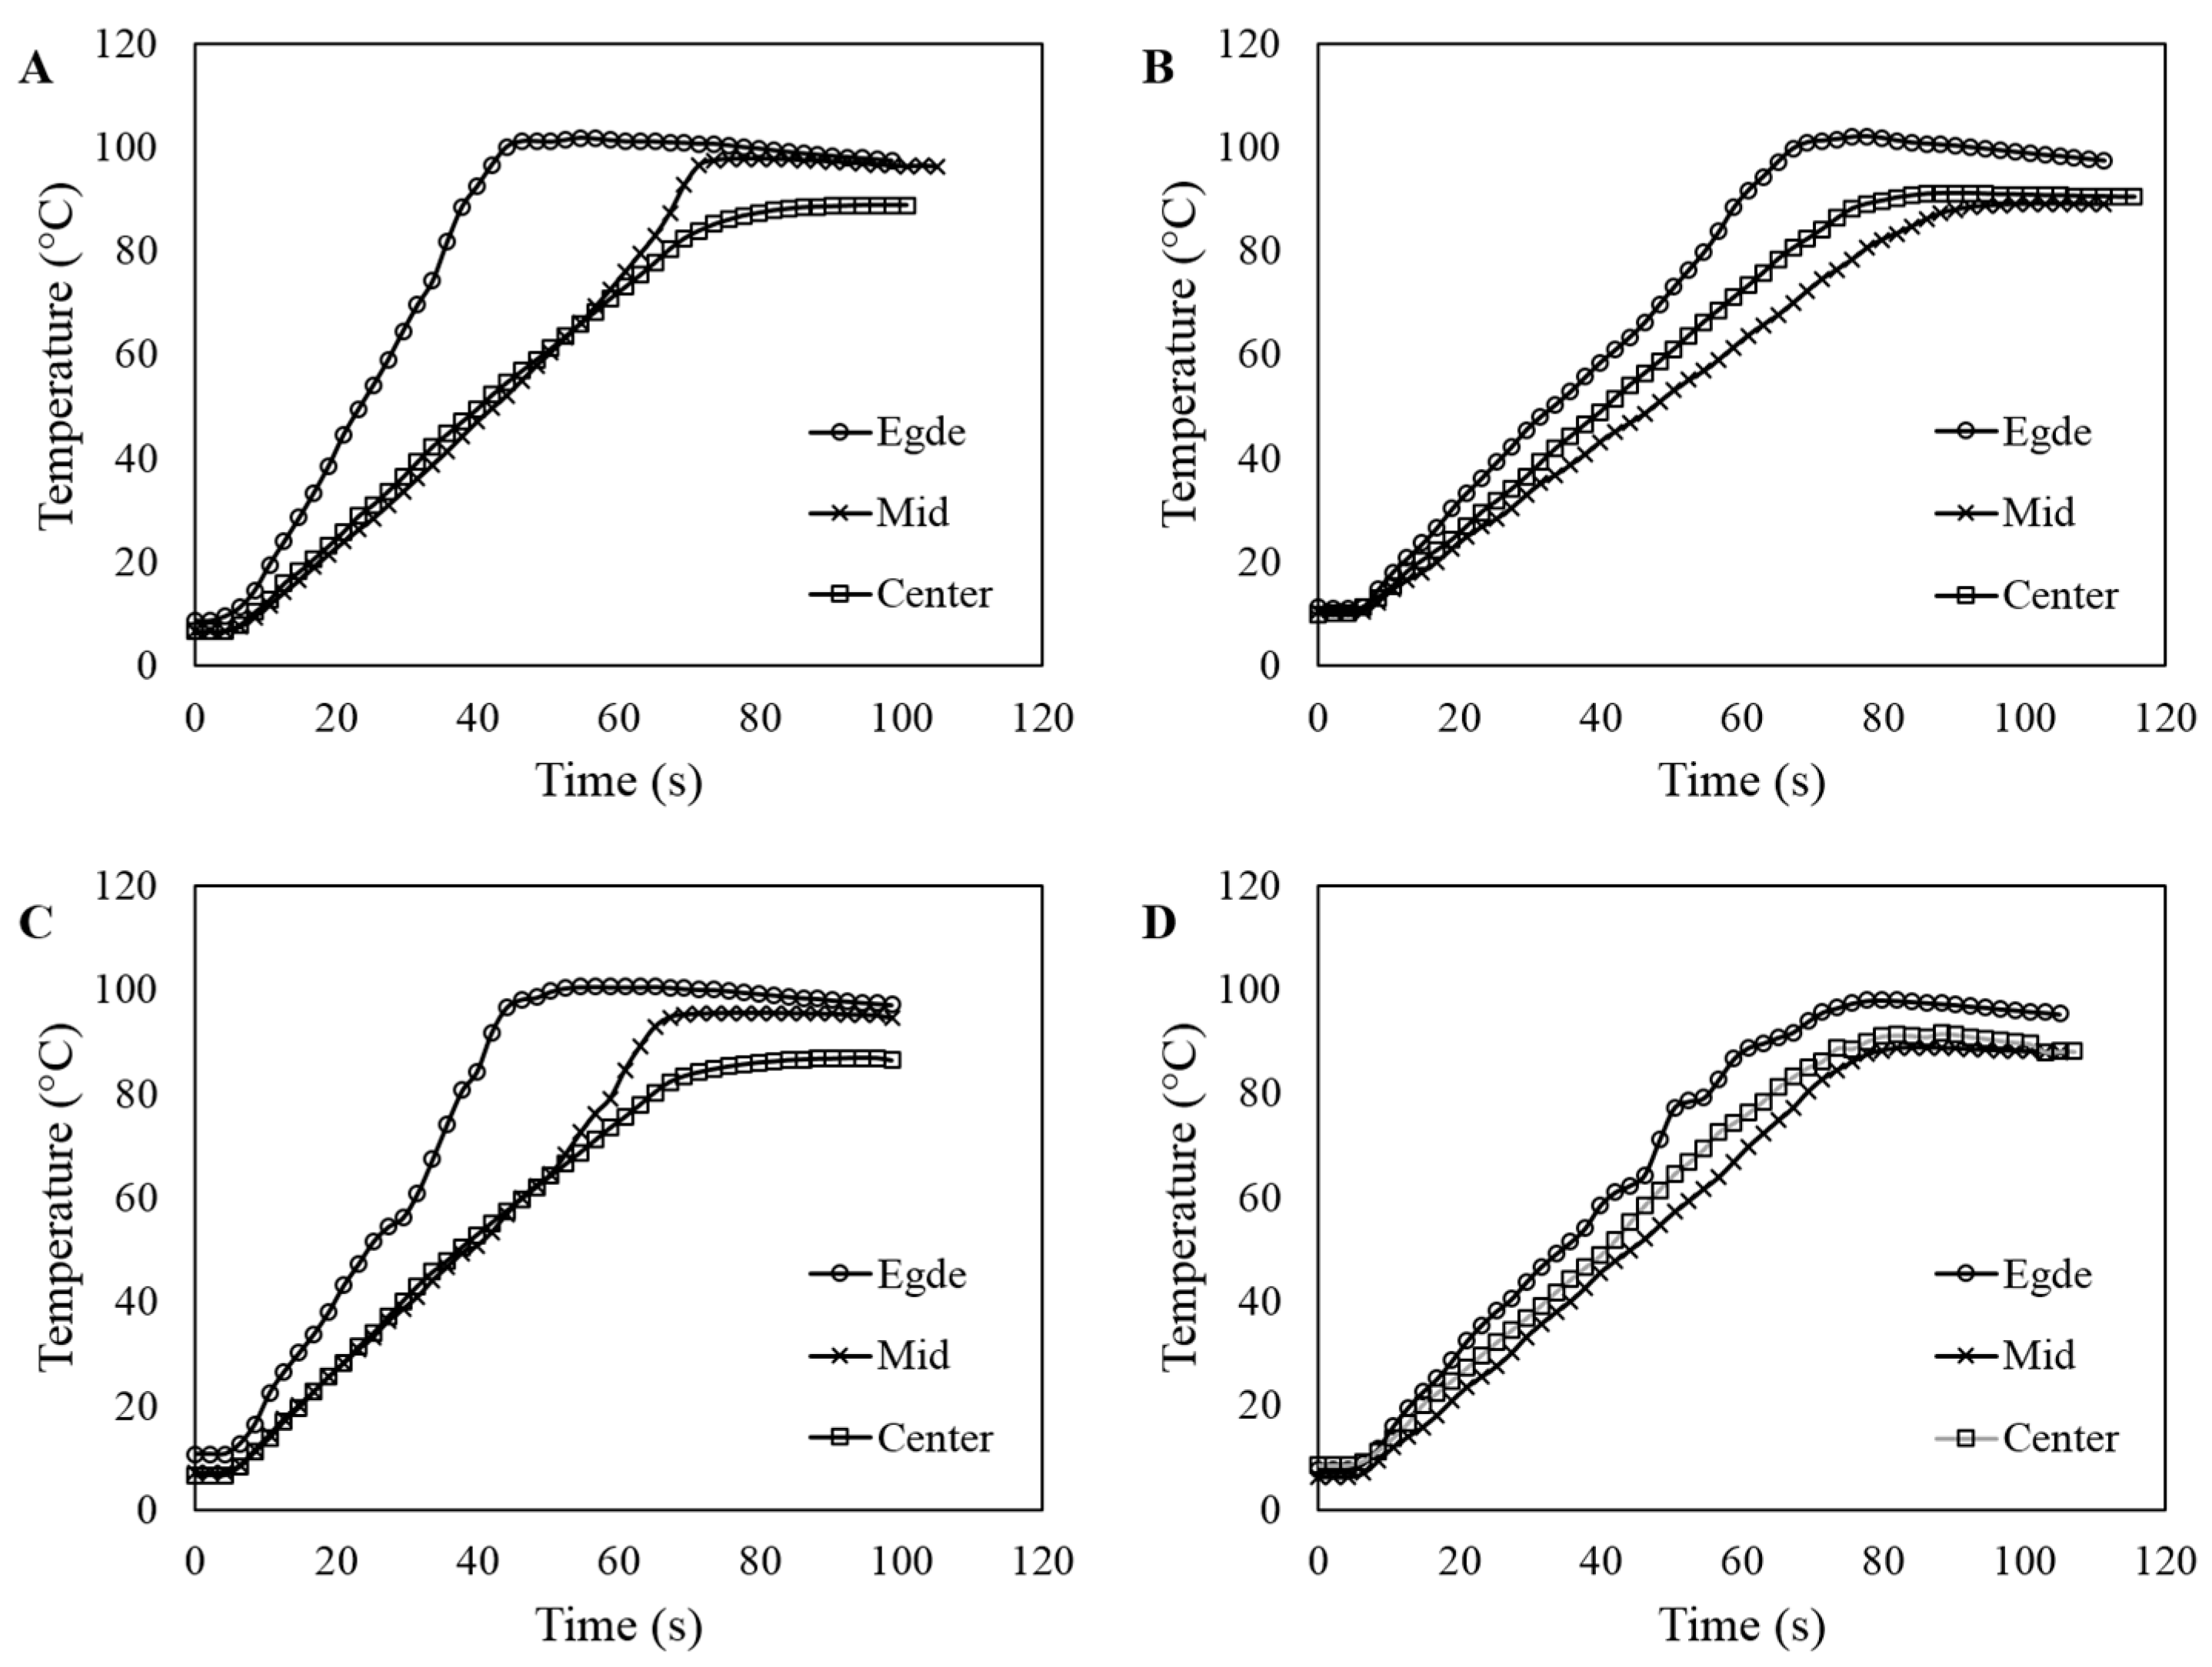
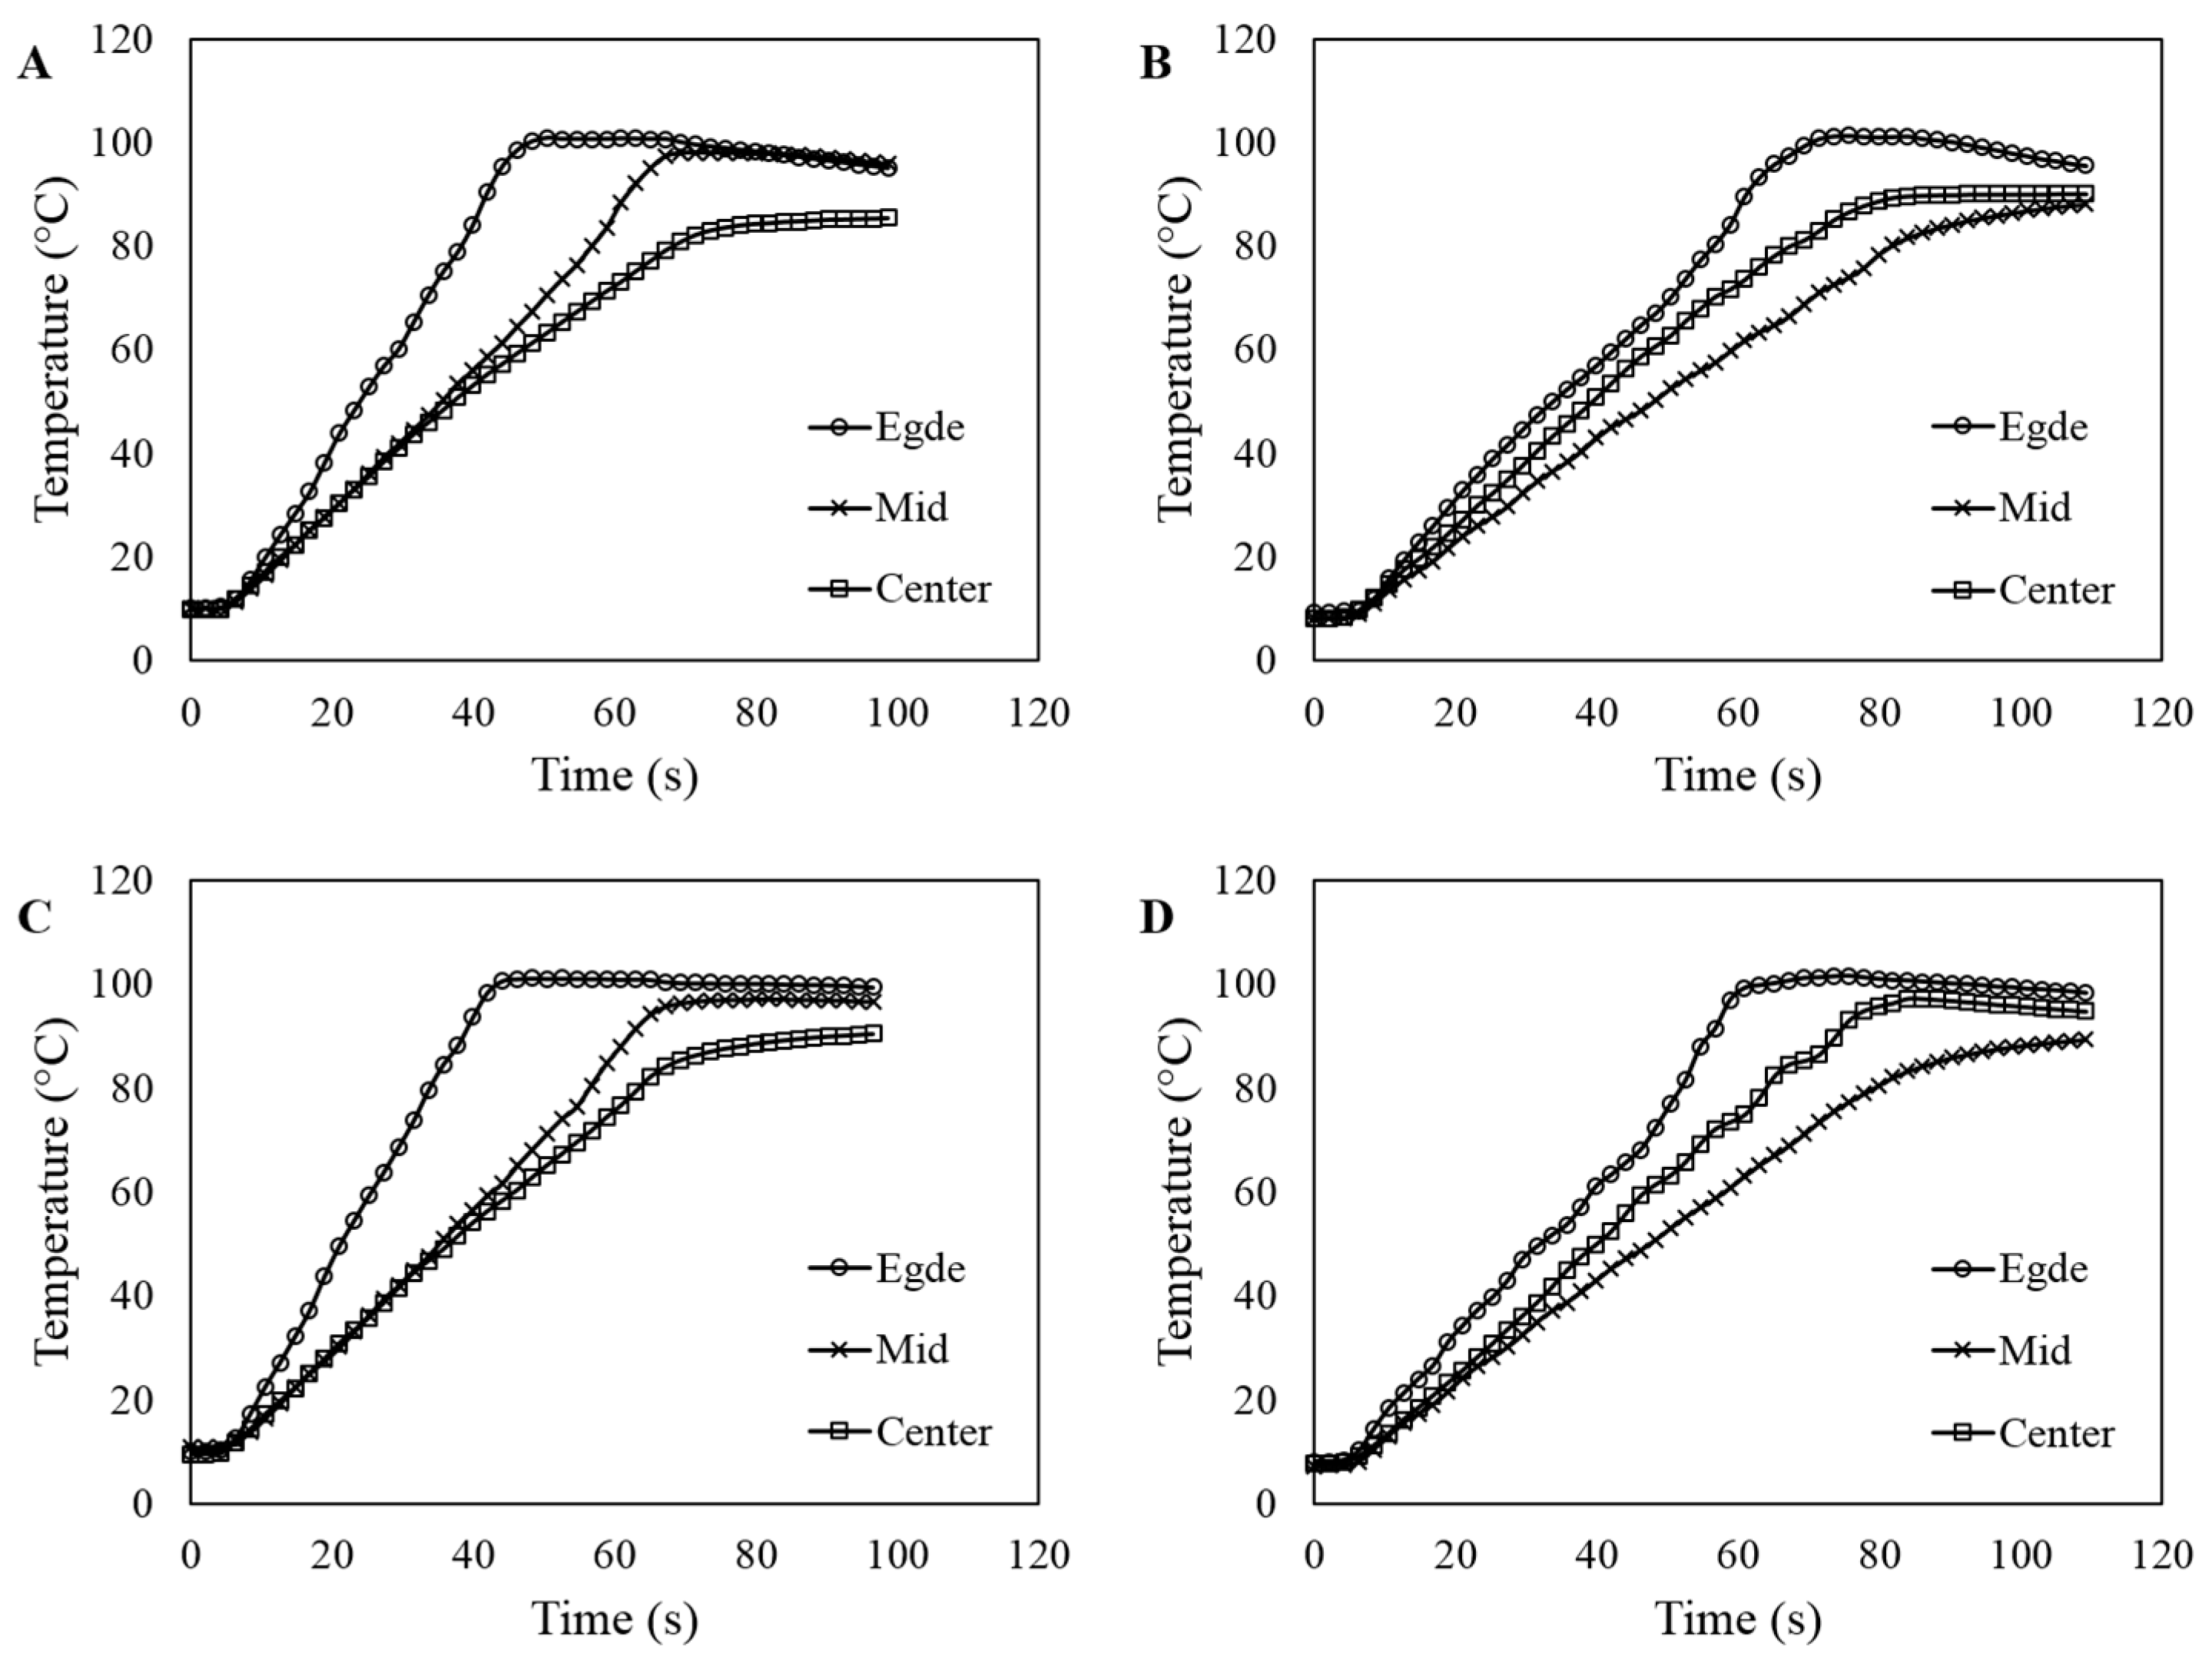
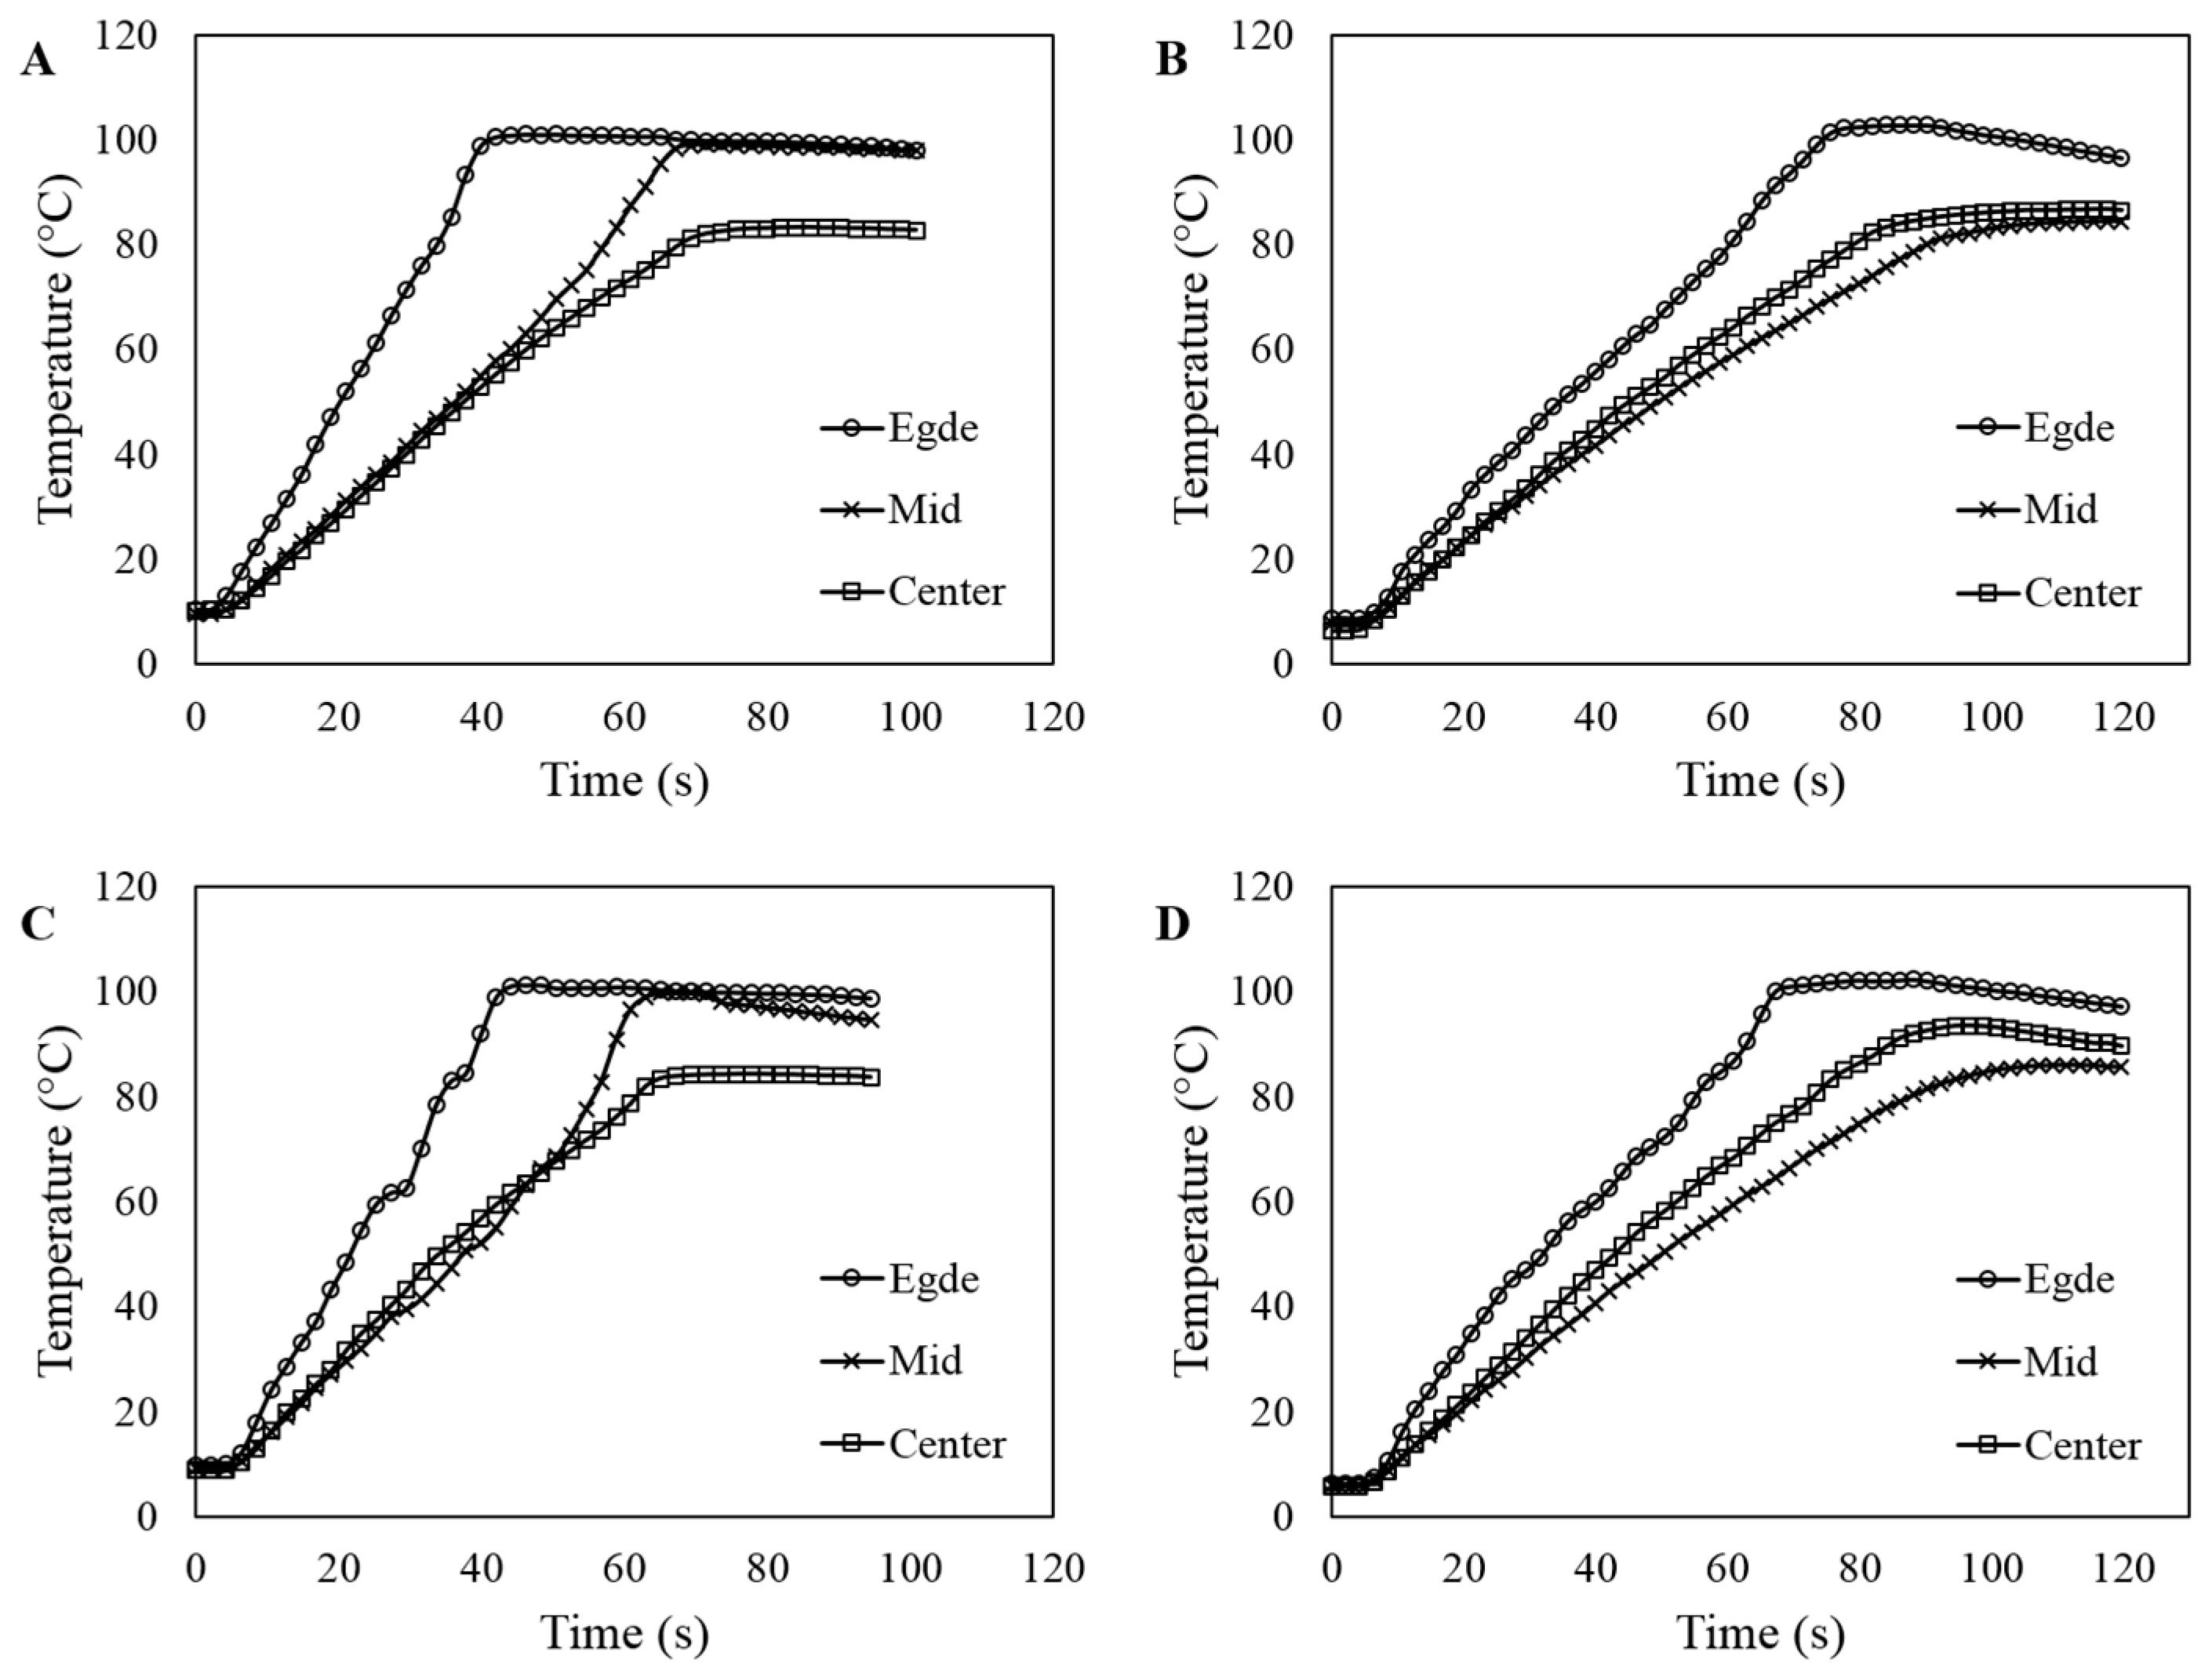
The temperature profiles of the pork patties with different compositions in various containers were obtained during microwave heating in a domestic microwave oven (Figure 3, Figure 4 and Figure 5). Overall, the temperatures at the edge of pork patties rapidly rose compared to that of the center and the mid-way, indicating energy concentration along the edges. The edge temperatures linearly increased to 100 °C. In comparison, the temperatures of the other parts were lower than 80 °C (e.g., the minimum temperature of 52, 72, 67, and 88 °C for PL, PS, PW, and PSW, respectively) (Figure 3). This phenomenon is known as the “antenna” effect, where the edge of the food acting as an antenna in the microwave field and 10 to 20% of the absorbed energy can be lost by the edge overheating [35,36]. Thus, further heating or power increase at the edge will cause overheating and consequently make the product unacceptable. Similarly, in most tests with the domestic oven, the edges of the product reached higher temperatures than the edges elsewhere, while the temperature at the geometric center was substantially lower [8,37,38].
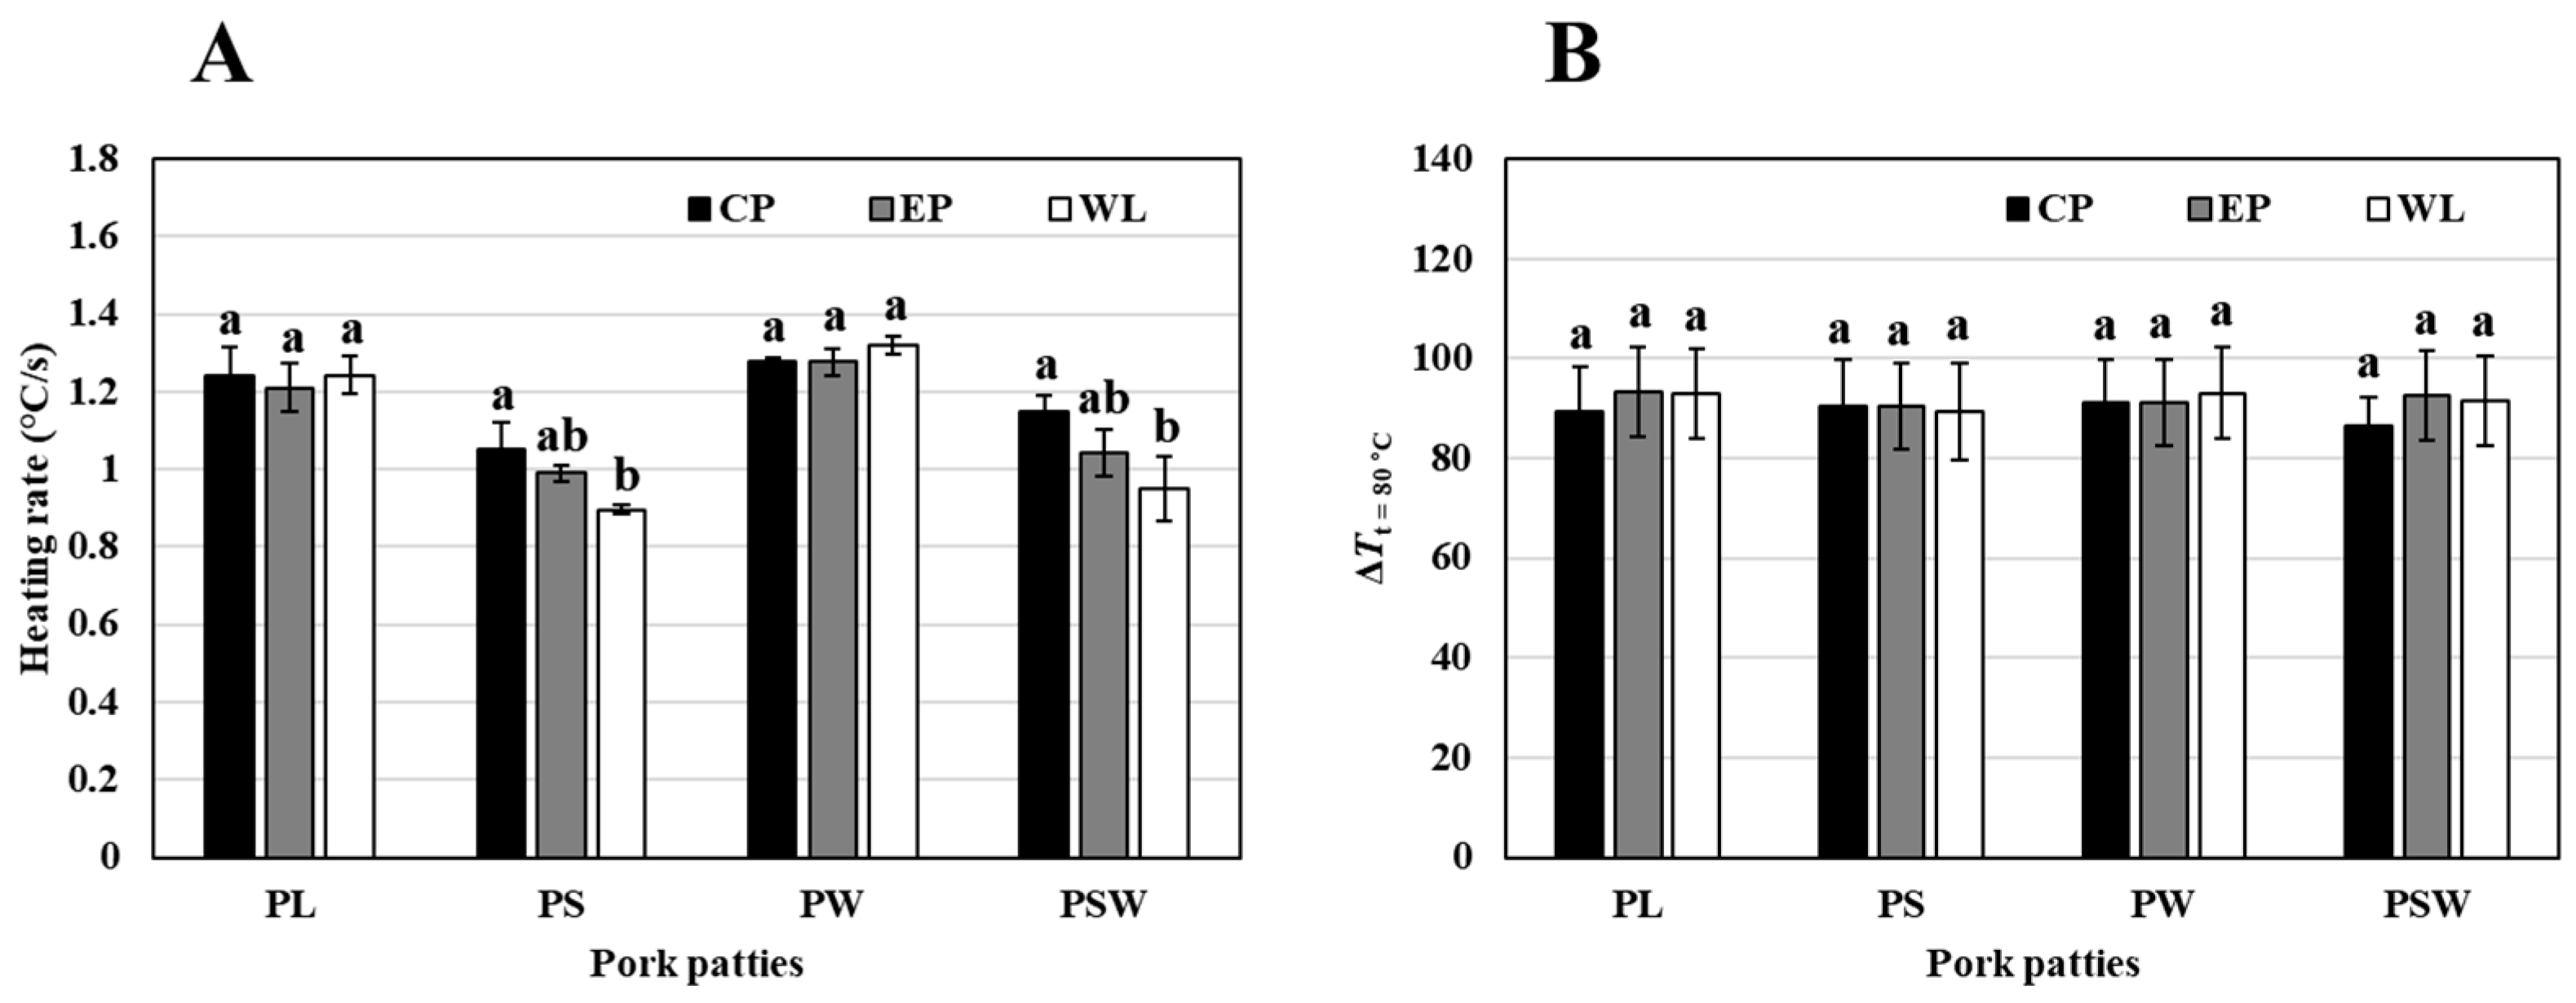
For the composition of the patties, the difference was the most pronounced when salt was added to the pork patties, regardless of the container design (Figure 3, Figure 4, Figure 5 and Figure 6). Patties without salt (PL and PW) had similar heating patterns, and the average heating rate at the mid-way was faster than at the center. On the other hand, the average heating rate was the slowest at the mid-way for PS and PSW. The salt addition was expected to increase the heating rate because it is well known to affect an increase in the loss factor [1]; however, it reduced the average heating rate in this study. The difference could be due to the salty shield effect. Engelder and Buffler [39] suggested that the ions from dissolved salts in lossy material (such as salty foods with high electric loss factor) conduct currents and dissipate energy; thus, the salt increases the electric loss factor (ε″) and results in quick heating. However, this effect can drastically reduce the penetration depth, causing the salty shield effect and inadequate core heating in salty foods. This may also be partly due to evaporation at the surface of the product, which relatively increases salt concentration. The microwave heating rates of the frozen ground beef also showed similar results to this study when salt was added [40]. Consequently, the heating time for patties containing salt was longer than that of the patties without salt. The cutting force was the highest for the PS, which has the longest heating time, probably resulting from the shielding effect (Figure S1). In contrast, moisture content slightly increased the heating rate of the pork patties (Figure 6A). The increase in water level was expected due to the increase in dielectric properties such as ε′ and ε″ as reported by Engelder and Buffler [39], Sakai et al. [41], and Chandrasekaran et al. [1].
The container design has less effect on the heating rate compared to the pork patties’ composition. However, there were significant differences in temperature uniformity among different container designs (Figure 3, Figure 4, Figure 5 and Figure 6) except for the samples without salt (PL and PW). The average temperature of the pork patties when the slowest heating part reached 80 °C (ΔTt=80°C) in Figure 6B can describe the changes in temperature uniformity. When the aperture was placed at the center of the lid (CP), temperature uniformity improved with lower ΔTt=80°C with a relatively small standard deviation than the patties in the other containers. The pork patties in the container without a lid (WL) showed decreased temperature uniformity having mostly the highest standard deviation for ΔTt=80°C and showed the slowest average heating rate. Interestingly, the location of the aperture varies with the average heating rate and the temperature uniformity of the pork patty; even the number and size of the aperture is the same between the center-perforated and edge-perforated container. The result may be accounted for by the difference in the convection inside the container. The heat and vapor generated from the patty during microwave heating are postulated to reduce the heat and moisture transfer rate from the surface to the surrounding air by forming hot and humid air inside the container. For the container with an edge-perforated lid, perhaps the edge part released the heat and vapor at the early stage of heating due to the fast heating rate. Subsequently, heat and vapor of the edge part near the aperture may be expelled immediately and might change the convection inside the container. Burfoot et al. [42] reported that foodstuff packaging probably reduced heat losses and maintained a warm, moist environment above and between pasta strands, thereby decreasing temperature variations within the product. This was ascribed to the convective and evaporative heat losses associated with rapid heating rate by volumetric heat generation of microwave heating. However, microwave heating is accomplished in a short time. The pork patties in the CP container were more likely to keep the vapor in the container than the patties in the EP and WL containers, which likely lose convective and evaporative heat more efficiently. For the PL and PW patties, the total heating time may be too short to generate the effect of convective and evaporative heat inside the container. In addition, since there is no shielding effect by the salt for PL and PW, evaporation at the surface of the patties is reduced, and the heating rate is increased. Therefore, generating and keeping vapor pressure within containers is important to achieve a high uniformity and heating rate for designing microwave heating containers.

4.2. Effect of the Pork Patty Composition and Container Design on Moisture Content the Tem

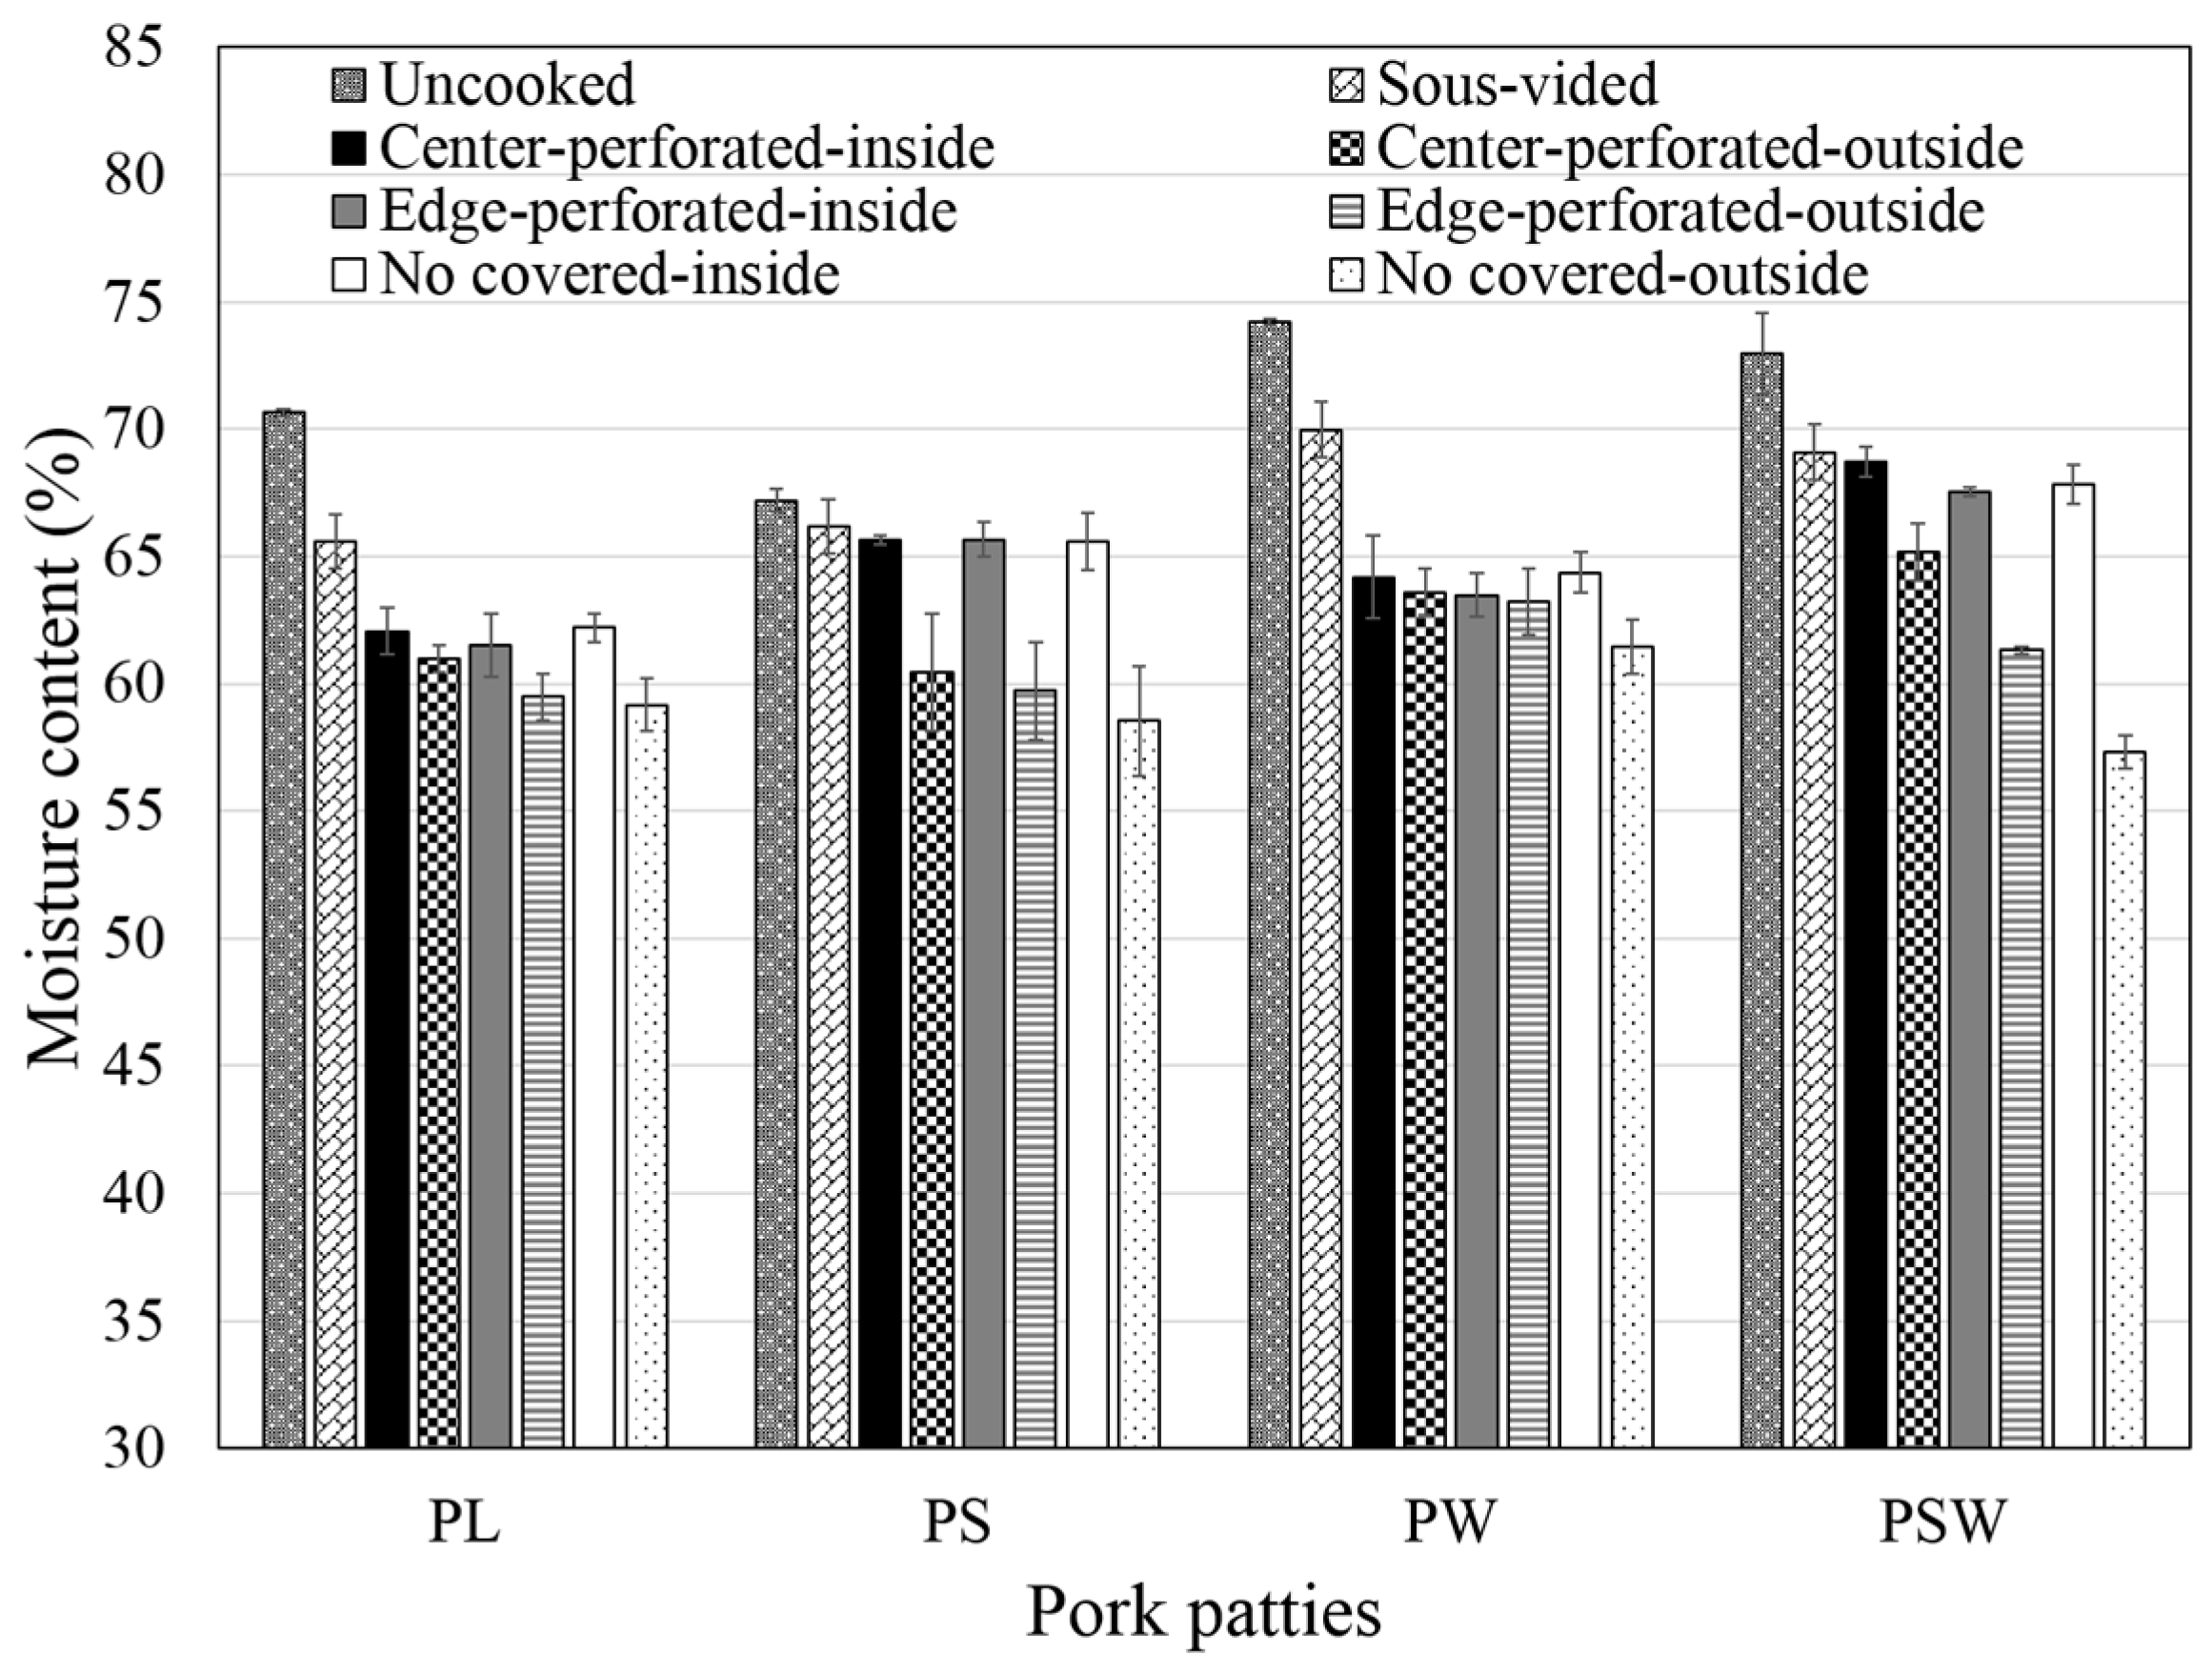
The effect of the different factors on the pork patties’ moisture content after microwave heating was compared as shown in Figure 7. The moisture content was evaluated by separating the inside and outside (edge) of the pork patties for each treatment to investigate the difference in evaporation depending on the temperature non-uniformity and the shielding effect. The moisture contents of the pork mixtures prepared by formulation (Table 1) and pork patties after the sous vide process were also compared. The pork mixtures with added water had higher moisture content, but they showed a significant reduction after the sous vide process. In contrast, the pork mixtures with added salt showed a lower decrease in moisture content after the sous vide process. This may be due to the relationship between water binding capacity and salt in the product [43].
Overall, there was noticeable drying at the edge of all the patties after microwave heating. Interestingly, there were no significant differences in the moisture content inside all the pork patties across different process parameters (Figure 7). The moisture loss on the surface was clear in the order of CP, EP, and WL containers. This trend was especially more pronounced in the PS and PSW, which required relatively long heating time due to high salt content. For the PSW patty, the edge of pork patties heated in the CP container showed slight drying, whereas pork patties heated in the EP and WL containers had very dry, almost crusty, regions on the edges. The different behavior in patties’ moisture loss in the containers can be explained by limiting mass transfer and increasing heating time. When analyzing the moisture loss during microwave heating, three phenomena should be taken into account. First, for the short microwave heating time, the pork patty is heated, and subsequently, moisture evaporates from the surface of the patties. Second, internal evaporation causes a significant pressure-driven flow of moisture that can push a significant amount of moisture to the surface leading to continuous moisture loss. Finally, since the vapor pressure is increased within the container, the evaporation becomes limited by the vapor concentration difference between the saturated boundary layer at the pork patty surface and the vapor concentration around the pork patty. Therefore, the evaporation amount and the evaporation rate of the patty during heating may be determined by the container design.

4.3. Microstructural Observation

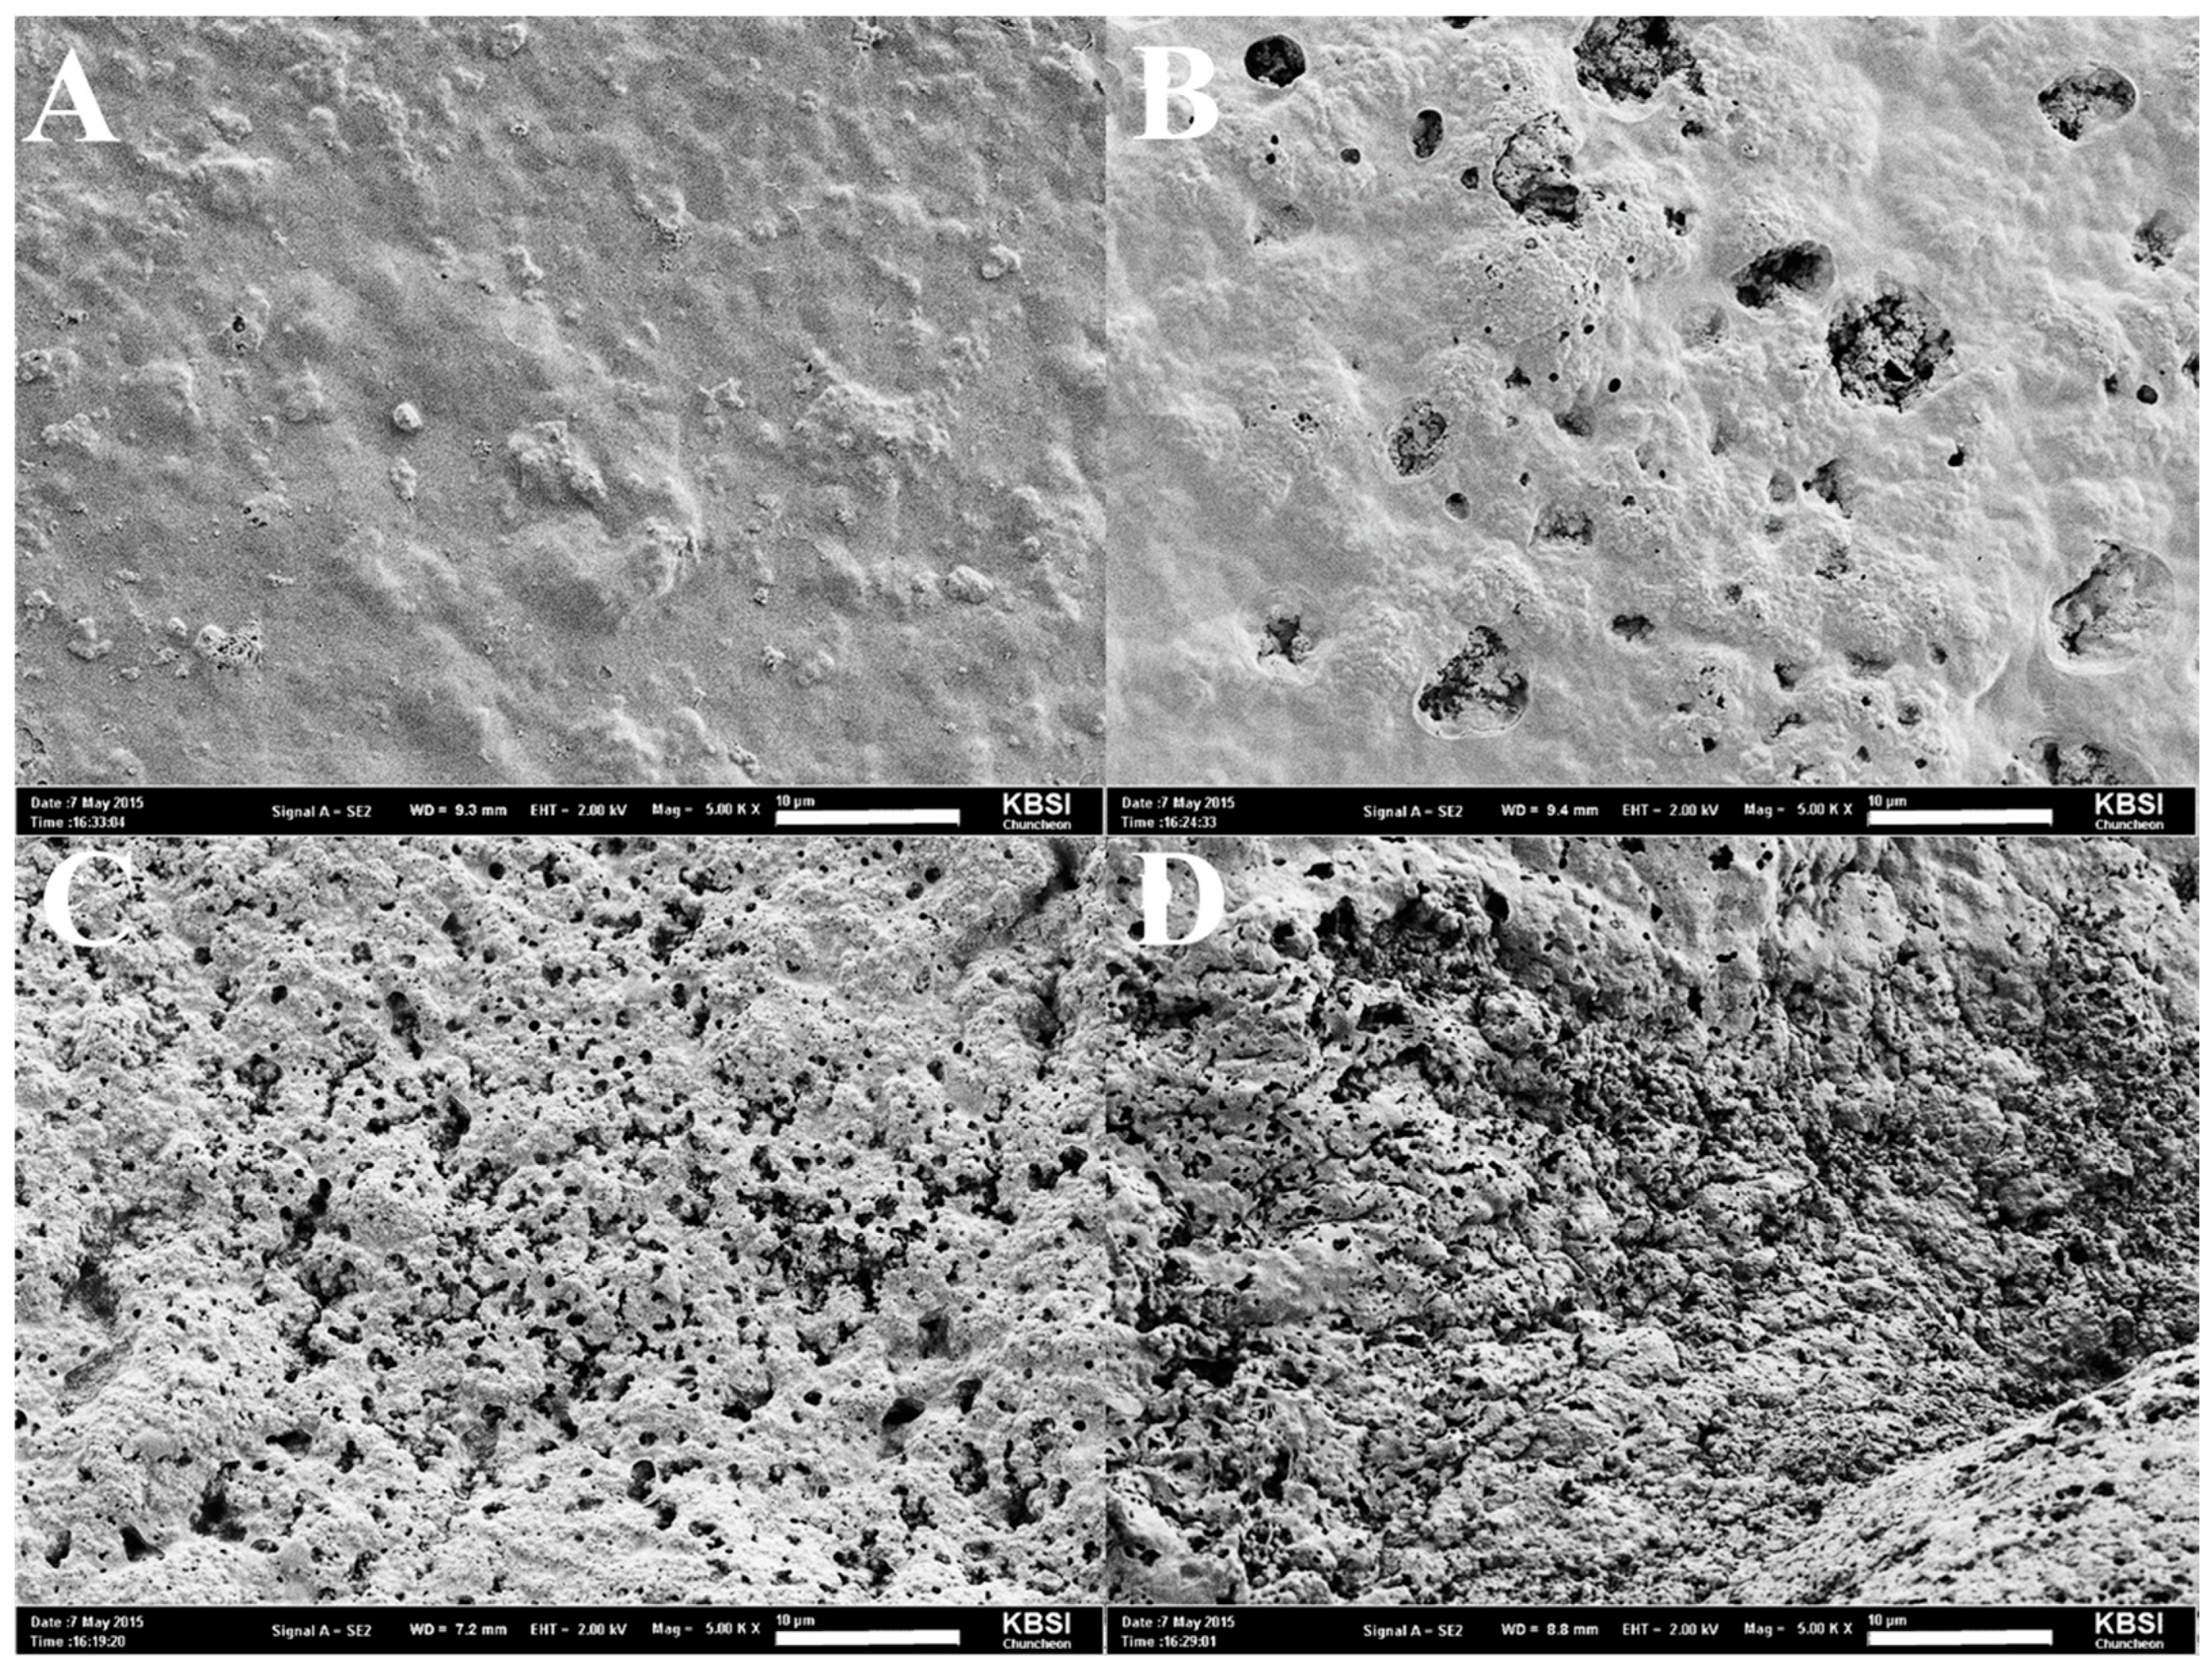
SEM micrographs of the edge part surface were compared to analyze the microstructural changes due to differences in the degree of evaporation by container design (Figure 8). Sous vide processed patties (without microwave heating) were used as a control sample. The patties heated by microwave (Figure 8B–D) have many pores on the surface compared to the unheated sample (Figure 8A). It is probably due to the steam inside the pork patties escaping to the outside by volumetric heating. The structure of the patties’ surface was disrupted by microwave heating, and more porous structures were observed in the patties heated in EP and WL containers. The patties heated in the CP container show a relatively similar structure to the sous vide patty, which corresponds to the minimum quality change for this process.

4.4. Spatial Power Density and Electric Field Distribution by Simulation

The spatial electromagnetic power density distributions as a section plot through the center of the products are shown in Figure 9A. To calculate the temperature change within an object during microwave heating; it is important to determine the power density starting with the electromagnetic field configuration (Figure 9B) [44]. Higher power density was observed on the edges of all the patties. For patties with salt, higher power density was calculated at the surface of the patties, showing that the pork patty acts as a resonant cavity for the microwave field. The power absorbed in the patties was evaluated and determined as approximately 60, 66, 63, and 64% of the input microwave power for PL, PS, PW, and PSW, respectively. Most of the remaining power was reflected in the port. Electromagnetic power generation is a function of electric field intensity and dielectric loss [45]. Since dielectric loss for the PS patty (ε0 = 19.56) and PSW patty (ε0 = 17.95) was higher than that of PL and PW patties, the higher power generation profiles were calculated and compared to PL and PW patties.

4.5. Spatial Temperature Profile and Moisture Distribution by Simulation

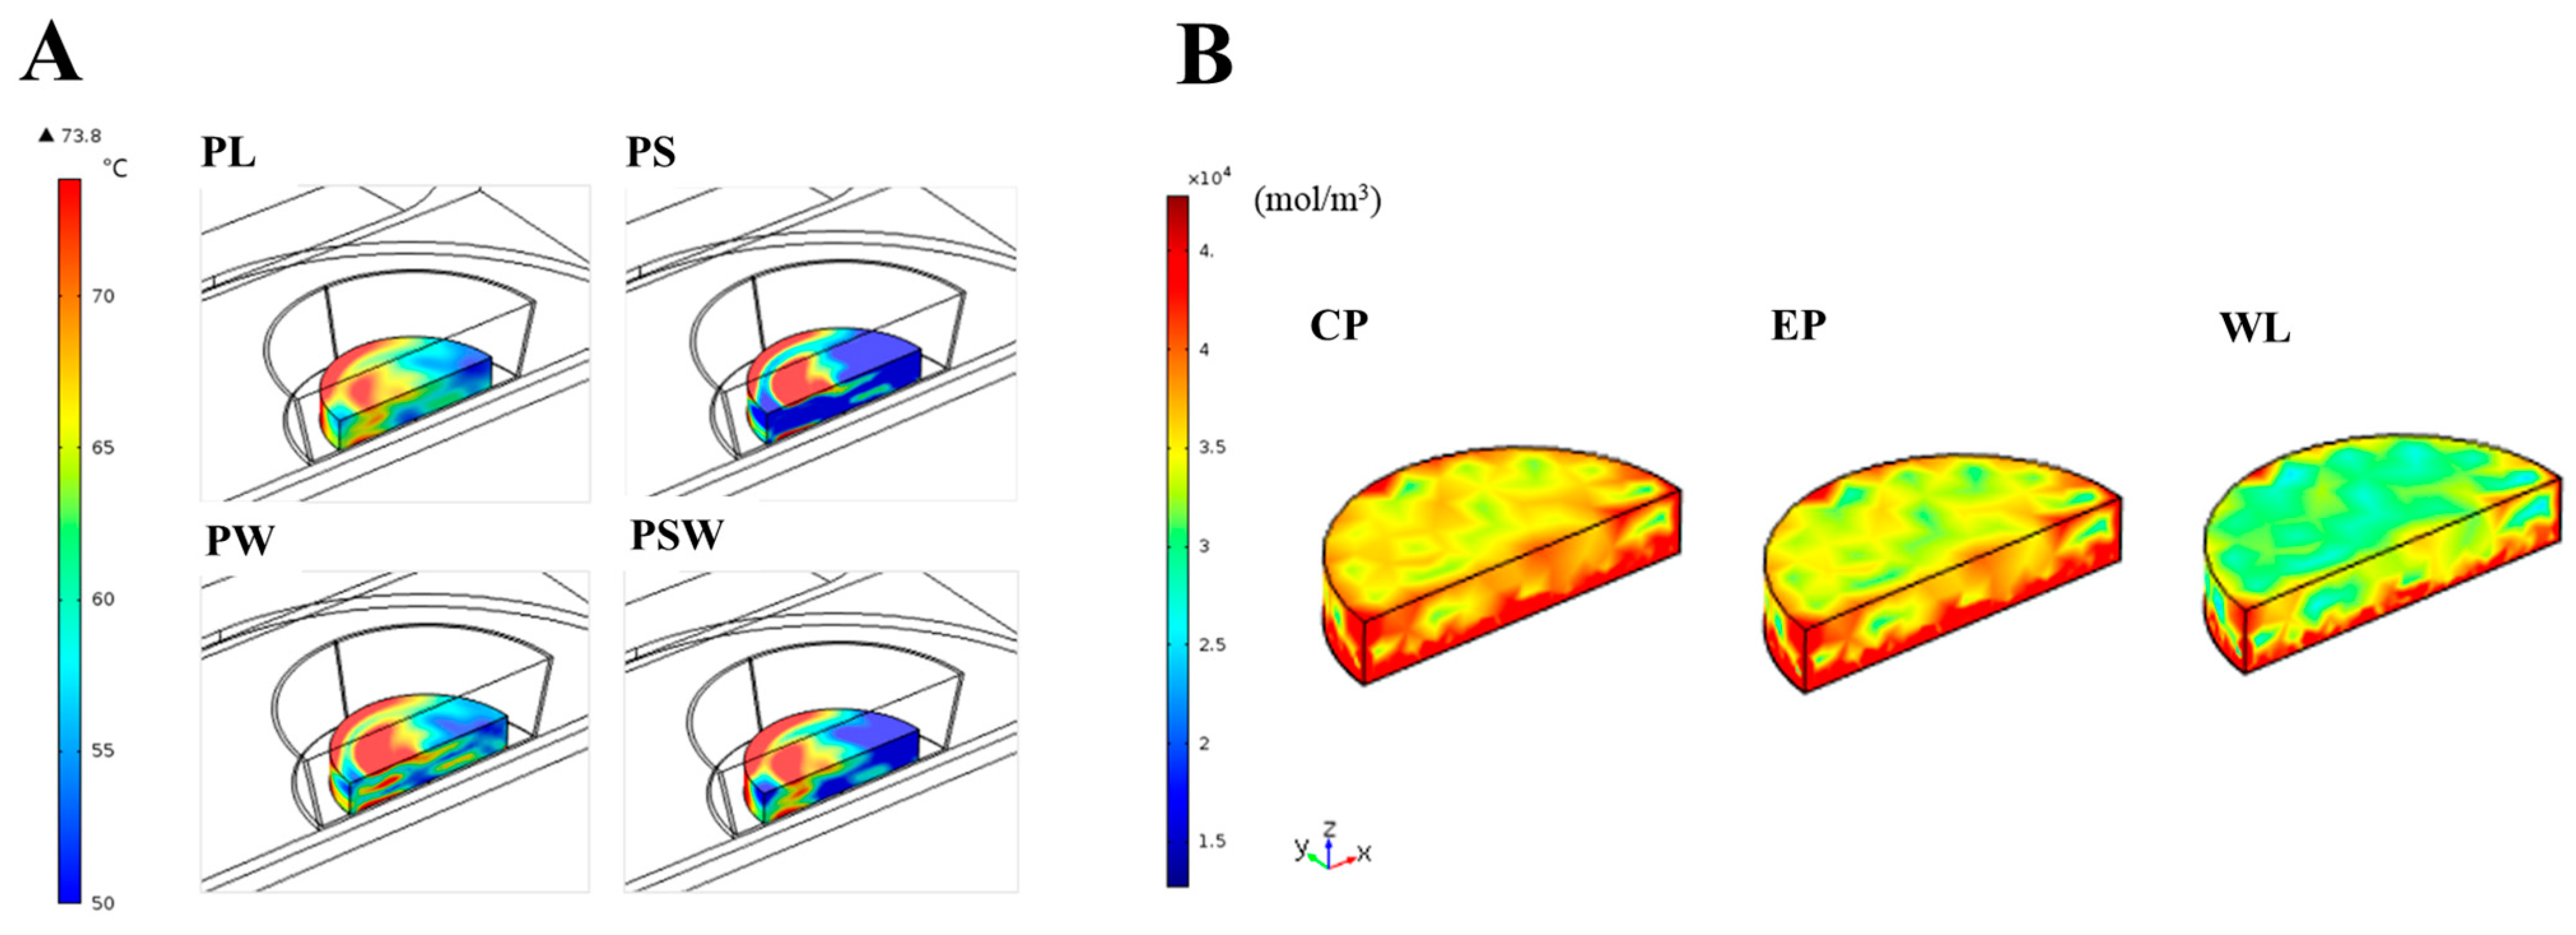
Temperature distributions obtained from simulations after 60 s of microwave heating are shown in Figure 10A. The contour profiles of the temperatures for the patties with different compositions are illustrated. It shows high non-uniformity of the microwave heating of food material. This is related to the distribution of the electric field inside the applicator and inside the patty. These results are not surprising and have been previously reported in experimental works [46,47]. Higher temperatures are observed at the outer walls and edge of the pork patties due to the edge effect. Specifically, in the case of the salt-added patty, heating by the shielding effect of the microwaves is also observed near the sample surface. Therefore, the penetration of electromagnetic waves into the patty was restricted, and the temperature of the patty slowly increased, confirmed by the experimental results. Both simulation and experiment showed that pork patties were not uniformly heated, where the temperatures of the hot spot on the edge and cold spot at the center were approximately 80 and 50 °C, respectively, after heating for 60 s. As noted in many studies, simulation results do not fully represent the experimental data. The discrepancy in experimental and simulated temperature profiles can be attributed to the assumption of a single frequency for the magnetron [21].
The simulated moisture content distribution of the PSW patty at the final time step was also evaluated in three different containers (Figure 10B). The electronic module, heat transfer module, and momentum transfer module were continuously calculated to obtain the temperature distribution as well as the moisture content distribution. As shown in Figure 10B, the simulated moisture content was in agreement with the experimental results probably reflecting the same phenomena about different convection in the containers, which demonstrates that the CP container is advantageous for maintaining the uniform quality of the patty after heating. While the temperature gradient is not much influenced by the container design, the moisture distribution clearly shows the distinct result by the existence of the lid and the location of the aperture.
Experimental observation alone would not guarantee uniform heating in a domestic microwave, but the simulation model is expected to provide information that will help optimize the product information of the ingredients and their interaction with the container design to achieve more uniform heating.

4.6. Simulated Temperature Profile and Validation

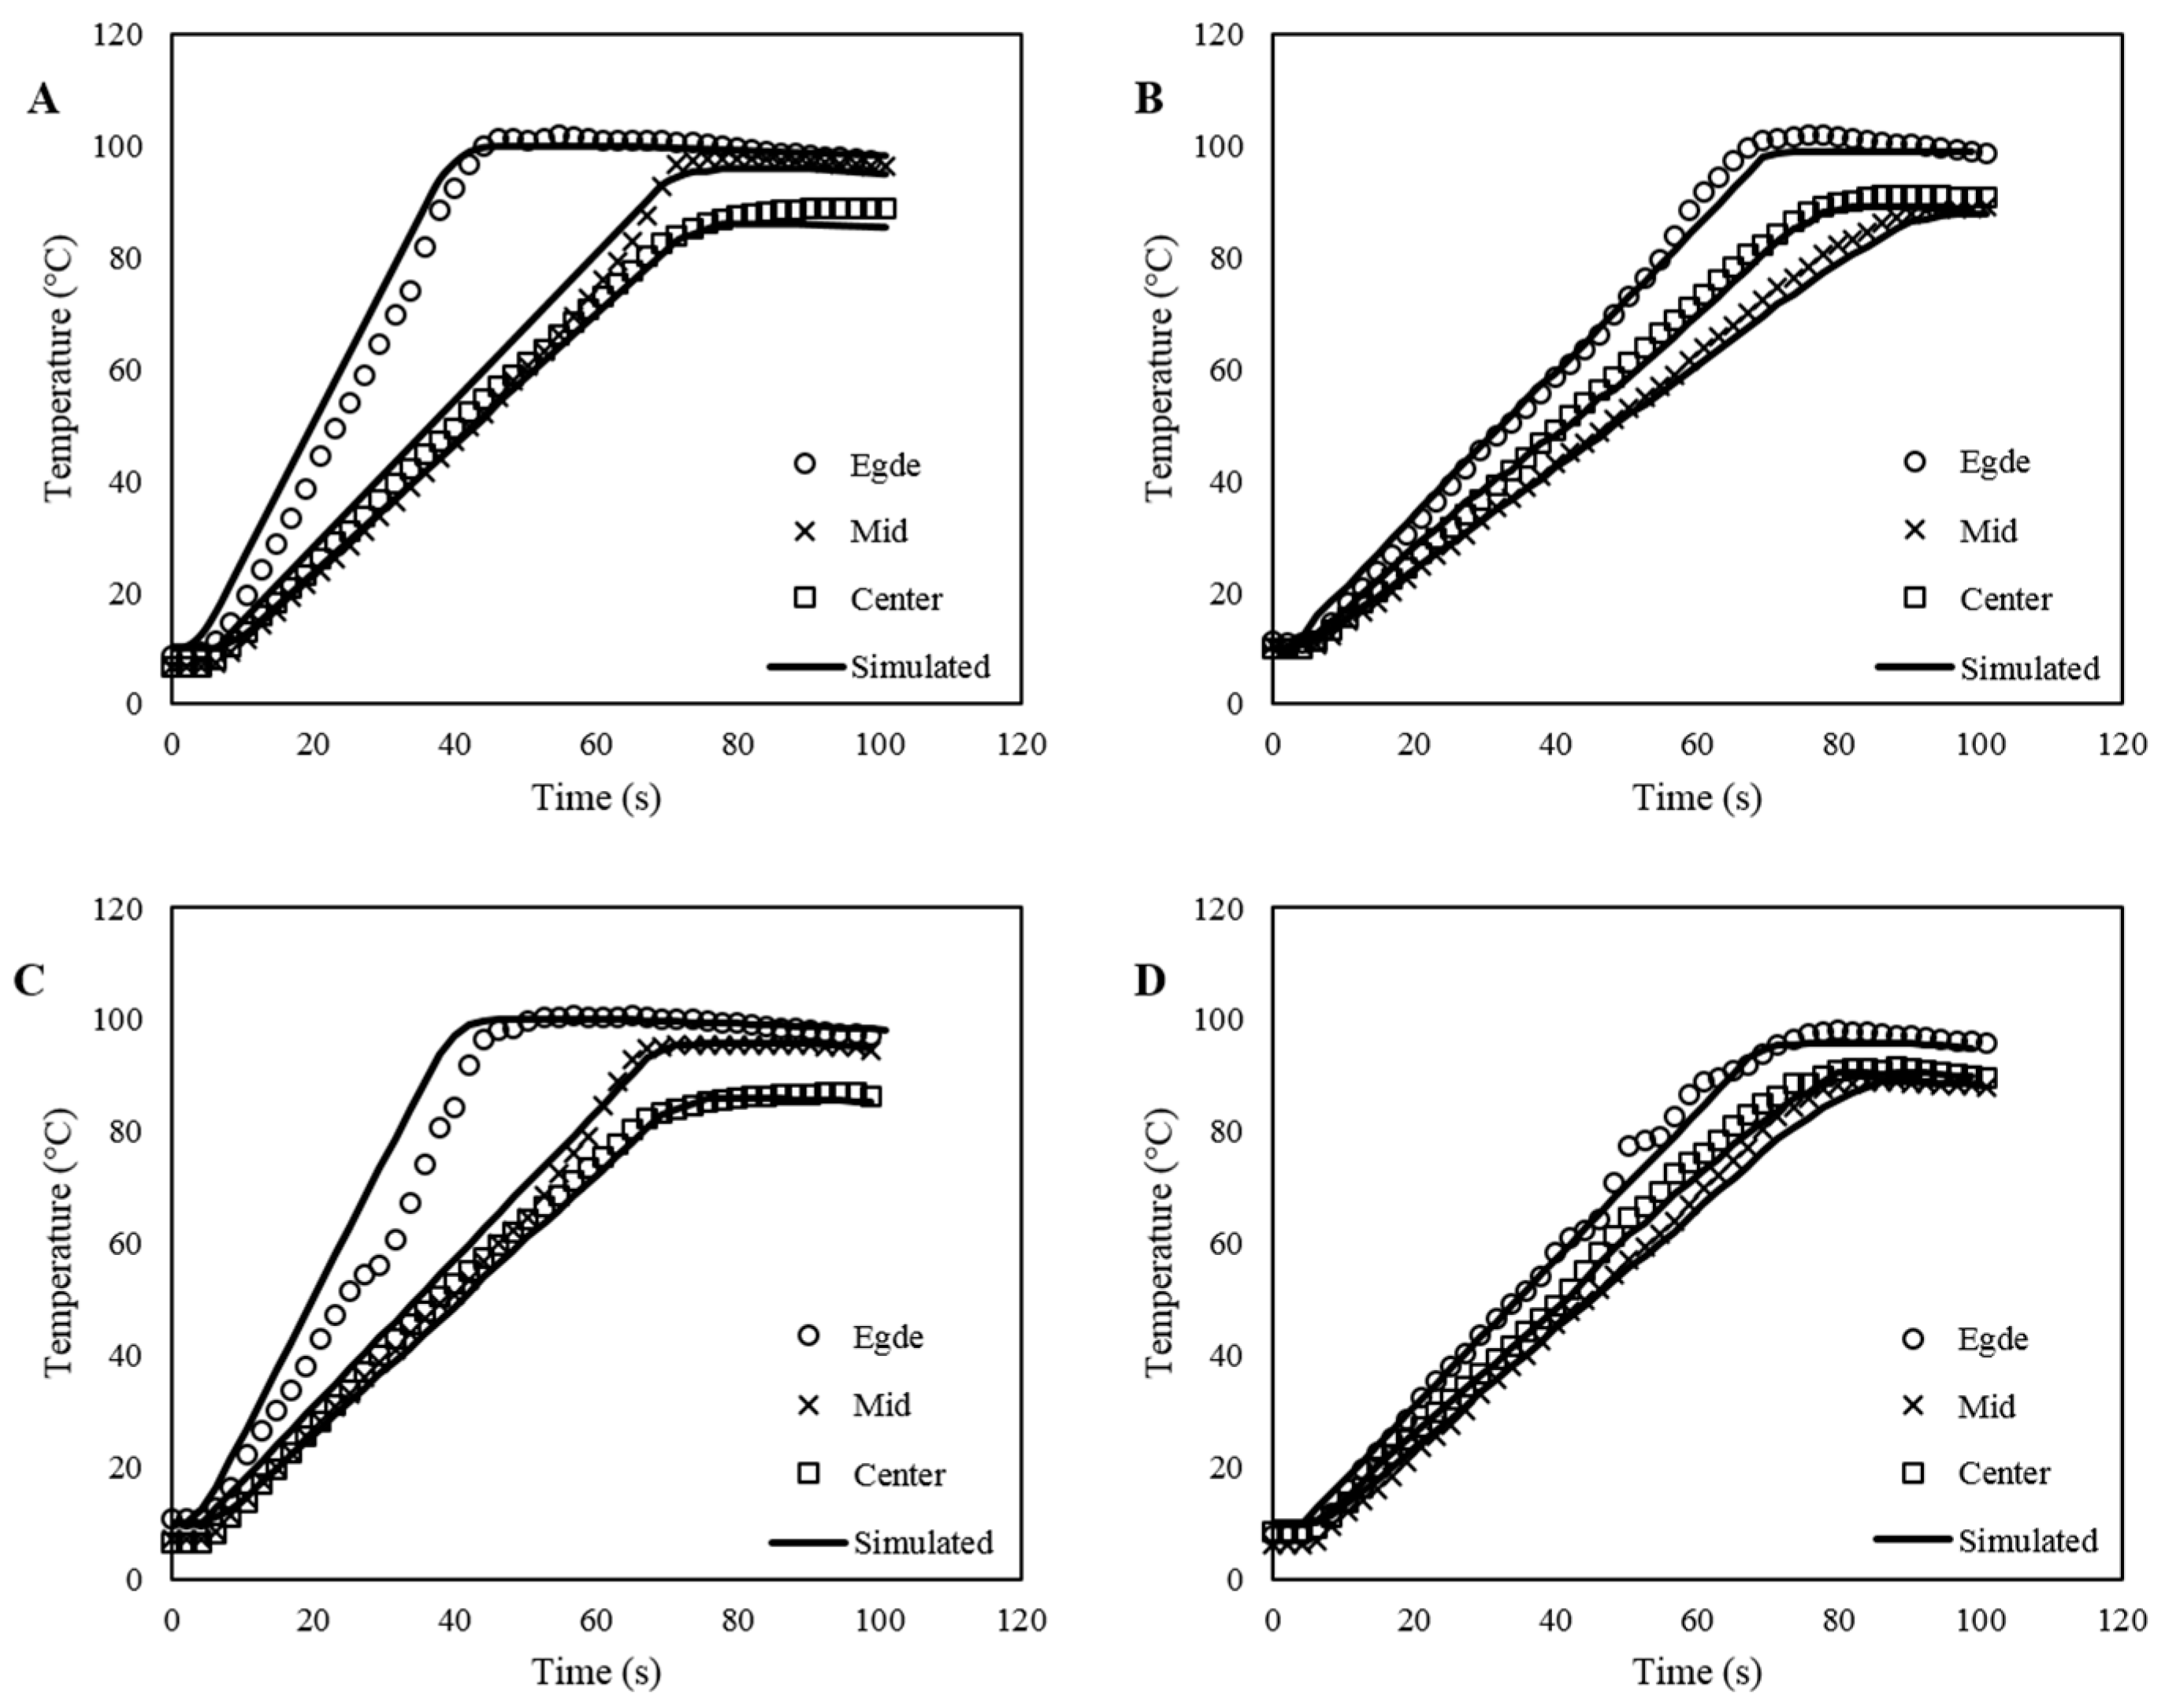
The simulated temperatures at three locations of the pork patties heated in a center-perforated lid were compared with the average experimental temperature profiles, as shown in Figure 11. We validated the model using all the data and showed the center-perforated container only as a representative figure. The simulated results showed good agreement with the experiment results. The non-uniform heating was also observed in the simulated temperature profile. The simulated temperature for the patties with salt (Figure 11B,D) slightly underpredicted the actual temperature, which can be attributed to the inaccuracy of the heating patterns in the simulation. Generally, all the simplifications of a single frequency (2.45 GHz), geometric model, and physical phenomena such as moisture loss in the model development influence the electromagnetic field distribution and power density distribution, which greatly influence the temperature prediction.
The root mean square error (RMSE) and R2 values were calculated using averaged experimental time–temperature profiles compared to simulated time–temperature profiles (Table 3). The RMSE values ranged from 4.46 °C to 18.39 °C for the patties without salt, whereas the patties with salt had higher RMSE values ranging from 13.67 °C to 22.96 °C. Some of the errors in model predictions, especially in the patties with salt, can be attributed to the dramatic variation of electric field distribution inside the food product, as discussed above. In addition, the RMSE for the WL container showed slightly higher values than those in the tray with CP and EP containers, which can be attributed to the inconsistency in the numerical results. As noted above, simplifications for solving complex physical phenomena, including electromagnetic power generation, heat transfer, and evaporation, may not capture the actual phenomena completely. The WL container may show high error due to more evaporation during heating. However, the RMSE values are comparable to previous studies that applied simplified numerical models. In the study of Chen et al. [48], the RMSE range of their study was 5.5 to 24.1 °C when a simplified model was used, reducing the computational time remarkably. They described that the high RMSE might be due to the inconsistency in magnetron performance during microwave heating. In addition, the temperature measurements were highly dependent on the sensor positions. In the study of microwave thawing process of congee frozen rice [22], the RMSE values ranged from 6.14 to 12.88 °C. They used a microwaveable plastic container for all experiments (single container condition), and the experimental data were compared to the result simulated by a simplified model.

5. Conclusions

In this study, the importance of chemical and physical modifications in a ready meal, pork patties, on microwave heating uniformity and heating properties was investigated, and a simulation model was developed to describe microwave heating patterns. Microwave-heated pork patties showed considerable non-uniformity in temperature. Proper heat distribution could be achieved using the container with a center-perforated lid (CP) in a short time. In addition, the CP container minimized moisture loss by keeping the vapor within the container. The heating uniformity and final quality of the pork patties with different components could be improved using a proper container. The proposed simplified simulation model was able to describe and predict the temperature profiles and moisture distribution (uniformity); thus, it is a useful tool for the designing and management of the microwave heating process. The essential advantage of this approach is that the product formulation does not have to be changed to achieve the desired uniformity of temperature and moisture distribution. These results could be used to come up with a container design strategy for use in the food industry, especially in developing new products and product packaging.

Supplementary Materials

The following supporting information can be downloaded at: https://www.mdpi.com/article/10.3390/pr10112382/s1, Figure S1. Cutting force of pork patties before and after microwave heating.

Author Contributions

Conceptualization, H.J., M.G.L. and W.B.Y.; methodology, H.J., M.G.L. and W.B.Y.; software, M.G.L.; validation, M.G.L.; investigation, H.J., M.G.L. and W.B.Y.; writing—original draft preparation, H.J., M.G.L. and W.B.Y.; writing—review and editing, H.J. and W.B.Y.; visualization, H.J. and M.G.L.; supervision, W.B.Y. All authors have read and agreed to the published version of the manuscript.

Funding

This research was supported by the Basic Science Research Program through the National Research Foundation of Korea (NRF) funded by the Ministry of Education (grant number NRF-2018R1D1A3B06042501 and grant number NRF-2020-D-G035-010104). Following are the results of a study on the “Leaders in INdustry-university Cooperation 3.0” Project (202210760001), supported by the Ministry of Education and National Research Foundation of Korea.

Data Availability Statement

The data presented in this study are available on request from the corresponding author.

Conflicts of Interest

The authors declare no conflict of interest.

References

  1. Chandrasekaran, S.; Ramanathan, S.; Basak, T. Microwave food processing—A review. Food Res. Int. 2013, 52, 243–261. [Google Scholar] [CrossRef]
  2. Liu, S.; Fukuoka, M.; Sakai, N. A finite element model for simulating temperature distributions in rotating food during microwave heating. J. Food Eng. 2013, 115, 49–62. [Google Scholar] [CrossRef]
  3. Zhang, M.; Tang, J.; Mujumdar, A.S.; Wang, S. Trends in microwave-related drying of fruits and vegetables. Trends Food Sci. Technol. 2006, 17, 524–534. [Google Scholar] [CrossRef]
  4. Salazar-González, C.; Martín-González, S.; Fernanda, M.; López-Malo, A.; Sosa-Morales, M.E. Recent studies related to microwave processing of fluid foods. Food Bioproc. Technol. 2012, 5, 31–46. [Google Scholar] [CrossRef]
  5. Campanone, L.A.; Zaritzky, N.E. Mathematical analysis of microwave heating process. J. Food Eng. 2005, 69, 359–368. [Google Scholar] [CrossRef]
  6. Datta, A.K.; Geedipalli, S.S.; Almeida, M.F. Microwave combination heating. Food Technol. 2005, 59, 36–40. [Google Scholar]
  7. Kutlu, N.; Pandiselvam, R.; Saka, I.; Kamiloglu, A.; Sahni, P.; Kothakota, A. Impact of different microwave treatments on food texture. J. Texture Stud. 2021. (early view). [Google Scholar] [CrossRef] [PubMed]
  8. Ryynänen, S.; Ohlsson, T. Microwave Heating Uniformity of Ready Meals as Affected by Placement, Composition, and Geometry. J. Food Sci. 1996, 61, 620–624. [Google Scholar] [CrossRef]
  9. Zhang, H.; Datta, A.K. Microwave power absorption in single-and multiple-item foods. Food Bioprod. Process. 2003, 81, 257–265. [Google Scholar] [CrossRef]
  10. Geedipalli, S.; Rakesh, V.; Datta, A.K. Modeling the heating uniformity contributed by a rotating turntable in microwave ovens. J. Food Eng. 2007, 82, 359–368. [Google Scholar] [CrossRef]
  11. Rakesh, V.; Seo, Y.; Datta, A.K.; McCarthy, K.L.; McCarthy, M.J. Heat transfer during microwave combination heating: Computational modeling and MRI experiments. AIChE J. 2010, 56, 2468–2478. [Google Scholar] [CrossRef]
  12. Vilayannur, R.S.; Puri, V.M.; Anantheswaran, R.C. Size and shape effect on nonuniformity of temperature and moisture distributions in microwave heated food materials: Part I simulation. J. Food Process Eng. 1998, 21, 209–233. [Google Scholar] [CrossRef]
  13. Kelen, A.; Ress, S.; Nagy, T.; Pallai, E.; Pintye-Hodi, K. Mapping of temperature distribution in pharmaceutical microwave vacuum drying. Powder Technol. 2006, 162, 133–137. [Google Scholar] [CrossRef]
  14. Lespinard, A.R.; Arballo, J.R.; Badin, E.E.; Mascheroni, R.H. Comparative study between conventional and microwave-assisted pasteurization of packaged milk by finite element modeling. J. Food Process. Preserv. 2019, 43, e14207. [Google Scholar] [CrossRef]
  15. Vadivambal, R.; Jayas, D.S. Non-uniform temperature distribution during microwave heating of food materials—A review. Food Bioprocess Technol. 2010, 3, 161–171. [Google Scholar] [CrossRef]
  16. Ozen, B.F.; Floros, J.D. Effects of emerging food processing techniques on the packaging materials. Trends Food Sci. Technol. 2001, 12, 60–67. [Google Scholar] [CrossRef]
  17. Ozkoc, S.O.; Sumnu, G.; Sahin, S. Chapter 20—Recent Developments in Microwave Heating. In Emerging Technologies for Food Processing, 2nd ed.; Sun, D.W., Ed.; Elsevier Ltd.: Amsterdam, The Netherlands, 2015; pp. 361–383. [Google Scholar] [CrossRef]
  18. Pitchai, K.; Chen, J.; Birla, S.; Gonzalez, R.; Jones, D.; Subbiah, J. A microwave heat transfer model for a rotating multi-component meal in a domestic oven: Development and validation. J. Food Eng. 2014, 128, 60–71. [Google Scholar] [CrossRef]
  19. Roohi, R.; Hashemi, S.M.B. Experimental, heat transfer and microbial inactivation modeling of microwave pasteurization of carrot slices as an efficient and clean process. Food Bioprod. Process. 2020, 121, 113–122. [Google Scholar] [CrossRef]
  20. Datta, A.K.; Anantheswaran, R.C. Handbook of Microwave Technology for Food Application, 1st ed.; CRC Press: New York, NY, USA, 2001. [Google Scholar]
  21. Chen, J.; Pitchai, K.; Birla, S.; Negahban, M.; Jones, D.; Subbiah, J. Heat and mass transport during microwave heating of mashed potato in domestic oven—Model development, validation, and sensitivity analysis. J. Food Sci. 2014, 79, E1991–E2004. [Google Scholar] [CrossRef]
  22. Klinbun, W.; Rattanadecho, P. Numerical study of initially frozen rice congee with thin film resonators package in microwave domestic oven. J. Food Process Eng. 2022, 45, e13924. [Google Scholar] [CrossRef]
  23. Thuto, W.; Banjong, K. Investigation of Heat and Moisture Transport in Bananas during Microwave Heating Process. Processes 2019, 7, 545. [Google Scholar] [CrossRef] [Green Version]
  24. Hou, L.; Li, R.; Wang, S.; Datta, A.K. Numerical analysis of heat and mass transfers during intermittent microwave drying of Chinese jujube (Zizyphus jujuba Miller). Food Bioprod. Process 2021, 129, 10–23. [Google Scholar] [CrossRef]
  25. Gulati, T.; Datta, A.K.; Ranjbaran, M. Selective heating and enhanced boiling in microwave heating of multicomponent (solid–liquid) foods. J. Food Process Eng. 2020, 43, e13320. [Google Scholar] [CrossRef]
  26. Ni, H.; Datta, A.K.; Parmeswar, R. Moisture loss as related to heating uniformity in microwave processing of solid foods. J. Food Process Eng. 1999, 22, 367–382. [Google Scholar] [CrossRef]
  27. Ollinger-Snyder, P.; El-Gazzar, F.; Matthews, M.E.; Marth, E.H.; Unklesbay, N. Thermal destruction of Listeria monocytogenes in ground pork prepared with and without soy hulls. J. Food Prot. 1995, 58, 573–576. [Google Scholar] [CrossRef]
  28. AOAC. Official Methods of Analysis of AOAC; Association of Official Analytical Chemists: Arlington, TX, USA, 1990. [Google Scholar]
  29. Campañone, L.A.; Bava, J.A.; Mascheroni, R.H. Modeling and process simulation of controlled microwave heating of foods by using of the resonance phenomenon. Appl. Therm. Eng. 2014, 73, 914–923. [Google Scholar] [CrossRef]
  30. Tuta, S.; Palazoğlu, T.K. Finite element modeling of continuous-flow microwave heating of fluid foods and experimental validation. J. Food Eng. 2017, 192, 79–92. [Google Scholar] [CrossRef]
  31. Navarrete, A.; Mato, R.B.; Cocero, M.J. A predictive approach in modeling and simulation of heat and mass transfer during microwave heating. Application to SFME of essential oil of Lavandin Super. Chem. Eng. Sci. 2012, 68, 192–201. [Google Scholar] [CrossRef]
  32. ASHRAE. ASHRAE Handbook—Refrigeration; American Society of Heating: Peachtree Corners, GA, USA, 2006; Chapter 9; pp. 9.1–9.31. [Google Scholar]
  33. Sipahioglu, O.; Barringer, S.A.; Taub, I.; Prakash, A. Modeling the dielectric properties of ham as a function of temperature and composition. J. Food Sci. 2003, 68, 904–909. [Google Scholar] [CrossRef]
  34. Ngadi, M.; Dev, S.R.; Raghavan, V.G.; Kazemi, S. Dielectric properties of pork muscle. Int. J. Food Prop. 2015, 18, 12–20. [Google Scholar] [CrossRef]
  35. Risman, P.O. Metal in the microwave oven. Microw. World 1992, 13, 28–35. [Google Scholar]
  36. Risman, P.O.; Swedish Institute for Food Research, Göteborg, Sweden; Ohlsson, T.; Swedish Institute for Food Research, Göteborg, Sweden. Field concentrations in dielectric wedges. Personal communication, 1995. [Google Scholar]
  37. Jeong, J.Y.; Lee, E.S.; Choi, J.H.; Lee, J.Y.; Kim, J.M.; Min, S.G.; Chae, Y.C.; Kim, C.J. Variability in temperature distribution and cooking properties of ground pork patties containing different fat level and with/without salt cooked by microwave energy. Meat Sci. 2007, 75, 415–422. [Google Scholar] [CrossRef] [PubMed]
  38. Yang, R.; Chen, Q.; Chen, J. Comparison of heating performance between inverter and cycled microwave heating of foods using a coupled multiphysics-kinetic model. J. Microw. Power Electromagn. Energy 2021, 55, 45–65. [Google Scholar] [CrossRef]
  39. Engelder, D.S.; Buffler, C.R. Measuring dielectric properties of food products at microwave frequencies. Microw. World 1991, 12, 6–15. [Google Scholar]
  40. Dong, J.; Kou, X.; Liu, L.; Hou, L.; Li, R.; Wang, S. Effect of water, fat, and salt contents on heating uniformity and color of ground beef subjected to radio frequency thawing process. Innov. Food Sci. Emerg. Technol. 2021, 68, 102604. [Google Scholar] [CrossRef]
  41. Sakai, N.; Mao, W.; Koshima, Y.; Watanabe, M. A method for developing model food system in microwave heating studies. J. Food Eng. 2005, 66, 525–531. [Google Scholar] [CrossRef]
  42. Burfoot, D.; Griffin, W.J.; James, S.J. Microwave pasteurisation of prepared meals. J. Food Eng. 1988, 8, 145–156. [Google Scholar] [CrossRef]
  43. McDonnell, C.K.; Allen, P.; Duggan, E.; Arimi, J.M.; Casey, E.; Duane, G.; Lyng, J.G. The effect of salt and fibre direction on water dynamics, distribution and mobility in pork muscle: A low field NMR study. Meat Sci. 2013, 95, 51–58. [Google Scholar] [CrossRef]
  44. Regier, M.; Schubert, H. Microwave processing. In Thermal Technologies in Food Processing; Richardson, P., Ed.; CRC Press: New York, NY, USA, 2001; p. 294. [Google Scholar]
  45. Salvi, D.; Boldor, D.; Aita, G.M.; Sabliov, C.M. COMSOL Multiphysics model for continuous flow microwave heating of liquids. J. Food Eng. 2011, 104, 422–429. [Google Scholar] [CrossRef]
  46. Dibben, D. Electromagnetics: Fundamental aspects and numerical modeling. In Handbook of Microwave Technology for Food Application, 1st ed.; CRC Press: New York, NY, USA, 2001; pp. 25–56. [Google Scholar]
  47. Zhang, H.; Datta, A.K. Electromagnetics of microwave heating: Magnitude and uniformity of energy absorption in an oven. In Handbook of Microwave Technology for Food Application, 1st ed.; CRC Press: New York, NY, USA, 2001; pp. 57–92. [Google Scholar]
  48. Chen, J.; Pitchai, K.; Birla, S.; Jones, D.; Negahban, M.; Subbiah, J. Modeling heat and mass transport during microwave heating of frozen food rotating on a turntable. Food Bioprod. Process. 2016, 99, 116–127. [Google Scholar] [CrossRef]
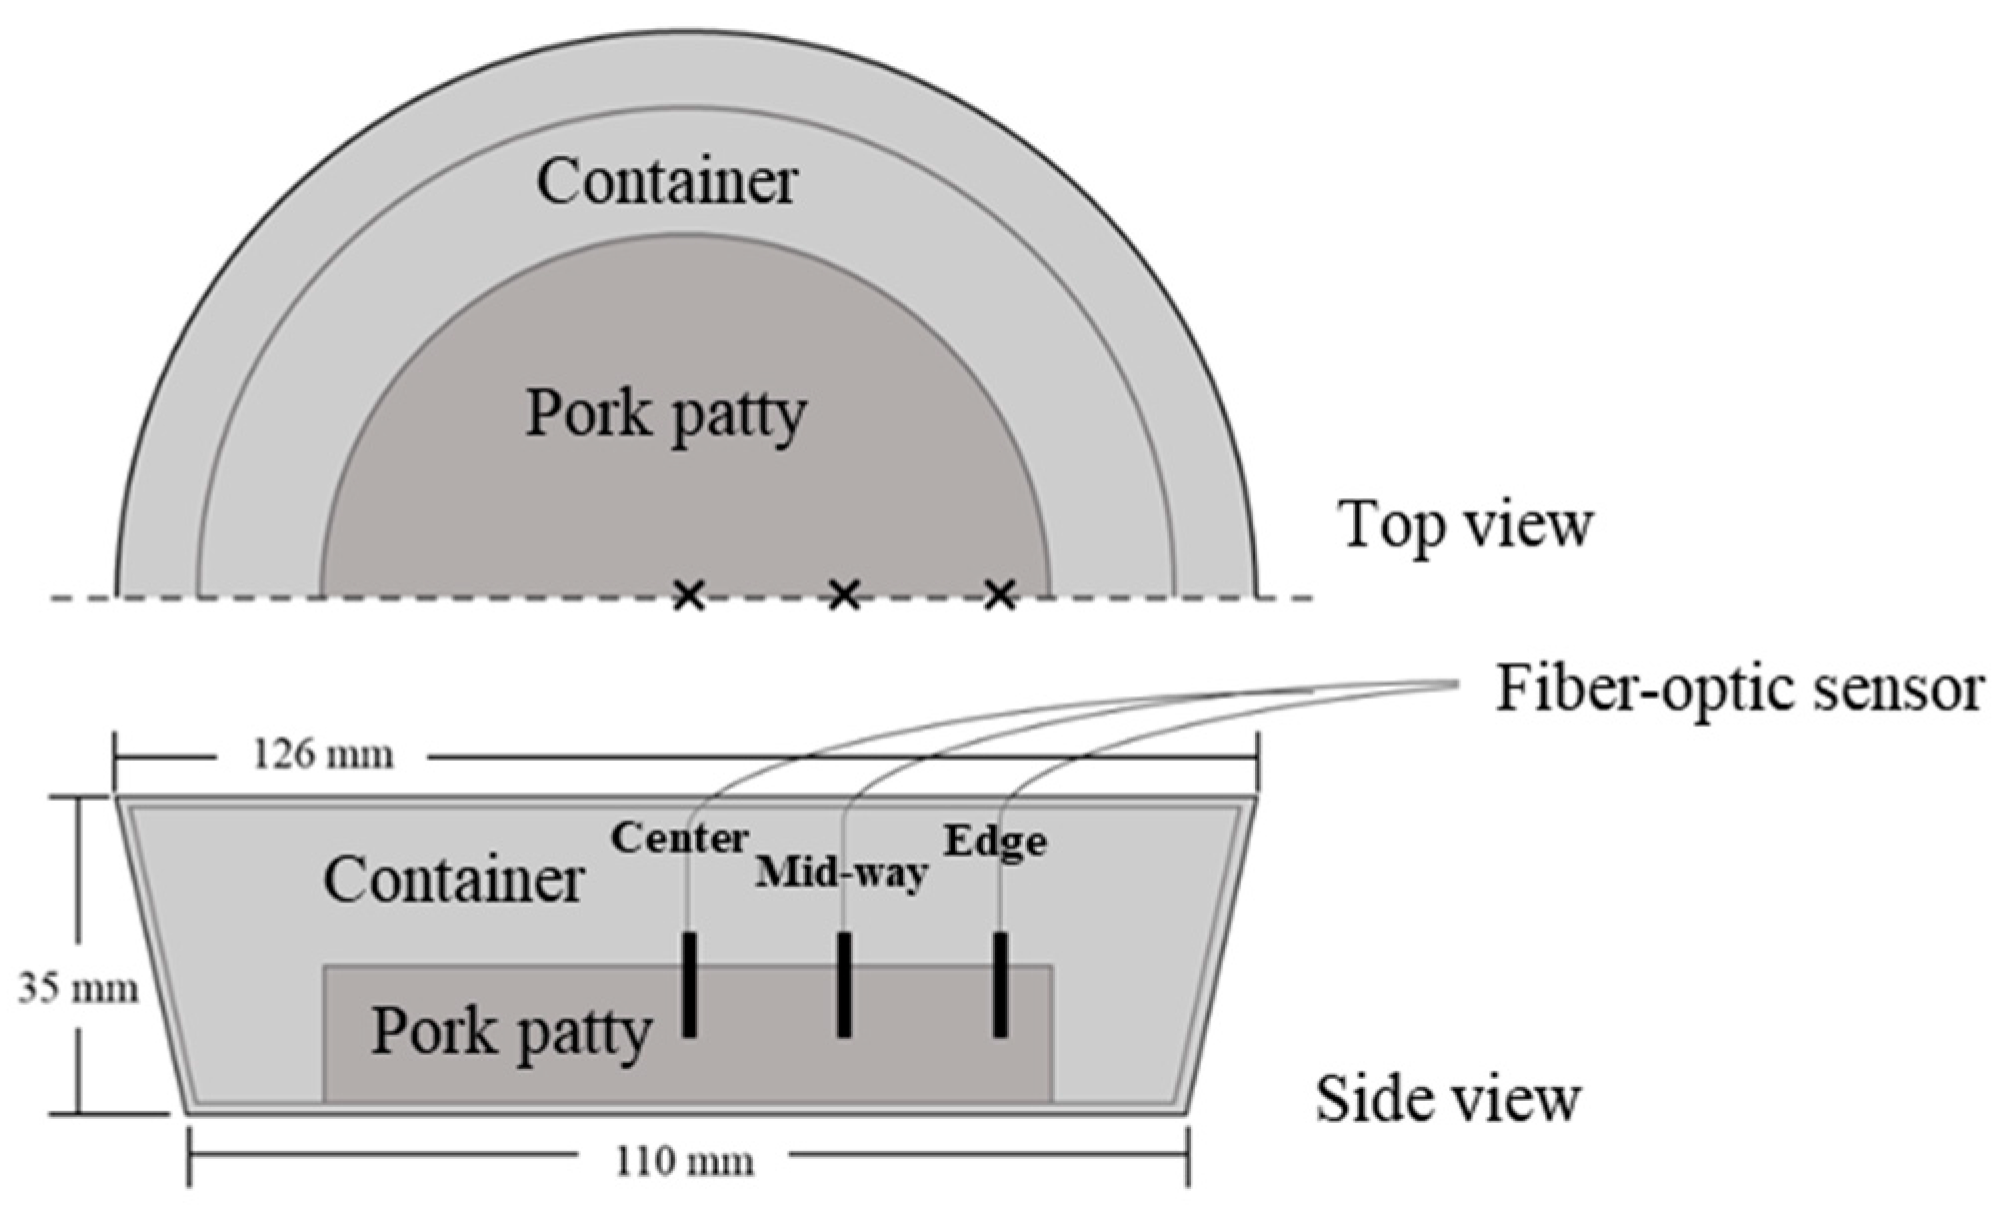
Figure 1. A schematic of the microwave tray showing the three sensor locations used to evaluate temperature distribution.
Processes 10 02382 g001
Figure 2. The 3-D geometric model developed using the COMSOL software with transparency (A) and wireframe rendering (B) image and meshing scheme (C) implemented for the microwave cavity, pork patty, and container, and the geometric model for the container with a center-perforated lid (D), edge-perforated lid (E), and without lid (F).
Processes 10 02382 g002
Figure 3. Time–temperature profile at the edge, mid-way, and the center position of the pork patties containing different salt and water levels in the container with a center-perforated lid during microwave heating. (A) Pork only (PL), (B) Pork + salt 2% (PS), (C) Pork + water 10% (PW), (D) Pork + salt 2% + water 10% (PSW).
Processes 10 02382 g003
Figure 4. Time–temperature profile at the edge, mid-way, and the center position of the pork patties containing different salt and water levels in the container with an edge-perforated lid during microwave heating. (A) Pork only (PL), (B) Pork + salt 2% (PS), (C) Pork + water 10% (PW), (D) Pork + salt 2% + water 10% (PSW).
Processes 10 02382 g004
Figure 5. Time–temperature profile at the edge, mid-way, and the center position of the pork patties containing different salt and water levels in the container without lid during microwave heating. (A) Pork only (PL), (B) Pork + salt 2% (PS), (C) Pork + water 10% (PW), (D) Pork + salt 2% + water 10% (PSW).
Processes 10 02382 g005
Figure 6. (A) The average heating rate and (B) the average temperature when the slowest heating part of the pork patties (prepared with different compositions heated in various container designs) reached 80 °C (ΔTt=80°C). CP: container with center-perforated lid; EP: container with edge-perforated lid; WL: container without a lid; PL: pork only; PS: pork + 2% salt; PW: pork + 10% water; PSW: pork + 2% salt + 10% water. Values in the same sample with different lowercase letters denote significant differences (p < 0.05).
Processes 10 02382 g006
Figure 7. Moisture contents of pork patties before and after microwave heating.
Processes 10 02382 g007
Figure 8. Scanning electron micrographs of the edge part of PSW pork patties (5000× magnification): (A) before microwave heating (sous vide), (BD) heated in the tray with center-perforated lid, edge-perforated lid, and without lid, respectively. Scale = 10 μm.
Processes 10 02382 g008
Figure 9. Distribution of the electric field at 700 W inside the microwave oven (A) and the cross-section spatial distribution of electromagnetic power density (W/m3) for the pork patties (B).
Processes 10 02382 g009
Figure 10. Simulated temperature distributions for the pork patties with different compositions (A) and moisture content distribution of PSW patty heated in the various containers (B).
Processes 10 02382 g010
Figure 11. Simulated and experimental time–temperature profile at three locations for PL (A), PS (B), PW (C), and PSW patties (D) during microwave heating in the tray with a center-perforated lid.
Processes 10 02382 g011
Table 1. Composition and pH of the pork patty samples.
SampleRaw MaterialMoisture Contents (%)Salt Contents (%)Ash Content (%)pH
PLPork Loin70.65 ± 0.140.04 ± 0.011.06 ± 0.045.67 ± 0.14
PSPork Loin + 2% salt67.20 ± 0.442.04 ± 0.033.07 ± 0.055.67 ± 0.11
PWPork Loin + 10% water74.21 ± 0.130.03 ± 0.010.95 ± 0.085.68 ± 0.08
PSWPork Loin + 2% salt + 10% water72.99 ± 1.602.02 ± 0.022.93 ± 0.035.69 ± 0.10
Table 2. Thermal and dielectric properties of the pork patties.
SampleThermal Conductivity (k)
(W/m K)
Density (P) (kg/m3)Specific Heat (Cp)
(J/kg K)
Dielectric
Constant (εr)
Dielectric Loss
(ε0)
PL0.4189948.33463.448.2118.44
PS0.4220949.03474.446.8219.56
PW0.4417953.63544.049.1817.46
PSW0.4371952.53527.848.4117.95
Table 3. Root mean square error (RMSE) and R2 value of simulation and averaged experiment temperature profiles.
SampleContainer DesignAverage RMSE (°C)Average R2
PLCP4.460.94
EP8.410.93
WL18.390.91
PSCP13.920.90
EP14.560.90
WL21.200.89
PWCP6.850.92
EP8.620.94
WL16.830.91
PSWCP13.670.89
EP16.320.92
WL22.960.89
Publisher’s Note: MDPI stays neutral with regard to jurisdictional claims in published maps and institutional affiliations.