Article

The Efficacy of Phenolic Compound Extraction from Potato Peel Waste

1
Department of Food Science, Purdue University, West Lafayette, IN 47907, USA
2
Department of Bioengineering, Jilin Agricultural University, Changchun 130118, China
3
School of Engineering Technology (Retired), Purdue University, West Lafayette, IN 47907, USA
*
Author to whom correspondence should be addressed.
Processes 2022, 10(11), 2326; https://doi.org/10.3390/pr10112326
Submission received: 7 October 2022 / Revised: 31 October 2022 / Accepted: 4 November 2022 / Published: 8 November 2022

Abstract

:
As an agroindustrial waste product, potato peels contain valuable phenolic compounds that can be extracted before they are sent to the landfill. Based on previous work, this study focused on determining the efficacies of phenolic compound extraction from potato peels using conventional shaking extraction (CSE) and both direct ultrasound-assisted extraction (DUAE), and indirect ultrasound-assisted extraction (IUAE). The yield curve associated with each extraction method was measured and characterized. The maximum yield of phenolic compounds and its dependence on processing parameters were evaluated. The applicability of the Peleg model for describing the yield curve was evaluated. Based on the Peleg model, a recovery ratio was defined to calculate its corresponding extraction rate. This extraction rate, combined with the yield, can be used for describing the efficacy of an extraction method. Our results indicate that the ultrasound-assisted extraction methods were capable of extracting phenolic compounds at a given recovery ratio one or two orders of magnitude faster than the CSE method. Models described in the article are expected to be useful in evaluating the extraction efficacy of valuable compounds from various agricultural or agroindustrial waste.

Graphical Abstract

1. Introduction

In general, potato peels are viewed as agroindustrial waste. As a staple food source [1], potatoes are usually peeled, generating over a million tons of potato peels annually in the U.S. alone. This leads to disposal, sanitation, and environmental problems [2,3,4]. However, potato peels contain valuable chemicals including phenolic compounds, which are natural antioxidants [5,6,7,8]. The food industry relies on synthetic antioxidants for preventing lipid oxidation [9]. The use of synthetic antioxidants is linked to a number of health risks such as hepatic damage and the development of cancers. Excessive amounts of synthetic antioxidants could lead to DNA mismatches or damage. The natural antioxidants extracted from potato peels are potential replacements for synthetic antioxidants, including butylated hydroxyanisole (BHA), butylated hydroxytoluene (BHT), and tertiary butylhydroquinone (TBHQ). Recent research has shown that potato peel extracts perform better than butylated hydroxyanisole (BHA) and butylated hydroxytoluene when it comes to preventing oxidation in certain oils [10,11,12,13].
The conventional method for phenolic compound extraction from potato peels is shaking extraction, which is associated with a long extraction time with low yields [14,15,16]. Admittedly, there are innovative methods including subcritical water extraction, microwave-assisted extraction, high-pressure homogenization extraction, pressurized liquid extraction, and ultrasound-assisted extraction [17,18,19,20,21,22,23,24,25,26]. Nevertheless, these new methods for potato peels still hold limitations. The efficacies of these methods are difficult to evaluate due to (1) the lack of experimental data and (2) the lack of accepted models for describing the yield curve associated with each method.
The Peleg model [27] is one of the models that can be used for the description of the yield curve of phenolic compounds from potato peels. Kumari et al. [3] made an attempt to use Peleg’s sorption model to describe the extraction kinetic of total phenolic compounds and individual phenolic components as a function of potato peel type and ultrasonic frequency. One of the issues in using the Peleg model is that most of the experiments reported in the literature were not designed to meet the model requirements for having sufficient data in the initial testing to ensure model accuracy. The dry potato peels were usually soaked in the solvent for a certain duration before each test. It is difficult to estimate the amount of phenolic compounds that are extracted during the soaking period, although the amount could be small with the slow conventional shaking extraction. Furthermore, data are usually obtained in the time frame where yield curves become less sensitive to times, making curve fitting less accurate.
The goal of this study was to investigate the efficacy of phenolic compound yield from potato peels. Three methods were evaluated: namely CSE, IUAE, and DUAE. Based on the Peleg model, we defined a recovery ratio and calculated the time required to achieve the recovery. These two parameters, together with the yield at the given recovery ratio, can be used to evaluate the efficacy of a method for extracting phenolic compounds from potato peels. Factors that affect the efficacy of extraction and the maximum yield are discussed.

2. Materials and Methods

2.1. Materials

Basic American Foods (Blackfoot, ID, USA) provided the potato (Solanum tuberosum L.) peels. Peels were dried for 48 h at 45 °C in a convection oven. The as-received dehydrated potato peels were ground into powder. The powders were sieved and were divided into four groups based on their sizes: original (as-received), >45 mesh (particles retained on the 45-mesh screen), 45–100 mesh (particles that passed through the 45-mesh screen but retained on the 100-mesh screen), and <100 mesh (particles that passed through the 100-mesh screen). Until used, the powders were stored at −18 °C in sealed Ziploc® bags (S. C. Johnson & Son, Racine, WI, USA).
All chemicals used in this study were reagent grade. Experimental details can also be found in Ref. [13].

2.2. CSE

0.25 g of ground peel powders was mixed with 5 mL of methanol (50 %, v/v) in a 5 mL black centrifuge tube. The mixture was then put in an incubator shaker in triplicate. The incubator shaker (Environmental incubator shaker, G24, New Brunswick Co., Inc., Edison, NJ, USA) was set to the desired temperature (25 or 50 °C) and 150 rpm for varied extraction times up to 8640 min (6 days). The mixture was centrifuged at 1500× g for 15 min following the extraction. For each extraction, two samples were taken for measuring the total phenolic compounds (TPC) in the supernatant in triplicates.

2.3. IUAE

0.25 g of ground peel powders and 5 mL of methanol (50%, v/v) were mixed in a glass tube placed in the water bath of a SharperTek ultrasonic cleaner (Model XPD360-6L) (SharperTek, Pontiac, MI, USA) for 1, 2, 5, 10, 15, 30, 45, and 60 min, respectively. The bath temperature was 25 °C and the vibration frequency was 40 kHz (500 W). The mixture was centrifuged at 1500× g for 15 min following the extraction. The extraction under each condition was repeated three times. The TPC in the supernatant of each extraction was quantified in triplicates.

2.4. DUAE

Powders and methanol were mixed in a glass cylinder set in a liquid bath in a Thermo Haake K15 w/DC 10 controller (Thermo Fisher, Singapore). An E-type thermocouple was placed within the glass cylinder for recording the temperature of the mixture as a function of time with a PicoLog recorder (PicoLog software version 5.25.3, PicoLog Technology, TX, USA).
An ultrasound probe (12.7 mm diameter, model 1102, Sonics & Materials, Newtown, CT, USA) was submerged into the suspension for 5 mm in the glass cylinder for 1, 2, 5, 10, 15, 30, 45, and 60 min. The ultrasonic frequency was 22.95 kHz with an output power of 120 W. The mixture was centrifuged at 1500× g for 15 min following the extraction. The extraction under each condition was repeated three times. The TPC in the supernatant of each extraction was quantified in triplicate. Experimental details can be found in [13].
In addition, the DUAE method was utilized as an accelerated method for investigating the impact of extraction parameters on the maximum yield at a given extraction time of 30 min. The solvent-to-solid ratios were set at 10:1, 20:1, 40:1, and 60:1, respectively, by varying the amounts (2.5, 5, 10, or 15 mL) of methanol (50%, v/v) to mix with 0.25 g of potato peel powders. The temperature of the liquid bath was controlled at −2, 25, 45, and 60 °C while the temperature within the mixture was measured. The yields of phenolic compounds at 30 min of DUAE were measured.

2.5. Measurement of TPC in Potato Peel Extracts

TPC were determined with the Folin–Ciocalteau method [9] with some modifications. Details can be found in [13]. The measured TPC was expressed as milligrams of gallic acid equivalents per gram dry weight of potato peel powders (mg GAE/g dry wt.).

2.6. Statistical Analysis

Analysis of variance was performed using SPSS, version 23.0 (SPSS Inc., Chicago, IL, USA). The mean TPC was the average of triplicate measurements. The level of significance was set at p < 0.05.

3. Results and Discussion

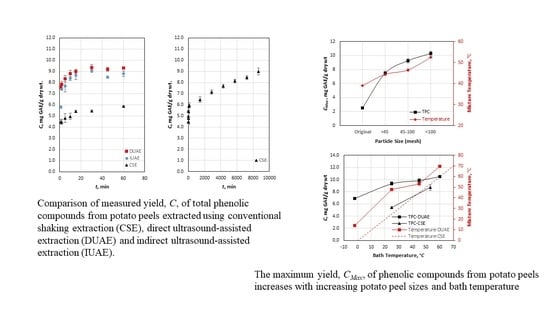
3.1. Yield Curves of Selected Methods

Figure 1 depicts the yields of TPC of the three selected methods where C is the TPC extracted, and t is the extraction time. Figure 1a shows that the yield curves associated with the ultrasound-assisted extraction (DUAE and IUAE) are significantly higher than that with the CSE method in the first 60 min of extraction. This means that the UAE methods are capable of extracting or recovering more TPC from potato peel waste at much faster rates or with much shorter times than CSE. Of the two UAE methods, the yield curve of DUAE is slightly higher than that of IUAE. It seems that there is a plateau TPC, CP, on the yield curve for each method, being 9.3, 9.09, and 5.86 mg GAE/g dry wt. for DUAE, IDEA, and CSE, respectively. The plateau TPC is reached at about 30 min for UAE (either DUAE or IUAE) as shown in Figure 1a but much later for CSE. The yield of TPC by CSE reaches 9.0 mg GAE/g dry wt. (Figure 1b) when the extraction time is extended to 8640 min (6 days). It is reasonable to assume that the maximum amount of TPC that can be extracted from this type of potato peel is in the neighborhood of slightly over 9.0 mg GAE/g dry wt. under given extraction conditions.
In the CSE method, dry potato peel particles are suspended in the solvent, and the resultant mixture is shaken at a 150 rpm. The flow in the solvent during shaking is turbulent, but there is always a laminar flow layer surrounding each particle. As a result, the extraction rate is controlled by the diffusion of phenolic compounds within each particle as well as in the laminar layer outside of the particle. This diffusion process is usually slow, so the yield of TPC and the extraction rates are low during given extraction times.
With the UAE methods, acoustically induced streaming is usually generated at the particle–solvent interface [28,29,30,31], which effectively eliminates the laminar layer surrounding solvent–particle interfaces. The extraction rates are controlled by the diffusion of the compounds within potato peel particles. Furthermore, ultrasonic vibration enhances the diffusion rates of compounds in the solid [28]. As a result, the extraction rates associated with the UAE methods are significantly higher than those with the CSE.
Of the two UAE methods, DUAE has a slightly higher yield curve than IUAE, probably due to the difference in vibration intensity associated with these methods. DUAE was designed to avoid severe cavitation from occurring in the solvent, as severe cavitation may break down the molecules of the phenolic compounds. The power output at the tip of the sonotrode in contact with the solvent was less than 100 W/cm2 (there is about 30% power loss when the power is transmitted from the transducer to the tip of the sonotrode). Compared with IUAE, DUAE is higher in vibration intensity in the particle/solvent mixture. The diffusion rates of molecules in the solid particle increase with increasing vibration intensity. This may account for the fact that the yield curve of DUAE is slightly higher than that of IUAE.

3.2. Modeling of the Yield Curves

During the experiments, the initial TPC concentration in the fresh solvent was zero or negligible at the start of extraction because shaking or vibration was applied in the sample immediately after the potato peel powders were added into the solvent. C increased substantially initially with increasing times, t, slowed down gradually, and finally approached to the plateau concentration, CP, which can be determined experimentally. This yield curve could be described using the Peleg equation in the following form [27]:
C = t k 1 + k 2 t
where C is the yield of TPC, k1 is the rate constant, and k2 is the capacity constant. When using Equation (1) to describe the yield of TPC from potato peels shown in Figure 1, the units of k1 and k2 are min/(mg GAE/g dry wt.) and 1/(mg GAE/g dry wt.), respectively.
Differentiating Equation (1) gives the extraction rate, q, defined by:
q = d C d t = k 1 k 1 + k 2 t 2
The unit of q is mg GAE/g dry wt./min. At the beginning of extraction, where t = 0, the initial extraction rate, q0, is related to k1 by:
q 0 = 1 k 1
As the extraction time approaches infinity, i.e., t→∞, C approaches the plateau concentration, CP. Thus, k2 is related to CP by:
C p = 1 k 2
Figure 2 illustrates the applicability of the Peleg model to fit the experimental data shown in Figure 1. The model constants and curve fitting quality, R2, are given in Table 1. Additionally listed in Table 1 is the maximum yield, CMax, on the measured yield curve. Figure 2 and data given in Table 1 indicate that the curve-fitting quality is reasonably good, so the Peleg model is applicable for describing the yield of phenolic compounds from potato peels.

3.3. Efficacies of the Extracting Methods

Data given in Table 1 show that (1) the initial extracting rates, q0, of the UAE methods are identical; both are much higher than that for CSE, and (2) the plateau concentration, Cp, associated with DUAE is the highest, followed by that with IUAE and CSE with CSE the lowest. The efficacy of each method can be evaluated using k1 and k2, which represent q0 and Cp. The issue is that Cp varies with method used and extraction times, especially with CSE as shown in Figure 1 and in Table 1. Nonetheless, C seems to approach a maximum yield, CMax, that is slightly higher than 9.0 mg GAE/g dry wt.
Knowing CMax, one can evaluate the efficacy of a method of extracting phenolic compounds by defining a recovery ratio, R, as:
R = C C M a x
The relationships between recovery ratio and time for the three tested methods should be similar to the curves shown in Figure 1.
An important feature shown in Figure 1 is that the time required extracting a certain amount of TPC, C, from potato peels increases substantially when C approaches CMax. It may not be cost effective to recover TPC close to CMax.
The time, tR, needed to achieve a given R can be calculated. Substituting Equation (1) into Equation (5) yields tR as a function of R by:
t R = k 1 C M a x R 1 k 2 C M a x R
In the case that CMax = CP, Equation (6) is reduced to the recovery ratio defined by Peleg as [19]:
t R = k 1 R k 2 ( 1 R )
At a given R, Equation (6) can be used to calculate tR. Figure 3 depicts tR vs. R for the three methods calculated using Equation (6) assuming CMax = 9.0. The times, tR, required to achieve a given R are much shorter using the UAE methods than that using CSE. For recovering phenolic compounds at ratios greater than 0.6, the ultrasound-assisted methods can be one or two orders of magnitude faster than CSE as shown in Figure 1 and Figure 3.
The average extracting rate, qR, for obtaining phenolic compounds at a given R can be derived using Equation (6) as:
q R = R C M a x t R = 1 k 2 R C M a x k 1
Figure 4 illustrates qR as a function of R., and also plotted on Figure 4 is the yield, or C, which equals RCMax at a given R. It is evident that qR decreases with increasing R or C for all three methods. The UAE methods are much faster than CSE. Still, the efficacy of a method has to be evaluated considering achieving a reasonably high R or C at an acceptable extraction rate in order to recover maximal valuable substances within acceptable costs. Thus, Figure 4 can be used for evaluating the efficacy of an extraction method.
Figure 4 also shows that there are two curves associated with the CSE method: one for the yield data obtained within 60 min and the other within 6 days. These two curves do not overlap because each one has its own k1 and k2 and resultant CP. These constants are sensitive to the extraction time frame where the data are measured, as shown in Figure 1 and Table 1. It would be more meaningful to use CMax in fitting the Peleg model and use Equations (6) and (8) to determine the efficacy of an extraction method. This is because CMax is the maximum amount of phenolic compounds extractable from potato peels under a given condition when the extraction approaches infinity.

3.4. Factors Affecting CMax

Based on previous work [13], factors affecting CMax include, but are not limited to, the size of potato peel particles, the type of solvent and its temperature, and the particle-to-solvent ratio. CMax has to be determined experimentally. Measuring CMax using CSE is very time consuming, as indicated in Figure 1. The yield does not reach 9.0 mg DAE/g dry wt., which might still be lower than CMax, within an extraction time of 6 days. The UAE methods, however, provide much more accelerated means of estimating CMax. As shown in Figure 1, it takes only 30 min for both UAE methods to reach the yield of over 9.0 mg GAE/g dry wt. Thus, DUAE was used to evaluate some of the factors that affecting CMax.

3.4.1. Effects of Particle Size

The particle size of the potato peels has a significant effect on CMax. Figure 5 shows the relationship between CMax and the size of the potato peel particles during DUAE. CMax increases from 2.54 mg GAE/g dry wt. for particles in the size range of 20 to 30 mm to 10.29 mg GAE/g dry wt. for particles smaller than 0.150 mm. This represents a 4-times increase in CMax when the particle size decreases from 20–30 mm to smaller than 0.150 mm.
It is important to note that the maximum yield of 10.29 mg GAE/g dry wt. shown in Figure 5 is higher than the maximum yield listed in Table 1, which is 9.346 mg GAE/g dry wt. obtained using particles in the size range of 45–100 mesh. It appears that CMax is strongly affected by the particle size at least for particles smaller than 0.354 mm (45–100 mesh). When the particle size is larger than 0.354 mm (45–100 mesh), CMax is significantly lower. Since the number/yield of phenolic compounds extractable from potato peels is proportional to CMax, we suggest that the potato peels be ground at least to the size range of 45–100 mesh in order to extract maximal amounts of valuable TPC within feasible times.
The effect of particle size on CMax is likely related to (1) the area of the interface between the particles and the solvent where extraction of phenolic compounds occurs, and (2) the diffusion distance from within a particle to its interfaces which affects the diffusion time. Small particles have greater interface area per unit volume and shorter diffusion distances than larger ones. As a result, more phenolic compounds per weight potato peels can be extracted from smaller particles than from larger particles at a given extraction time.
Additionally plotted on Figure 5 is the temperature of the solvent/particle mixture measured during experiments. The temperature increases with decreasing particle size as well. These experiments were performed with the direct injection of ultrasonic energy, which heated up the mixture. The heat generated was proportional to the interaction of ultrasound waves and the solid–liquid interfaces [21]. For a given amount of potato peel particles, their interface area increases with decreasing particle size, resulting in the increased heating of the particle/solvent mixture. It is well known that the diffusion coefficient of molecules in solid particles increases with increasing temperatures, resulting in an increased yield of phenolic compounds in the solvent.

3.4.2. Effects of Bath Temperature

To isolate the effect of temperature on CMax, we carried out experiments varying the bath temperatures. Figure 6 depicts the yields at an extraction time of 30 min with DUAE and CSE. The red dash line is the bath temperature as the CSE method does not increase the temperature in the particle/solvent mixture. Still, the yield, C, increases from 5.44 to 8.71 mg GAE/g dry wt. when the bath temperature is increased from 25 to 53 °C. The yield curve and the mixture temperature associated with DUAE are higher than those for CSE. It is evident that both the ultrasonic vibration and resultant temperature increase in the particle/solvent mixture contribute to the enhanced yield with DUAE. Figure 6 also indicates that CMax increases with increasing bath temperature as the yield with DUAE at an extraction time of 30 min. is a good estimate for CMax.

3.4.3. Effects of the Solvent-to-Particle Ratio

The solvent-to-particle ratio is also an important parameter affecting CMax. Figure 7 illustrates the relationship between CMax and the ratio. Generally, CMax increases with increasing solvent-to-solid ratio when the ratio is smaller than 20:1. CMax then increases insignificantly with the ratio in the range of 20:1 to 60:1, taking account of standard deviations in measurement.
The results shown in Figure 5, Figure 6 and Figure 7 confirm that the maximum yield can be strongly affected by process parameters such as the size of potato peel particles, the temperature of the solvent/solid mixture during extraction, and the solvent-to-particle ratio. These results, together with the models on yield, i.e., Equation (1), and recovery, i.e., Equations (5)–(8), can be used for evaluating the efficacy of an extraction method for the recovery of valuable substances from potato peel waste before it is sent to the landfill.

4. Conclusions

The yields of phenolic compounds from potato peel waste were measured using three methods. Of these three methods, the two ultrasound-assisted extraction methods, namely direct ultrasound-assisted extraction (DUAE) and indirect ultrasound-assisted extraction (IUAE) are much faster in extracting phenolic compounds than the conventional shaking extraction (CSE).
The yield curve associated with each method can be described using the two-parameter, nonexponential Peleg model, but the plateau yield on the yield curve may not be the maximum yield of TPC extractable from potato peels. The maximum yield increases with decreasing size of the potato peel particles and increasing extraction temperature.
A recovery ratio based on the maximum yield is defined for describing the efficacy of extracting phenolic compounds from potato peels. The ultrasound-assisted extraction methods are capable of extracting phenolic compounds at a given recovery ratio one or two orders of magnitude faster than the CSE method. The models described in the article are expected to be useful in evaluating the extraction efficacy of valuable compounds from various agricultural or agroindustrial waste.

Author Contributions

Investigation: Q.X., H.M. and S.W.; resources: Q.X.; writing—original draft preparation: Q.X. and Q.H.; writing—reviewing and editing: S.W. and H.M.; supervision: Q.X. and Q.H. All authors have read and agreed to the published version of the manuscript.

Funding

This research was funded by the John & Emma Tse, Li-Fu Chen Memorial Laboratory Fund at Purdue University.

Institutional Review Board Statement

Not applicable.

Informed Consent Statement

Not applicable.

Data Availability Statement

Not applicable.

Acknowledgments

We thank Milan Rakita (Purdue University, West Lafayette, IN, USA) for operating the ultrasound equipment and participating in the discussion. We appreciate Basic American Foods for providing potato peels. We acknowledge Laurie Van Keppel (Purdue University, West Lafayette, IN, USA) for editing the manuscript.

Conflicts of Interest

The authors declare no conflict of interest.

References

  1. Calcio Gaudino, E.; Colletti, A.; Grillo, G.; Tabasso, S.; Cravotto, G. Emerging Processing Technologies for the Recovery of Valuable Bioactive Compounds from Potato Peels. Foods 2020, 9, 1598. [Google Scholar] [CrossRef]
  2. Akyol, H.; Riciputi, Y.; Capanoglu, E.; Caboni, M.F.; Verardo, V. Phenolic Compounds in the Potato and Its Byproducts: An Overview. Int. J. Mol. Sci. 2016, 17, 835. [Google Scholar] [CrossRef] [PubMed]
  3. Kumari, B.; Tiwari, B.K.; Hossain, M.B.; Rai, D.K.; Brunton, N.P. Ultrasound-assisted extraction of polyphenols from potato peels: Profiling and kinetic modelling. Int. J. Food Sci. Technol. 2017, 52, 1432–1439. [Google Scholar] [CrossRef] [Green Version]
  4. Singh, B.; Singh, J.; Singh, J.P.; Kaur, A.; Singh, N. Phenolic compounds in potato (Solanum tuberosum L.) peel and their health-promoting activities. Int. J. Food Sci. Technol. 2020, 55, 2273–2281. [Google Scholar] [CrossRef]
  5. Albishi, T.; John, J.A.; Al-Khalifa, A.S.; Shahidi, F. Phenolic content and antioxidant activities of selected potato varieties and their processing by-products. J. Funct. Foods 2013, 5, 590–600. [Google Scholar] [CrossRef]
  6. Al-Weshahy, A.; Rao, A.V. Isolation and characterization of functional components from peel samples of six potatoes varieties growing in Ontario. Food Res. Int. 2009, 42, 1062–1066. [Google Scholar] [CrossRef]
  7. Arun, K.B.; Chandran, J.; Dhanya, R.; Krishna, P.; Jayamurthy, P.; Nisha, P. A comparative evaluation of antioxidant and antidiabetic potential of peel from young and matured potato. Food Biosci. 2015, 9, 36–46. [Google Scholar] [CrossRef]
  8. Singh, A.; Sabally, K.; Kubow, S.; Donnelly, D.J.; Gariepy, Y.; Orsat, V.; Raghavan, G.S. Microwave-assisted extraction of phenolic antioxidants from potato peels. Molecules 2011, 16, 2218–22132. [Google Scholar] [CrossRef] [Green Version]
  9. Mohdaly, A.A.A.; Sarhan, M.A.; Smetanska, I.; Mahmoud, A. Antioxidant properties of various solvent extracts of potato peel, sugar beet pulp and sesame cake. J. Sci. Food Agric. 2010, 90, 218–226. [Google Scholar] [CrossRef]
  10. van Esch, G.J. Toxicology of tert-butylhydroquinone (TBHQ). Food Chem. Toxicol. 1986, 24, 1063–1065. [Google Scholar] [CrossRef]
  11. Wang, W.; Xiong, X.; He, Z.; Zhu, Q.; Liao, C.; Jiang, G. Analysism occurrence, toxicity and environmental health risks of synthetic phenolic antioxidants: A review. Environ. Res. 2021, 201, 111531. [Google Scholar] [CrossRef] [PubMed]
  12. Samotyja, U. Potato peel as a sustainable resource of natural antioxidants for the food industry. Potato Res. 2019, 62, 435–451. [Google Scholar] [CrossRef] [Green Version]
  13. Wang, S.; Lin, A.H.-M.; Han, Q.; Xu, Q. Evaluation of Direct Ultrasound-Assisted Extraction of Phenolic Compounds from Potato Peels. Processes 2020, 8, 1665. [Google Scholar] [CrossRef]
  14. Borah, P.P.; Das, P.; Badwaik, L.S. Ultrasound treated potato peel and sweet lime pomace based biopolymer film development. Ultrason. Sonochem. 2017, 36, 11–19. [Google Scholar] [CrossRef] [PubMed]
  15. Sánchez Maldonado, A.F.; Mudge, E.; Gänzle, M.G.; Schieber, A. Extraction and fractionation of phenolic acids and glycoalkaloids from potato peels using acidified water/ethanol-based solvents. Food Res. Int. 2014, 65, 27–34. [Google Scholar] [CrossRef]
  16. Wu, Z.G.; Xu, H.Y.; Ma, Q.; Cao, Y.; Ma, J.N.; Ma, C.M. Isolation, identification and quantification of unsaturated fatty acids, amides, phenolic compounds and glycoalkaloids from potato peel. Food Chem. 2012, 135, 2425–2429. [Google Scholar] [CrossRef]
  17. de Andrade Lima, M.; Andreou, R.; Charalampopoulos, D.; Chatzifragkou, A. Supercritical Carbon Dioxide Extraction of Phenolic Compounds from Potato (Solanum tuberosum) Peels. Appl. Sci. 2021, 11, 3410. [Google Scholar] [CrossRef]
  18. Galhano dos Santos, R.; Ventura, P.; Bordado, J.C.; Mateus, M.M. Valorizing potato peel waste: An overview of the latest publications. Rev. Environ. Sci. Bio/Technol. 2016, 15, 585–592. [Google Scholar] [CrossRef]
  19. Han, H.; Wang, S.; Rakita, M.; Wang, Y.; Han, Q.; Xu, Q. Effect of ultrasound-assisted extraction of phenolic compounds on the characteristics of walnut shells. Food Nutr. Sci. 2018, 9, 1034–1045. [Google Scholar] [CrossRef] [Green Version]
  20. Jacotet-Navarro, M.; Rombaut, N.; Fabiano-Tixier, A.S.; Danguien, M.; Bily, A.; Chemat, F. Ultrasound versus microwave as green processes for extraction of rosmarinic, carnosic and ursolic acids from rosemary. Ultrason. Sonochem. 2015, 27, 102–109. [Google Scholar] [CrossRef]
  21. Kumari, B.; Tiwari, B.K.; Hossain, M.B.; Brunton, N.P.; Rai, D.K. Recent advances on application of ultrasound and pulsed electric field technologies in the extraction of bioactives from agro-industrial by-products. Food Bioprocess Technol. 2018, 11, 223–241. [Google Scholar] [CrossRef]
  22. Martinez-Fernandez, J.S.; Seker, A.; Davaritouchaee, M.; Gu, X.; Chen, S. Recovering Valuable Bioactive Compounds from Potato Peels with Sequential Hydrothermal Extraction. Waste Biomass Valor. 2021, 12, 1465–1481. [Google Scholar] [CrossRef]
  23. Ali, A.; Riaz, S.; Sameen, A.; Naumovski, N.; Iqbal, M.W.; Rehman, A.; Mehany, T.; Zeng, X.-A.; Manzoor, M.F. The Disposition of Bioactive Compounds from Fruit Waste, Their Extraction, and Analysis Using Novel Technologies: A Review. Processes 2022, 10, 2014. [Google Scholar] [CrossRef]
  24. Tran, T.M.K.; Akanbi, T.O.; Kirkman, T.; Nguyen, M.H.; Vuong, Q.V. Recovery of Phenolic Compounds and Antioxidants from Coffee Pulp (Coffea canephora) Waste Using Ultrasound and Microwave-Assisted Extraction. Processes 2022, 10, 1011. [Google Scholar] [CrossRef]
  25. Demirok, N.T.; Yıkmış, S. Combined Effect of Ultrasound and Microwave Power in Tangerine Juice Processing: Bioactive Compounds, Amino Acids, Minerals, and Pathogens. Processes 2022, 10, 2100. [Google Scholar] [CrossRef]
  26. Solaberrieta, I.; Mellinas, C.; Jiménez, A.; Garrigós, M.C. Recovery of Antioxidants from Tomato Seed Industrial Wastes by Microwave-Assisted and Ultrasound-Assisted Extraction. Foods 2022, 11, 3068. [Google Scholar] [CrossRef]
  27. Peleg, M. An Empirical Model for the Description of Moisture Sorption Curves. J. Food Sci. 1988, 53, 1216–1219. [Google Scholar] [CrossRef]
  28. Abramov, O.V. High-Intensity Ultrasonics Theory and Industrial Applications; Gordon & Breach: Amsterdam, The Netherlands, 1998. [Google Scholar]
  29. Cui, Y.; Xu, C.L.; Han, Q. Effect of ultrasonic vibration on unmixed zone formation. Scripta Mater. 2006, 55, 975–978. [Google Scholar] [CrossRef]
  30. Han, Q. Ultrasonic Processing of Materials. Metall. Mater. Trans B 2015, 46, 1603–1614. [Google Scholar] [CrossRef] [Green Version]
  31. Rakita, M.; Han, Q. Influence of pressure field in melts on the primary nucleation in solidification processing. Metall. Mater. Trans. B 2017, 48, 2232–2244. [Google Scholar] [CrossRef]
Figure 1. Yields of total phenolic compounds (TPC) from potato peels extracted using conventional shaking extraction (CSE), direct ultrasound-assisted extraction (DUAE), and indirect ultrasound-assisted extraction (IUAE). Data were obtained under the conditions of: bath temperature 25 °C; solvent-to-solid ratio 40:1; potato peel size 45–100 mesh (0.354 mm). (a) Yields in the first 60 min of extraction, and (b) yields using CSE in 6 days.
Processes 10 02326 g001
Figure 2. Curve fitting quality using Equation (1) to fit experimental data shown in Figure 1. The intercept of each curve on the y-axis is k1 and the slope of the curve is k2. The values of k1 and k2 are given in Table 1. (a) Yields in the first 60 min of extraction, and (b) yields using CSE in 6 days.
Processes 10 02326 g002
Figure 3. Time, tR, required to achieve a given recovery ratio, R, of phenolic compounds from potato peels for the three methods used in the present study. tR is calculated using Equation (6) and data given in Table 1 assuming that CMax = 9.0 mg GAE/g dry wt.
Processes 10 02326 g003
Figure 4. Extraction rates, qR, at given values of recovery ratio, R, and resultant yield, C, for the three extraction methods tested in the present study. qR is calculated using Equation (8) and data given in Table 1 assuming that CMax = 9.0 mg GAE/g dry wt. The solid lines with markers are the qR curves, and the dash line is the C curve.
Processes 10 02326 g004
Figure 5. Relationship between the maximum yield, CMax, and the particle size of the potato peels during DUAE under the conditions of: ultrasonic power 120 W, frequency 22.95 kHz, bath temperature 25 °C; solvent-to-solid ratio 40:1; and extraction time 30 min. The particle sizes in corresponding to the mesh size are original (20–30 mm); >45 mesh (>0.354 mm); 45–100 mesh (0.150–0.354 mm), and <100 mesh (<0.150 mm).
Processes 10 02326 g005
Figure 6. Relationship between C and bath temperature during DUAE and CSE under the conditions of: solvent-to-solid ratio 40:1; particle size 45–100 mesh (0.150–0.354 mm); and extraction time 30 min. DUAE was operated at 120 W with a frequency of 22.95 kHz.
Processes 10 02326 g006
Figure 7. Relationship between the maximum yield, CMax, and the solvent-to-solid ratio during DUAE under the conditions of: the power of ultrasonic vibration 120 W, frequency 22.95 kHz, bath temperature 25 °C; and particle size 45–100 mesh (0.150–0.354 mm).
Processes 10 02326 g007
Table 1. Parameters obtained by fitting the Peleg model with experimental data shown in Figure 1.
ParameterDUAEIUAECSE (60 Min)CSE (6 Days)
k1, min/(mg GAE/g dry wt.)0.04830.04590.198514.249
k2, 1/(mg GAE/g dry wt.)0.1070.11360.16960.1166
q0, (mg GAE/g dry wt.)/min20.7021.795.040.07
CP, mg GAE/g dry wt.9.3468.8035.8968.576
R20.99990.99890.99850.9928
CMax, mg GAE/g dry wt.9.309.095.869.00
Publisher’s Note: MDPI stays neutral with regard to jurisdictional claims in published maps and institutional affiliations.

