
Multi-Response Modelling and Optimisation of Mechanical Properties of Al-Si Alloy Using Mixture Design of Experiment Approach


 , ,
, ,  and
and 
Abstract
1. Introduction
2. Experimental Details
2.1. Material Selection
2.2. Process of Fabrication
2.3. Material Composition Selection and Design
2.4. Microstructure Study
2.5. Hardness Test
2.6. Density Test
2.7. Tensile Test
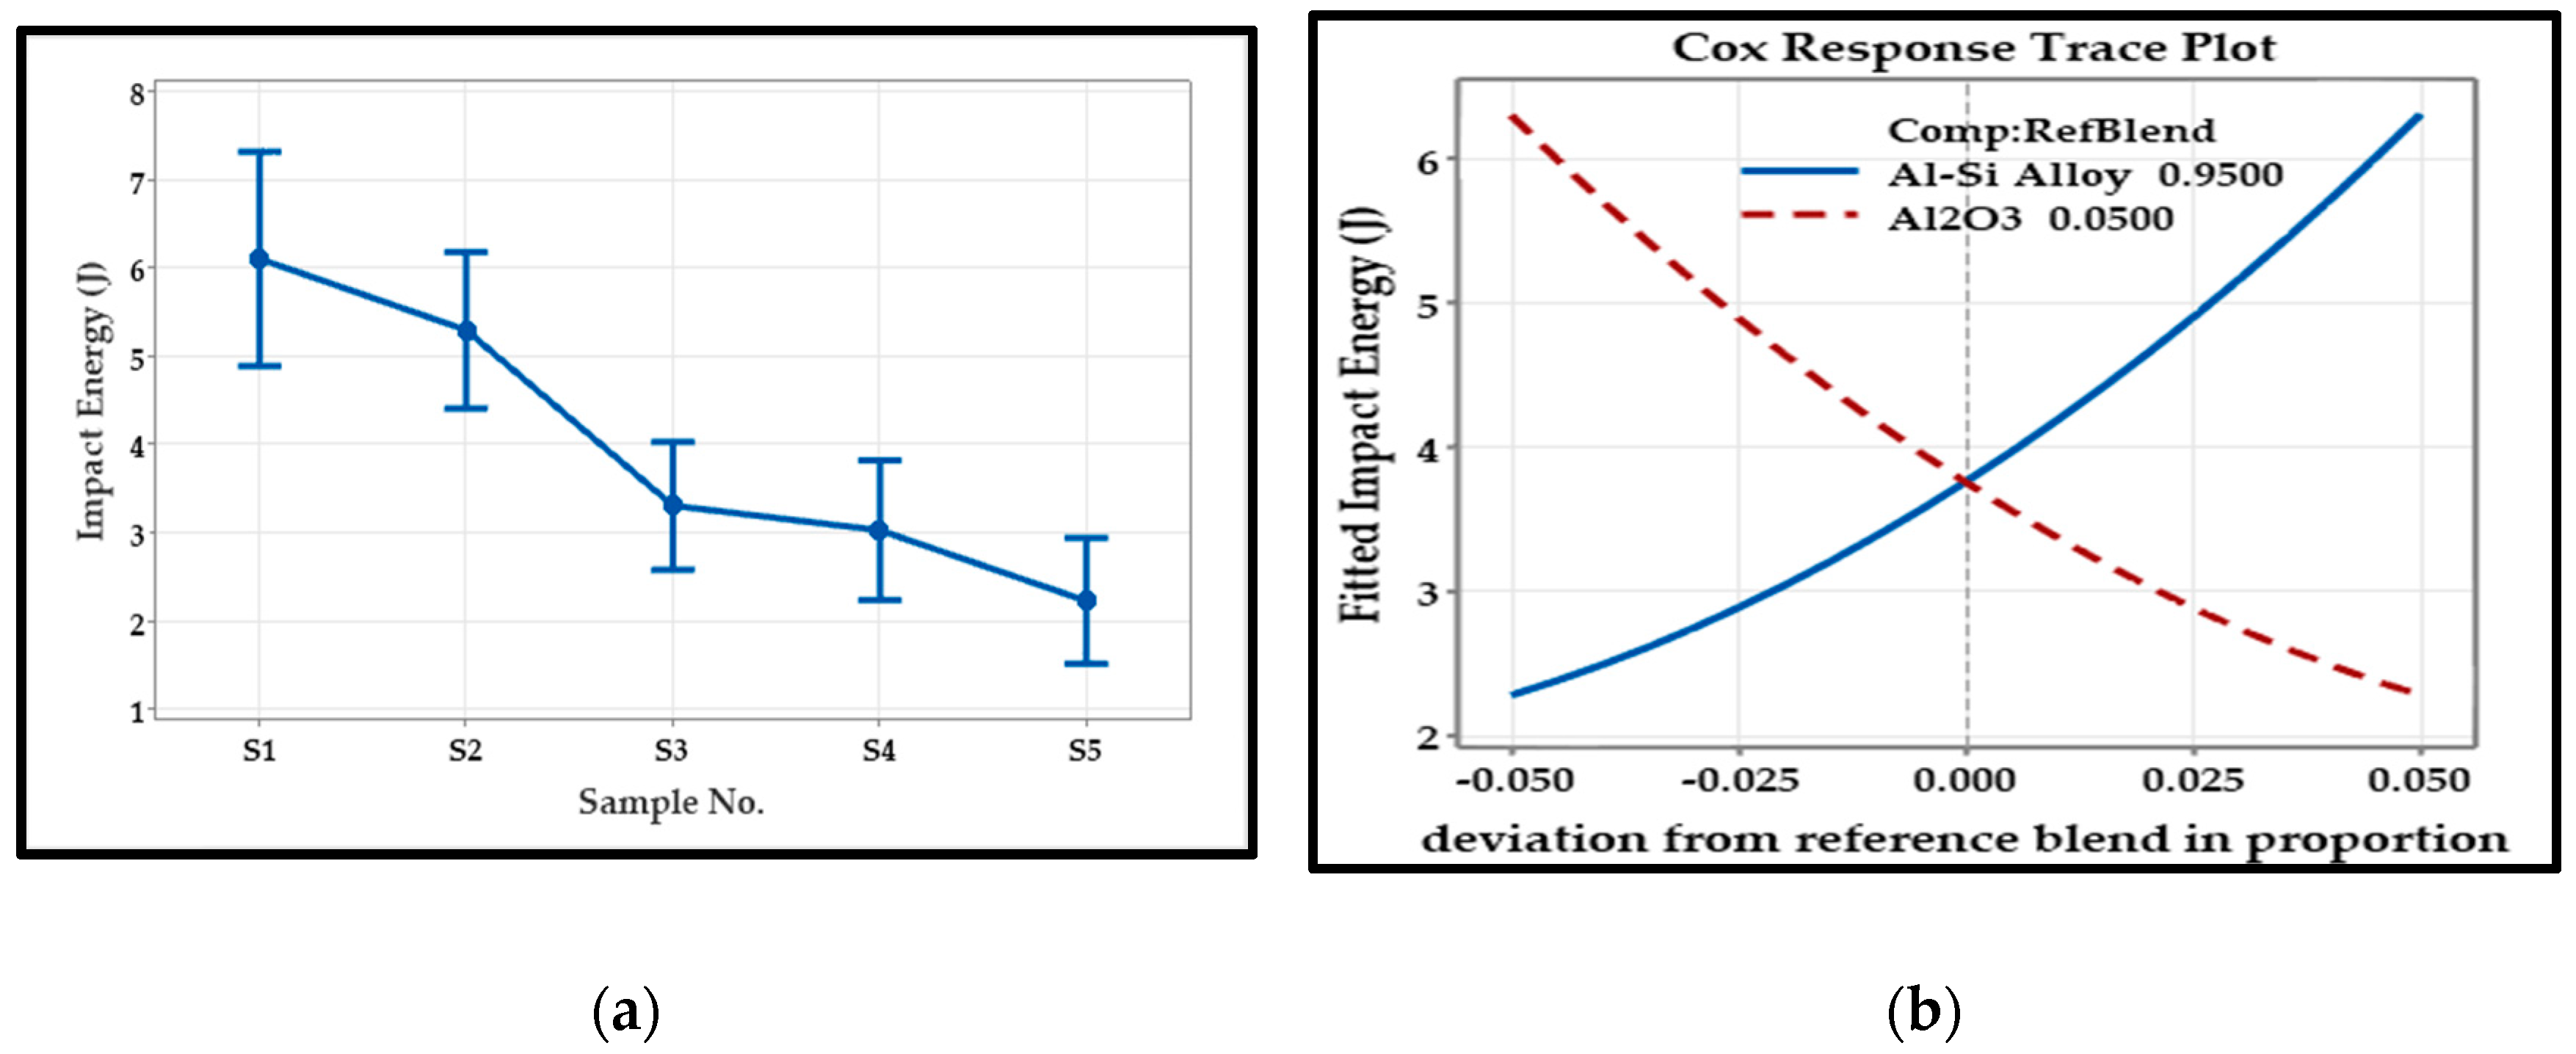
2.8. Impact Test
3. Results
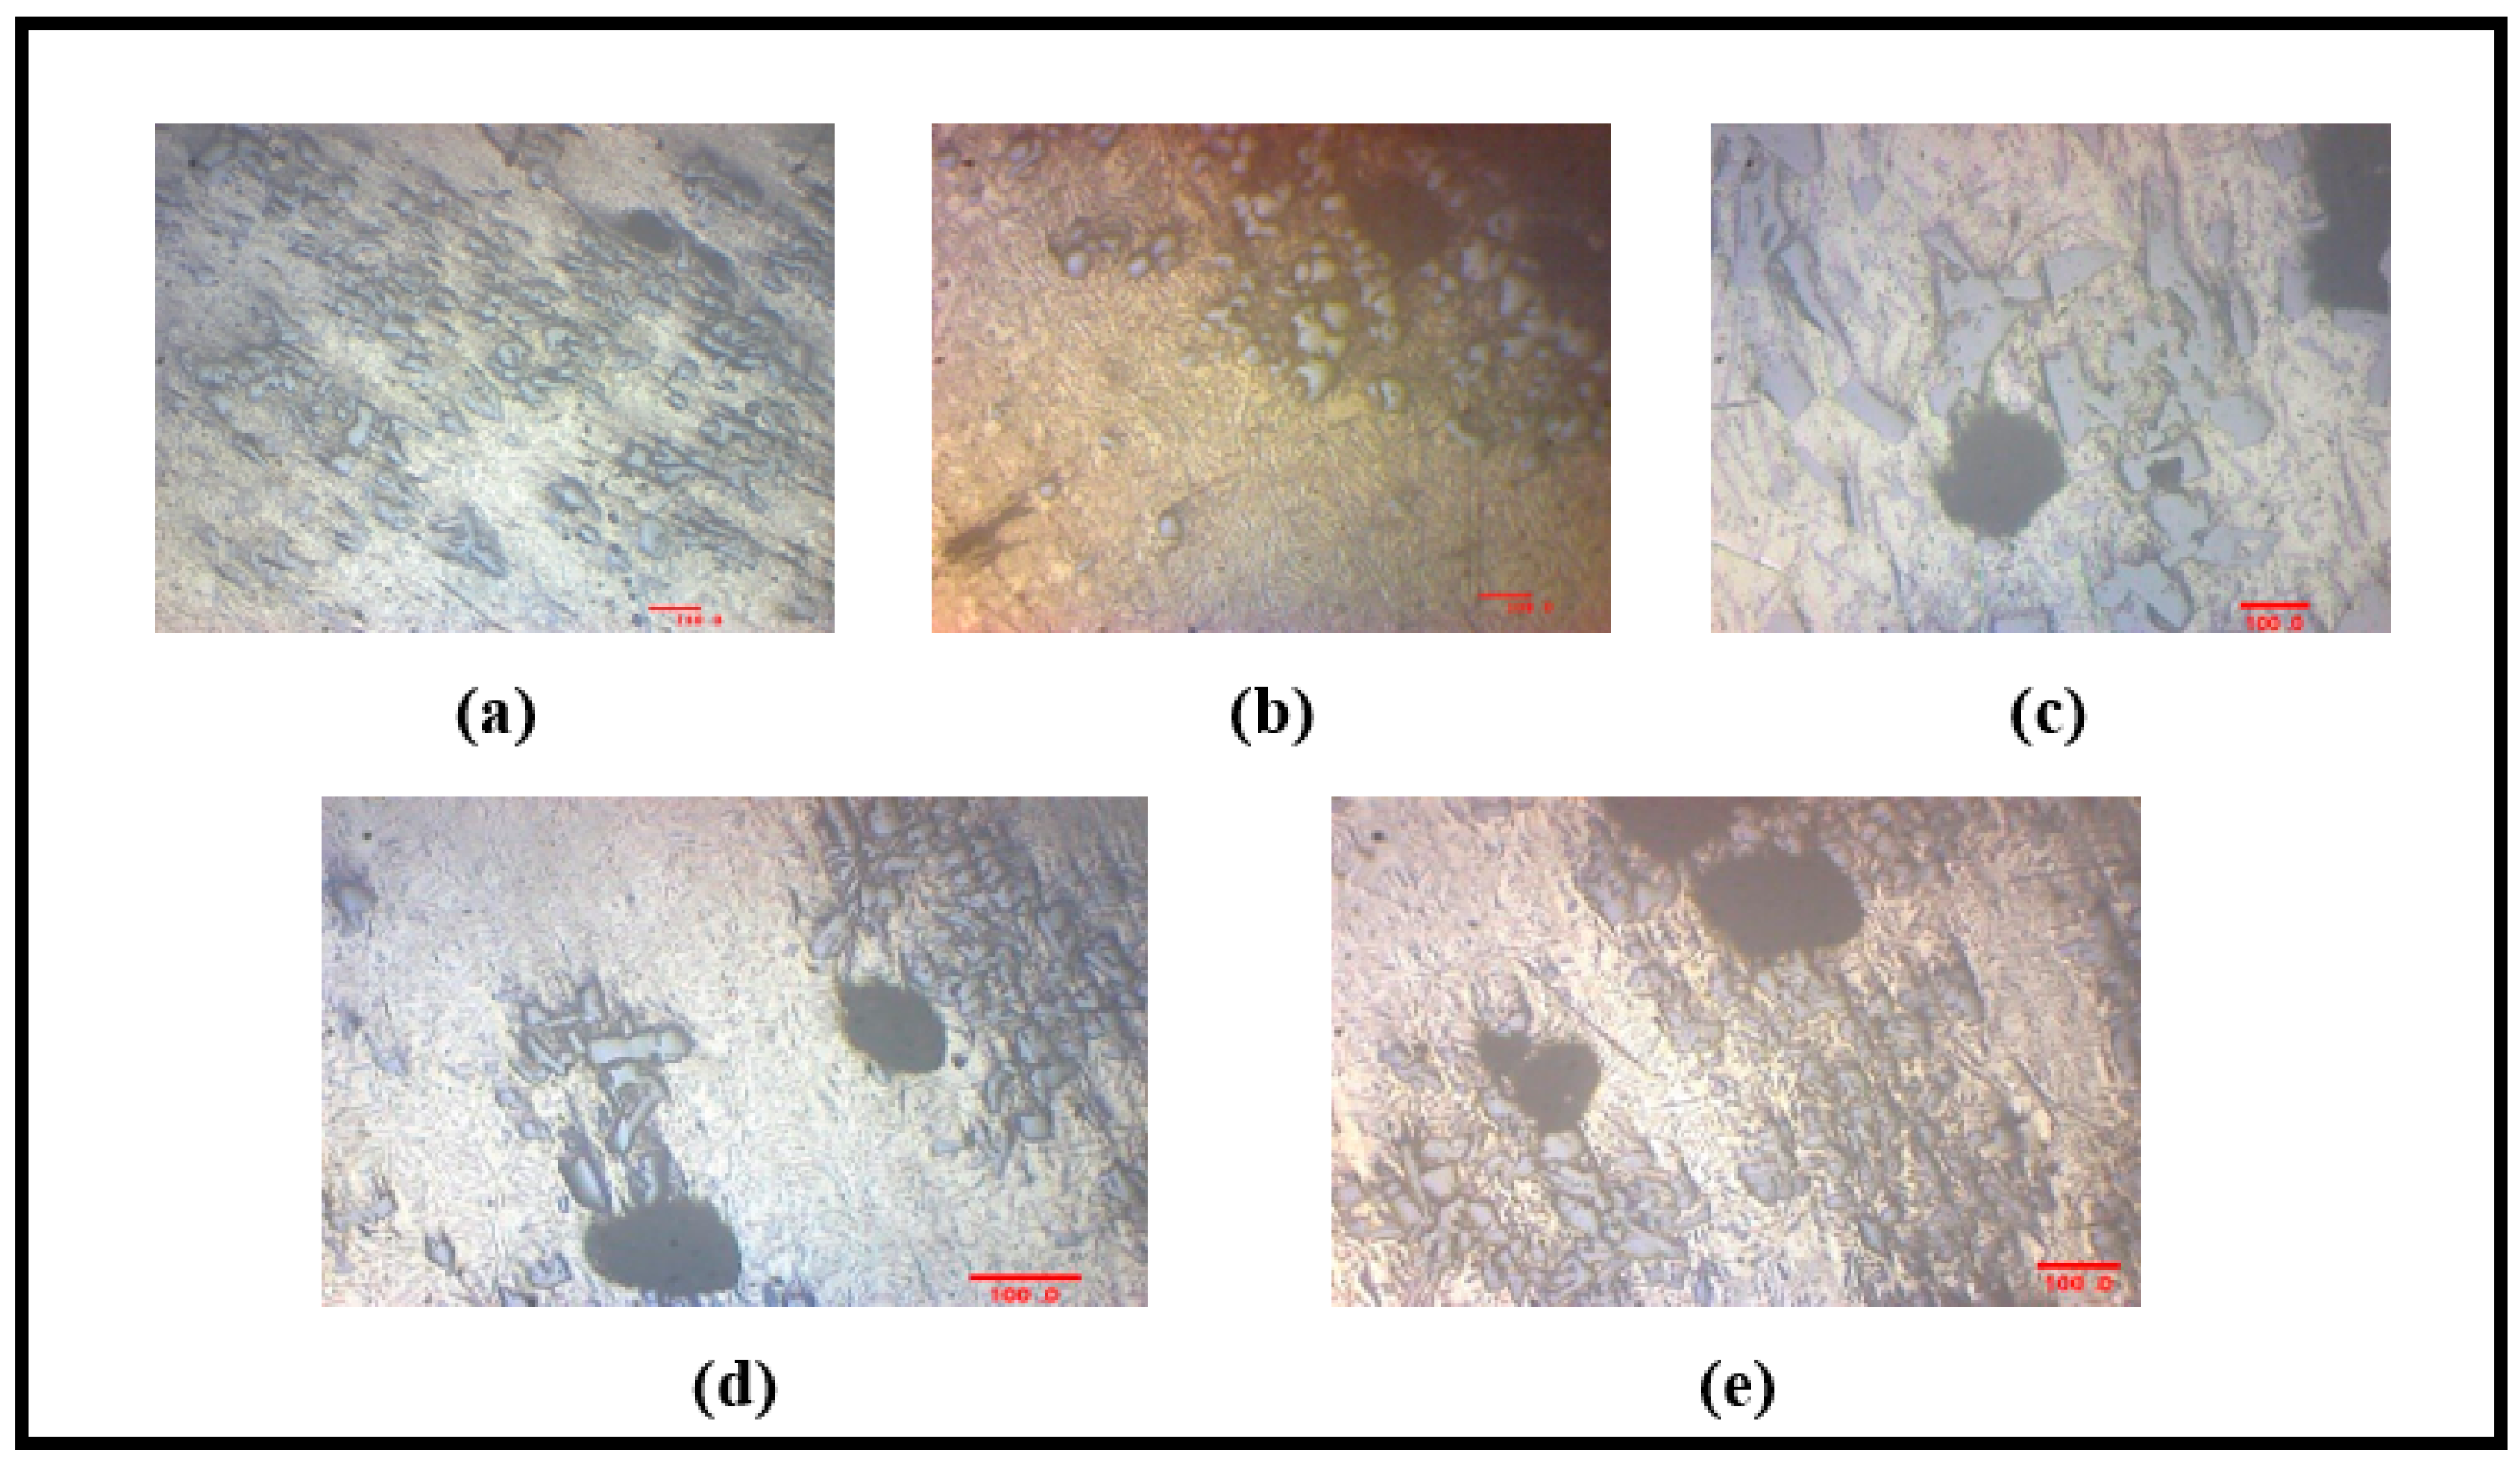
3.1. Microstructure
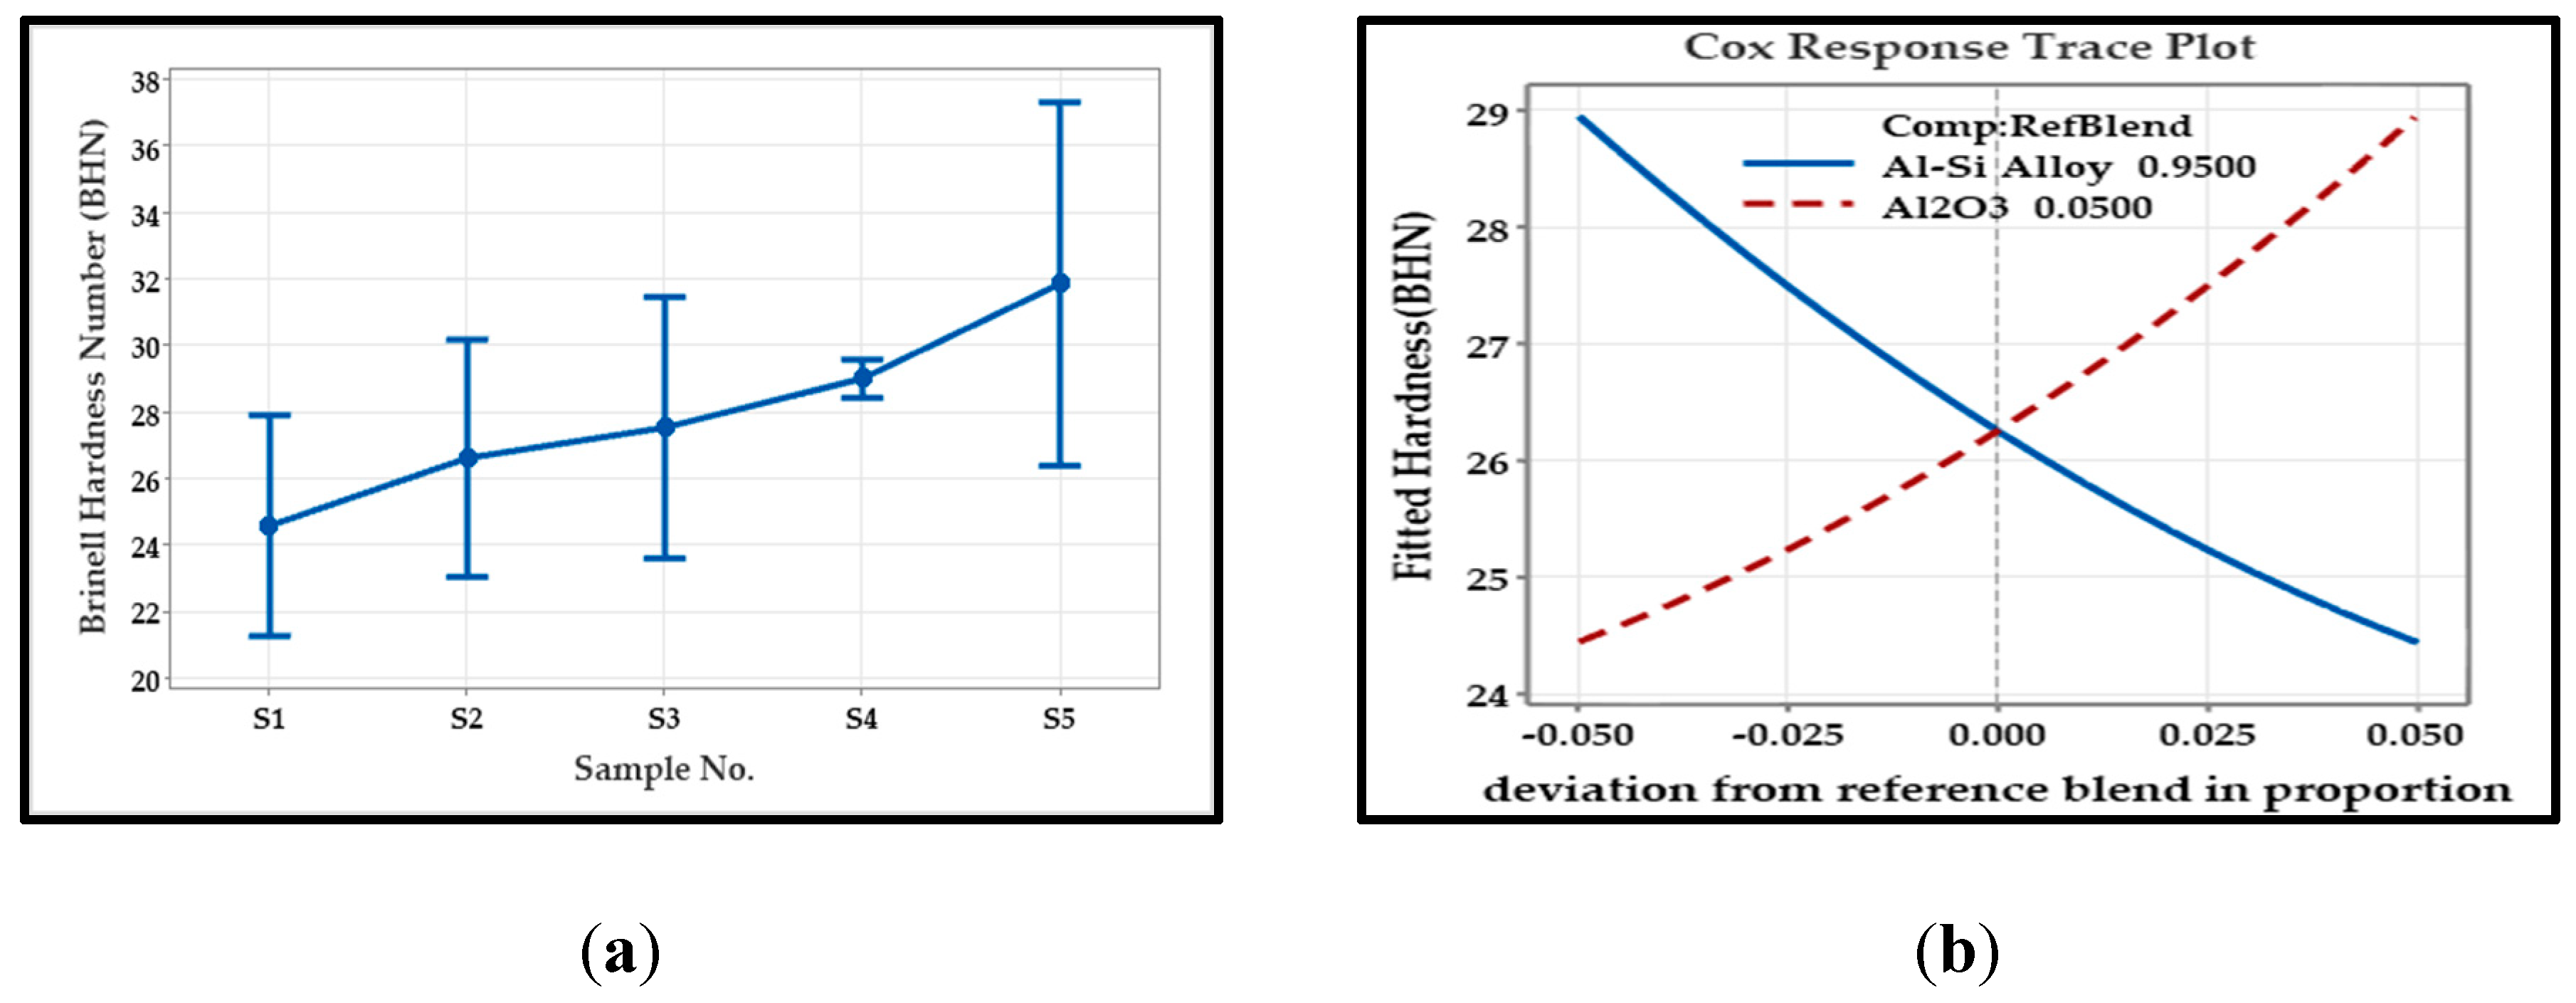
3.2. Hardness
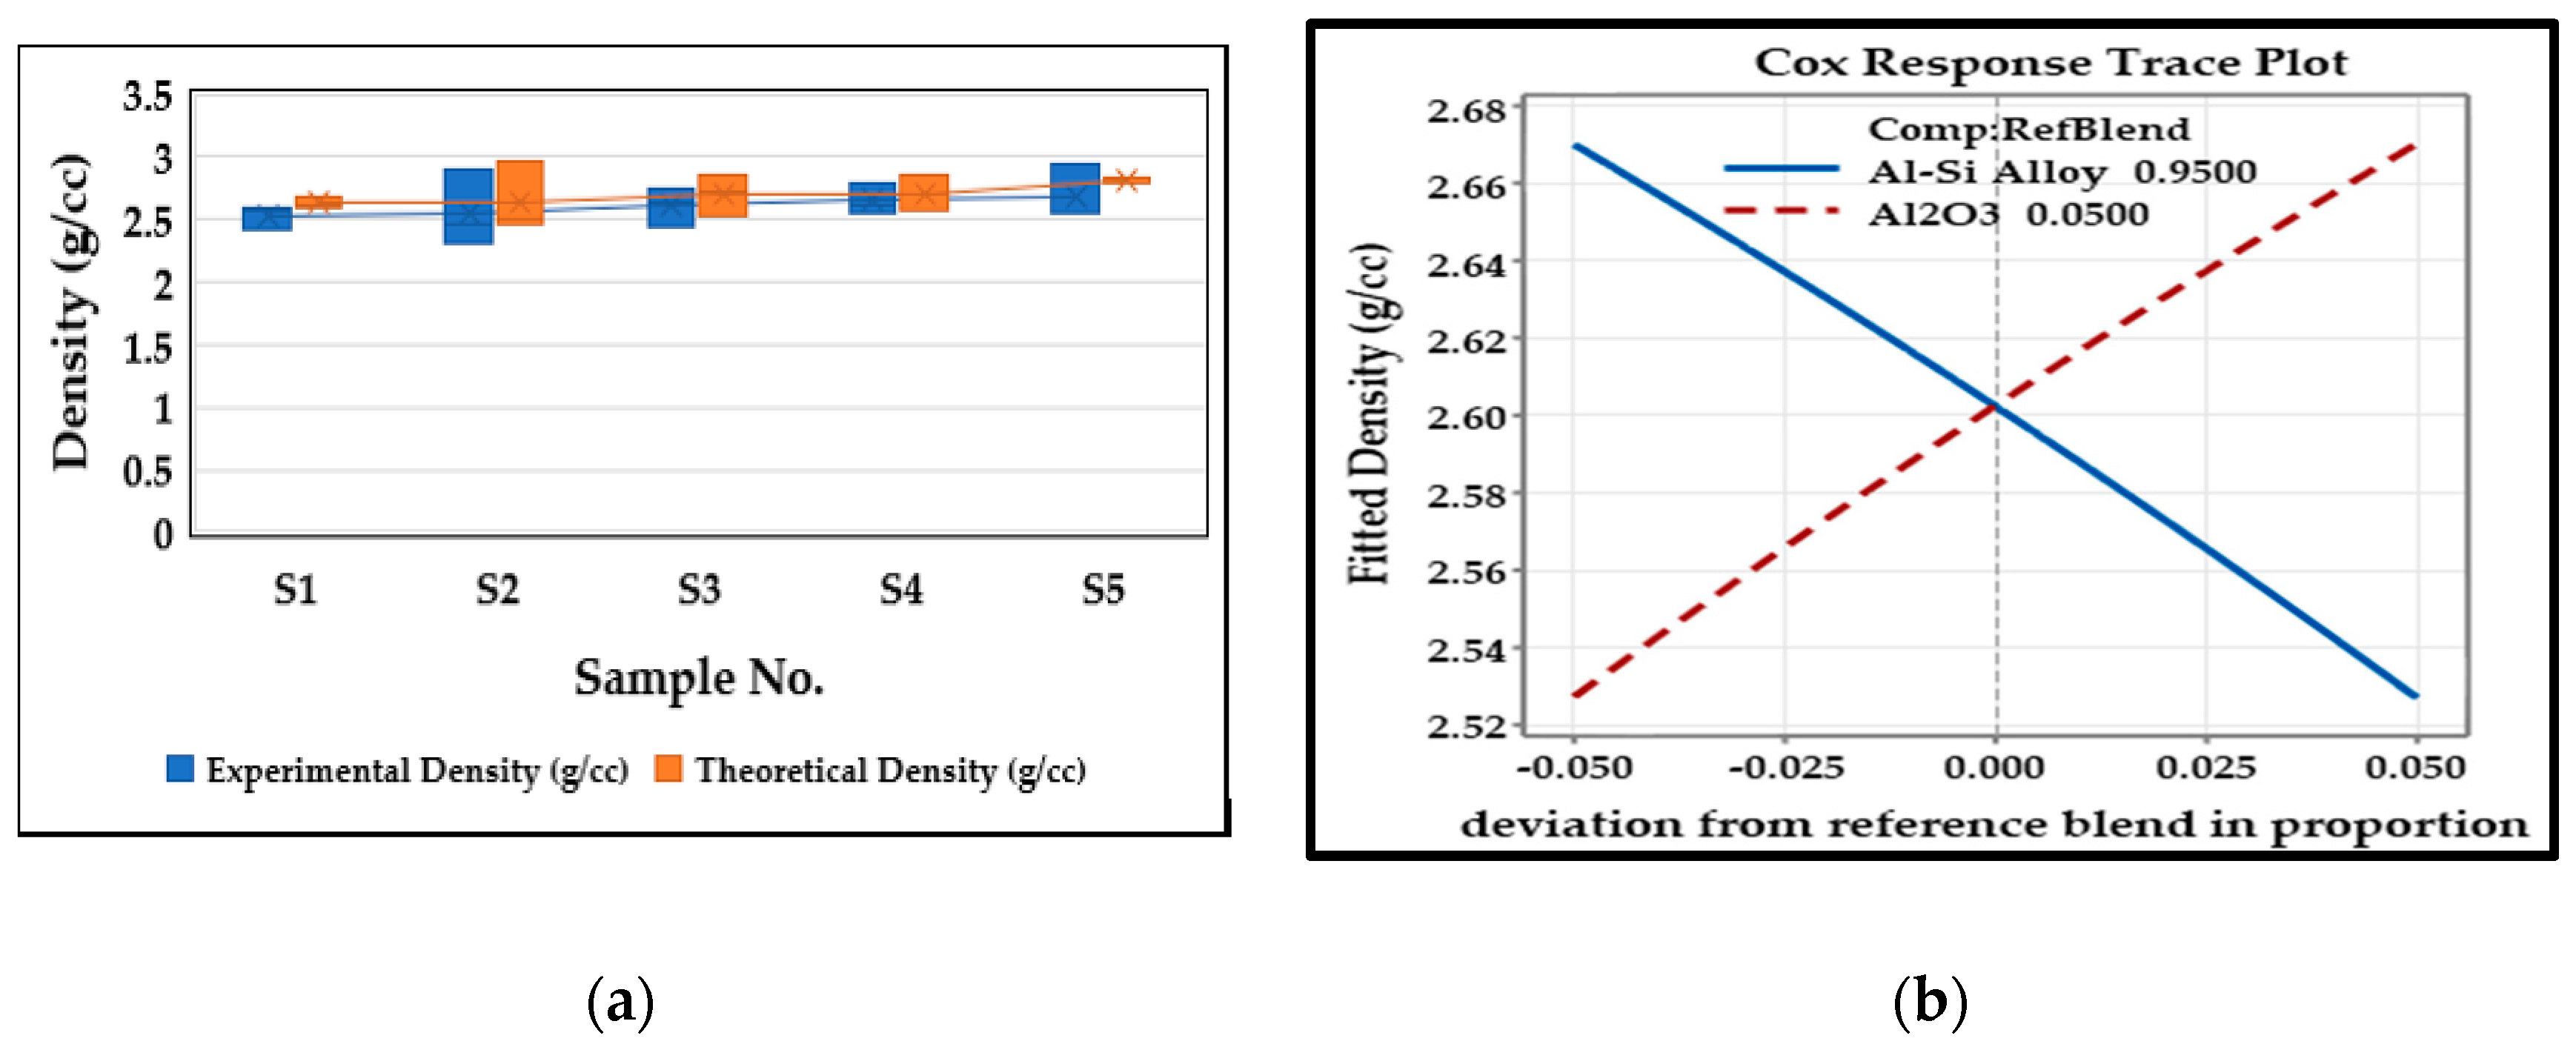
3.3. Density
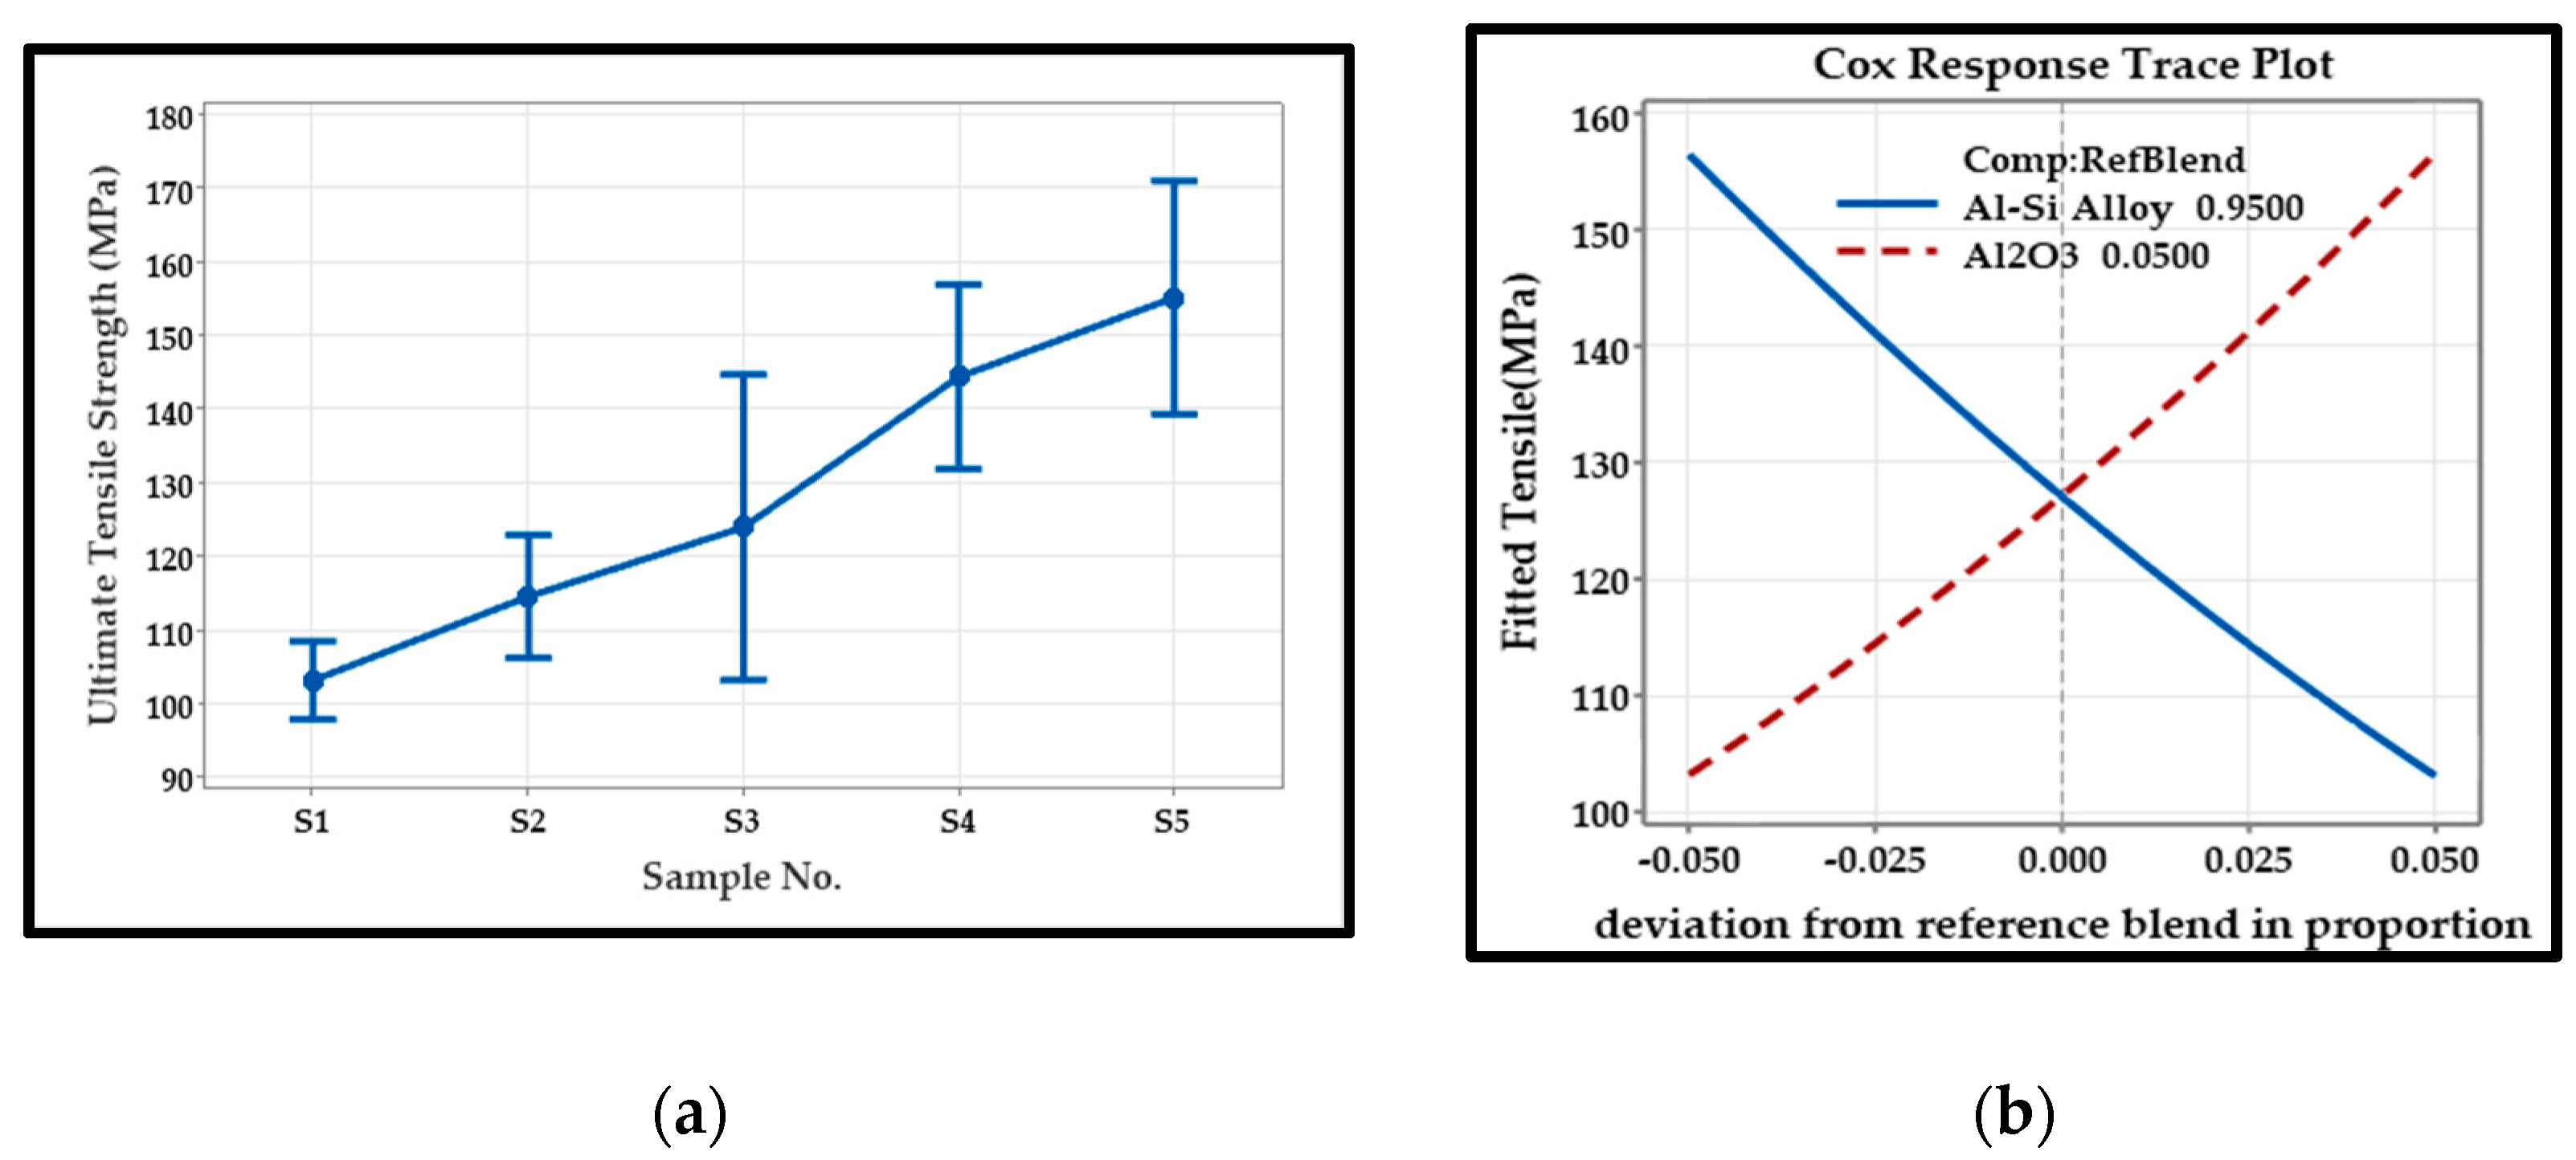
3.4. Tensile Test
3.5. Predictive Modelling
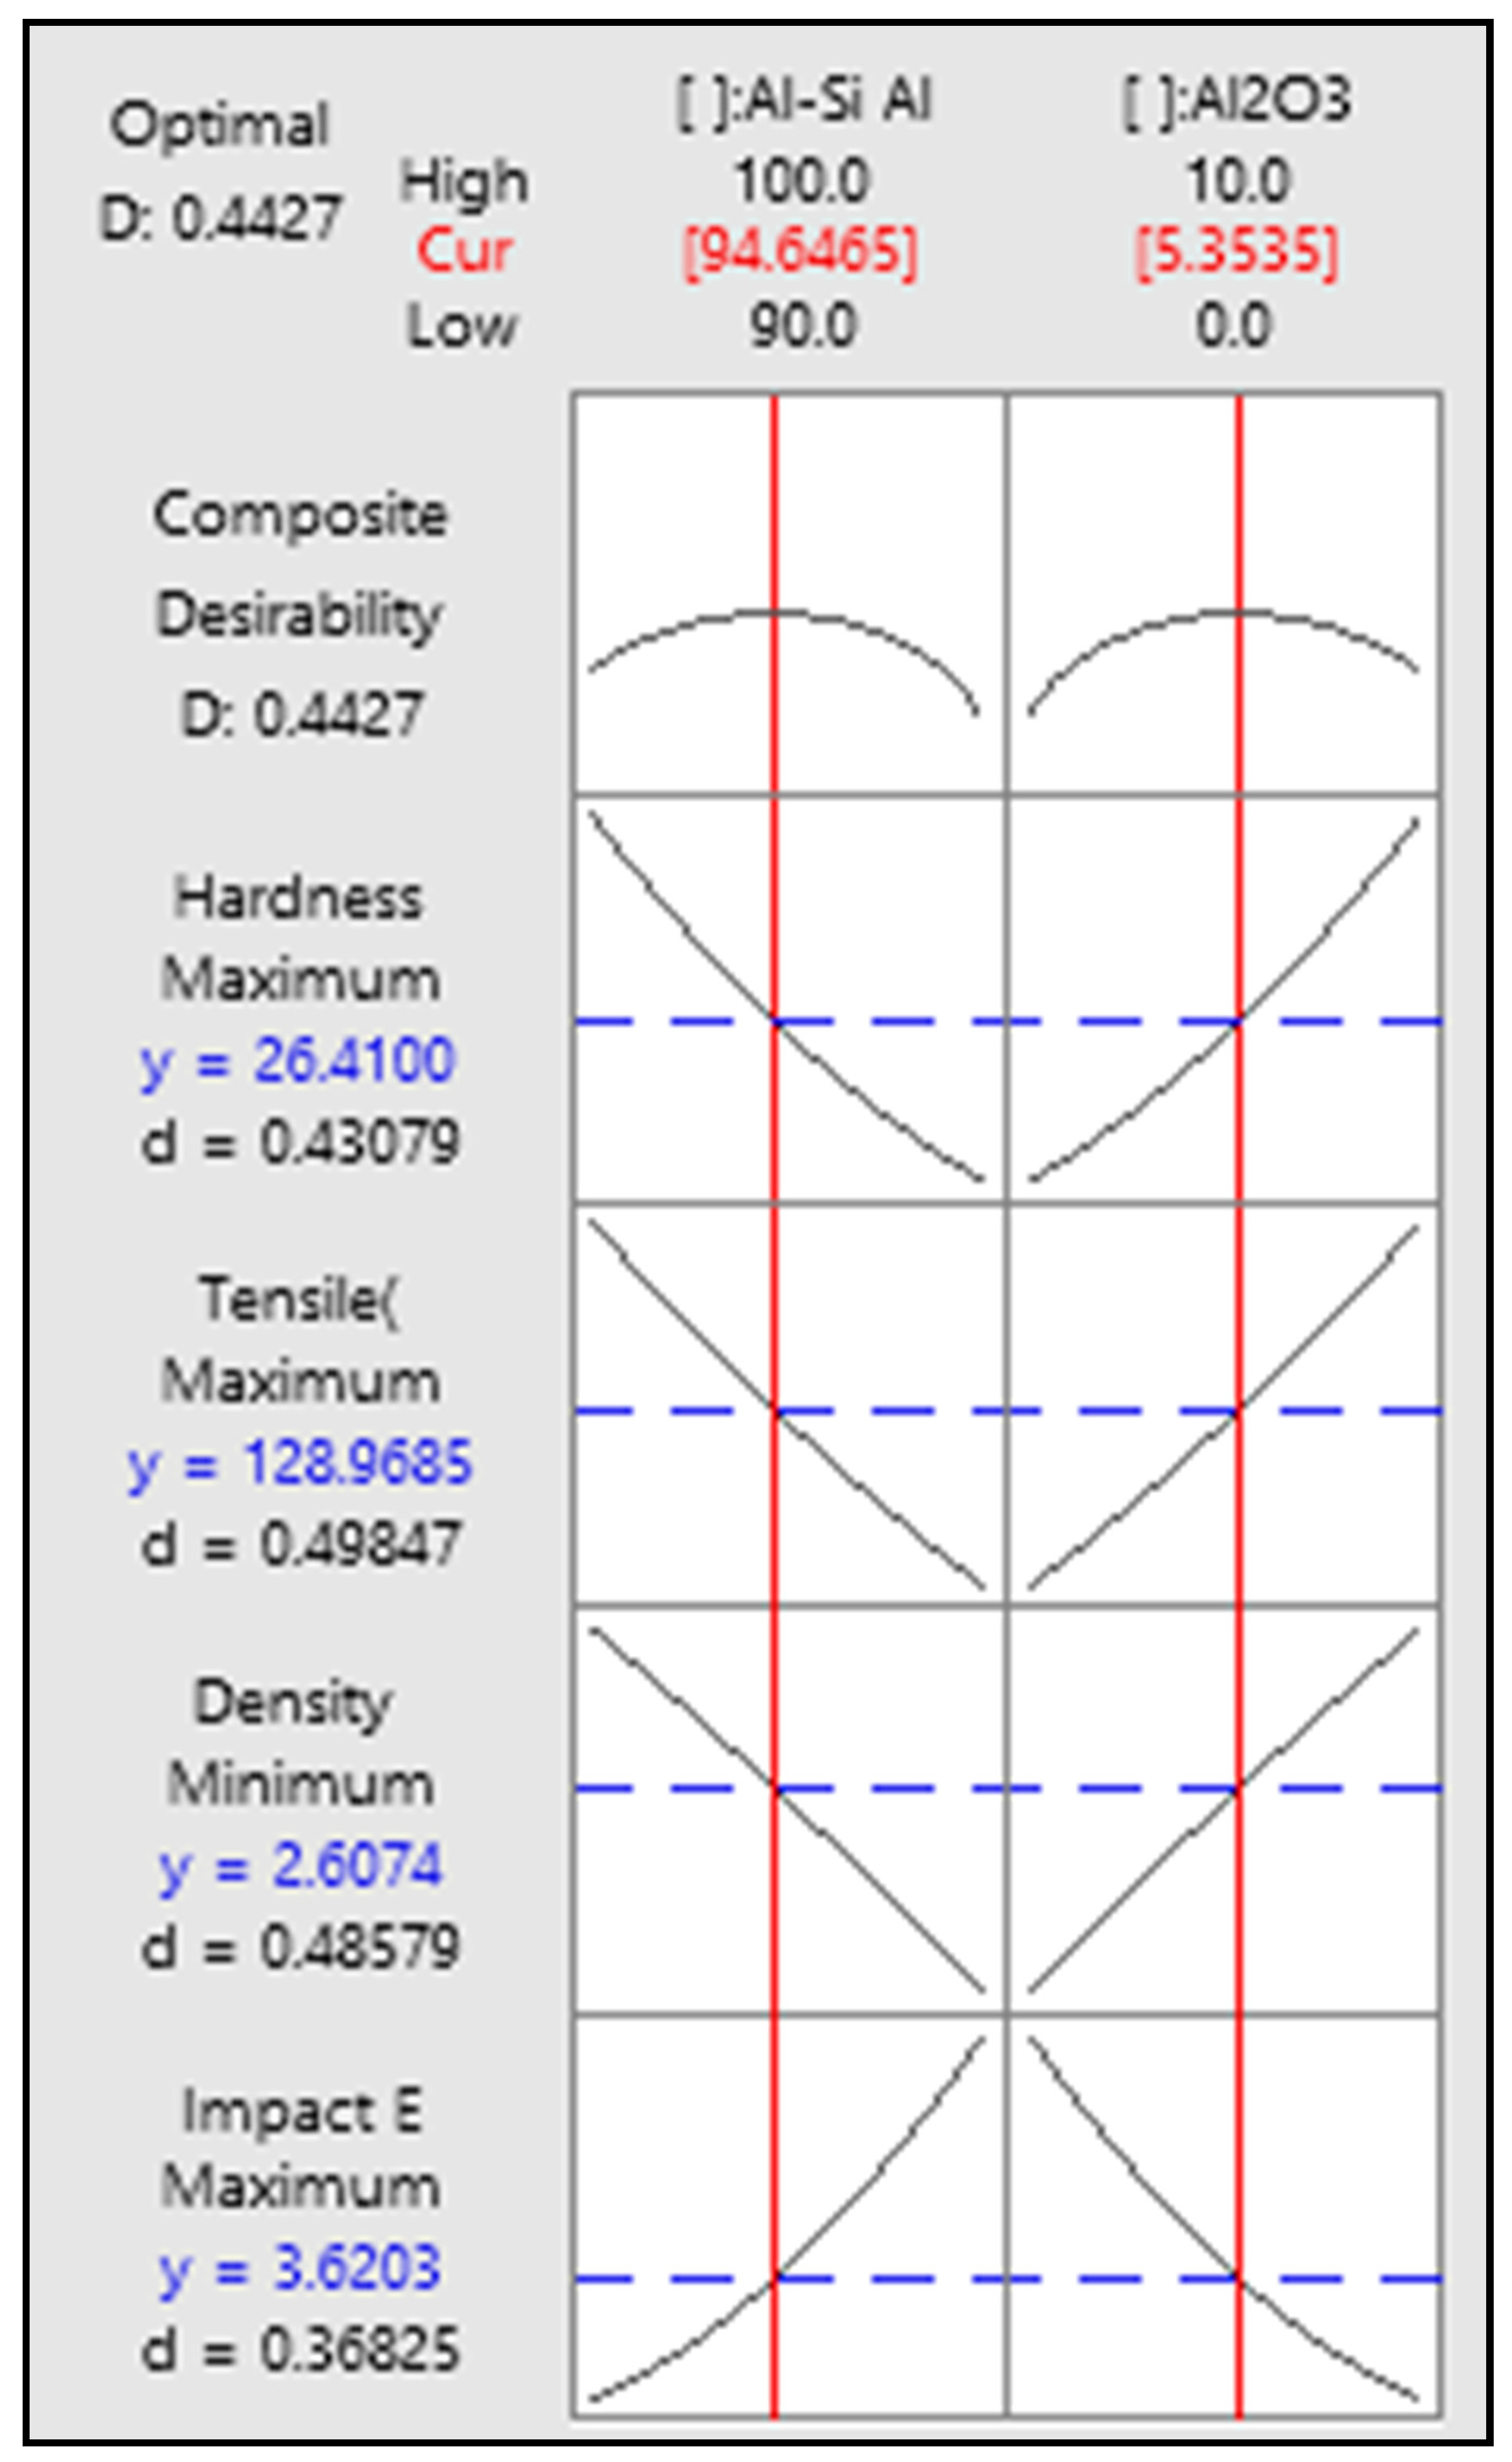
3.6. Multi-Response Optimisation
3.7. Validation of the Predictive Model
4. Conclusions
- The results obtained through the statistical analysis showed that both Al alloy and the reinforced Al2O3 particles significantly influence the composite material. Moreover, a positive correlation was observed in the mechanical properties such as hardness, tensile strength and density. In contrast, the impact strength of the composite material was negatively correlated and vice versa.
- The microstructural analysis of the produced composite materials suggested that though the reinforcing particles were mixed uniformly by creating a centre vortex while stirring, there existed a non-uniform settlement of the particles among the matrix material. The existence of the primary silicon particles, eutectic silicon particles in the form of needles and the Al2O3 particles were noticed in the images.
- The reinforcing particles’ inclusion in the composite material preparation proved beneficial. Most mechanical properties, such as density, hardness, and tensile strength, have shown a positive increase in the values. With the predictive model, the mechanical properties obtained were almost in line with the values obtained through the regression equations, thus rendering the equations obtained as accurate. Thus, the study finds that the composite material produced with Al-Alloy = 94.65 wt% and Al2O3 = 5.35 wt% leads to the best results.
Author Contributions
Funding
Data Availability Statement
Conflicts of Interest
References
- Włodarczyk-Fligier, A.; Dobrzański, L.; Kremzer, M.; Adamiak, M. Manufacturing of Aluminium Based Composite Materials Reinforced by Al2O3 Particles. J. Achiev. Mater. Manuf. Eng. 2008, 27, 99–102. [Google Scholar]
- Akbari, M.K.; Baharvandi, H.R.; Mirzaee, O. Investigation of particle size and reinforcement content on mechanical properties and fracture behavior of A356-Al2O3 composite fabricated by vortex method. J. Compos. Mater. 2014, 48, 3315–3330. [Google Scholar] [CrossRef]
- Poornesh, M.; Saldanha, J.X.; Singh, J.; Pinto, G.; Gaurav, M. Comparison of mechanical properties of coconut shell ash and SiC reinforced hybrid aluminium metal matrix composites. Am. J. Mater. Sci. 2017, 7, 116–119. [Google Scholar]
- Fentahun, M.A.; Savas, M.A. Materials Used in Automotive Manufacture and Material Selection Using Ashby Charts. Int. J. Mater. Eng. 2018, 8, 40–54. [Google Scholar]
- Adam, G.; Zhang, D.L.; Liang, J.; Macrae, I. A Novel Process for Lowering the Cost of Titanium. In Advanced Materials and Processing IV; Trans Tech Publications Ltd.: Bach, Switzerland, 2007; pp. 147–152. [Google Scholar]
- Koli, D.K.; Agnihotri, G.; Purohit, R. Advanced Aluminium Matrix Composites: The Critical Need of Automotive and Aerospace Engineering Fields. Mater. Today Proc. 2015, 2, 3032–3041. [Google Scholar] [CrossRef]
- Ahamad, N.; Mohammad, A.; Sadasivuni, K.K. Phase, microstructure and tensile strength of Al–Al2O3–C hybrid metal matrix composites. Proc. Instit. Mech. Eng. Part C J. Mech. Eng. Sci. 2020, 234, 1–13. [Google Scholar] [CrossRef]
- Kumar Sharma, A.; Bhandari, R.; Aherwar, A.; Pinca-Bretotean, C. A study of fabrication methods of aluminum based composites focused on stir casting process. Mater. Today Proc. 2020, 27, 1608–1612. [Google Scholar] [CrossRef]
- Poornesh, M.; Bhat, S.; Gijo, E.V.; Bellairu, P.K. Enhancing the tensile strength of SiC reinforced aluminium-based functionally graded structure through the mixture design approach. Int. J. Struct. Integr. 2022, 13, 150–163. [Google Scholar] [CrossRef]
- Srinivas, P.N.S.; Babu, P.R.; Balakrishna, B. Material characterisation and optimisation of CNT-reinforced aluminum (AA7075) functionally graded material processed by ultrasonic cavitation. Funct. Compos. Struct. 2020, 2, 1–13. [Google Scholar] [CrossRef]
- Poornesh, M.; Bhat, S.; Gijo, E.V.; Bellairu, P.K. Multi-objective modelling and optimisation of Al–Si–SiC composite material: A multidisciplinary approach. Multiscale Multidiscip. Model. Exp. Des. 2022, 5, 53–66. [Google Scholar] [CrossRef]
- Dadkhah, M.; Dadkhah, M.; Mosallanejad, M.H.; Iuliano, L.; Saboori, A. A Comprehensive Overview on the Latest Progress in the Additive Manufacturing of Metal Matrix Composites: Potential, Challenges, and Feasible Solutions. Acta Metall. Sin. Engl. Lett. 2021, 34, 1173–1200. [Google Scholar] [CrossRef]
- Singh, H.; Singh, G.; Singh, K.; Vardhan, S. Evaluation of mechanical performance on a developed AA 6061matrix-Mg/0.9-Si/0.68 reinforced with B4C based composites. Funct. Compos. Struct. 2021, 3, 1–10. [Google Scholar] [CrossRef]
- Kanthavel, K.; Sumesh, K.R.; Saravanakumar, P. Study of tribological properties on Al/Al2O3/MoS2 hybrid composite processed by powder metallurgy. Alex. Eng. J. 2016, 55, 13–17. [Google Scholar] [CrossRef]
- Şimşek, D.; Şimşek, İ.; Özyürek, D. Relationship between Al2O3 Content and Wear Behavior of Al+2% Graphite Matrix Composites. Sci. Eng. Compos. Mater. 2020, 27, 177–185. [Google Scholar] [CrossRef]
- Altinkok, N. Use of Artificial Neural Network for Prediction of Mechanical Properties of α-Al2O3 Particulate-reinforced Al–Si10Mg Alloy Composites Prepared by using Stir Casting Process. J. Compos. Mater. 2006, 40, 779–796. [Google Scholar] [CrossRef]
- Bellairu, P.K.; Bhat, S.; Gijo, E.V.; Mangalore, P. Multi-Response Modelling and Optimization of Agave Cantala Natural Fiber and Multi-wall Carbon Nano Tube Reinforced Polymer Nanocomposite: Application of Mixture Design. Fibers Polym. 2022, 23, 1089–1099. [Google Scholar] [CrossRef]
- Bellairu, P.K.; Bhat, S.; Gijo, E.V. Modelling and optimisation of natural fibre reinforced polymer nanocomposite: Application of mixture-design technique. Multidiscip. Model. Mater. Struct. 2021, 17, 507–521. [Google Scholar] [CrossRef]
- Agrawal, A.; Satapathy, A. Effect of Al2O3 Addition on Thermo-Electrical Properties of Polymer Composites: An Experimental Investigation. Polymer Compos. 2014, 36, 102–112. [Google Scholar] [CrossRef]
- Madhukar, P.; Selvaraja, N.; Rao, C.S.P.; Kumar, G.B.V. Fabrication and characterisation two step stir casting with ultrasonic assisted novel AA7150-hBN nanocomposites. J. Alloys Compd. 2020, 815, 1–12. [Google Scholar] [CrossRef]
- Mangalore, P.; Vittal, C.S.; Akash, U.A.; Abhiram, S.; Advaith, J. Study of tribological properties of Al 7079 alloy reinforced with agro waste particles. AIP Conf. Proc. 2019, 2080, 20–29. [Google Scholar]
- Grilo, J.; Carneiro, V.H.; Teixeira, J.C.; Puga, H. Manufacturing Methodology on Casting-Based Aluminium Matrix Composites: Systematic Review. Metals 2021, 11, 436–445. [Google Scholar] [CrossRef]
- Gowda, K.P.; Prakash, J.N.; Gowda, S.; Babu, B.S. Effect of Particulate Reinforcement on the Mechanical Properties of Al2024-WC MMCs. J. Miner. Mater. Charact. Eng. 2015, 3, 469–476. [Google Scholar] [CrossRef]
- Sambathkumar, M.K.; Navaneetha, P.K.; Ponappa, K.; Sasikumar, K.S.K. Mechanical and Corrosion Behavior of Al7075 (Hybrid) Metal Matrix Composites by Two Step Stir Casting Process. Latin Am. J. Solids Struct. 2017, 14, 243–255. [Google Scholar] [CrossRef]
- Sharma, P.; Dabra, V.; Dwivedi, S.P. Wear characteristics of AA2014/10 wt% Al2O3 reinforced AMCs. Mater. Today Proc. 2020, 25, 931–933. [Google Scholar] [CrossRef]
- Yehia, H.M.; Allam, S. Hot Pressing of Al-10 wt% Cu-10 wt% Ni/x (Al2O3–Ag) Nanocomposites at Different Heating Temperatures. Met. Mater. Int. 2021, 27, 500–513. [Google Scholar] [CrossRef]
- Arnold, S.F. Design of Experiments with MINITAB. Am. Stat. 2006, 60, 205. [Google Scholar] [CrossRef]
- Peruggia, M. Experiments with Mixtures: Designs, Models, and the Analysis of Mixture Data. J. Am. Stat. Assoc. 2003, 98, 259. [Google Scholar]
- Chen, J.; Wen, F.; Liu, C.; Li., W.; Zhou, Q.; Zhu, W.; Zhang, Y.; Guana, R. The microstructure and property of Al-Si alloy improved by the Sc-microalloying and Y2O3 nano-particles. Sci. Technol. Adv. Mater. 2021, 22, 205–217. [Google Scholar] [CrossRef]
- Imran, M.; Khan, A.R.A.; Megeri, S.; Sadik, S. Study of hardness and tensile strength of Aluminium-7075 percentage varying reinforced with graphite and bagasse-ash composites. Resour.-Eff. Technol. 2016, 2, 81–88. [Google Scholar] [CrossRef]
- Singh, J.; Jawalkar, C.S.; Belokar, R.M. Analysis of Mechanical Properties of AMC Fabricated by Vacuum Stir Casting Process. Silicon 2020, 12, 2433–2443. [Google Scholar] [CrossRef]
- Akinwamide, S.O.; Abe, B.T.; Akinribide, O.J.; Obadele, B.A.; Olubambi, P.A. Characterization of microstructure, mechanical properties and corrosion response of aluminium-based composites fabricated via casting—A review. Int. J. Adv. Manuf. Technol. 2020, 109, 975–991. [Google Scholar] [CrossRef]
- Du, Z.; Chen, H.C.; Tan, M.J.; Bi, G.; Chua, C.K. Investigation of porosity reduction, microstructure and mechanical properties for joining of selective laser melting fabricated aluminium composite via friction stir welding. J. Manuf. Processes 2018, 36, 33–43. [Google Scholar] [CrossRef]
- Ozden, S.; Ekici, R.; Nair, F. Investigation of impact behaviour of aluminium based SiC particle reinforced metal–matrix composites. Compos. Part A Appl. Sci. Manuf. 2007, 38, 484–494. [Google Scholar] [CrossRef]
- Hashishin, T.; Kodera, Y.; Yamamoto, T.; Ohyanagi, M.; Munir, Z.A. Synthesis of (Mg, Si)Al2O4 Spinel from Aluminum Dross. J. Am. Ceram. Soc. 2008, 87, 496–499. [Google Scholar] [CrossRef]
- El-Aziz, K.A.; Saber, D.; Sallam, H.E.D.M. Wear and Corrosion Behavior of Al–Si Matrix Composite Reinforced with Alumina. J. Bio-Tribo-Corros. 2015, 1, 1–10. [Google Scholar] [CrossRef]
- Liao, H.; Zhan, M.; Li, C.; Ma, Z.; Du, J. Grain refinement of Mg-Al alloys inoculated by MgAl2O4 powder. J. Magnes. Alloys 2021, 9, 1211–1219. [Google Scholar] [CrossRef]
- Bandil, K.; Vashisth, H.; Kumar, S.; Verma, L.; Jamwal, A.; Kumar, D.; Singh, N.; Sadasivuni, K.K.; Gupta, P. Microstructural, mechanical and corrosion behaviour of Al–Si alloy reinforced with SiC metal matrix composite. J. Compos. Mater. 2019, 53, 4215–4223. [Google Scholar] [CrossRef]
- Zhang, J.; Chen, Z.; Zhao, J.; Jiang, Z. Microstructure and mechanical properties of aluminium-graphene composite powders produced by mechanical milling. Mech. Adv. Mater. Modern Processes 2018, 4, 1–9. [Google Scholar] [CrossRef]
- Prabhu, T.; Murugan, M.; Chiranth, B.P.; Mishra, R.K.; Rajini, N.; Marimuthu, P.; Babu, D.P.; Suganya, G. Effects of Dual-Phase Reinforcement Particles (Fly Ash + Al2O3) on the Wear and Tensile Properties of the AA 7075 Al Alloy Based Composites. J. Inst. Eng. Ser. D 2019, 100, 29–35. [Google Scholar] [CrossRef]
- Ajagol, P.; Anjan, B.N.; Marigoudar, R.N.; Kumar, G.V.P. Effect of {SiC} Reinforcement on Microstructure and Mechanical Properties of Aluminum Metal Matrix Composite. IOP Conf. Ser. Mater. Sci. Eng. 2018, 376, 1–9. [Google Scholar] [CrossRef]
- Ezatpour, H.R.; Sajjadi, S.A.; Sabzevar, M.H.; Huang, Y. Investigation of microstructure and mechanical properties of Al6061-nanocomposite fabricated by stir casting. Mater. Des. 2014, 55, 921–928. [Google Scholar] [CrossRef]
- Daniel-Mkpume, C.C.; Okonkwo, E.G.; Aigbodion, V.S.; Offor, P.O.; Nnakwo, K.C. Silica sand modified aluminium composite: An empirical study of the physical, mechanical and morphological properties. Mater. Res. Express IOP Publ. 2019, 6, 1–13. [Google Scholar] [CrossRef]
- Montgomery, D.C. Design and Analysis of Experiments, 9th ed.; Wiley: New York, NY, USA, 2017. [Google Scholar]


| Sample Number | Al-18 wt% Si | Al2O3 |
|---|---|---|
| S1 | 100 | 0 |
| S2 | 92.5 | 7.5 |
| S3 | 90 | 10 |
| S4 | 95 | 5 |
| S5 | 97.5 | 2.5 |
| Hardness (BHN) = 229.7 − (2.052 A) − (0.01779 A × B) |
| Density (g/cc) = 2.59 − (0.0006 A) + (0.000152 A × B) |
| Tensile (MPa) = 1611 − (15.08 A) − (0.1082 A × B) |
| Impact Energy (J) = 158.0 − (1.517 A) − (0.02133 A × B) |
| Property | S | R-sq | R-sq (adj) | R-sq (pred) |
|---|---|---|---|---|
| Hardness (BHN) | 0.357663 | 96.18% | 95.55% | 93.95% |
| Density (g/cc) | 0.0208375 | 88.08% | 86.09% | 83.44% |
| Tensile (Mpa) | 2.44600 | 98.68% | 98.46% | 98.14% |
| Impact Energy (J) | 0.376534 | 94.82% | 93.96% | 92.42% |
| Objective | Minimum | Target | Maximum | Weightage | Importance | |
|---|---|---|---|---|---|---|
| H (BHAN) | Maximum | 24.20 | 29.33 | 29.33 | 1 | 1 |
| T (MPa) | Maximum | 102.40 | 155.70 | 155.70 | 1 | 1 |
| D (g/cc) | Minimum | 2.52 | 2.52 | 2.69 | 1 | 1 |
| I (J) | Maximum | 2.00 | 6.40 | 6.40 | 1 | 1 |
| Local Solutions | Component Proportion | Mechanical Properties | Individual Desirability | Composite Desirability | ||
|---|---|---|---|---|---|---|
| Al-Si Alloy | Al2O3 | |||||
| 1 | 94.65 | 5.35 | H (BHN) | 26.410 | 0.430795 | 0.442718 |
| T (MPa) | 128.969 | 0.498472 | ||||
| D (g/cc) | 2.607 | 0.485794 | ||||
| I (J) | 3.620 | 0.368252 | ||||
| 2 | 90 | 10 | H (BHN) | 28.948 | 0.925610 | 0.287936 |
| T (MPa) | 156.466 | 1.000000 | ||||
| D (g/cc) | 2.670 | 0.116695 | ||||
| I (J) | 2.280 | 0.063636 | ||||
| 3 | 100 | 0 | H (BHN) | 24.438 | 0.046338 | 0.153430 |
| T (MPa) | 103.079 | 0.012740 | ||||
| D (g/cc) | 2.527 | 0.959048 | ||||
| I (J) | 6.307 | 0.978788 | ||||
| Predicted Values | Observed Values | Absolute Relative Deviation (ARD) (%) | |||||
|---|---|---|---|---|---|---|---|
| Responses | Fit | 95% Predictive Interval (PI) | Observation-1 | Observation-2 | Observation-3 | Average | |
| H (BHN) | 26.4 | (25.6, 27.3) | 26.6 | 26.7 | 26.5 | 26.6 | 0.8 |
| D (g/cc) | 2.6 | (2.6, 2.7) | 2.6 | 2.7 | 2.7 | 2.7 | 2.5 |
| T (MPa) | 129 | (123.2, 134.7) | 127 | 131 | 130 | 129.3 | 0.3 |
| I (J) | 3.6 | (2.7, 4.5) | 3.7 | 3.7 | 3.6 | 3.7 | 1.8 |
Publisher’s Note: MDPI stays neutral with regard to jurisdictional claims in published maps and institutional affiliations. |
© 2022 by the authors. Licensee MDPI, Basel, Switzerland. This article is an open access article distributed under the terms and conditions of the Creative Commons Attribution (CC BY) license (https://creativecommons.org/licenses/by/4.0/).
Share and Cite
Poornesh, M.; Bhat, S.; Gijo, E.V.; Bellairu, P.K.; McDermott, O. Multi-Response Modelling and Optimisation of Mechanical Properties of Al-Si Alloy Using Mixture Design of Experiment Approach. Processes 2022, 10, 2246. https://doi.org/10.3390/pr10112246
Poornesh M, Bhat S, Gijo EV, Bellairu PK, McDermott O. Multi-Response Modelling and Optimisation of Mechanical Properties of Al-Si Alloy Using Mixture Design of Experiment Approach. Processes. 2022; 10(11):2246. https://doi.org/10.3390/pr10112246
Chicago/Turabian StylePoornesh, M., Shreeranga Bhat, E. V. Gijo, Pavana Kumara Bellairu, and Olivia McDermott. 2022. "Multi-Response Modelling and Optimisation of Mechanical Properties of Al-Si Alloy Using Mixture Design of Experiment Approach" Processes 10, no. 11: 2246. https://doi.org/10.3390/pr10112246
APA StylePoornesh, M., Bhat, S., Gijo, E. V., Bellairu, P. K., & McDermott, O. (2022). Multi-Response Modelling and Optimisation of Mechanical Properties of Al-Si Alloy Using Mixture Design of Experiment Approach. Processes, 10(11), 2246. https://doi.org/10.3390/pr10112246