Article

Object Detection: Custom Trained Models for Quality Monitoring of Fused Filament Fabrication Process

1
IRES—Innovation in Research & Engineering Solutions, Rue Koningin Astritlaan 59B, 1780 Wemmel, Belgium
2
BioG3D P.C., 1 Lavriou Ave., Technological & Cultural Park of Lavrion, 19500 Lavrion, Greece
*
Author to whom correspondence should be addressed.
Processes 2022, 10(10), 2147; https://doi.org/10.3390/pr10102147
Submission received: 29 September 2022 / Revised: 17 October 2022 / Accepted: 19 October 2022 / Published: 21 October 2022

Abstract

:
Process reliability and quality output are critical indicators for the upscaling potential of a fabrication process on an industrial level. Fused filament fabrication (FFF) is a versatile additive manufacturing (AM) technology that provides viable and cost-effective solutions for prototyping applications and low-volume manufacturing of high-performance functional parts, yet is defect-prone due to the inherent aspect of parametrization. A systematic yet parametric workflow for quality inspection is therefore required. The work presented describes a versatile and reliable framework for automatic defect detection during the FFF process, enabled by artificial intelligence-based computer vision. Specifically, state-of-the-art deep learning models are developed for in-line inspection of individual thermoplastic strands’ surface morphology and weld quality, thus defining acceptable limits for FFF process parameter values. We examine the capabilities of an NVIDIA Jetson Nano, a low-power, high-performance computer with an integrated graphical processing unit (GPU). The developed deep learning models used in this analysis use a pre-trained model combined with manual configurations in order to efficiently identify the thermoplastic strands’ surface morphology. The proposed methodology aims to facilitate process parameter selection and the early identification of critical defects, toward an overall improvement in process reliability with reduced operator intervention.

1. Introduction

The FFF process involves a wide range of toolpath and material process parameters, which should be carefully tuned during the 3D model slicing phase in accordance with the FFF system configuration, the material processability range, as well as targeted precision, mechanical strength and process time. As the majority of FFF systems employ an open-loop control of the process, an experimental comparison of actual/nominal process output characteristics and a post-process quality assessment should be conducted to ensure compliance with quality targets. To this end, a considerable amount of research work has been conducted to analyze the effects of FFF process parameters on the quality of the final part with destructive [1] and non-destructive [2,3,4,5,6,7] methods, as well as the development of real-time and in-situ monitoring tools. The proposed methodology aims for a non-destructive approach to in-situ monitoring during the FFF process that detects and classifies predefined types of printing defects by utilizing a pre-trained machine learning (ML) model.

1.1. Relevant Work

The 3D-printed parts reliability has been the focus of researchers to realize additive manufacturing (AM) as an end-part production tool [7]. Various machine learning (ML) methodologies have been implemented in the AM field of study for material tuning, process optimization, in situ monitoring, cloud service and cybersecurity aiming to reduce computational cost, augment standards for qualification and address and optimize data acquisition techniques. Mohammad Farhan Kahn et al. [6] have introduced a convolutional neural network (CNN)-deep learning model to detect real-time malicious defects to prevent the production losses and reduce human involvement in quality checks. On the other hand, Mingtao Wu et al. [5] propose an alternative solution to detect malicious defects in 3D printing by classifying images layer-wise in order to address the inclusion of defects. The images are captured layer-by-layer from the top view of the software simulation. While both approaches suggest real-time monitoring and defect detection, our methodology addresses the localization of identified defects. Oliver Holzmond et al. [2] suggest a methodology that captures in-situ defects in 3D-printed parts. The suggested methodology makes use of a “certify-as-you-build” quality assurance system with the capability to monitor a part during the print process, capture the geometry using three-dimensional digital image correlation (3D-DIC) and compare the printed geometry with the computer model to detect print errors in situ. Hongyao Shen et al. [3] introduce a multi-view and all-round vision detection method that detects transverse, longitudinal and localized defects on the outer surface of 3D-printed parts during the FFF process. The proposed methodology includes the integration of a Charge Coupled Device (CCD) camera on the nozzle, detection of contours in the captured images by utilizing dual kernel detection, a conjunction of related contours and finally, mathematical representation and classification of the detected defects based on their geometrical characteristics. Jarosław Fastowicz et al. [4] propose the development of a methodology that enables the surface quality assessment of parts printed with FFF technology utilizing 3D-scanning techniques combined with depth map tools and entropy analysis. More specifically, flat samples were printed by employing three different FFF printers and adjusting the printing parameters in order to acquire a variety of printed surface qualities. The evaluation and classification of the surface quality are based on the entropy value calculation of the depth-map images generated from the scanning procedure, whose values are then compared to a threshold set.

1.2. Artificial Intelligence and Computer Vision

Computer vision (CV) is a study field of artificial intelligence (AI) that combines disciplines such as information technology, mathematics and image processing and aims to develop techniques that enable computers to detect, process and interpret visual information coming from videos and images. The first developments in the field of CV were introduced in the late 1960s, and the initial concept was to find ways to imitate human vision in order to enable computers to understand and analyze visual information. Numerous applications in the field of CV have already become firmly integrated with our daily lives, including facial recognition, autonomous vehicles, camera monitoring and medical diagnosis. In recent years, advances in deep learning technology, such as the development of a special type of deep learning model named Convolutional Neural Networks (CNNs), have significantly improved the performance of CV systems.
CNNs are a class of deep neural networks developed in the 1980s designed to extract important features from image data. While traditional neural networks flatten the input images into one-dimensional vectors, the leverage of CNNs lies in the fact that they also take into account the relations among their pixels and can, in this manner, detect their spatial characteristics. The main building blocks of the CNNs architecture are convolutional layers, pooling layers and fully connected layers. Feature extraction is performed in the convolutional layer, which, as its name implies, applies the mathematical operation of convolution between the input image and a set of digital filters and outputs an image of smaller size with the detected important features, also called a feature map.
The architecture of CNNs also constitutes them more computationally efficient. The application of convolutional and pooling operations leads to image outputs smaller than the inputs, resulting in less sparse interactions compared to a traditional fully connected neural network and thus in fewer parameters and consequently with less computational power for their calculation and memory for their storage. In addition, these models are easy to parallelize across multiple GPU cores. As a result, CNN-based architectures constitute powerful and efficient models that learn information from images and are thus the predominant models for multiple CV tasks such as image classification, object detection and instance segmentation.

1.3. Object Detection

One of the most common tasks tackled within computer vision is Object Detection. Object detection is a task that locates the presence of objects with a bounding box as well as the types or classes of the located objects in an image. The input for a model that performs object detection is an image with one or more objects and the output is one or more bounding boxes (defined by their center coordinates and height, width of the bounding box) and a class label for each bounding box; YOLO (you only look once) is one of the fastest object-detection algorithms [8]. It is used in areas where speed is the most crucial element without penalizing the user with a great loss of accuracy. YOLO uses a convolutional neural network, which extracts important features from a given image. What makes YOLO fast, is the methodology it follows. YOLO divides an image into S × S grid of cells, where each cell is responsible for predicting if an object exists in it with a given probability P(object). Each area of interest produces a number of bounding boxes that are likely to include interesting objects. Each of the predicted bounding boxes must reach a certain confidence level, which is measured using the probability of each object multiplied with the IoU (intersection over union) as shown in Equation (1).
P ( o b j e c t ) × I o U
The IoU is defined as the difference between the ground truth (GT) bounding box and the predicted bounding box. The bounding boxes that have the highest confidence scores are kept, while those with lower confidence scores are discarded. The network returns a number of bounding boxes that are finally predicted, providing for each bounding box the center coordinates of the bounding box ( x c ,   y c ) as well as its height and width ( h , w ) all measured in pixels.

1.4. Computational Power–GPU

The NVIDIA Jetson Nano is a powerful, small computer that lets the user run several types of neural networks or even convolutional neural networks (CNNs) in parallel, for applications such as image classification or object detection running at the edge.
The NVIDIA Jetson Nano has built-in libraries that are already compatible with major deep-learning frameworks such as PyTorch [9]. It allows edge computing while bringing computation and storage of data closer to the device where data is gathered. Its major advantage such as other edge devices is that it provides reduced latency and increased bandwidth while also providing GPU cores that make computations even faster.

1.5. Problem Description

In the FFF process, the thermoplastic feedstock is melted and extruded according to a pre-defined raster pattern, which is formed upon the rapid solidification and coalescence of thermoplastic strands. Material flow imposes physical limitations on the actual FFF strand geometry that can be obtained, leading to overfills or underfills when the nominal volumetric flow rate is not in accordance with the actual volumetric flow rate [10]. The associated defects manifest as gaps between adjacent strands (underfills) or peripheral material accumulation (overfills), which may become critical during the deposition of the first printed layer due to partial/complete detachment from the printing platform or printhead collision, leading to process failure [11]. For the present investigation, the proposed methodology for automatic defect identification was applied for the assessment of the effect of three process parameters on first layer quality, namely, strand height, width and printing speed, as well as the automatic identification of impurities due to material cross-contamination. Thermoplastic strand height (equal to layer height) and strand width are user-defined parameters that are subsequently employed by the slicing software for the automatic calculation of the filament feed rate; thus, an increase in these values is translated into a nominal increase in material volumetric flow rate to achieve the targeted strand volume for a specific printing speed. Furthermore, in addition to strand parameters definition, nozzle-buildplate Z distance calibration shall be accounted for to ensure proper adhesion; thus, it remains constant for this specific study to avoid variations in the results relevant to nozzle-builtplate Z distance differentiations. For a given nozzle diameter and constant printing temperature and ambient conditions, the aforementioned parameters should be tested through sequential interdependent tests to experimentally identify the onset and evolution of process anomalies, as well as the compliant processability range of process parameter combinations with acceptable quality output.

2. Materials and Methods

2.1. AM Hardware and 3D-Printed Customizable Cools for Detection Devices Integration

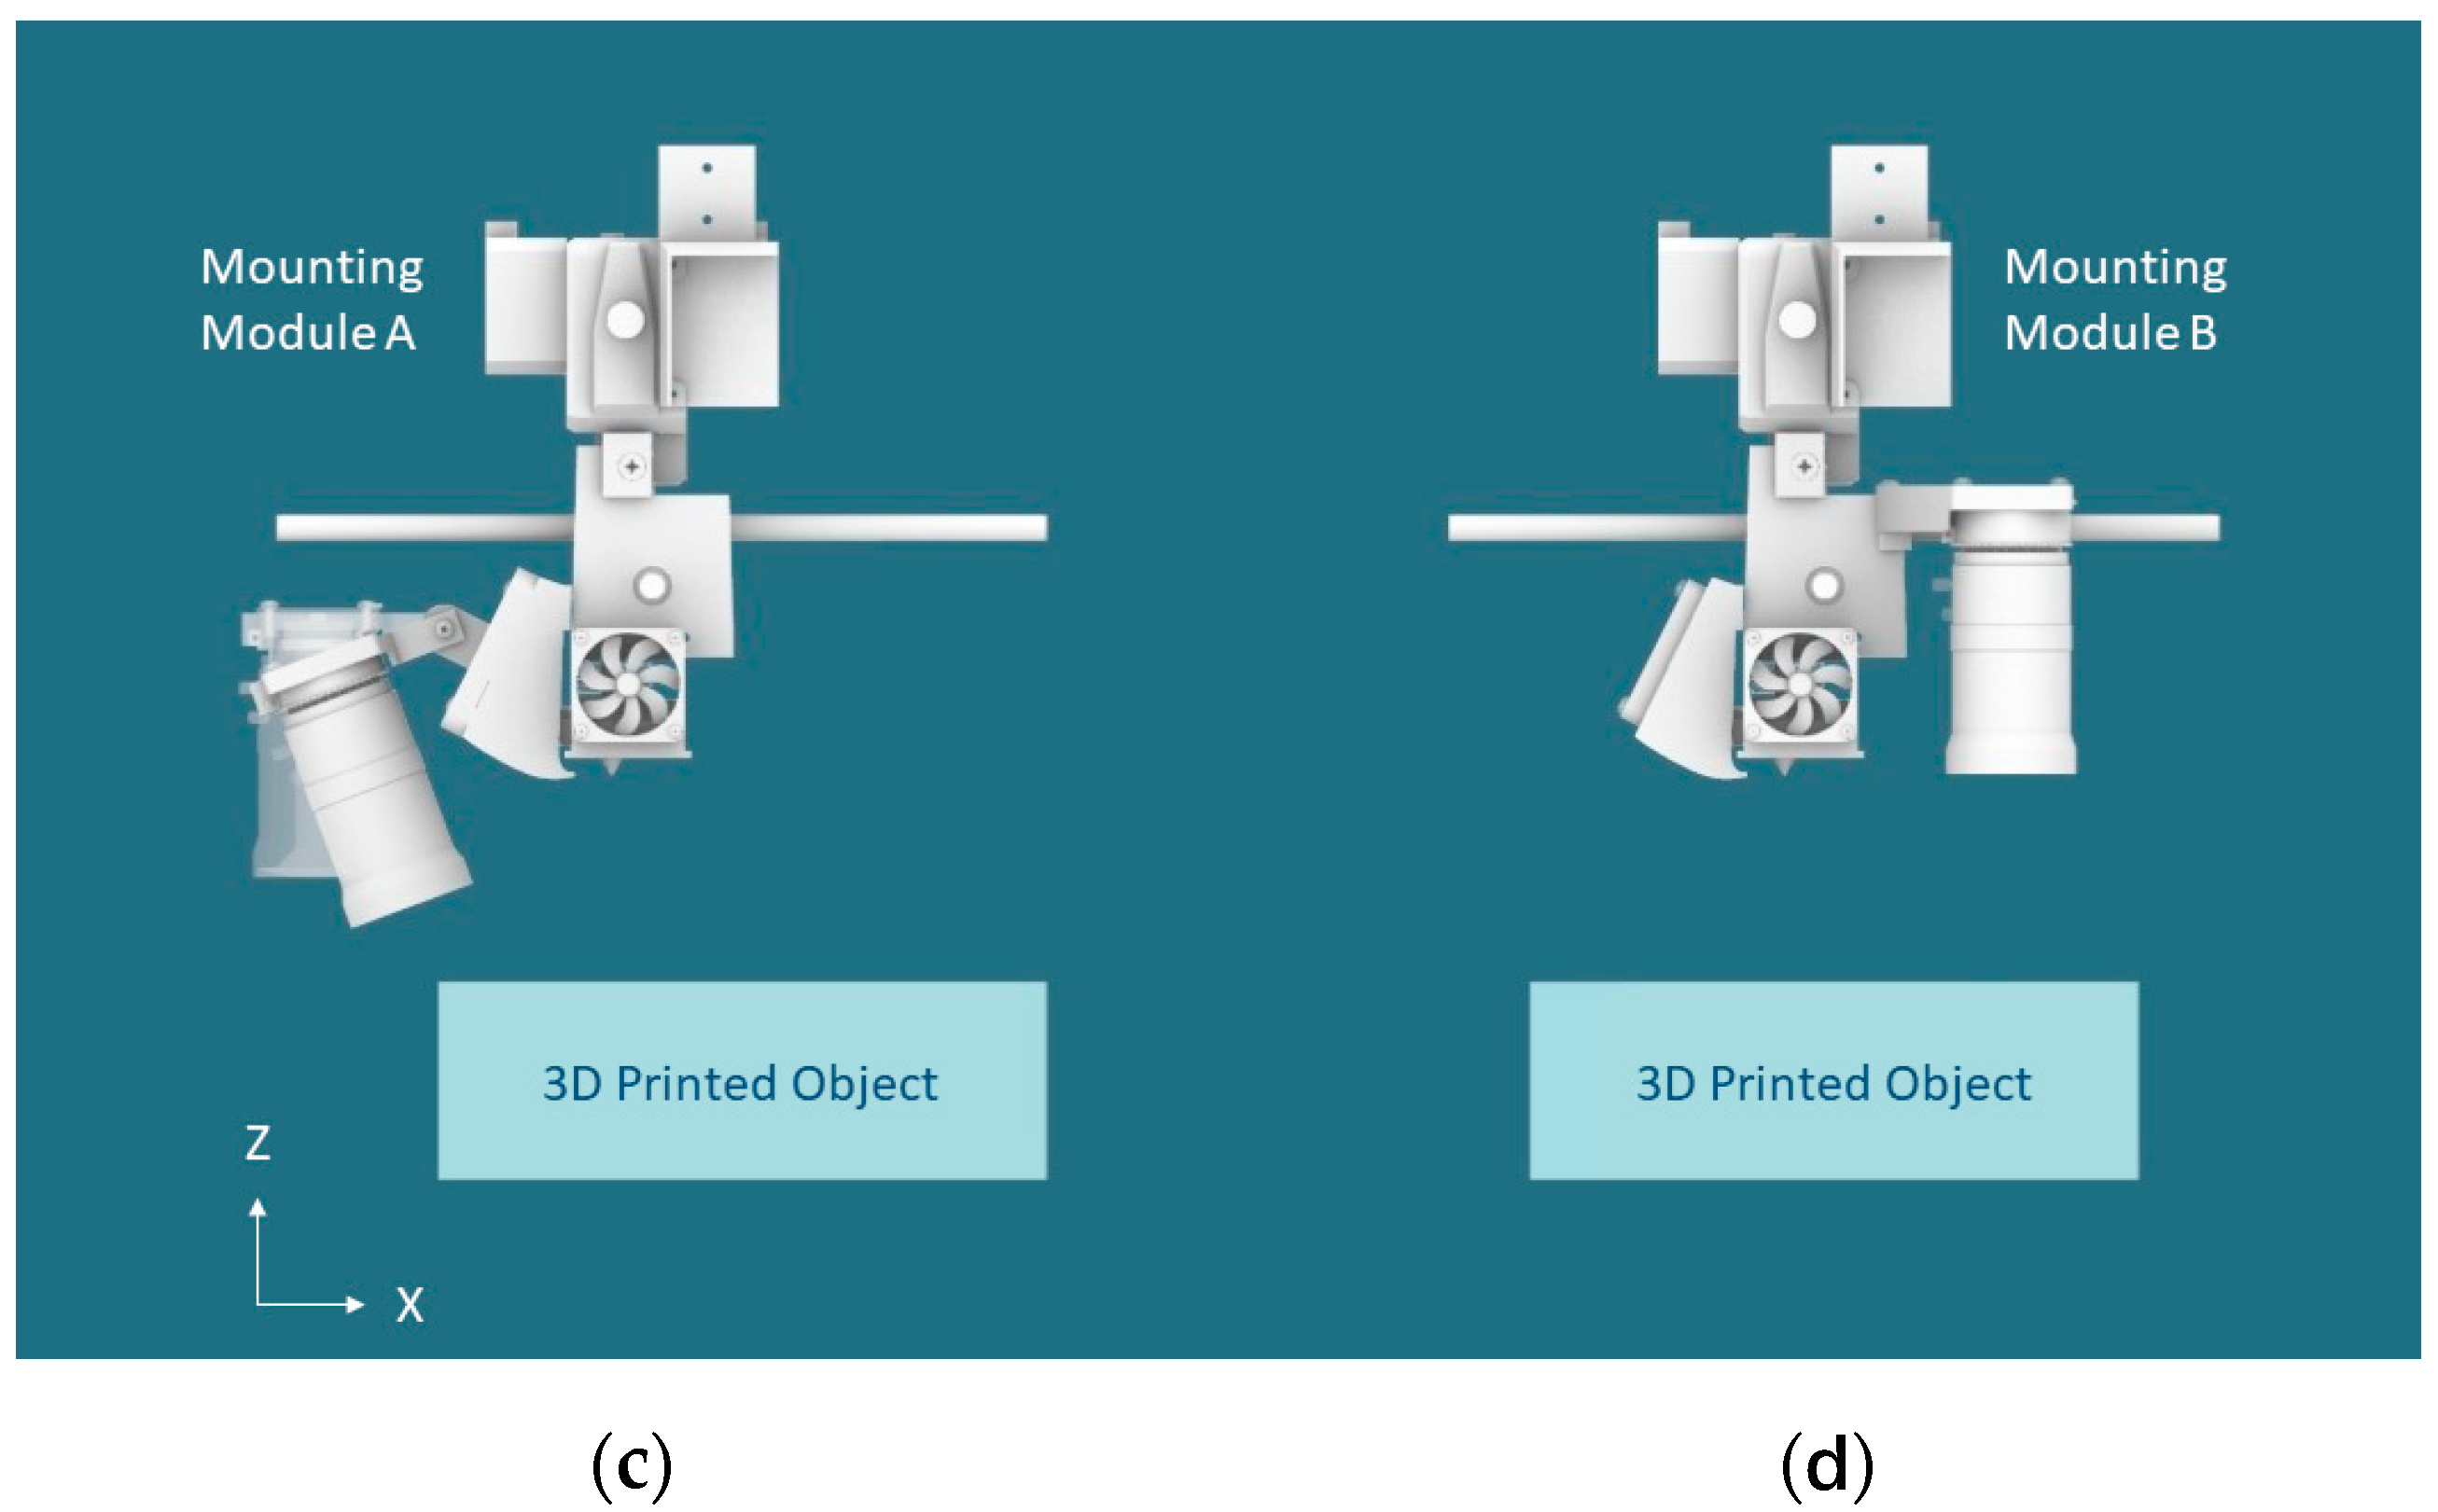
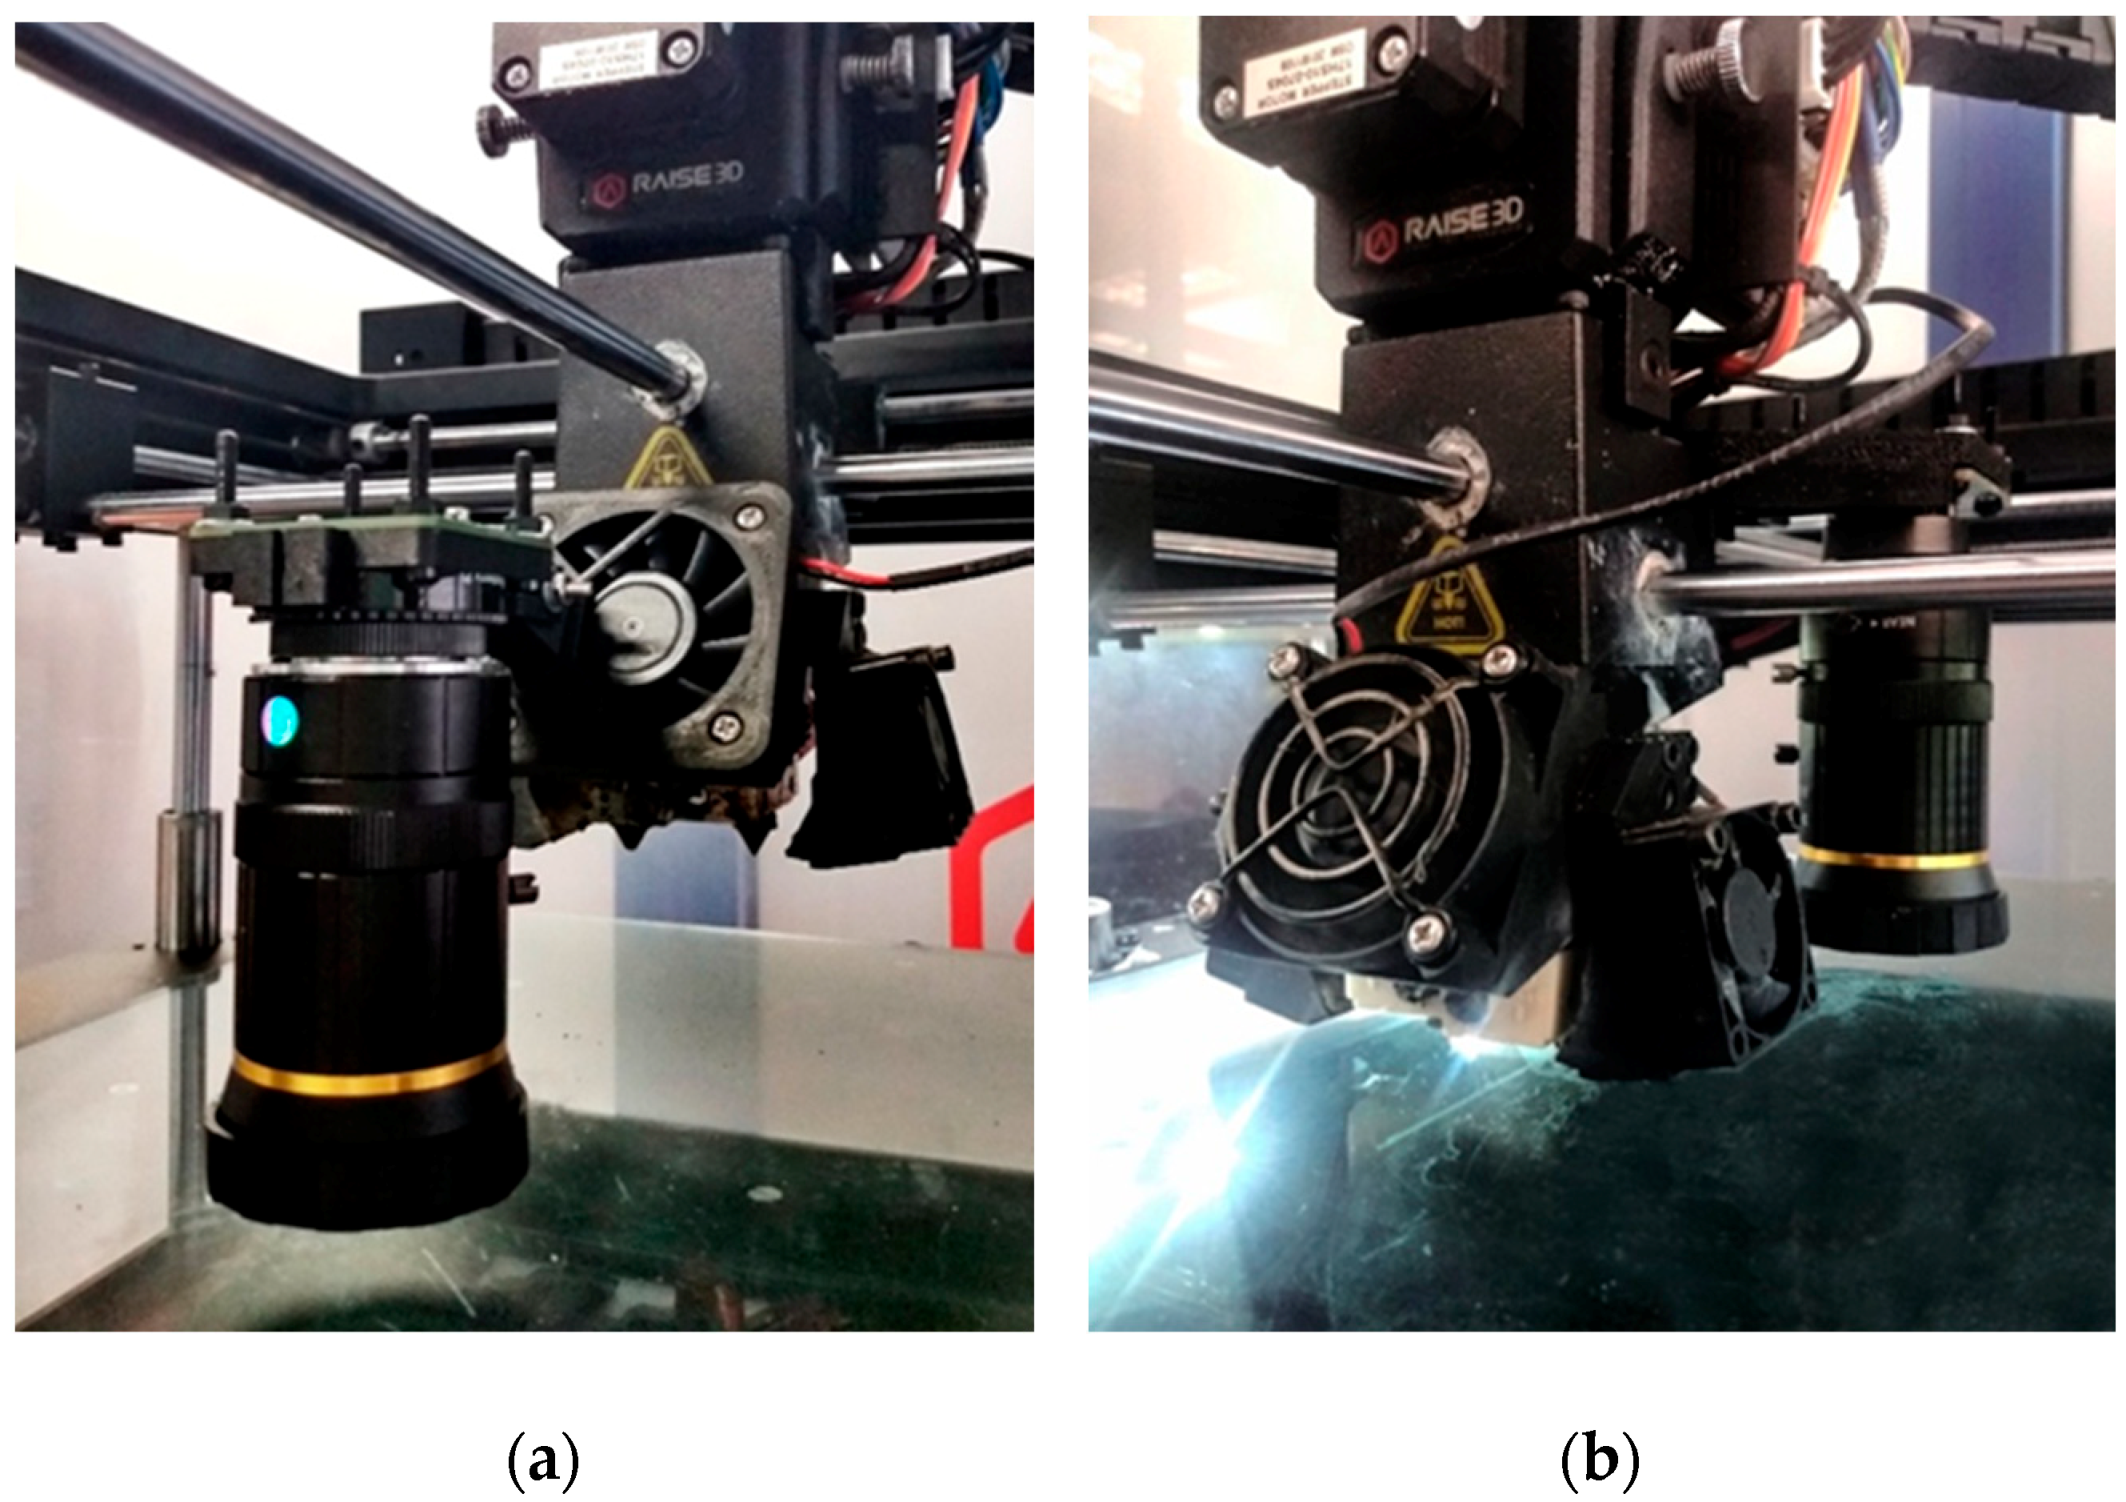
The FFF unit employed for the proof of concept was the Cartesian-based RAISE3D Pro2, with a build volume capacity of 305 × 305 × 300 mm. Two mounting prototypes were developed for the application of the detection hardware (Figure 1): one for the frontside (Figure 1a) and one for the backside (Figure 1b). The design software employed was Rhinoceros 3D, the integrated development platform Grasshopper, and SolidWorks. The mounting prototypes (Figure 2) were 3D printed in the same AM unit. Figure 1 demonstrates the capacity of the customizable mounting tools to integrate the detection hardware in various positions and angles for the localization of the defect: Prototype A (Figure 1a) can be adjusted considering the thickness parameter (i.e., XYZ image capturing), whereas Prototype B (Figure 1b) is applicable for XY plane defects identification.

2.2. FFF Testing Specimens

The Raise 3D Pro 2 FFF system (utilized nozzle diameter: 0.6 mm) and a commercial polylactic acid (PLA) filament were employed for the fabrication of single-layer, rectangular specimens (120 × 120 mm) for quality inspection of first-layer consistency. The 3D optimizer software (FabControl SIA) was employed for G-code generation. Specimens were printed directly on a heated glass plate (60 °C) after precise leveling and calibration of the FFF system, which was maintained constant for all specimens. Printing temperature was also kept constant at 215 °C, as indicated by the material supplier, with no air cooling applied. Two types of testing specimens were produced to examine the effect of printing speed in relation to thermoplastic strand height and width. For the first test, a total of 28 variants of printing speed vs. thermoplastic strand height (7 × 4 combinations of parameter values) were assessed, as presented in Figure 3a. The upper and lower limits of each parameter value have been set from preliminary tests to ensure consistent flow through the nozzle and according to the FFF system operational range. Each parameter combination was tested in distinct subregions of the testing specimen, which were printed sequentially starting from the top right corner. By inspection of the thermoplastic strand surface morphology and weld quality among adjacent strands, the acceptable limits for printing speed and strand height were defined, and a combination within the selected processability range, namely, printing speed of 27 mm/s with strand height of 0.33 mm, was selected as reference for the second test, where 7 values of strand width were examined as illustrated in Figure 3b.

2.3. Hardware Setup

The suggested methodology used an ArduCam High Quality Camera, 12.3MP 1/2.3 Inch IMX477 HQ Camera Module for image capturing. For the camera to be able to capture the images as an optical microscope, a RASPBERRY PI HQ CAMERA LENS-16MM TELEPHOTO with the following specifications has been employed:
  • Focal Length: 16 mm;
  • Aperture: F1.4-16;
  • Dimensions: 39 mm × 50 mm.
The captured images were manually annotated as mentioned in Section 2.4 and Section 2.6. A Python script was developed to capture and save the images in an automated manner. The whole data-capturing procedure was conducted using the NVIDIA JetSon Nano.

2.4. Training and Methodology

The goal of the developed methodology was to provide users with an automated solution when checking for defects in 3D printed materials. The scope of the process targets the automated unbiased defect detection without the use of an optical microscope. Thus, our approach eliminates bias while at the same time reducing effort making the processing time efficient. The whole process is implemented in a pipeline using Python [12] programming language.

2.4.1. Annotation Labels

In order to create a custom-made model that is able to detect defective objects, manual annotation is needed. For the manual annotation of the defects the Labelimg tool (v1.7.0) [13] was used. For this analysis three types of defects were defined by FFF experts [overfill, underfill, impurity]. Labelimg is an open-source manual annotation software for labeling images, which is very user-friendly when it comes to object detection problems. The software supports YOLOv5 PyTorch txt annotation format. Each type of defect was labeled within a custom bounding box. The results were saved into a txt file. The constructed dataset included the annotations and the corresponding category. Each annotation corresponds to a bounding box with its spatial coordinates within a given image. The (x, y, h, w) of each bounding box is the (x, y) of the center of the bounding box and (h, w) correspond to the height and width of the bounding box. The annotation procedure resulted in a dataset of 714 annotated images and Table 1 shows the number of bounding boxes annotated per category. The limits that separate a defective and an accepted printed region are assessed and set by FFF experts and data scientists in order to find optimal working points. The final threshold derived from ad-hoc analysis.

2.4.2. Training

In this section the technical characteristics of the model are described. First, the dataset was split into train, validation and test sets, each one consisting of 500, 143, 71 annotated images respectively. The YOLO model was used to predict and at the same time categorize the defects that are found within a given image providing a bounding box associated with them. The model is based on modern convolutional neural networks and uses the CSP (cross-stage partial networks) as a backbone model. It is a compound-scaled object detection model trained on the COCO dataset [14]. In this analysis, the YOLOv5 model used the COCO weights as initial weights. Also, we used the YOLOv5s model, which is the smallest and fastest model from the YOLOv5 family of models. The YOLOv5 model’s purpose is to minimize the loss function. The loss function is defined as the weighted average of three other losses. The total loss is defined by incorporating losses from classification loss, which sums out the confidence of the class, the objectness loss, which is the confidence of an object’s presence and the bounding box loss, which is a regression loss (mean squared error).
The model has been fine-tuned to find the best available hyperparameters thus resulting in the most accurate model. The SGD (stochastic gradient descent) optimizer was used, while the selected epochs for training were 100. The selection of the hyperparameters is performed through the use of bayesian optimization [15], minimizing the validation mean average precision (mAP) metric. The bayesian hyperparameter optimization was performed using the Weights and Biases [16] library. The configuration of the best-derived hyperparameters for the trained model consists of the following attributes as described in Table 2. The training was performed on one NVIDIA GPU Tesla T4-16GB.

2.5. Custom G-Code and Image Capturing

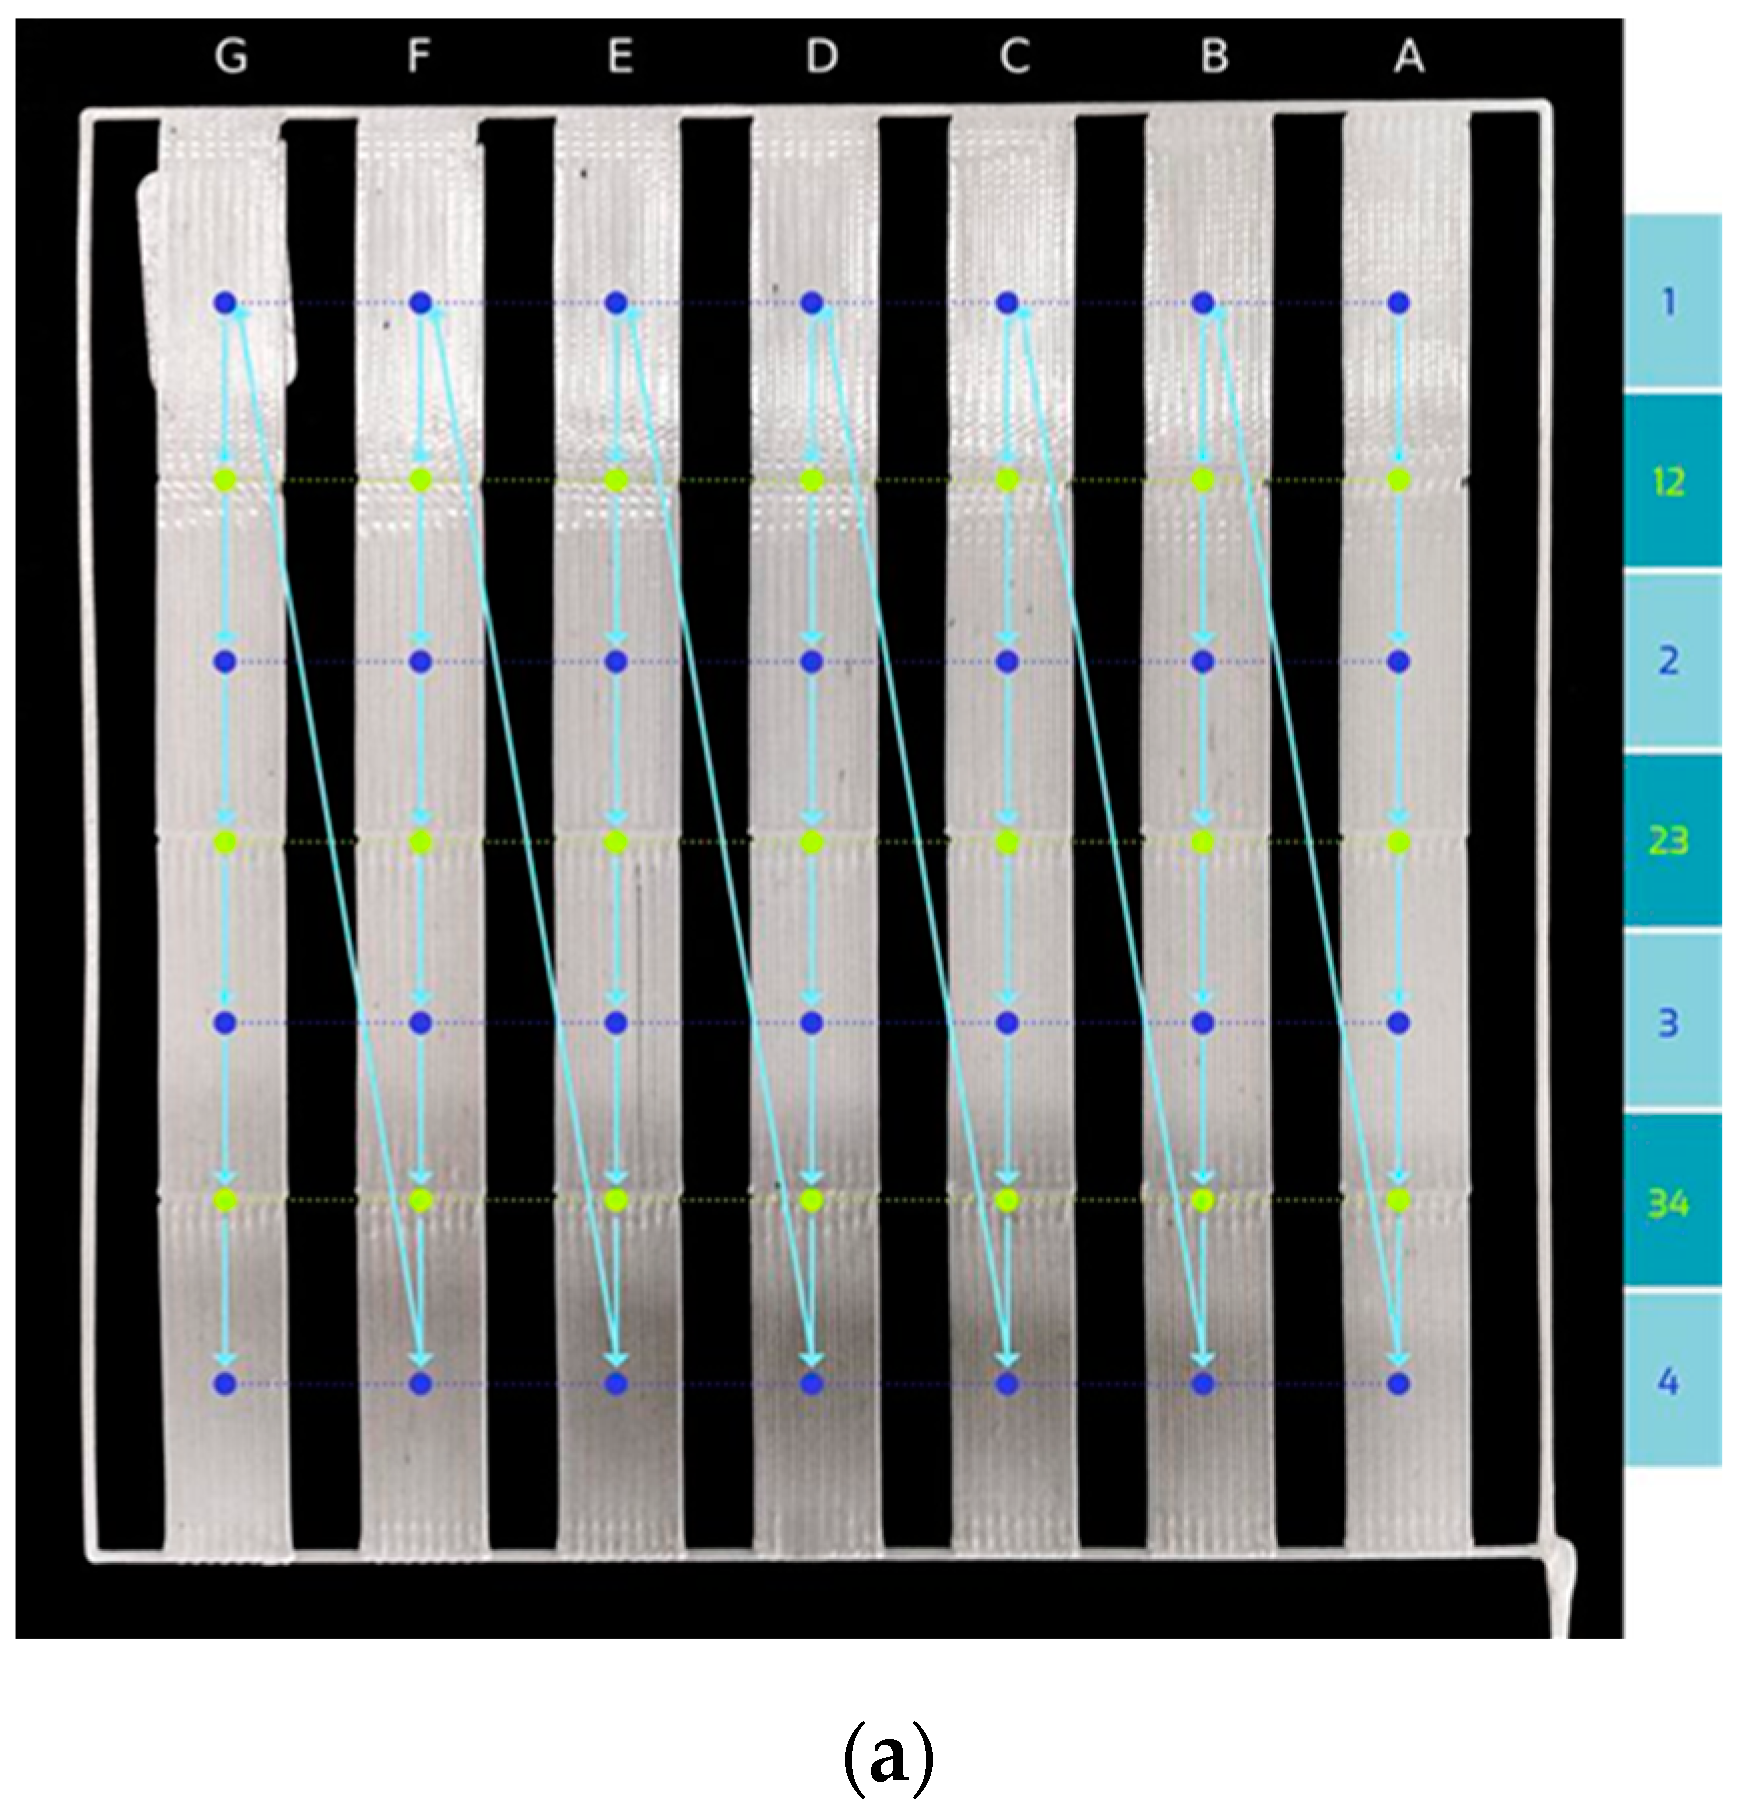
A custom G-Code script was developed for the positioning of the detection device (mounted on the 3D printer’s toolhead) through specified paths that include pauses above all regions of interest: the centroids of the testing cells and their boundary conditions (Figure 4). Furthermore, a Python script that enables image capturing at predefined points in time and in synchronization with the custom G-Code was developed. Figure 4a describes the codification used for each type of testing region. Starting from the right, every printed column is named after a letter x = [A–G], while starting from the top, central regions are followed by an increasing number i = [1–4] and boundary regions by two indices j(j + 1), j = [1–3], that represent the two successive bordering cells. Thus, the codification format is xi for a central region and xj(j + 1) for a boundary edge region, respectively, and examples of each type are presented in Figure 4b,c.

2.6. Defined Workflow

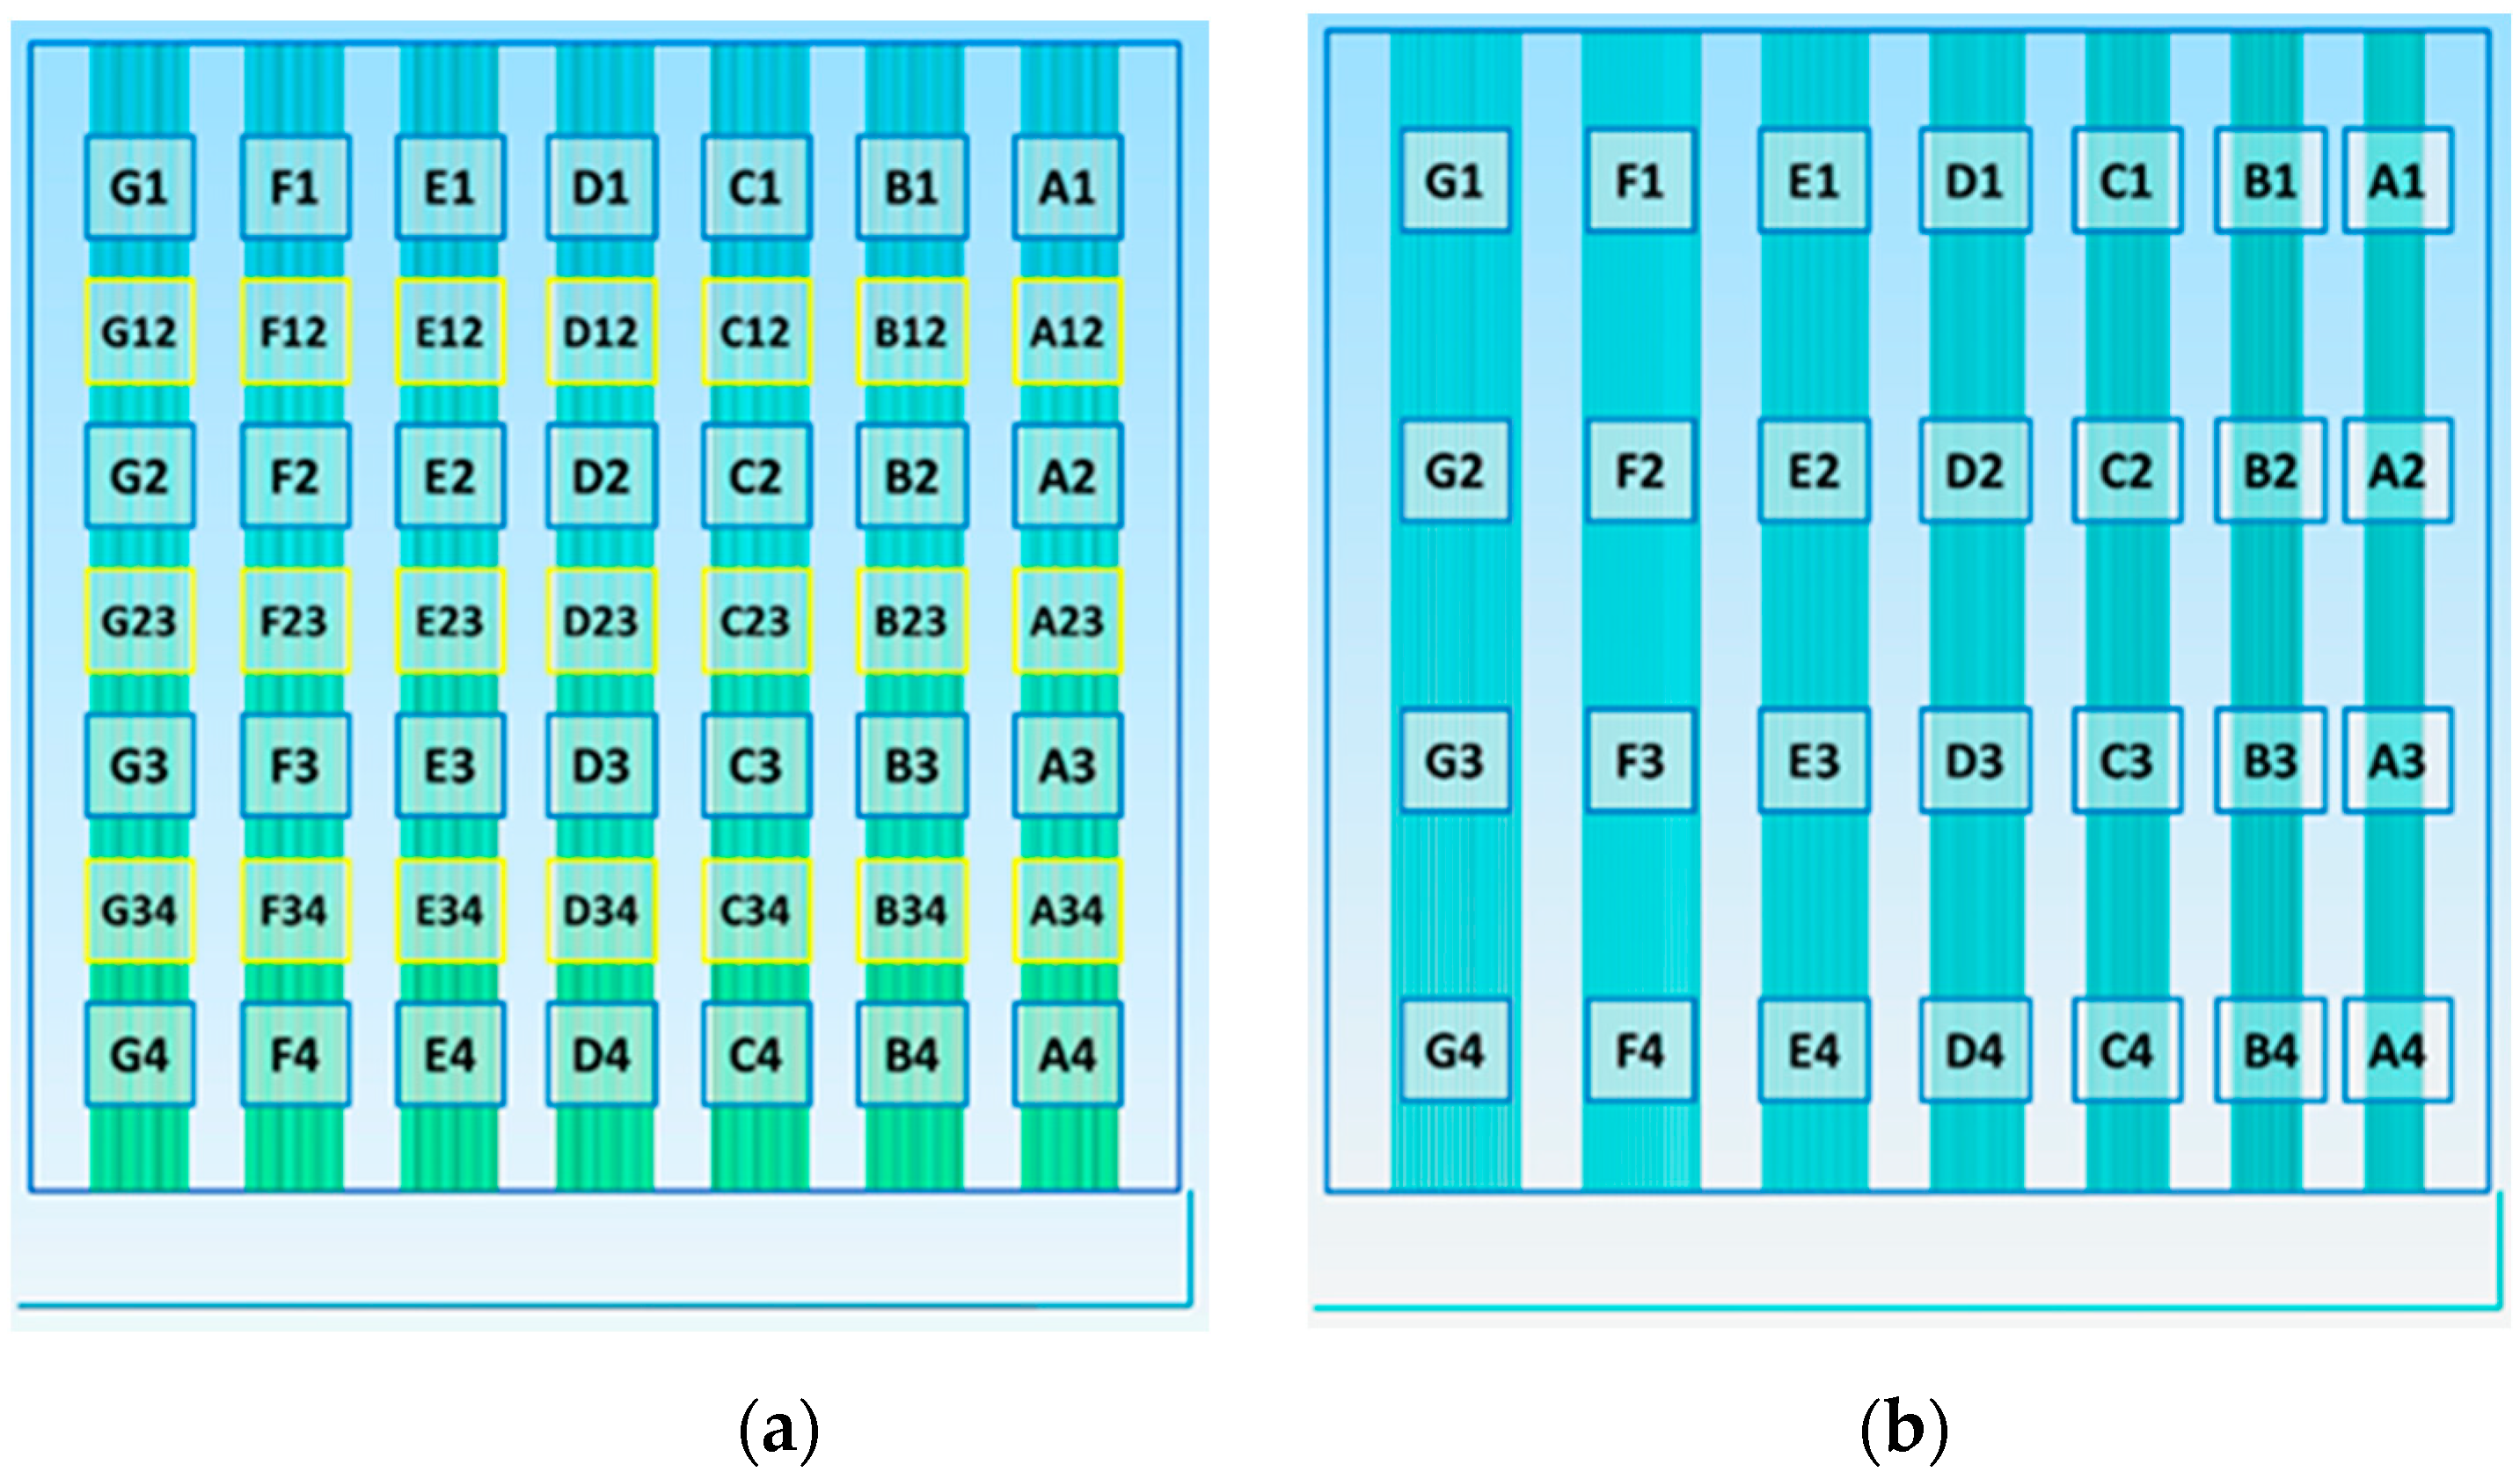
In this subsection, we describe in detail the workflow that was implemented to develop the automated defect detection system. The x-y plane of the specimen is divided into sections as shown in Figure 5, thus resulting in a grid. Two types of grids are selected depending on the number of printing parameters examined. The specimen grid presented in Figure 5a is applied for the performance of first layer strand height versus first layer printing speed test, while the grid presented in Figure 5b is utilized for the evaluation of the first layer strand width printing parameter. At first the ArduCam was fixed next to the nozzle 15 mm above the specimen and was connected to the NVIDIA Jetson. A Python script was developed to save images coming from the ArduCam and also be in alignment with the implemented GCODE so that the captured images match the corresponding positions in the x-y plane.
The developed Python script takes as input the material type and the current datetime. In such way, it creates a new directory to save the acquired images (<material_type>/<current_datetime>).
When the procedure is finished, the directory is provided as input for the YOLOv5 inference mode. The YOLOv5 inference script receives as input the directory where the images are located. For the inference script, the model uses the Jetson Nano 128-core built-in Maxwell GPU. The results are images that incorporate the bounding boxes of the predicted defects and their respective class and are saved in the same input directory, in the subdirectory results as specified by the user. YOLOv5 also provides the txt annotation files that include bounding box information as well as class of the bounding box.
As a postprocessing step, further analysis is performed using the output data. Our methodology produces two types of results. For each set of images two files are created.
(1)
results.csv
The file is structured as follows:
FilenameLabelxyWidthHeight
The filename indicates where in the given grid any predicted label was found (e.g., A1, 12, etc.). For each predicted object the associated label is provided as well as its center coordinates (x, y) = (xCenter, yCenter). Also, the height and the width of the identified object bounding box (h, w respectively) are provided in pixels. The labels correspond to the following mapping as shown in Table 3.
(2)
processed_results.csv
The file is structured in the same manner. This file indicates defects that are found per object (a2, a3, … etc.) while the results.csv showcases all defects found, even in the in-between parts (pictures a12 contain content both from a1 and a2 picture). We have tackled this problem by providing a threshold in the y-axis, separating the images with the following procedure: For an image of type a12, every defect with (xC, yC) found above the given ythreshold is assigned to the a2 image and every image found below is assigned to the a1 image.

3. Results and Discussion

Images, Defects, Ground Truth over Prediction

The most efficient model was fine-tuned, training for 100 epochs using the configuration provided in Table 2. The loss and metrics are presented in Table 4, while Table 5 shows the AP for a given IoU threshold of 0.5 on the validation set. The images are compared with the Ground Truth (GT), which corresponds to the manual label and bounding box taken from the manual annotation.
For the evaluation metrics, the following definitions are followed (citations + coco):
  • True positive (TP) is when a prediction-target mask (and label) pair have an IoU score, which exceeds a predefined threshold;
  • False positive (FP) indicates a predicted object mask that has no associated ground truth object mask;
  • False negative (FN) indicates a ground truth object mask that has no associated predicted object mask;
  • True negative (TN) is the background region correctly not being detected by the model, these regions are not explicitly annotated in an instance segmentation problem, thus we chose not to calculated it;
  • Accuracy = TP TP + FP + FN;
  • Precision = TP TP + FP.
AP50 = 1ni = 1nAPi, for n classes.
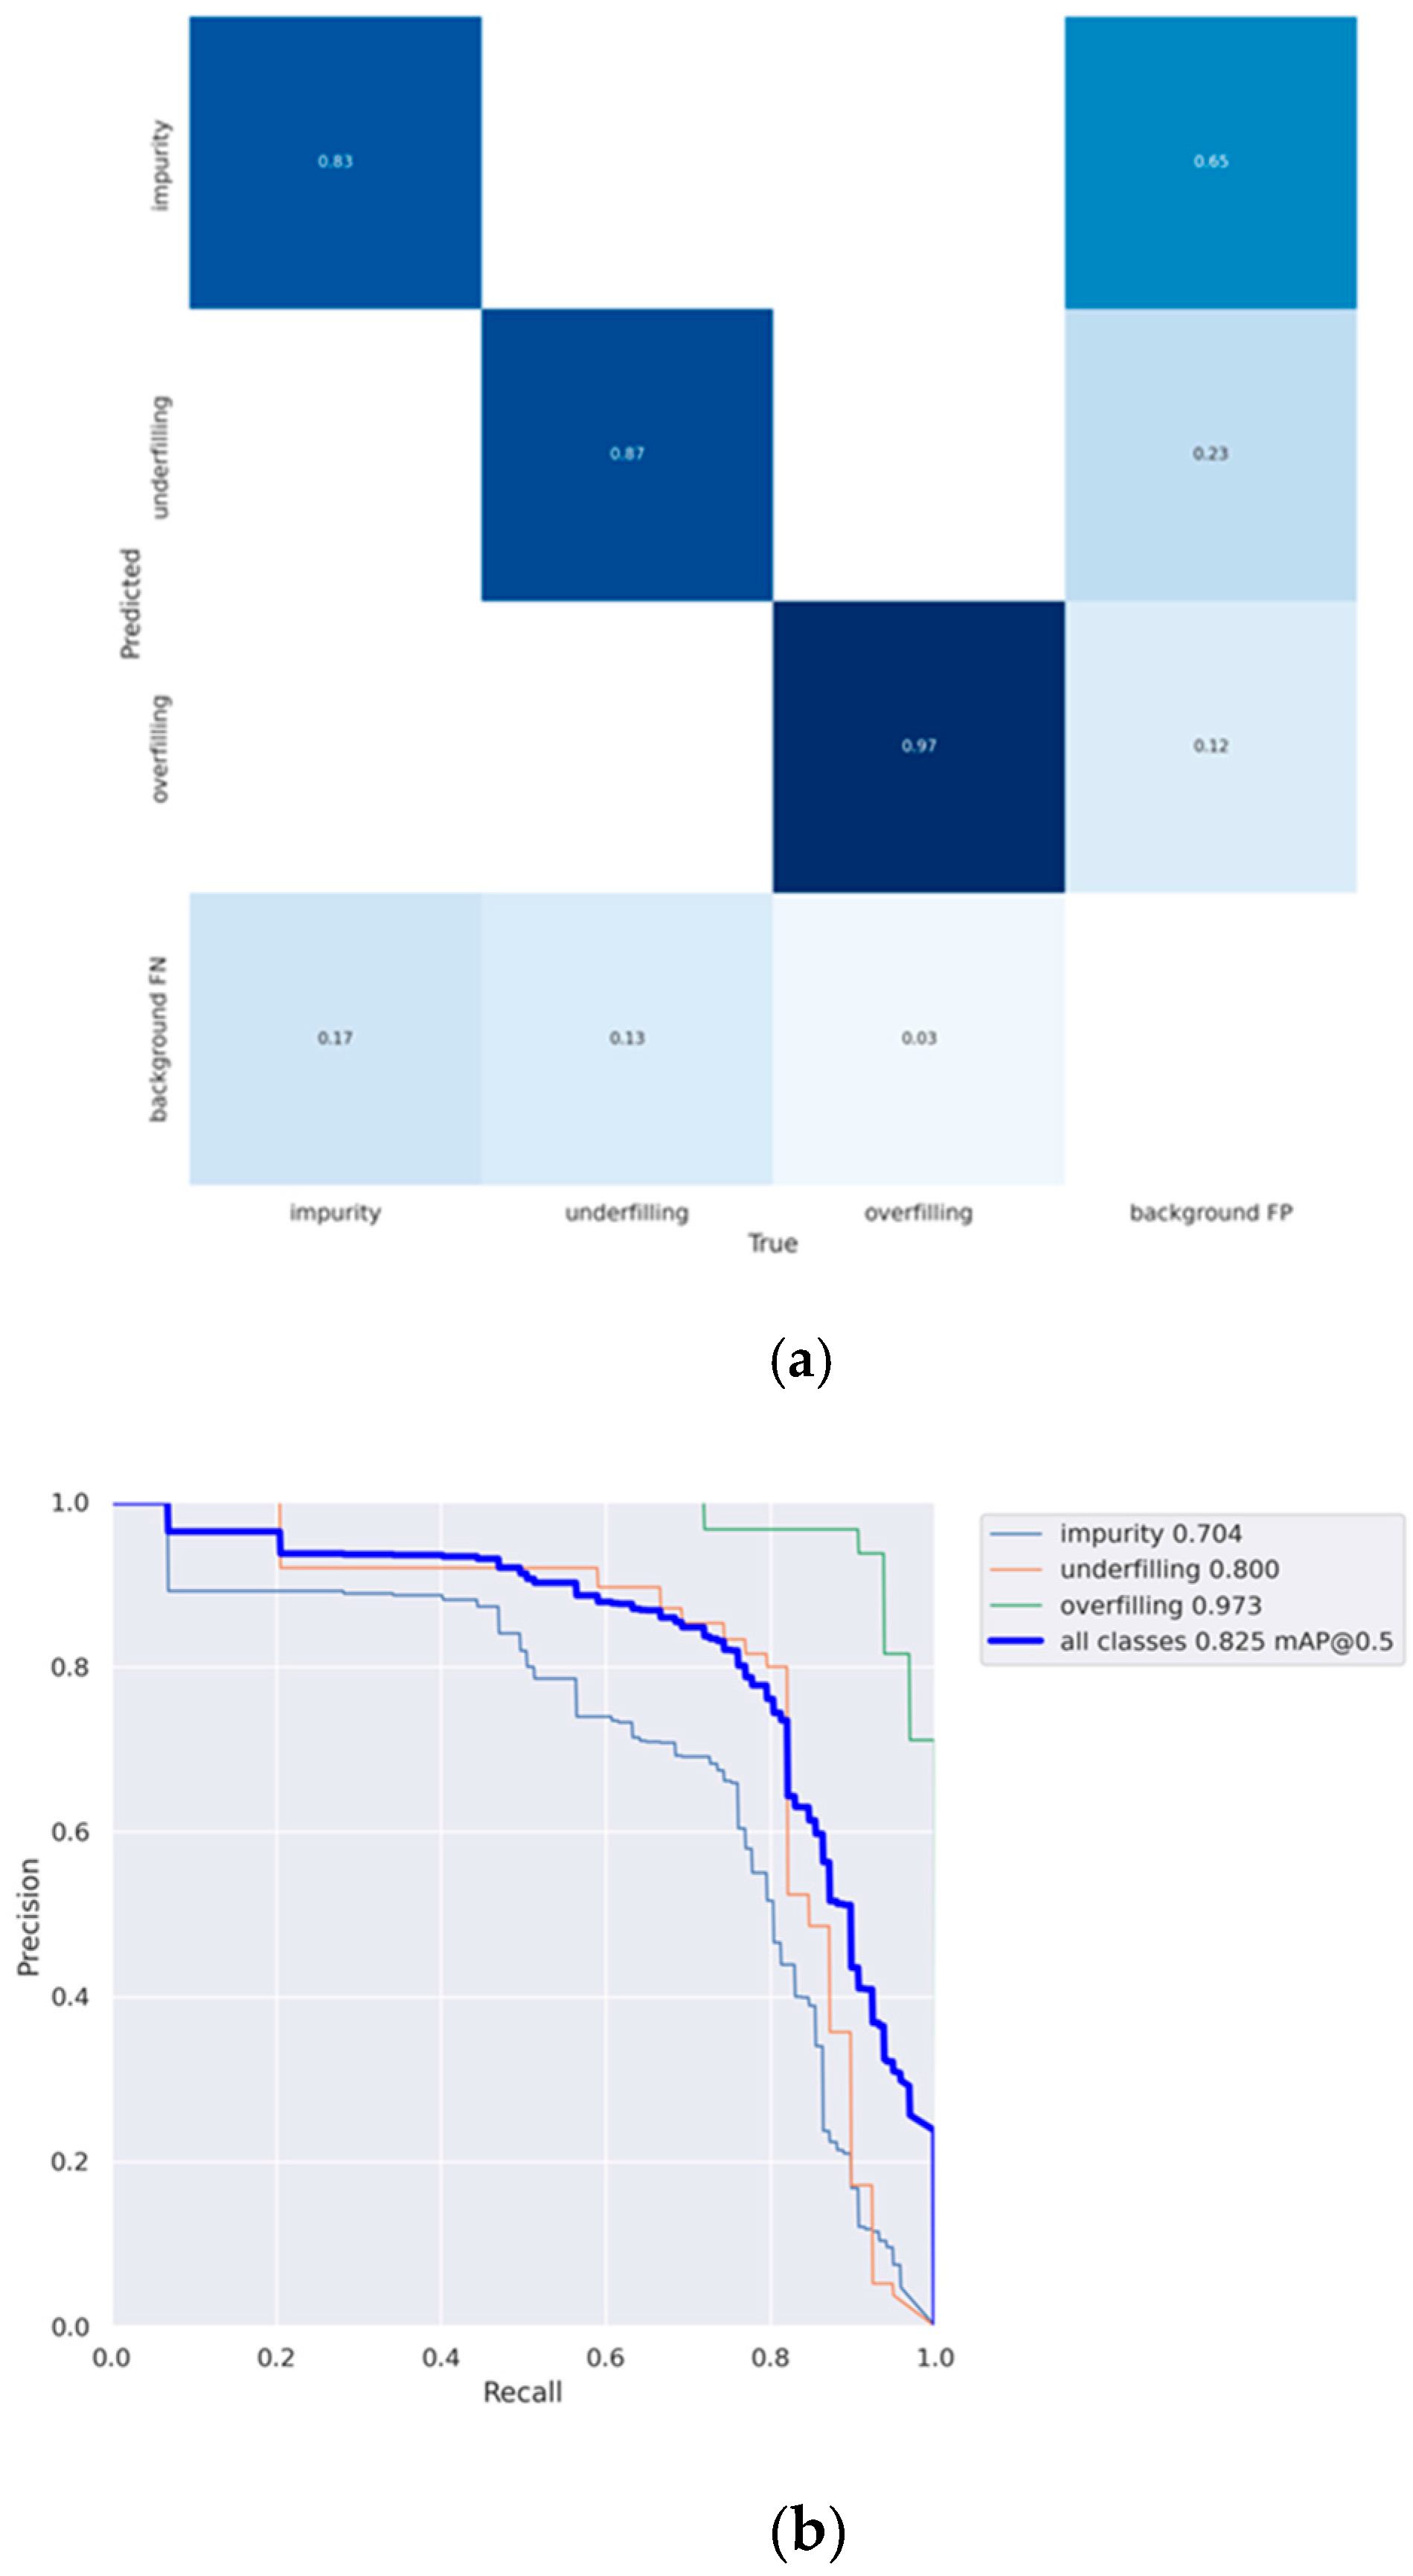
The plots related to training and validation losses are depicted in Figure 6 smoothed by a factor of 0.6 using an exponential moving average. Figure 7 and Figure 8 shows metrics for training and validation sets; Precision, Recall, [email protected], [email protected]:0.95.
The mounting of the camera at the specified distance of 15 mm in relation to the print bed proved to be efficient for the XY planar identification of details and defects on the printed specimens. The custom G-Code allowed the timely motion of the camera upon the regions of interest, with no adverse effect on the quality of the images captured. The defects on the test batch images were then possible to be evaluated based on (a) a manual annotation and (b) the CNN prediction model annotation.
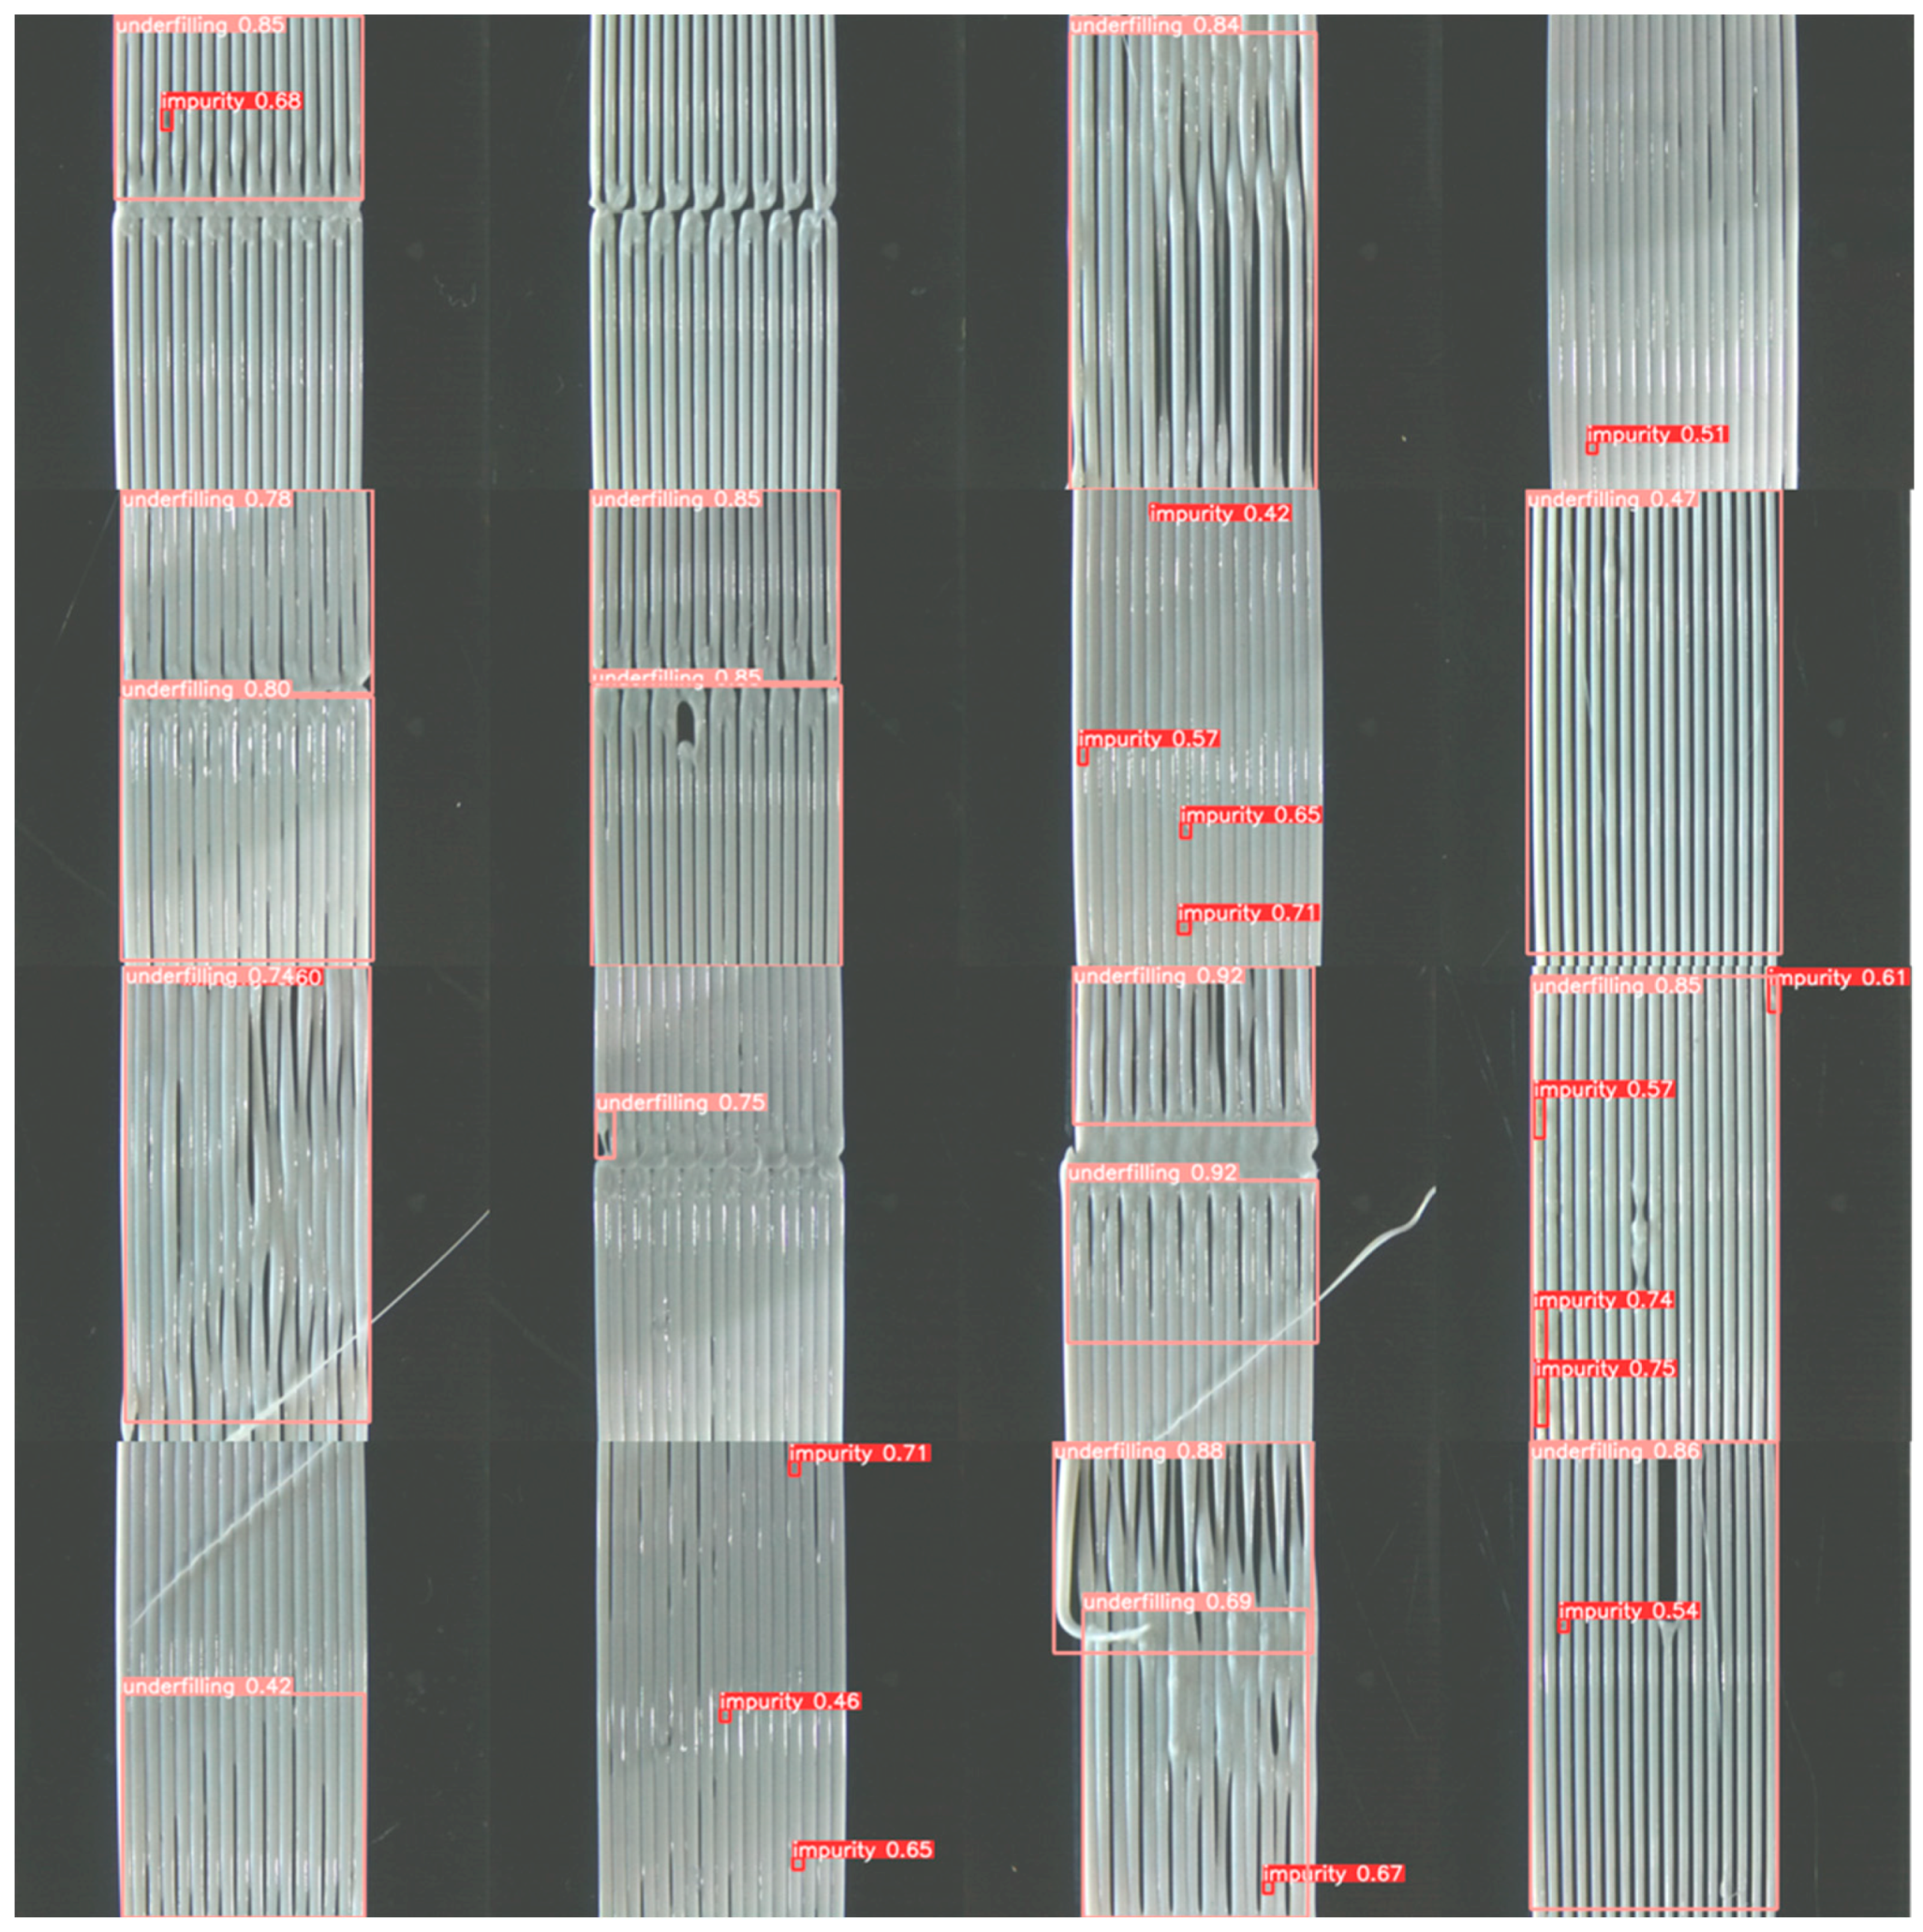
The results for a given test regarding commercial white PLA are provided in this section. Figure 9 shows the predicted defects on 16 blocks and the predictions of blocks with their confidence score produced by the model, and Table 6 shows the number of defects found within each block as well as their types (Overfill, Underfill, Impurities) compared to the annotated labels provided by domain experts. A confidence threshold of 0.4 has been chosen, after an extensive search for the optimal value, to filter the truly predicted defects for each input image. The confidence threshold is the minimum score that the model will consider the prediction to be a true prediction, otherwise, it will ignore this prediction entirely. The underfill defect can be recognized as gaps between adjacent strands, the overfill defect as peripheral material accumulation, and the impurity defect/warning as black dots on the adjacent strands or even a burned area”.
The results show that the model was successfully trained and implemented to classify and identify objects from images taken with an Arducam camera mounted on a Raise 3D Pro2 system. Figure 9 and Table 5 show that the overall mAP for the total number of the defined classes reached 82.2, while the highest mAP was achieved for the Overfilling category at 97.3. Additionally, the Underfilling category, which was the category with the most annotations (475), reached an mAP of 80. Finally, the Impurities category reached an mAP of 70.4. Overall, the model reached high mAP scores while also targeting low inference values. The model receives images one by one in inference. The performance of the model is timed to be 250 ms/image.
The printing samples tested in the presented experimental procedure were also evaluated by a team of Additive Manufacturing experts in order to quantitatively assess the model performance. The model efficiency in overfill, underfill and impurity detection was identified as sufficient since in most cases the defects identified by them were also detected from the model and labeled properly. However, the proposed methodology manages to detect defects that are enclosed in the region captured but misses the ones that are out of the camera’s field of view. Therefore, in these cases, although the expert team would recognize the defects and classify the region respectively, the model did not have adequate data to perform accordingly.

4. Conclusions and Future Work

A versatile and reliable framework for automatic defect detection in the FFF process has been presented in this work, which is enabled by AI-based computer vision. State-of-the-art deep learning models were utilized for the in-line inspection of individual thermoplastic strands’ surface morphology and weld quality, thus defining acceptable limits for FFF process parameter values. The model was inferenced on an NVIDIA Jetson Nano with an integrated GPU. The proposed methodology facilitated the process parameter selection and the early identification of critical defects, toward an overall improvement in process reliability with reduced operator intervention. The first layer adhesion of polymer materials to the print bed determines the printing quality of the part manufactured, as the immediate detection of underfills or overfills occurring during 3D printing could prevent failure of the printed parts due to inadequate adhesion to the print bed or failure of the bed surface, respectively.
Future investigations may include the implementation of Mounting Module A with the pivoting mechanism that allows for the localization of defects in various positions and angles. This essentially means that the in-line monitoring customizable tools are highly adjustable for both Cartesian and polar detection approaches. Furthermore, future optimization of the connections’ typology shall involve the replacement of the bolted connections with user-friendly plug-in mountings for time-efficient assembly–disassembly. Also, further development will be performed with regard to the model. YOLOX [17] is an anchor-free version of YOLO, with a simpler design but better performance. It aims to bridge the gap between research and the industrial communities. Finally, the conversion of the model to an ONNX model [18] will result to speed up inference on the JetSon Nano and even use CPU-based microcontrollers to reduce cost.

Author Contributions

Conceptualization, G.B., E.G., E.P.K.; methodology, G.B., V.T., E.G., A.P., A.K.; software, G.B., I.S., K.B., A.P.; validation G.B., A.P., V.T.; investigation, G.B., K.B., A.P., V.T., I.S.; writing—review and editing, G.B., V.T., A.P., K.B., E.G., A.K.; visualization, V.T., G.B.; supervision, E.P.K., A.K.; project administration, V.T., A.K., E.P.K.; funding acquisition, E.P.K., A.K. All authors have read and agreed to the published version of the manuscript.

Funding

The experimental activities presented in this paper were carried out as part of the H2020 project “iclimabuilt-Functional and advanced insulating and energy harvesting/storage materials across climate adaptive building envelopes” 560 (Grant Agreement no. 952886).

Data Availability Statement

Data available upon request.

Conflicts of Interest

The authors declare no conflict of interest.

References

  1. Butt, J.; Bhaskar, R.; Mohaghegh, V. Non-destructive and destructive testing to analyse the effects of processing parameters on the tensile and flexural properties of FFF-printed graphene-enhanced PLA. J. Compos. Sci. 2022, 6, 148. [Google Scholar] [CrossRef]
  2. Holzmond, O.; Li, X. In situ real time defect detection of 3D printed parts. Addit. Manuf. 2017, 17, 135–142, ISSN 2214-8604. [Google Scholar] [CrossRef]
  3. Shen, H.; Sun, W.; Fu, J. Multi-view online vision detection based on robot fused deposit modeling 3D printing technology. Rapid Prototyp. J. 2019, 25, 343–355. [Google Scholar] [CrossRef]
  4. Fastowicz, J.; Grudziński, M.; Tecław, M.; Okarma, K. Objective 3D Printed Surface Quality Assessment Based on Entropy of Depth Maps. Entropy 2019, 21, 97. [Google Scholar] [CrossRef] [PubMed] [Green Version]
  5. Wu, M.; Phoha, V.V.; Moon, Y.B.; Belman, A.K. Detecting malicious defects in 3D printing process using machine learning and image classification. ASME Int. Mech. Eng. Congr. Expo. Proc. 2016, 14, 4–9. [Google Scholar] [CrossRef]
  6. Khan, M.F.; Alam, A.; Siddiqui, M.A.; Alam, M.S.; Rafat, Y.; Salik, N.; Al-Saidan, I. Real-time defect detection in 3D printing using machine learning. Mater. Today Proc. 2020, 42, 521–528. [Google Scholar] [CrossRef]
  7. Goh, G.D.; Sing, S.L.; Yeong, W.Y. A review on machine learning in 3D printing: Applications, potential, and challenges. Artif. Intell. Rev. 2021, 54, 63–94. [Google Scholar] [CrossRef]
  8. Redmon, J.; Divvala, S.; Girshick, R.; Farhadi, A. You Only Look Once: Unified, Real-Time Object Detection. In Proceedings of the 2016 IEEE Conference on Computer Vision and Pattern Recognition (CVPR), Las Vegas, NV, USA, 27–30 June 2016; pp. 779–788. [Google Scholar] [CrossRef] [Green Version]
  9. Paszke, A.; Gross, S.; Massa, F.; Lerer, A.; Bradbury, J.; Chanan, G.; Killeen, T.; Lin, Z.; Gimelshein, N.; Antiga, L.; et al. PyTorch: An imperative style, high-performance deep learning library. In Advances in Neural Information Processing Systems; Wallach, H., Larochelle, H., Beygelzimer, A., d’Alché Buc, F., Fox, E., Garnett, R., Eds.; Curran Associates, Inc.: Red Hook, NY, USA, 2019; Volume 32, pp. 8024–8035. Available online: http://papers.neurips.cc/paper/9015-pytorch-an-imperative-style-high-performance-deep-learning-library.pdf (accessed on 15 May 2022).
  10. Shaqour, B.; Abuabiah, M.; Abdel-Fattah, S.; Juaidi, A.; Abdallah, R.; Abuzaina, W.; Qarout, M.; Verleije, B.; Cos, P. Gaining a better understanding of the extrusion process in fused filament fabrication 3D printing: A review. Int. J. Adv. Manuf. Technol. 2021, 114, 1279–1291. [Google Scholar] [CrossRef]
  11. Spoerk, M.; Gonzalez-Gutierrez, J.; Sapkota, J.; Schuschnigg, S.; Holzer, C. Effect of the printing bed temperature on the adhesion of parts produced by fused filament fabrication. Plast. Rubber Compos. 2018, 47, 17–24. [Google Scholar] [CrossRef]
  12. Van Rossum, G.; Drake, F.L. Python 3 Reference Manual; CreateSpace: Scotts Valley, CA, USA, 2009. [Google Scholar]
  13. LabelImg, T. Free Software: MIT License. 2015. [Google Scholar]
  14. Lin, T.Y.; Maire, M.; Belongie, S.; Bourdev, L.; Girshick, R.; Hays, J.; Perona, P.; Zitnick, C.L.; Dollár, P. Microsoft COCO: Common objects in context. In Computer Vision–ECCV 2014; Lecture Notes in Computer Science; Fleet, D., Pajdla, T., Schiele, B., Tuytelaars, T., Eds.; Springer: Cham, Switzerland, 2014; Volume 8693. [Google Scholar] [CrossRef] [Green Version]
  15. Snoek, J.; Larochelle, H.; Adams, R.P. Practical bayesian optimization of machine learning algorithms. arXiv 2012. [Google Scholar] [CrossRef]
  16. Biewald, L. Experiment Tracking with Weights and Biases. 2020. Available online: https://www.wandb.com/ (accessed on 20 May 2022).
  17. Ge, Z.; Liu, S.; Wang, F.; Li, Z.; Sun, J. YOLOX: Exceeding YOLO series in 2021. arXiv 2021. [Google Scholar] [CrossRef]
  18. Bai, J.; Lu, F.; Zhang, K. ONNX: Open neural network exchange. In GitHub Repository; GitHub: San Francisco, CA, USA, 2019; Available online: https://github.com/onnx/onnx (accessed on 20 May 2022).
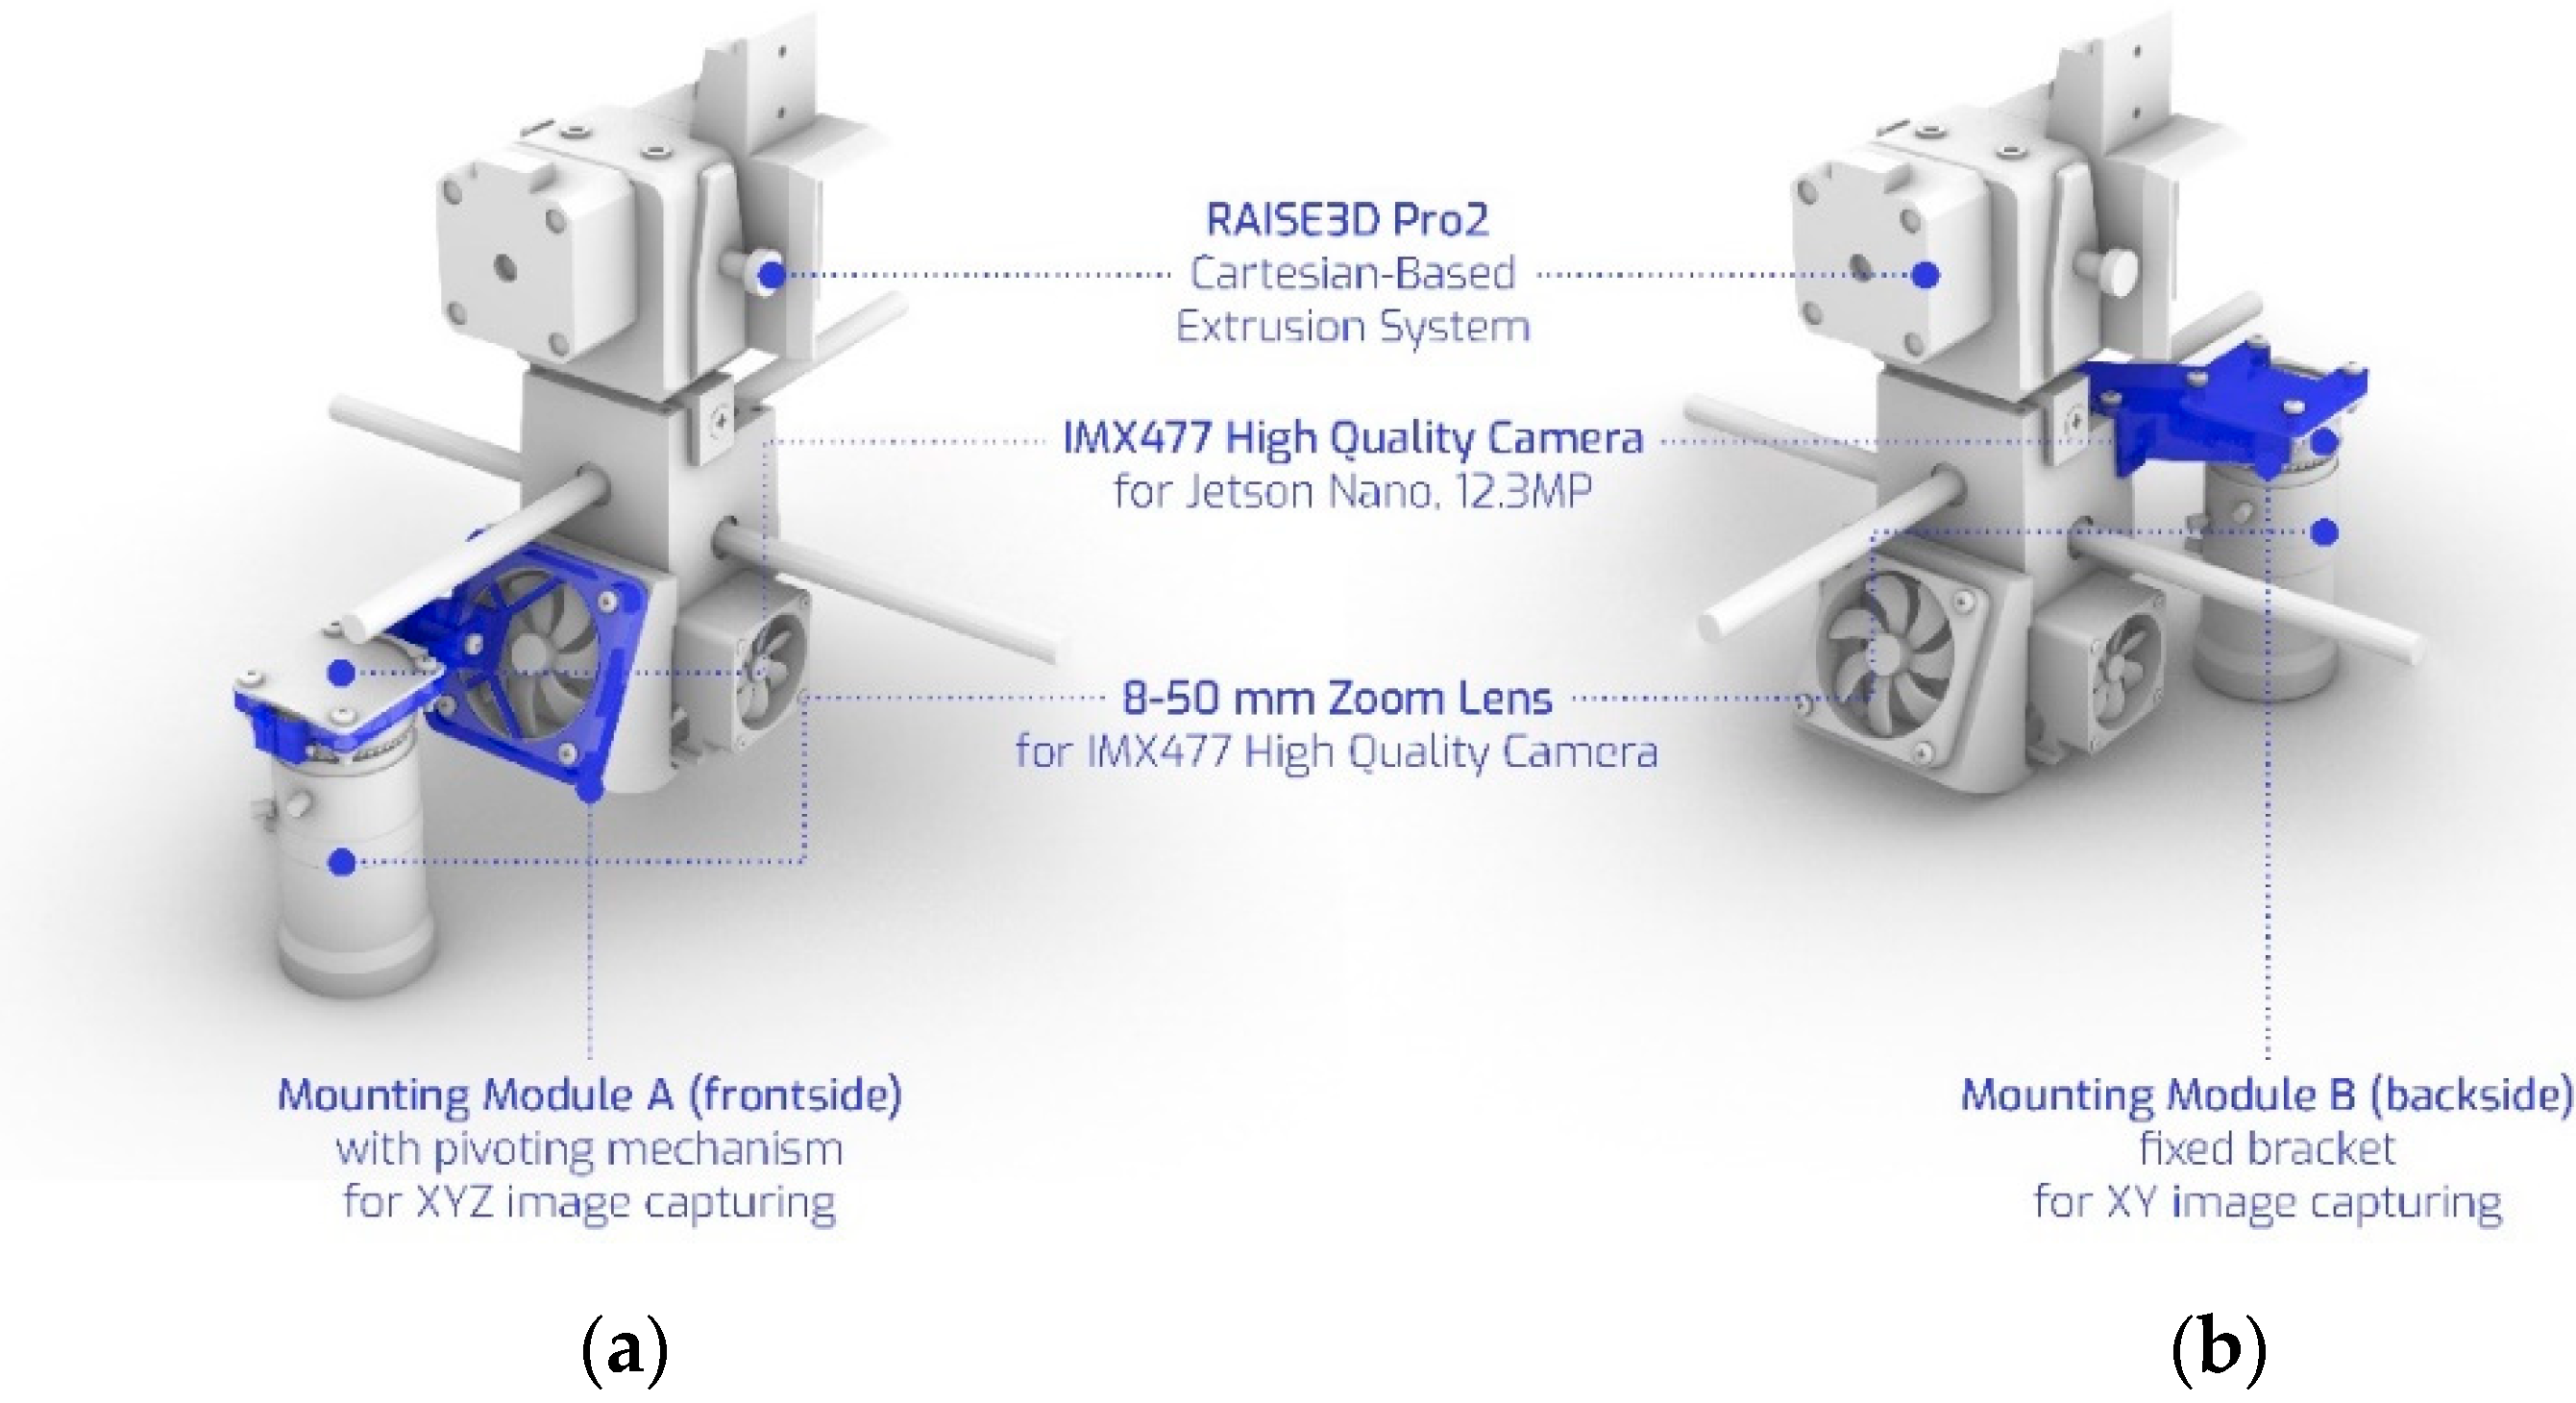
Figure 1. Design of customizable tools for detection (i.e., image capturing) devices integration: (a) Mounting Module A (frontside) with pivoting mechanism for XYZ image capturing; (b) Mounting Module B (backside) fixed bracket for XY image capturing. (c) Mounting Module A rotating on XZ plane and around the offset Y axis set on the bolted pivoting mechanism; (d) Mounting Module B fixed perpendicular to the XY plane.
Processes 10 02147 g001aProcesses 10 02147 g001b
Figure 2. Integration of 3D-printed customizable tools and hardware for detection (i.e., image capturing): (a) Mounting Module A (frontside); (b) Mounting Module B (backside).
Processes 10 02147 g002
Figure 3. Display of the printing tests: (a) The first test with 28 variants of printing speed vs. thermoplastic strand height; (b) The second test with 7 values of strand width.
Processes 10 02147 g003
Figure 4. Methodology for image capturing of regions of interest: (a) overview of custom G-code motion and pauses; (b) central regions of interest; (c) boundary edge regions of interest.
Processes 10 02147 g004aProcesses 10 02147 g004b
Figure 5. Specimen Grid and file name convention for Test 1 (a) and Test 2 (b).
Processes 10 02147 g005
Figure 6. Train and validation loss.
Processes 10 02147 g006
Figure 7. Metrics for training and validation sets; Precision, Recall, [email protected], [email protected]:0.95.
Processes 10 02147 g007
Figure 8. (a) Confusion matrix, (b) Precision vs. Recall Curve.
Processes 10 02147 g008
Figure 9. Predicted (up) defects on 16 blocks of interest, (down) defects on three blocks of interest.
Processes 10 02147 g009aProcesses 10 02147 g009b
Table 1. Number of annotated objects from training set images.
Defect TypeAnnotated Bounding Boxes
Underfill475
Overfill178
Impurity154
Table 2. Optimized model configuration attributes.
CategoryValueDescription
epochs100total epochs of training
batch_size64total batch size for all GPUs
imgsz640train, val image size (pixels)
optimizerSGDoptimizer function
lr00.03826initial learning rate
momentum0.65250SGD momentum
weight_decay0.00009optimizer weight decay 5   × 10 4
warmup_epochs3.0warmup epochs (fractions ok)
warmup_momentum0.8warmup initial momentum
warmup_bias_lr0.8warmup initial bias lr
box0.05box loss gain
cls0.5cls loss gain
cls_pw1.0cls BCELoss positive_weight
obj1.0obj loss gain (scale with pixels)
obj_pw1.0obj BCELoss positive_weight
iou_t0.4436IoU training threshold
anchor_t7.538anchor-multiple threshold
f1_gamma0.0focal loss gamma (efficientDet default gamma = 1.5)
hsv_h0.015image HSV-Hue augmentation (fraction)
hsv_s0.7image HSV-Saturation augmentation (fraction)
hsv_v0.4image HSV-Value augmentation (fraction)
fliplr0.5image flip left-right (probability)
Table 3. Display defect number–type mapping.
Display Defect NumberDefect Type
0Impurity
1Underfill
2Overfill
Table 4. Losses of the defined model.
Loss TypeTrain ValueValidation Value
Box Loss0.0370.046
Object Loss0.0180.012
Class Loss0.0030.002
Table 5. Validation mAP on different classes.
DatasetmAP (%)
Overall82
Impurity70
Overfill97
Underfill80
Table 6. Result table that outlines defects and their relative position on the x-y grid.
FilenameLabelxywh
1040_(1)_PLA_WHITE_a2.png00.2708330.3847220.01944440.0277778
1040_(1)_PLA_WHITE_a2.png10.4604170.4909720.5180560.981944
1040_(1)_PLA_WHITE_c23.png10.4770830.7055560.5236110.588889
1040_(1)_PLA_WHITE_c23.png10.4736110.2020830.5194440.404167
1040_(1)_PLA_WHITE_f1.png00.4951390.5743060.02083330.0263889
1040_(1)_PLA_WHITE_f1.png00.6486110.8861110.02222220.025
1040_(1)_PLA_WHITE_f1.png00.6409720.05555560.02083330.0305556
1040_(1)_PLA_WHITE_f34.png10.2486110.3527780.03888890.1
1040_(1)_PLA_WHITE_g4.png00.3270830.9118060.02083330.0236111
1040_(2)_PLA_WHITE_a4.png10.4611110.4868060.5333330.973611
1040_(2)_PLA_WHITE_f34.png10.4909720.2138890.5263890.427778
1040_(2)_PLA_WHITE_f34.png10.4909720.7111110.5291670.552778
1041_(1)_PLA_WHITE_a2.png00.2166670.3180560.02222220.0861111
1041_(1)_PLA_WHITE_a2.png00.7104170.050.02361110.0916667
1041_(1)_PLA_WHITE_a2.png00.2180560.7736110.02777780.111111
1041_(1)_PLA_WHITE_a2.png00.2222220.9145830.0250.104167
1041_(1)_PLA_WHITE_a2.png10.4597220.5104170.5166670.979167
1041_(1)_PLA_WHITE_b12.png00.3222220.2208330.02222220.0444444
1041_(1)_PLA_WHITE_b12.png10.4736110.1958330.5194440.386111
1041_(1)_PLA_WHITE_c4.png10.4770830.5194440.5152780.961111
1041_(1)_PLA_WHITE_d2.png10.4833330.7645830.5083330.470833
1041_(1)_PLA_WHITE_d23.png10.4895830.6208330.5236110.341667
1041_(1)_PLA_WHITE_d23.png10.4916670.1659720.5027780.331944
1041_(1)_PLA_WHITE_d4.png00.6388890.9361110.01944440.025
1041_(1)_PLA_WHITE_d4.png10.4861110.6756940.4722220.648611
1041_(1)_PLA_WHITE_d4.png10.4604170.2215280.5430560.443056
1041_(1)_PLA_WHITE_e1.png00.3958330.04166670.01666670.0222222
1041_(1)_PLA_WHITE_e1.png00.2465280.5576390.01805560.0375
1041_(1)_PLA_WHITE_e1.png00.4618060.7145830.02083330.0319444
1041_(1)_PLA_WHITE_e1.png00.4583330.9180560.0250.0277778
1041_(1)_PLA_WHITE_e3.png00.3652780.01805560.02222220.0277778
1041_(1)_PLA_WHITE_e3.png10.4916670.4791670.5138890.958333
Publisher’s Note: MDPI stays neutral with regard to jurisdictional claims in published maps and institutional affiliations.