
Emerging PAT for Freeze-Drying Processes for Advanced Process Control


Abstract
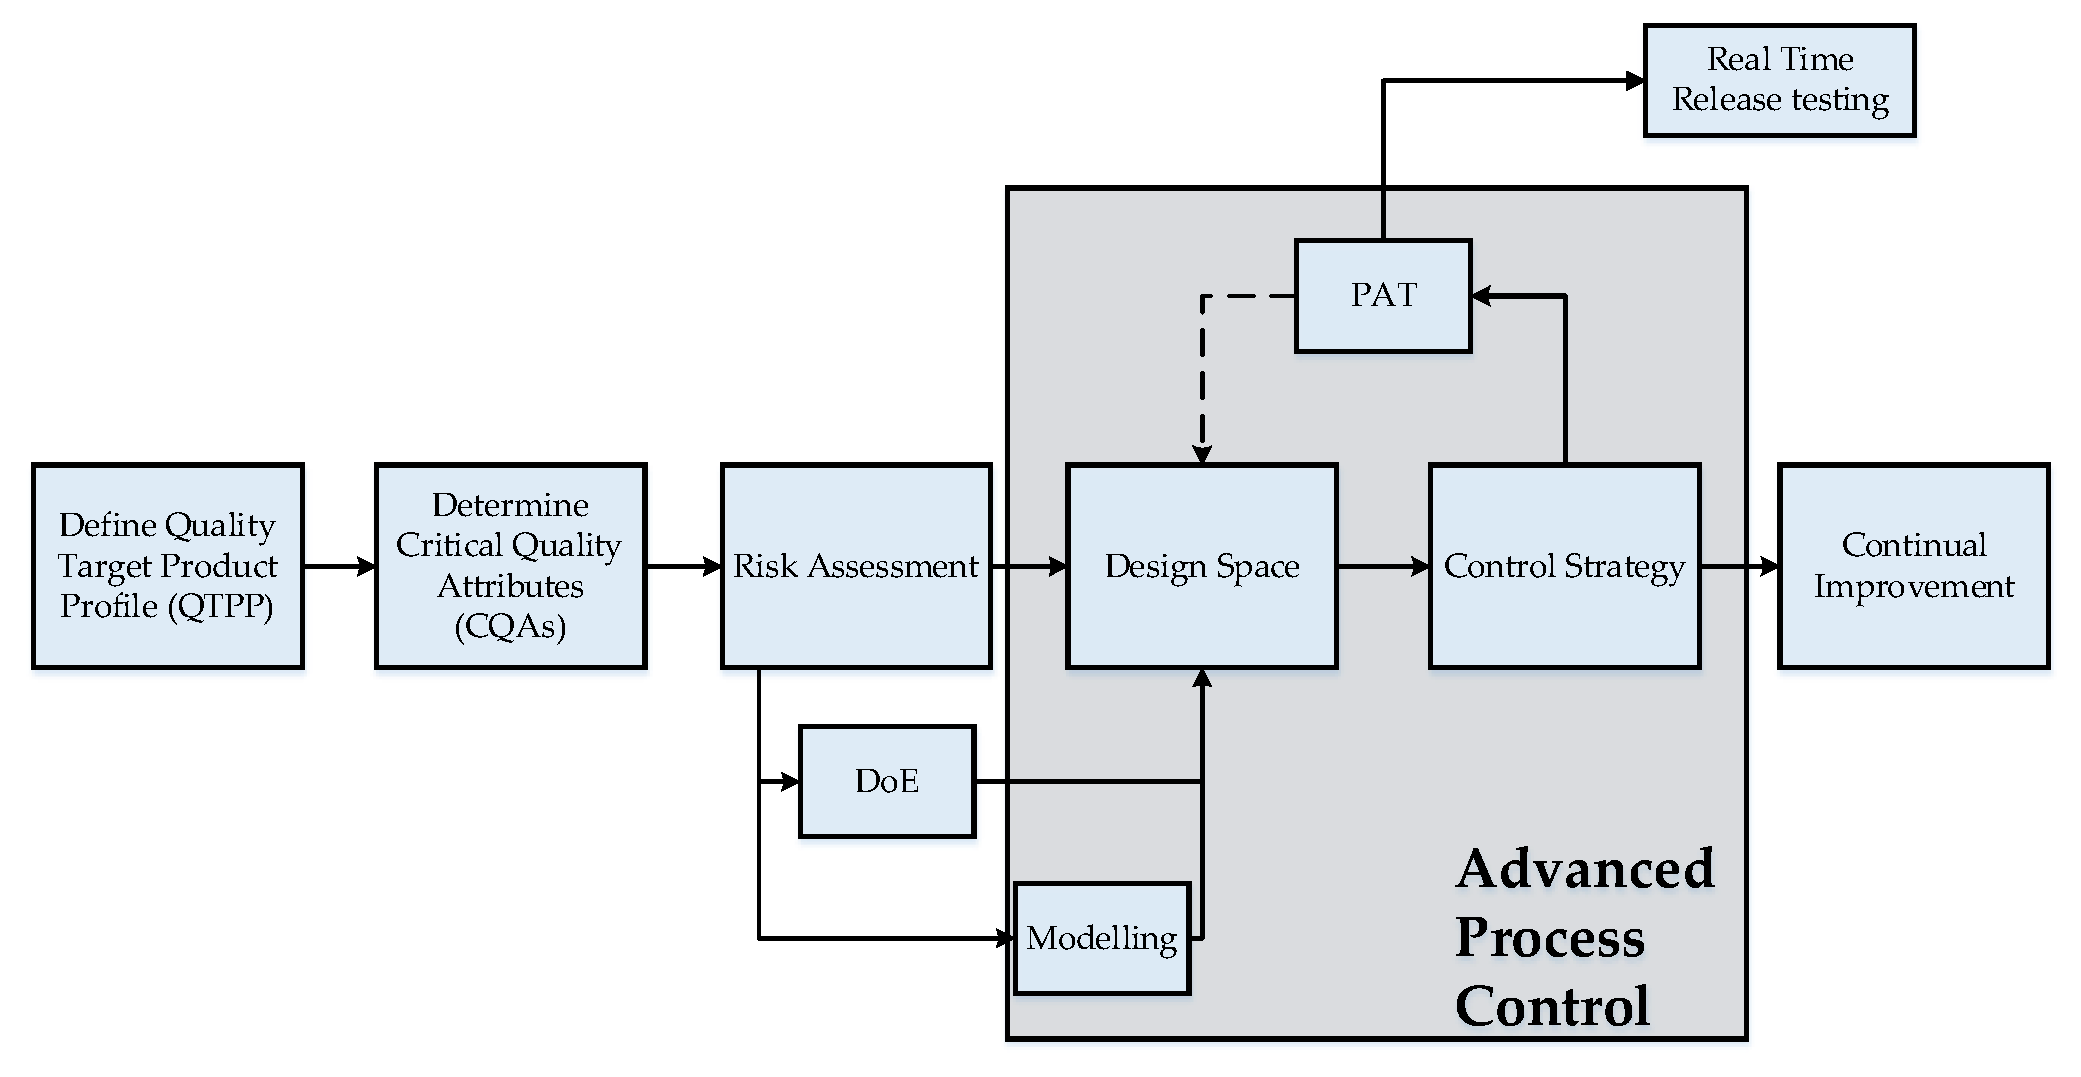
1. Introduction
2. Process Analytical Technology for Lyophilization
2.1. Single Vial PAT
2.2. Batch PAT
3. Materials and Methods
3.1. Product Mixture and Instruments
3.2. Freeze Drying Experiments
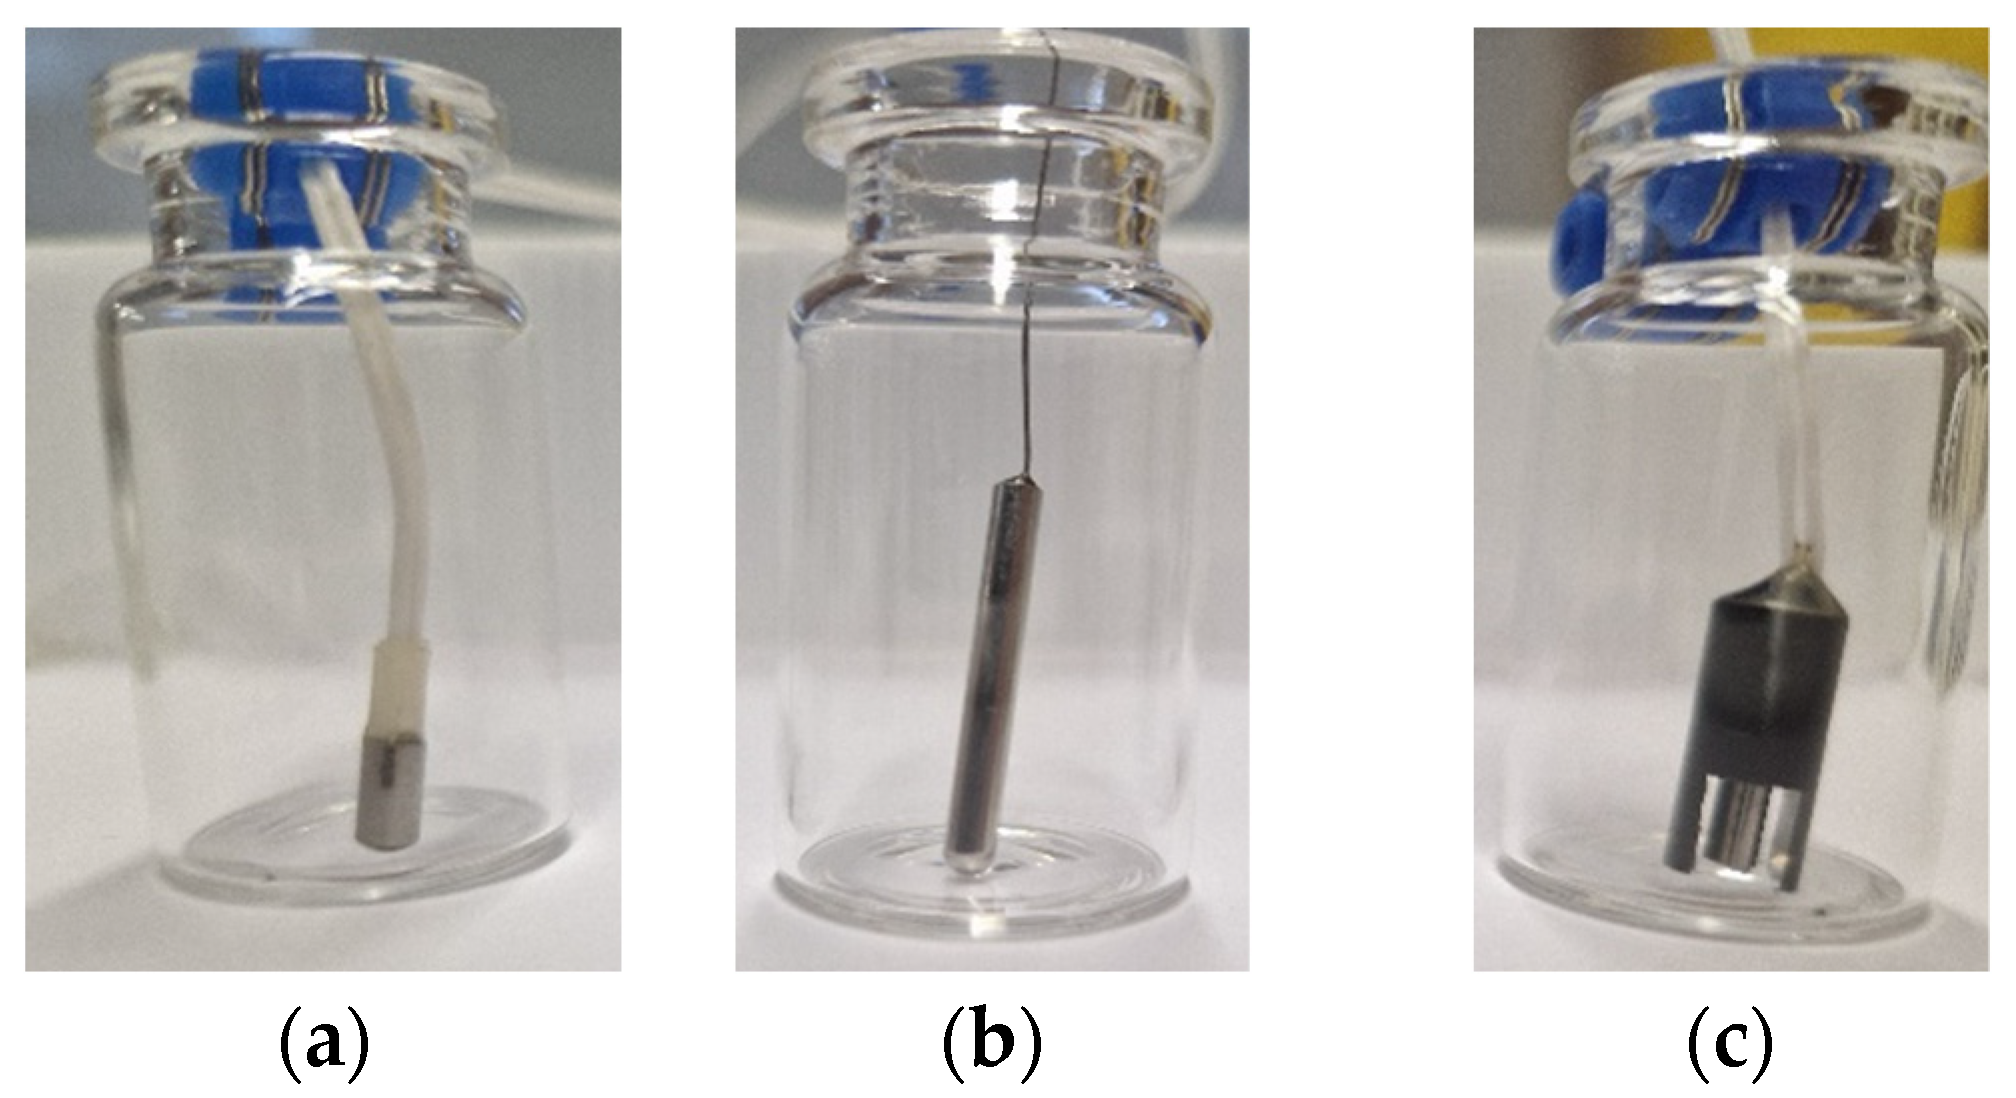
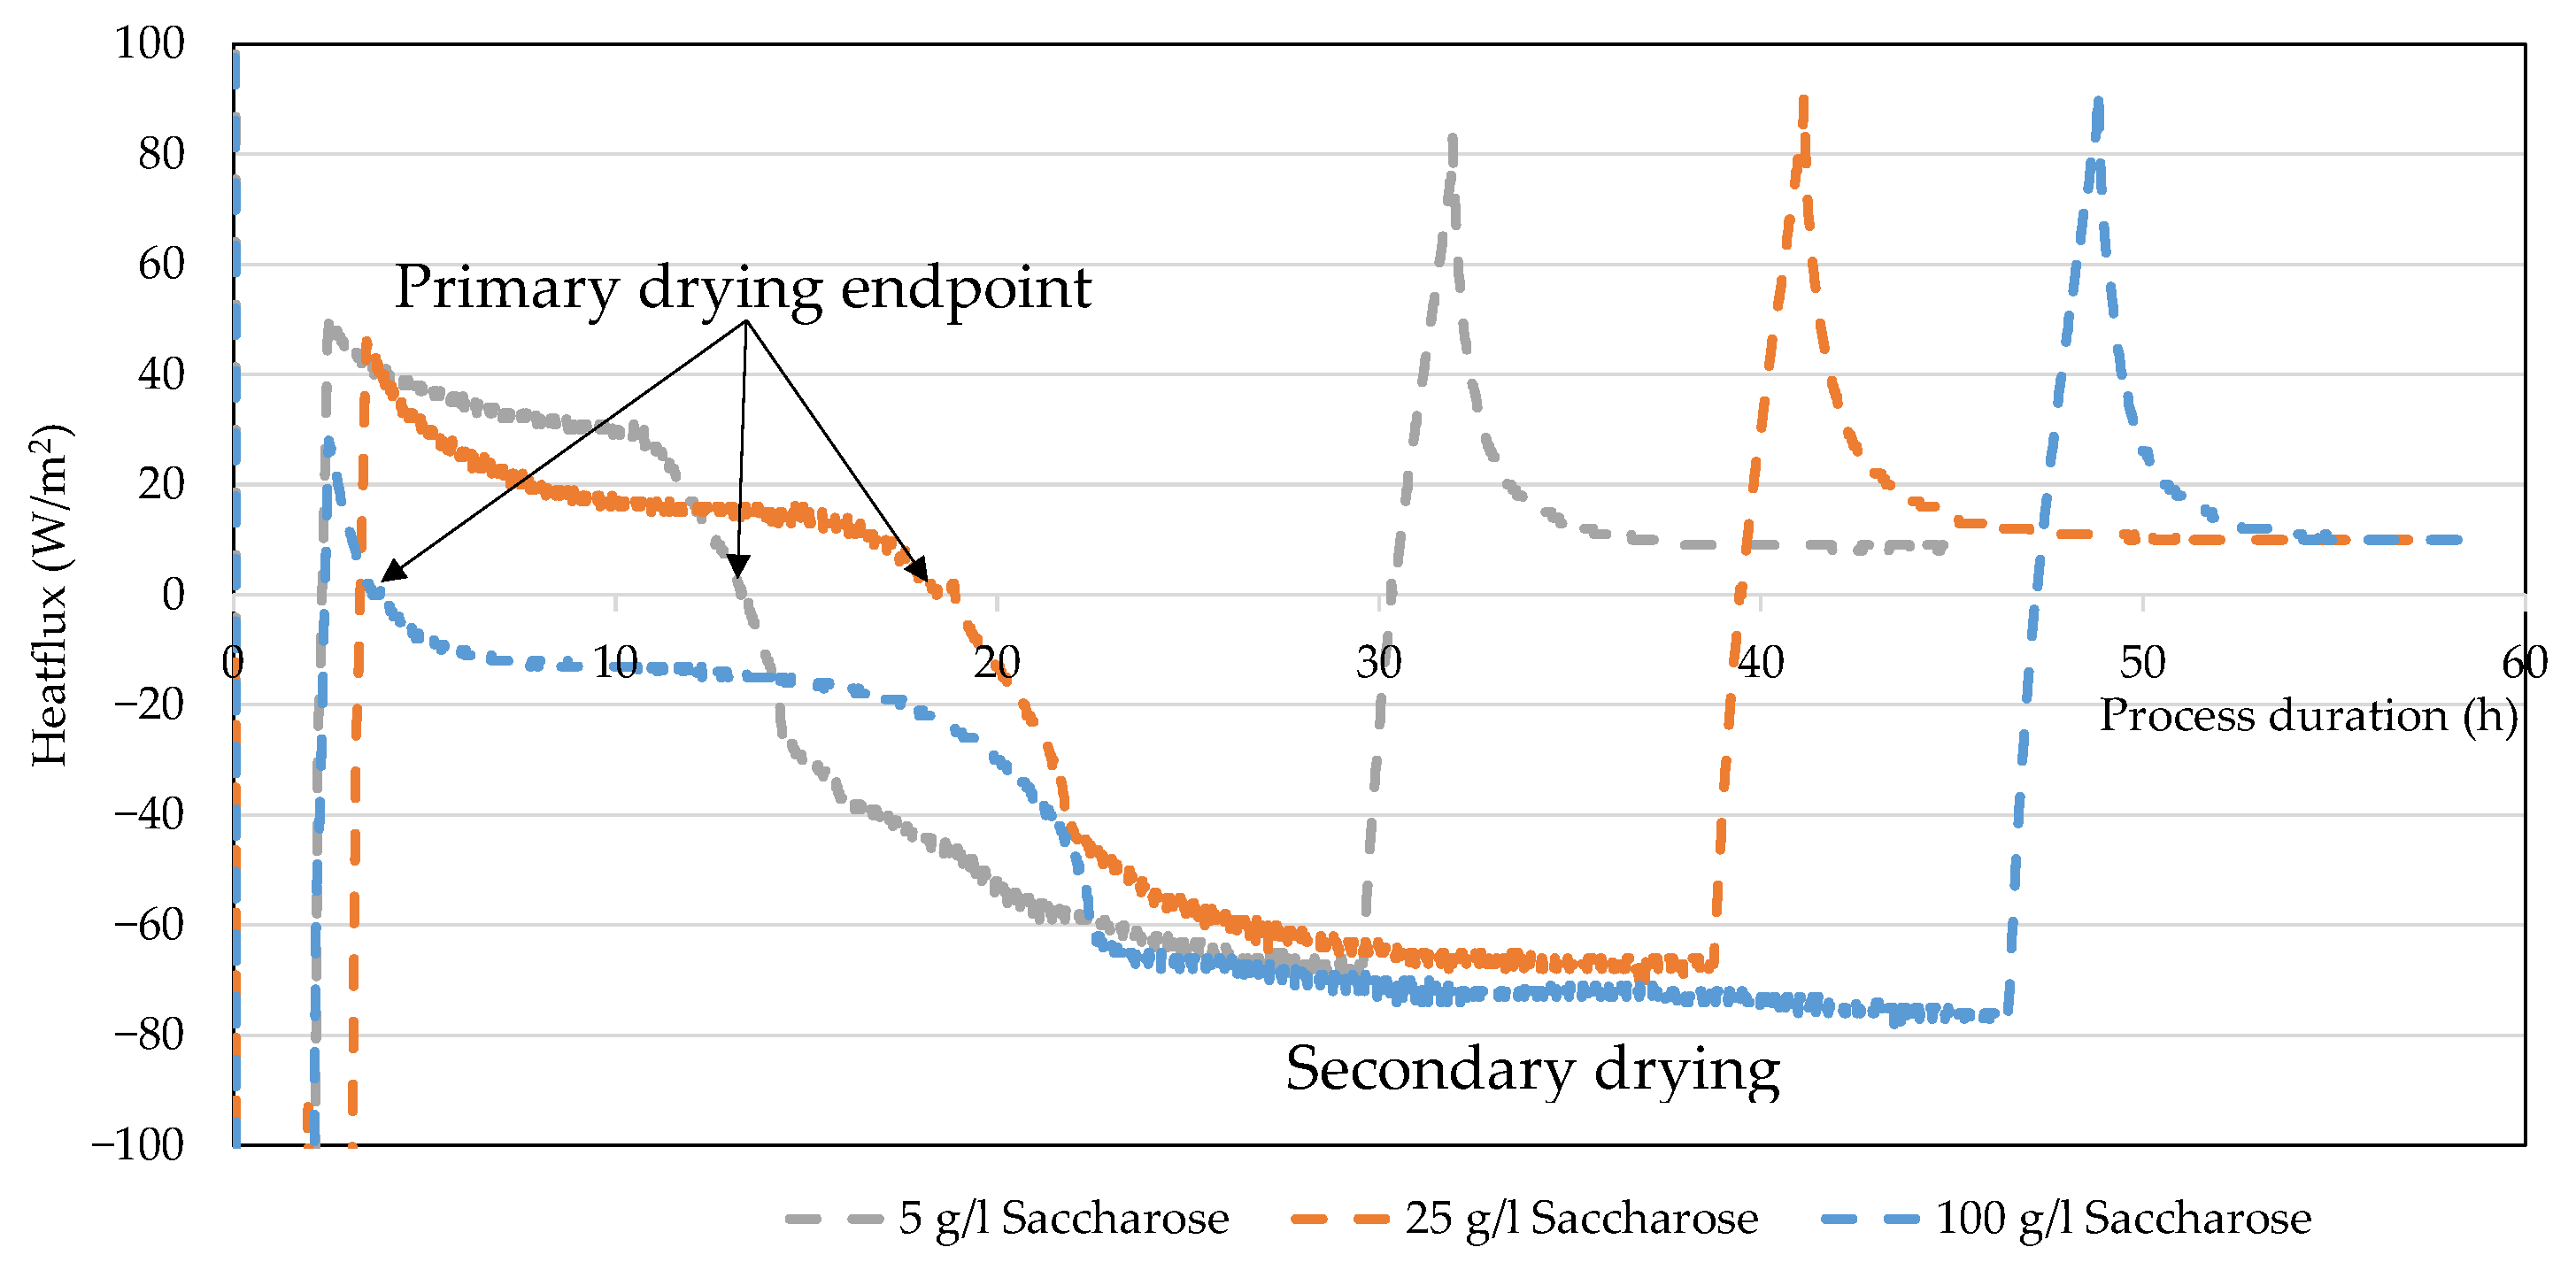
3.3. Heat Flux Sensor
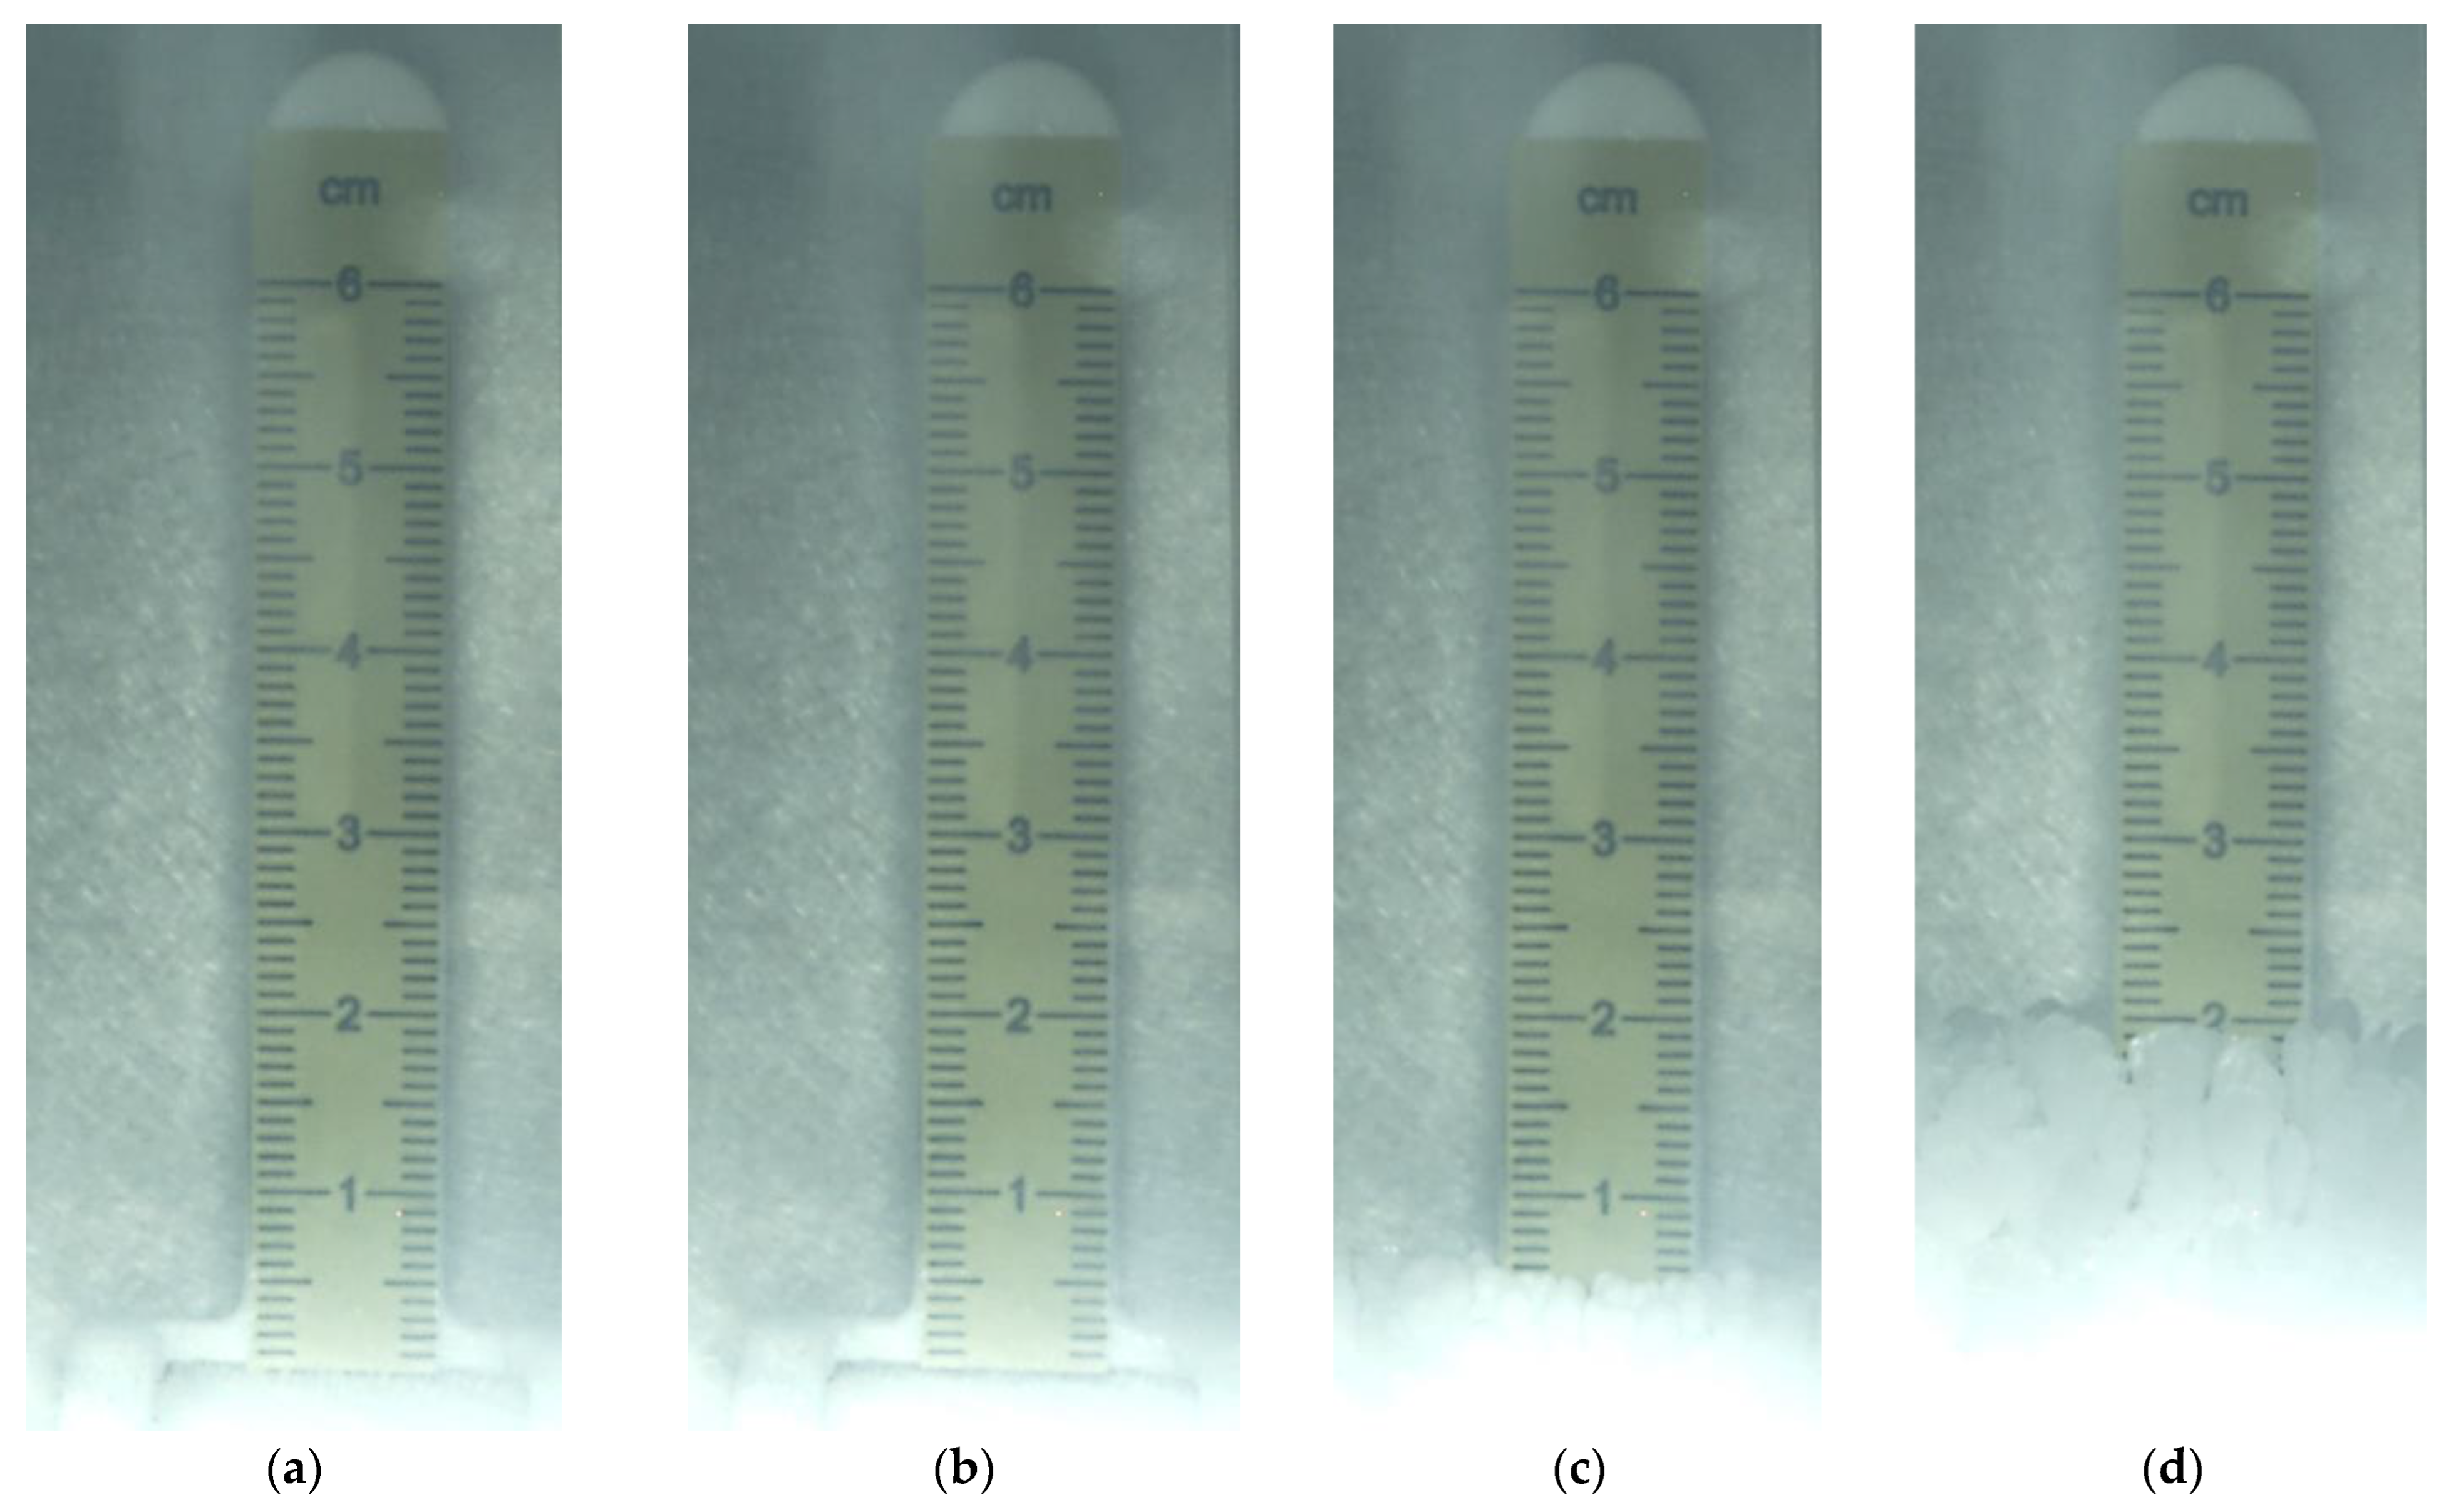
3.4. Ice Ruler
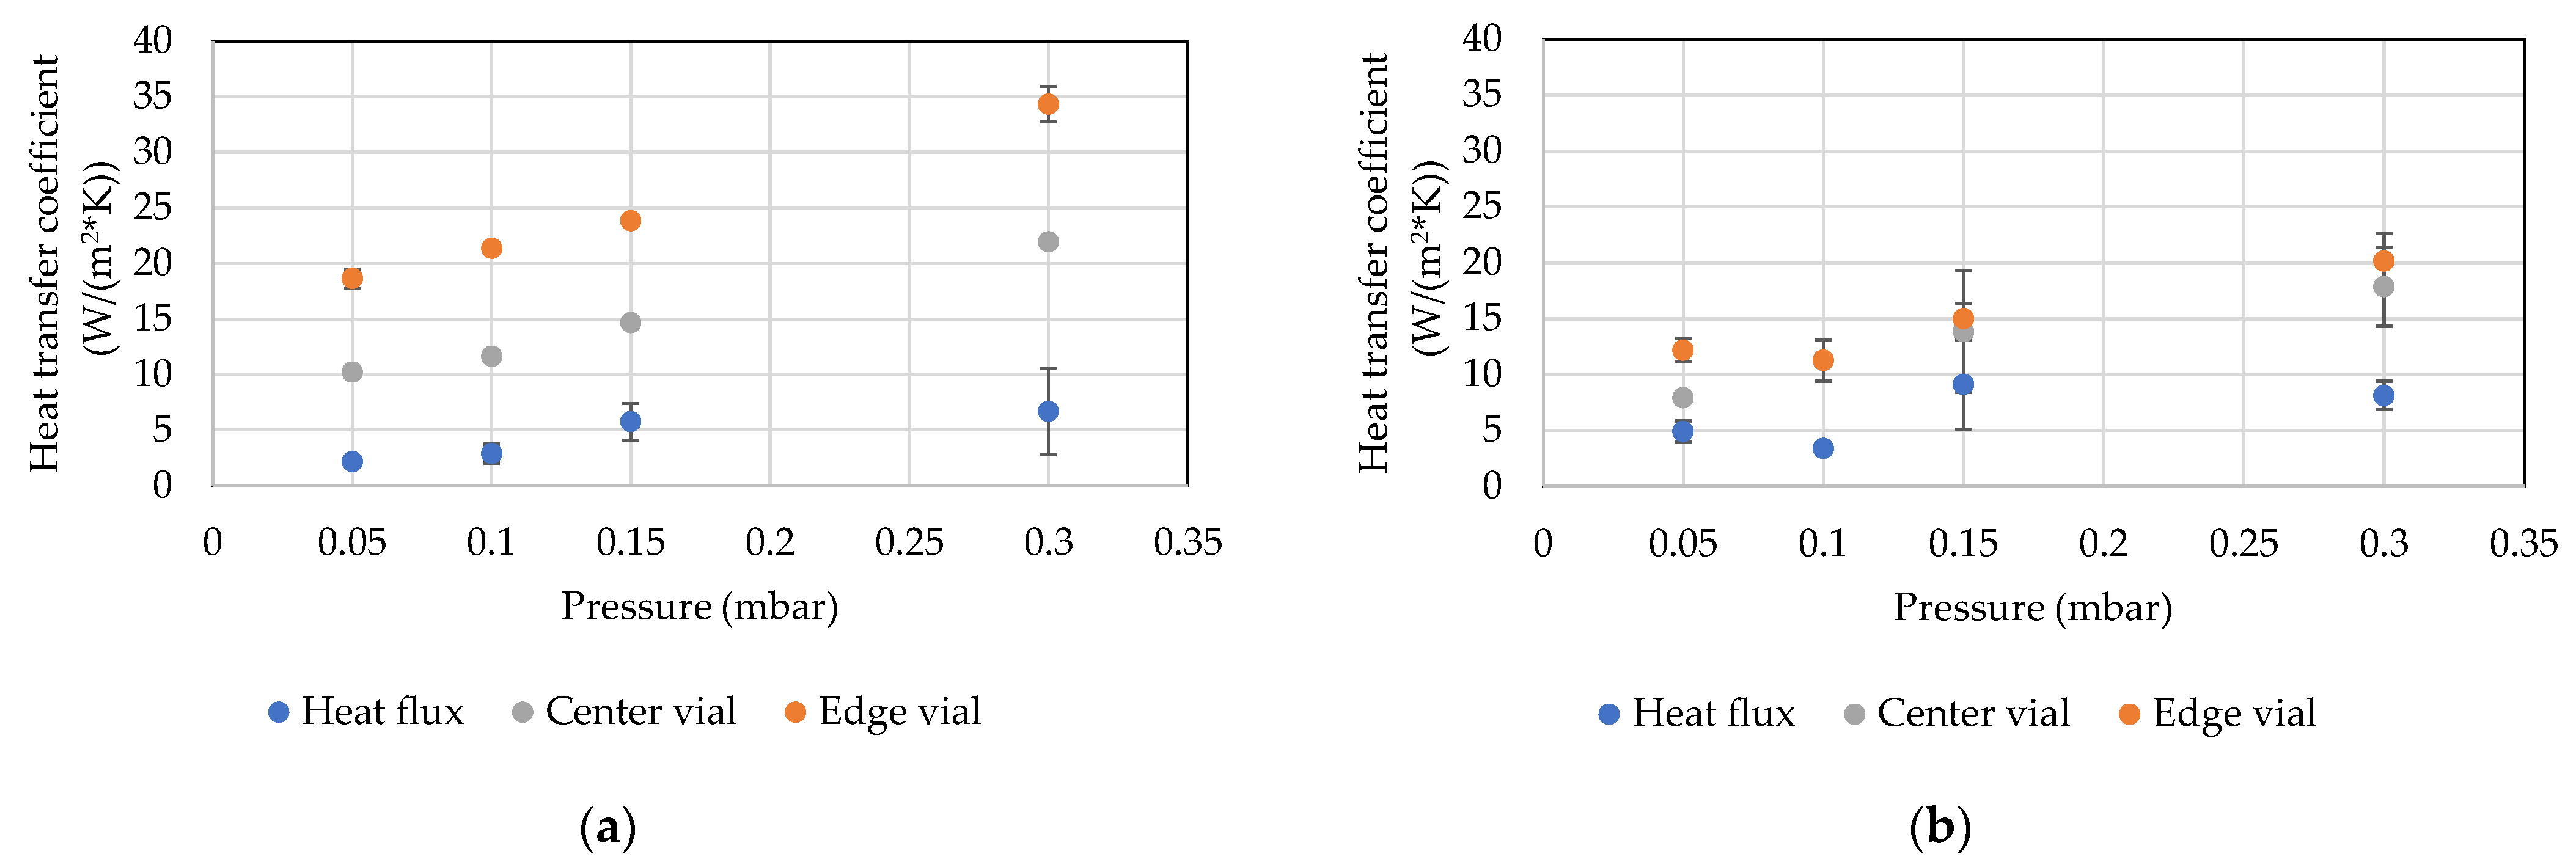
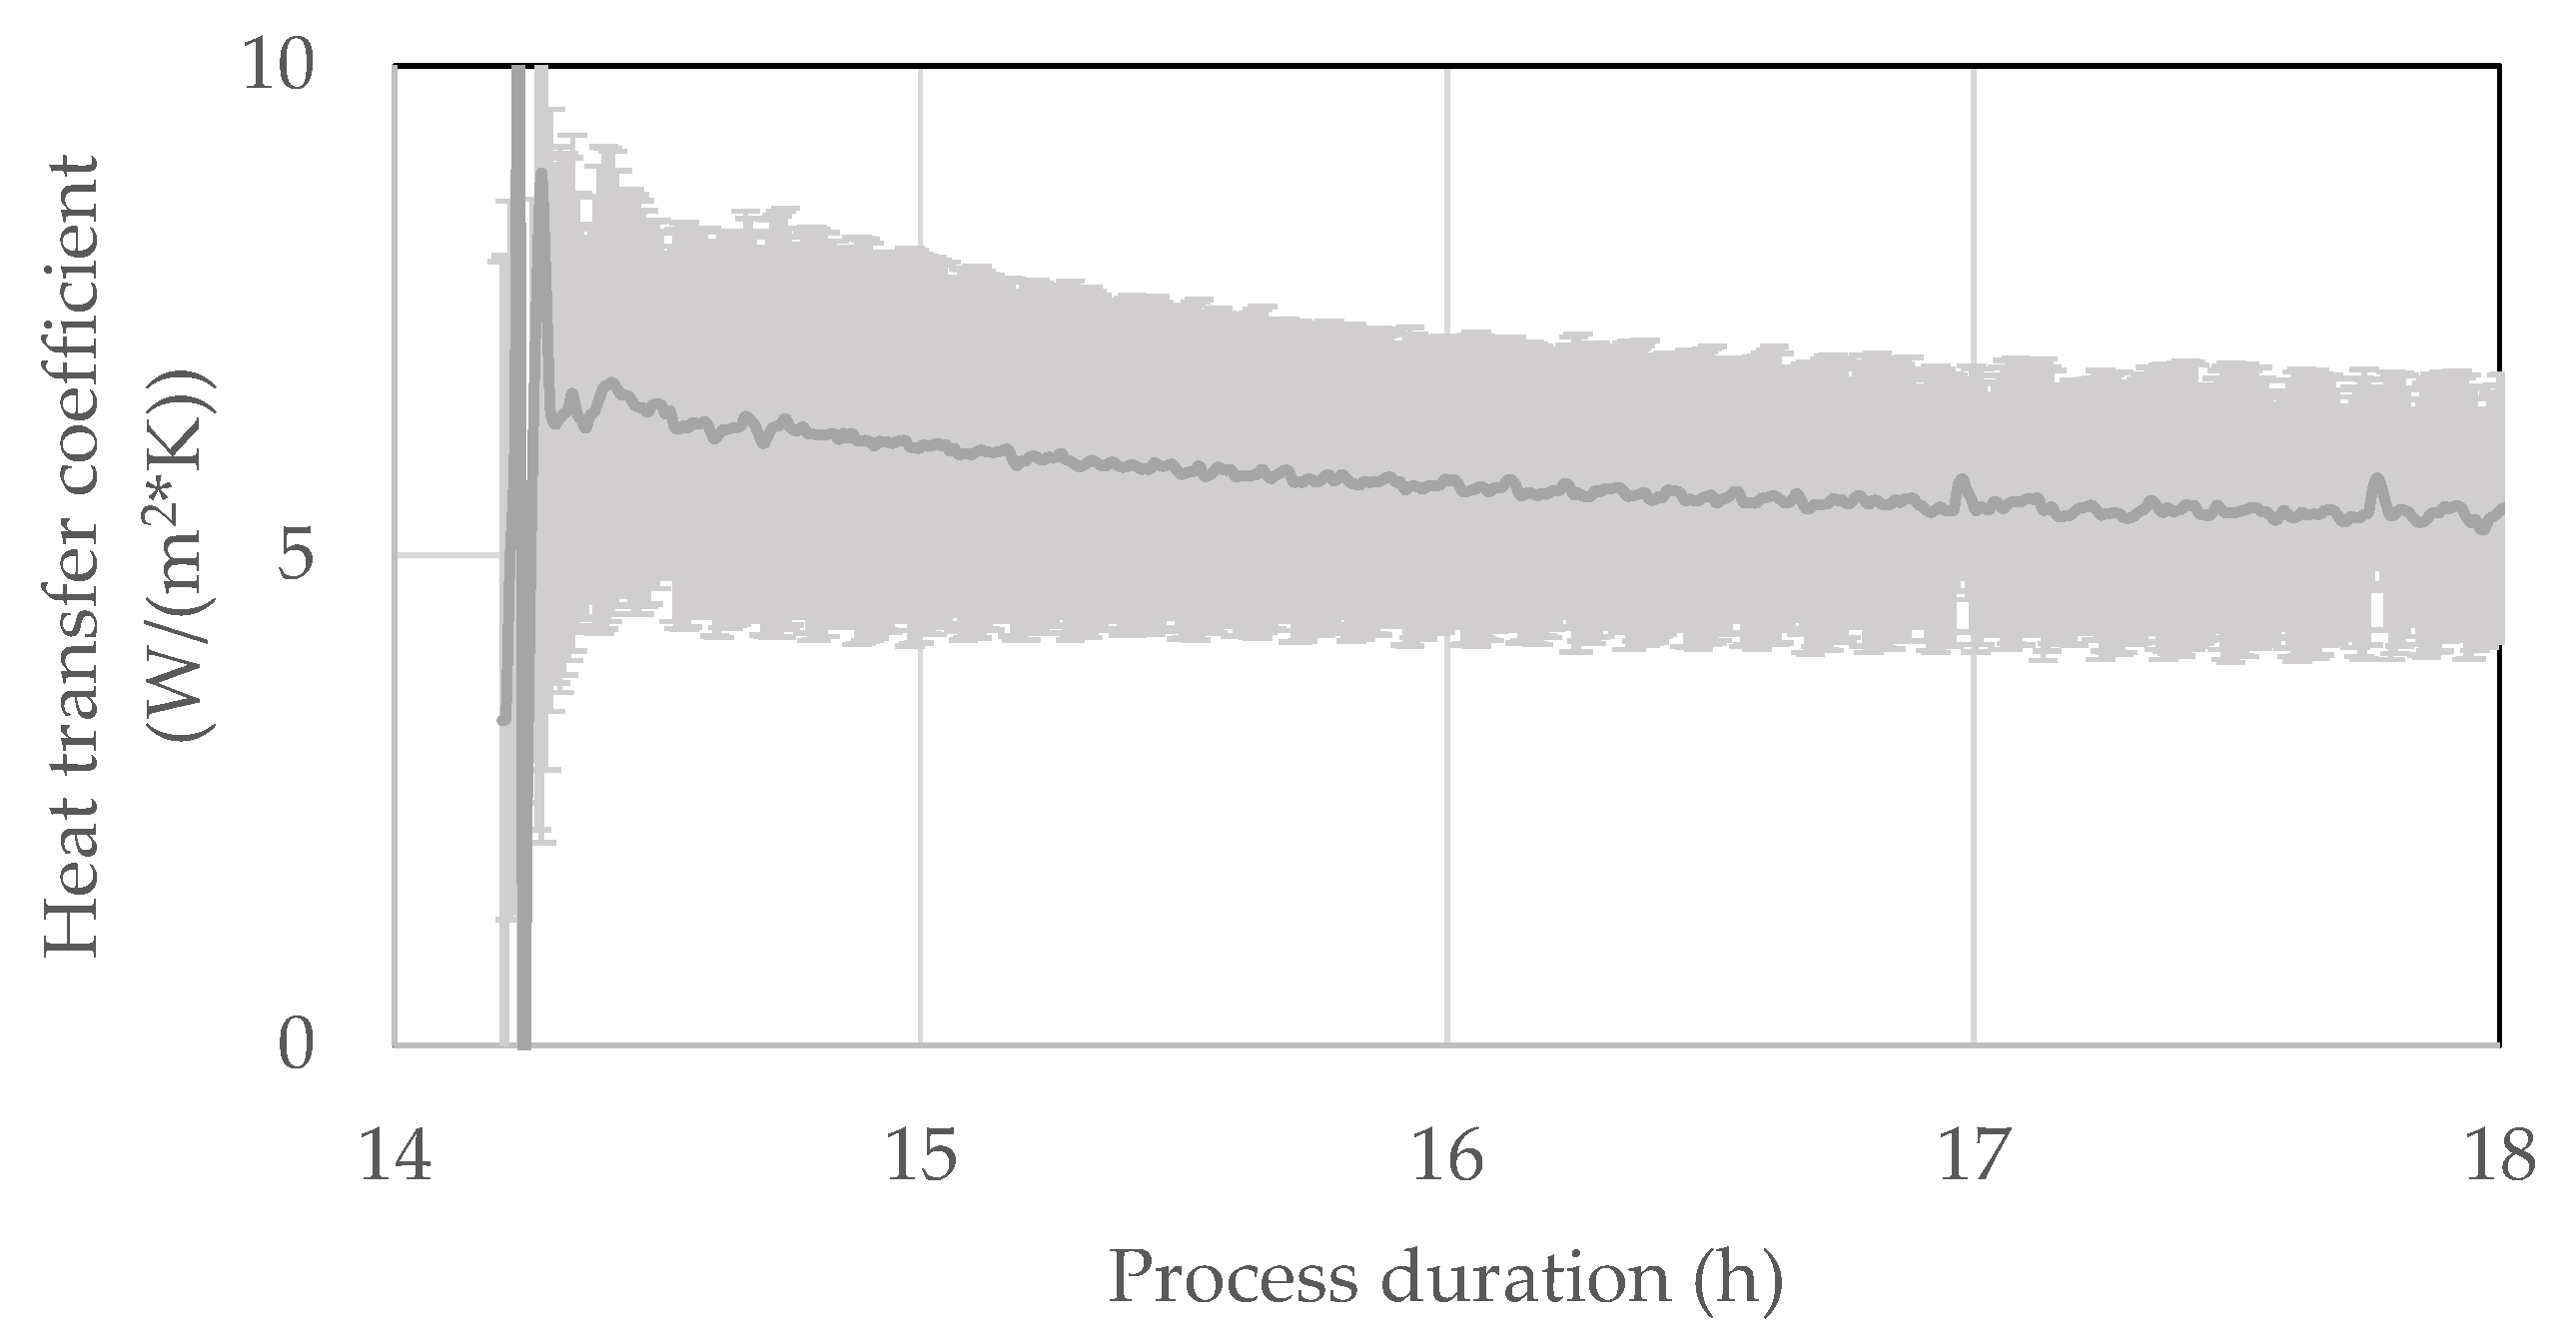
3.5. Vial Heat Transfer
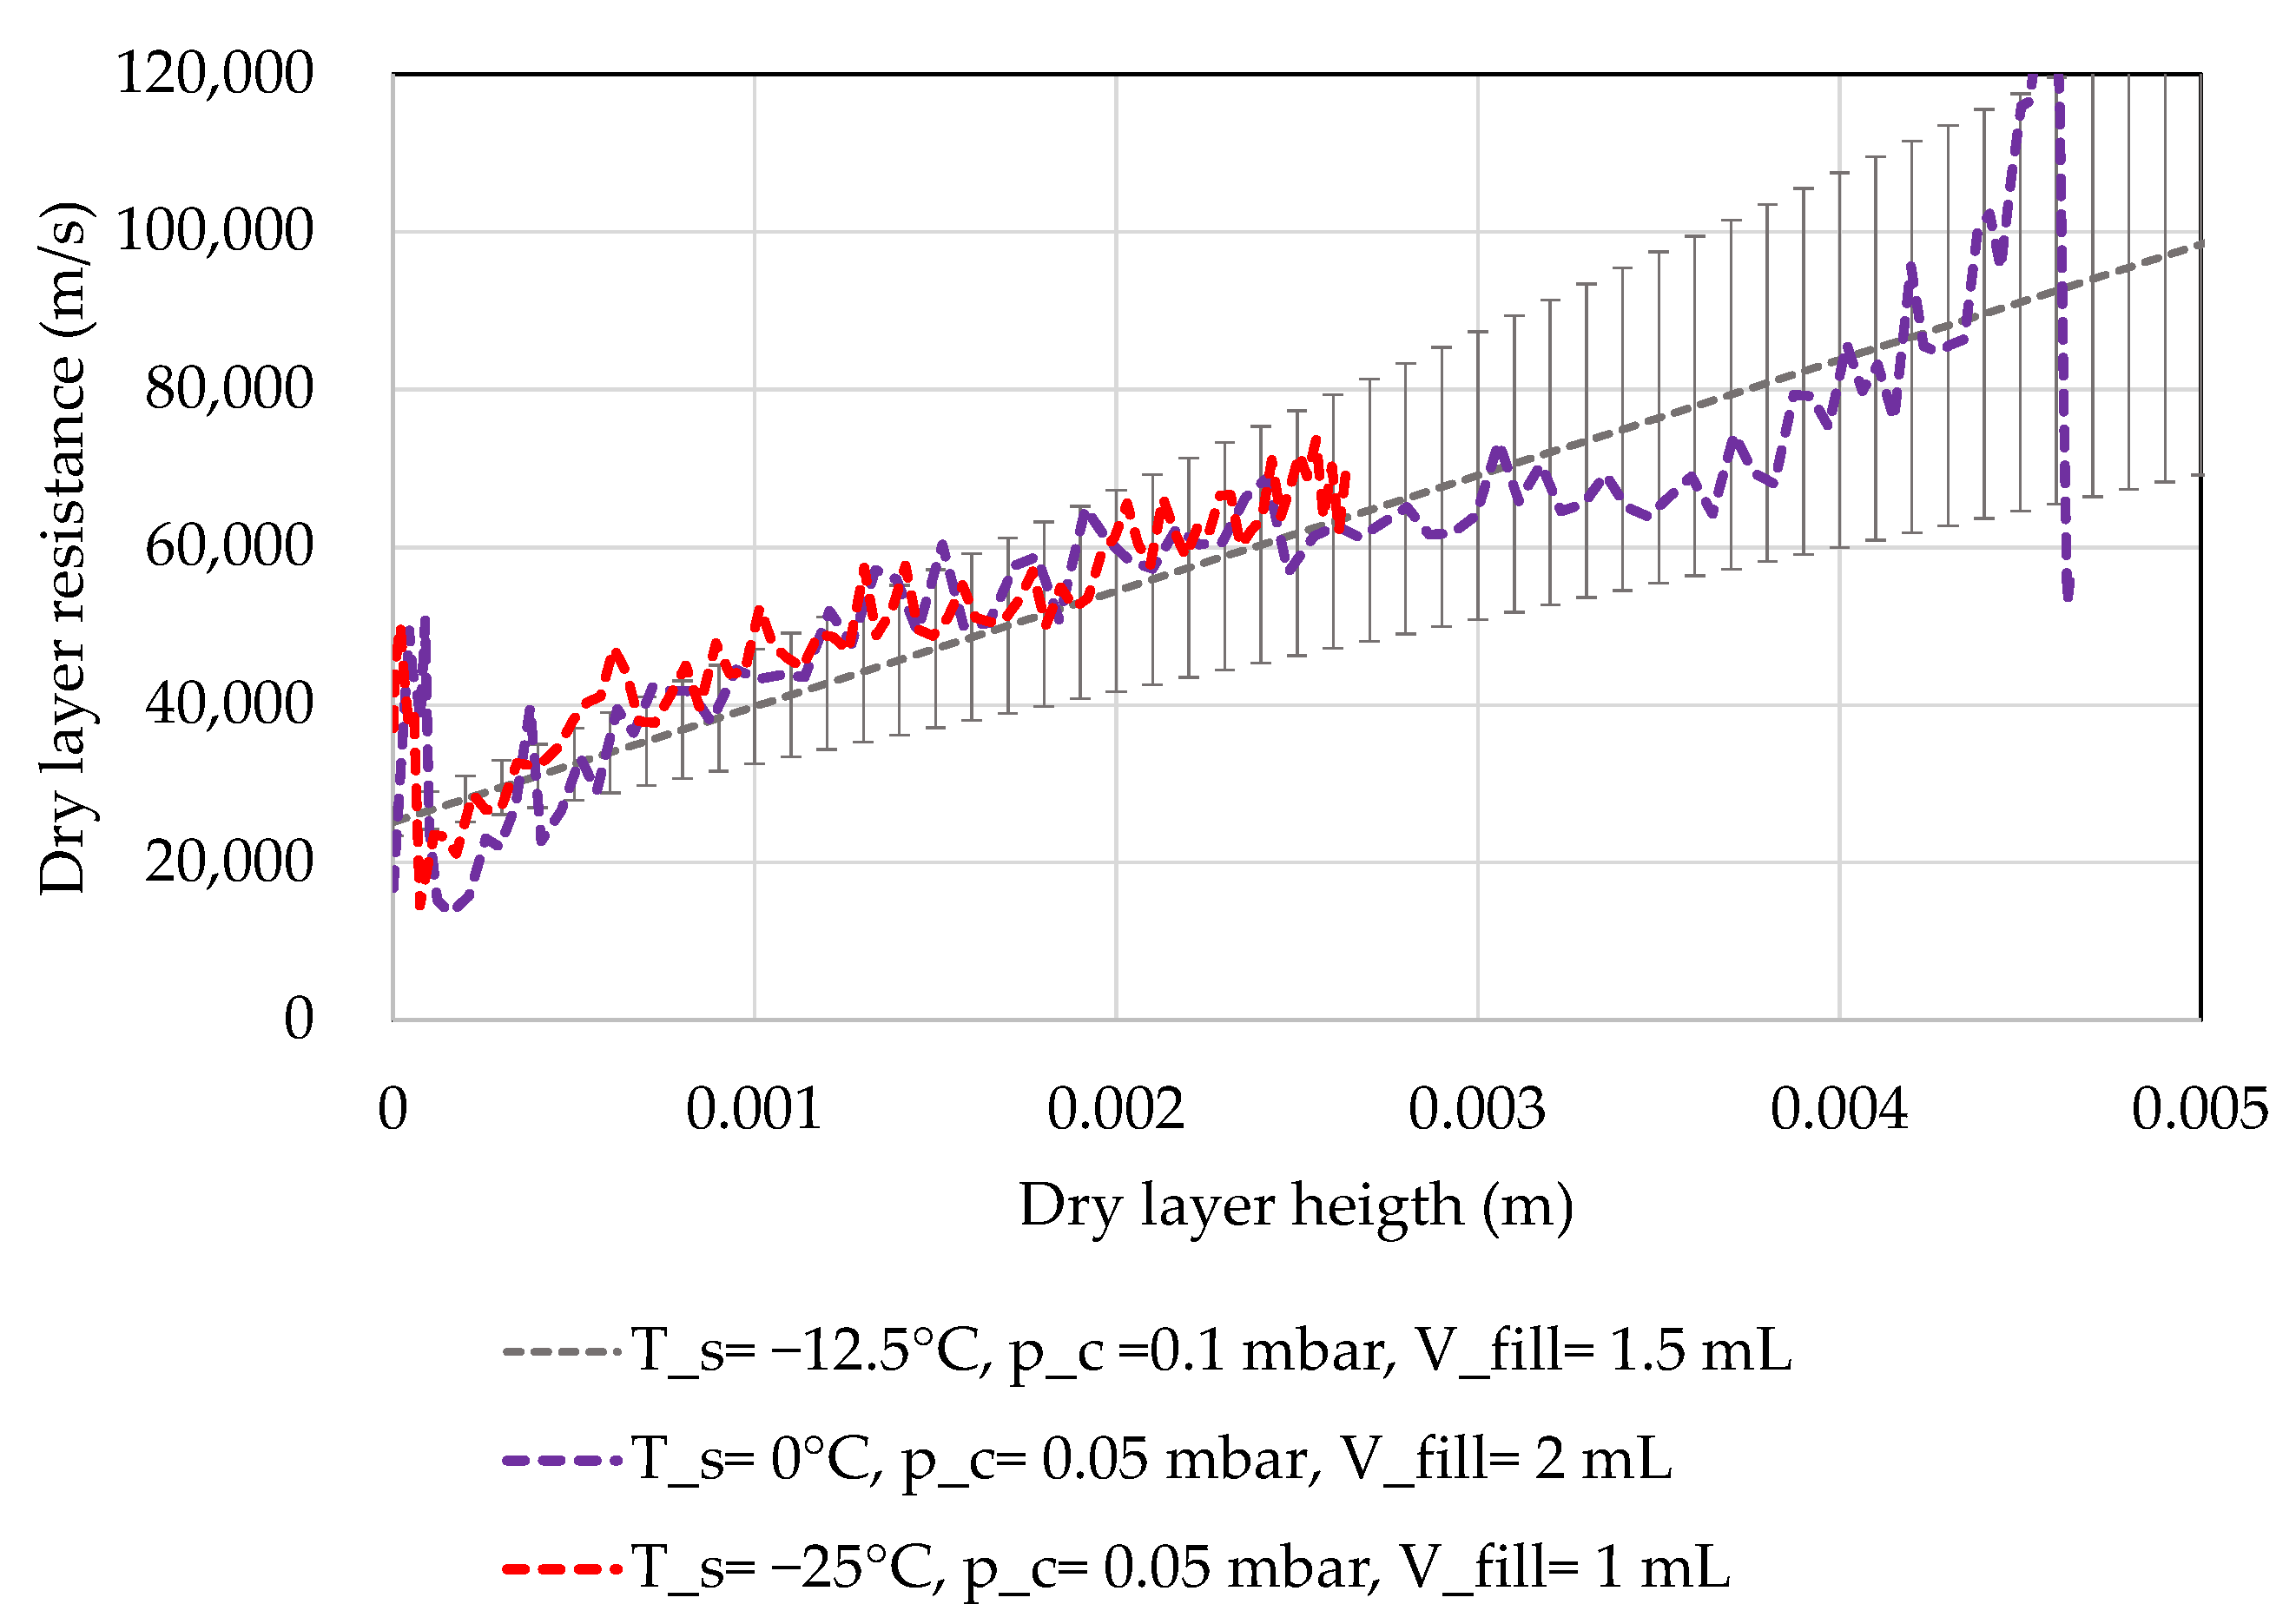
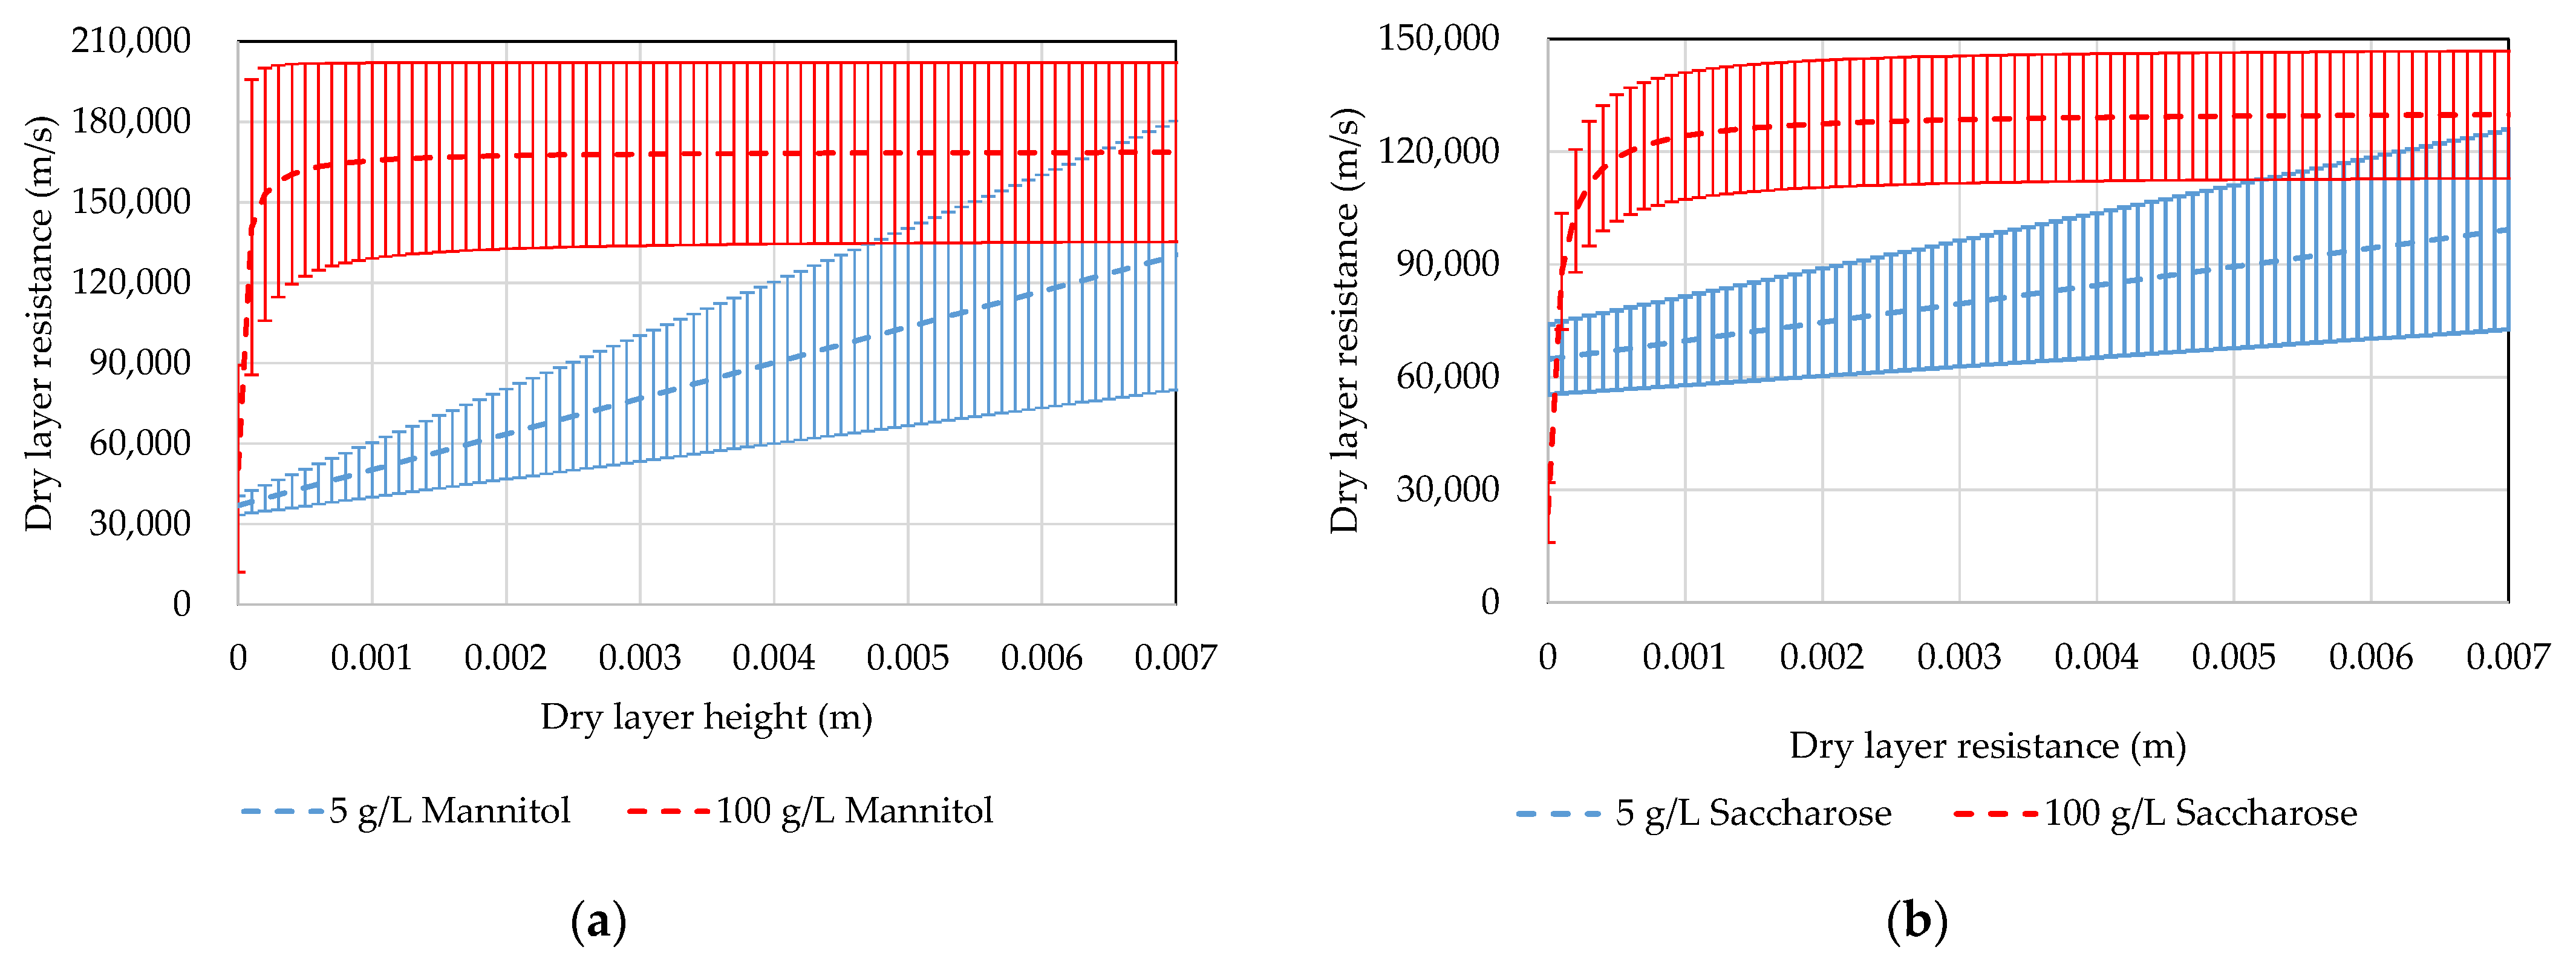
3.6. Dry Layer Resistance
4. Results
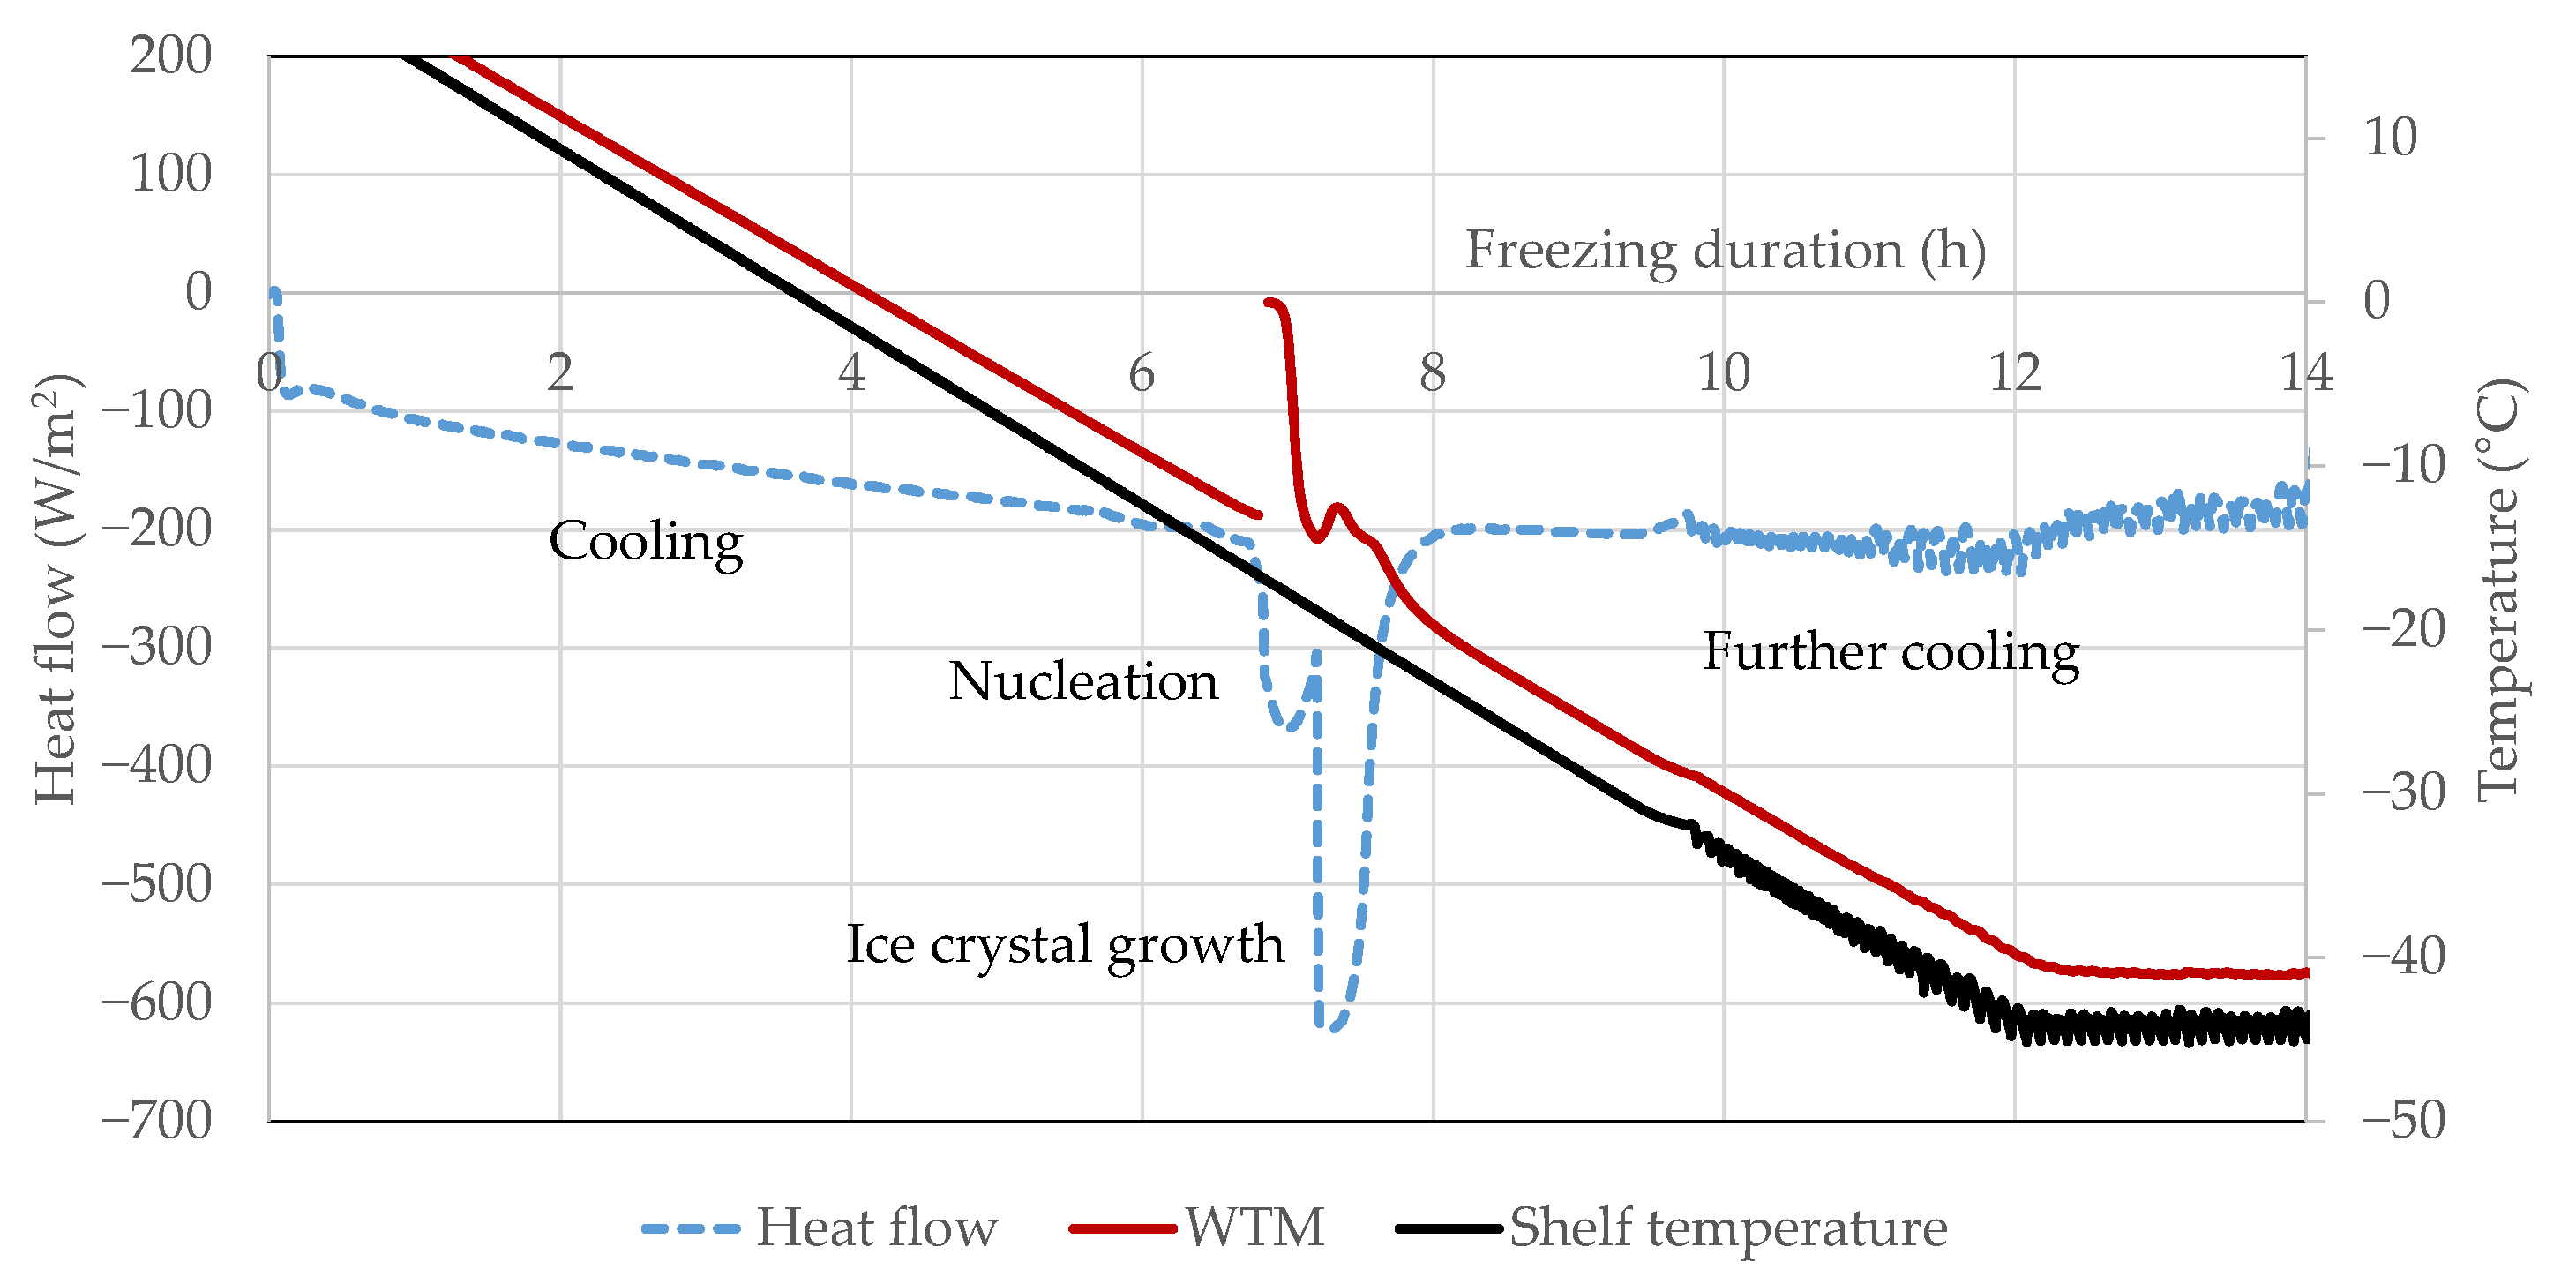
4.1. WTMplus
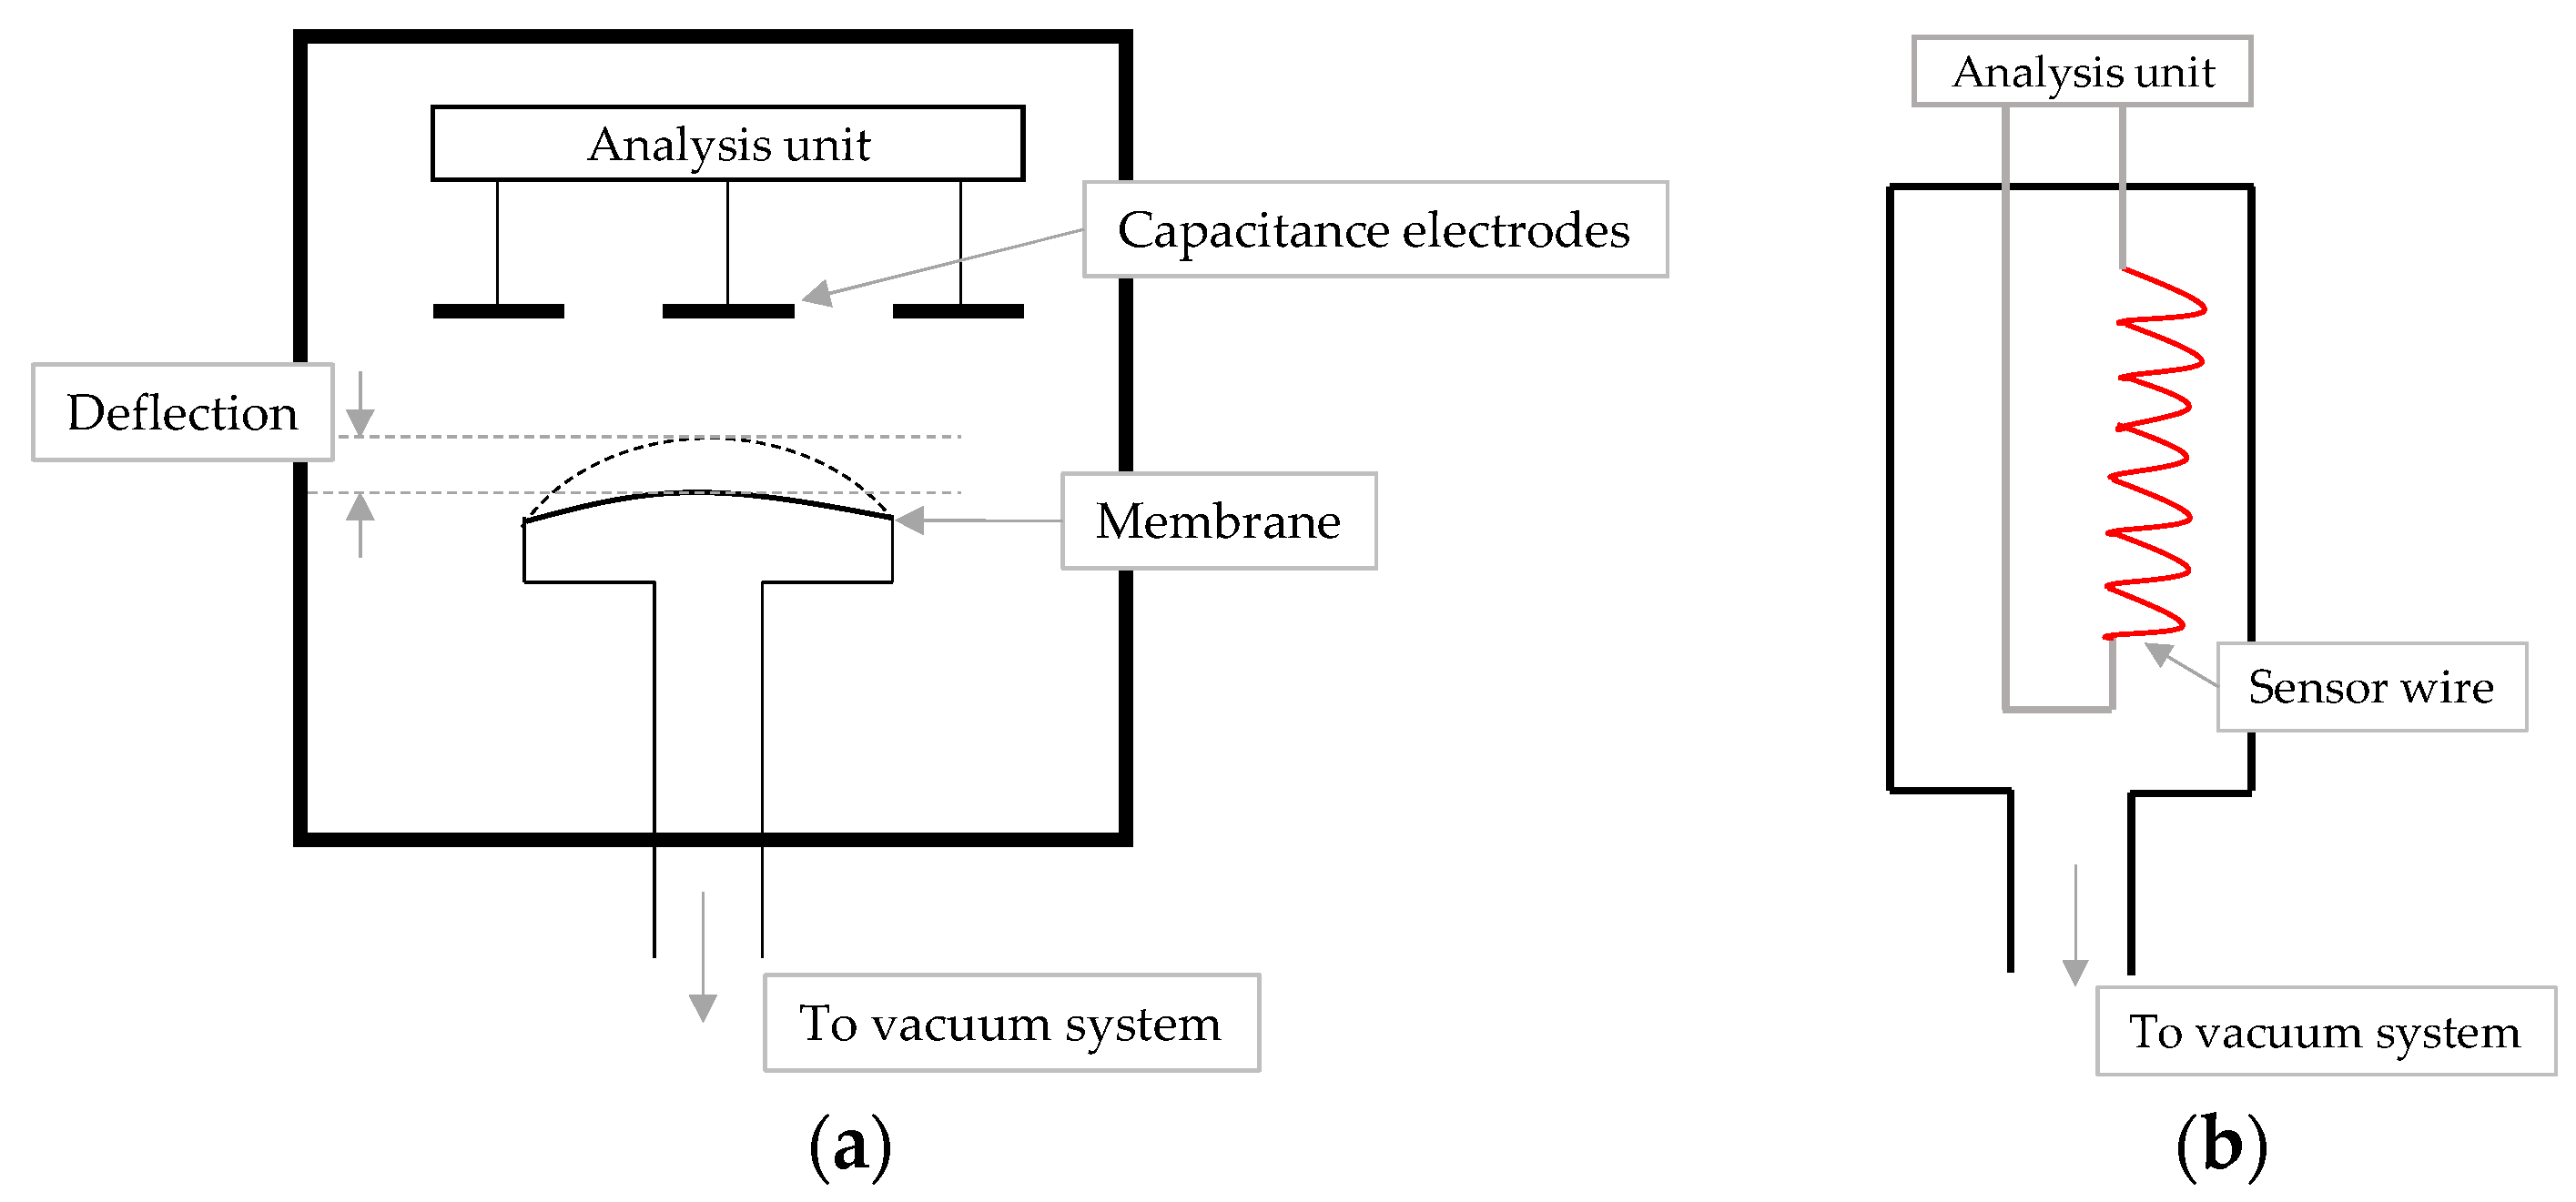
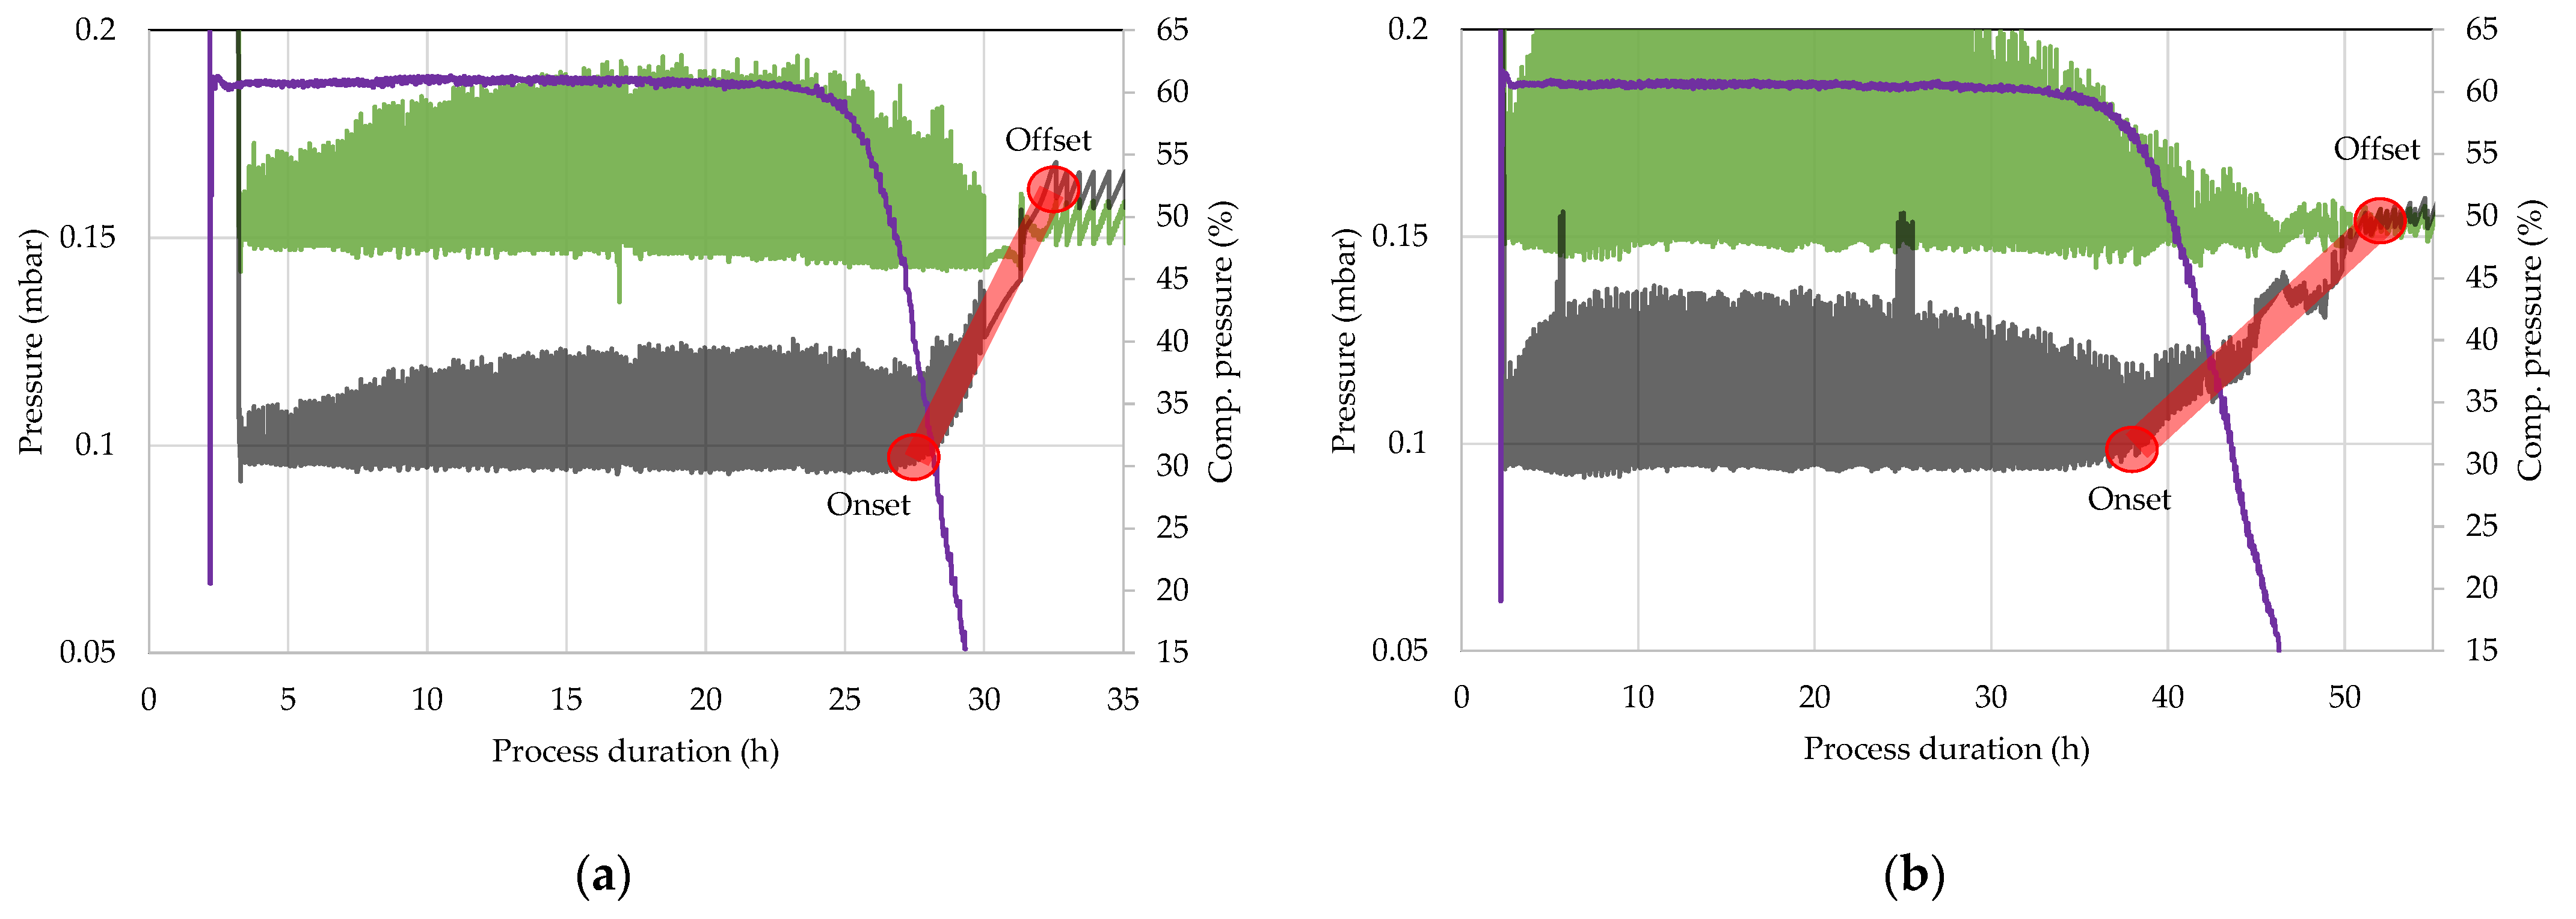
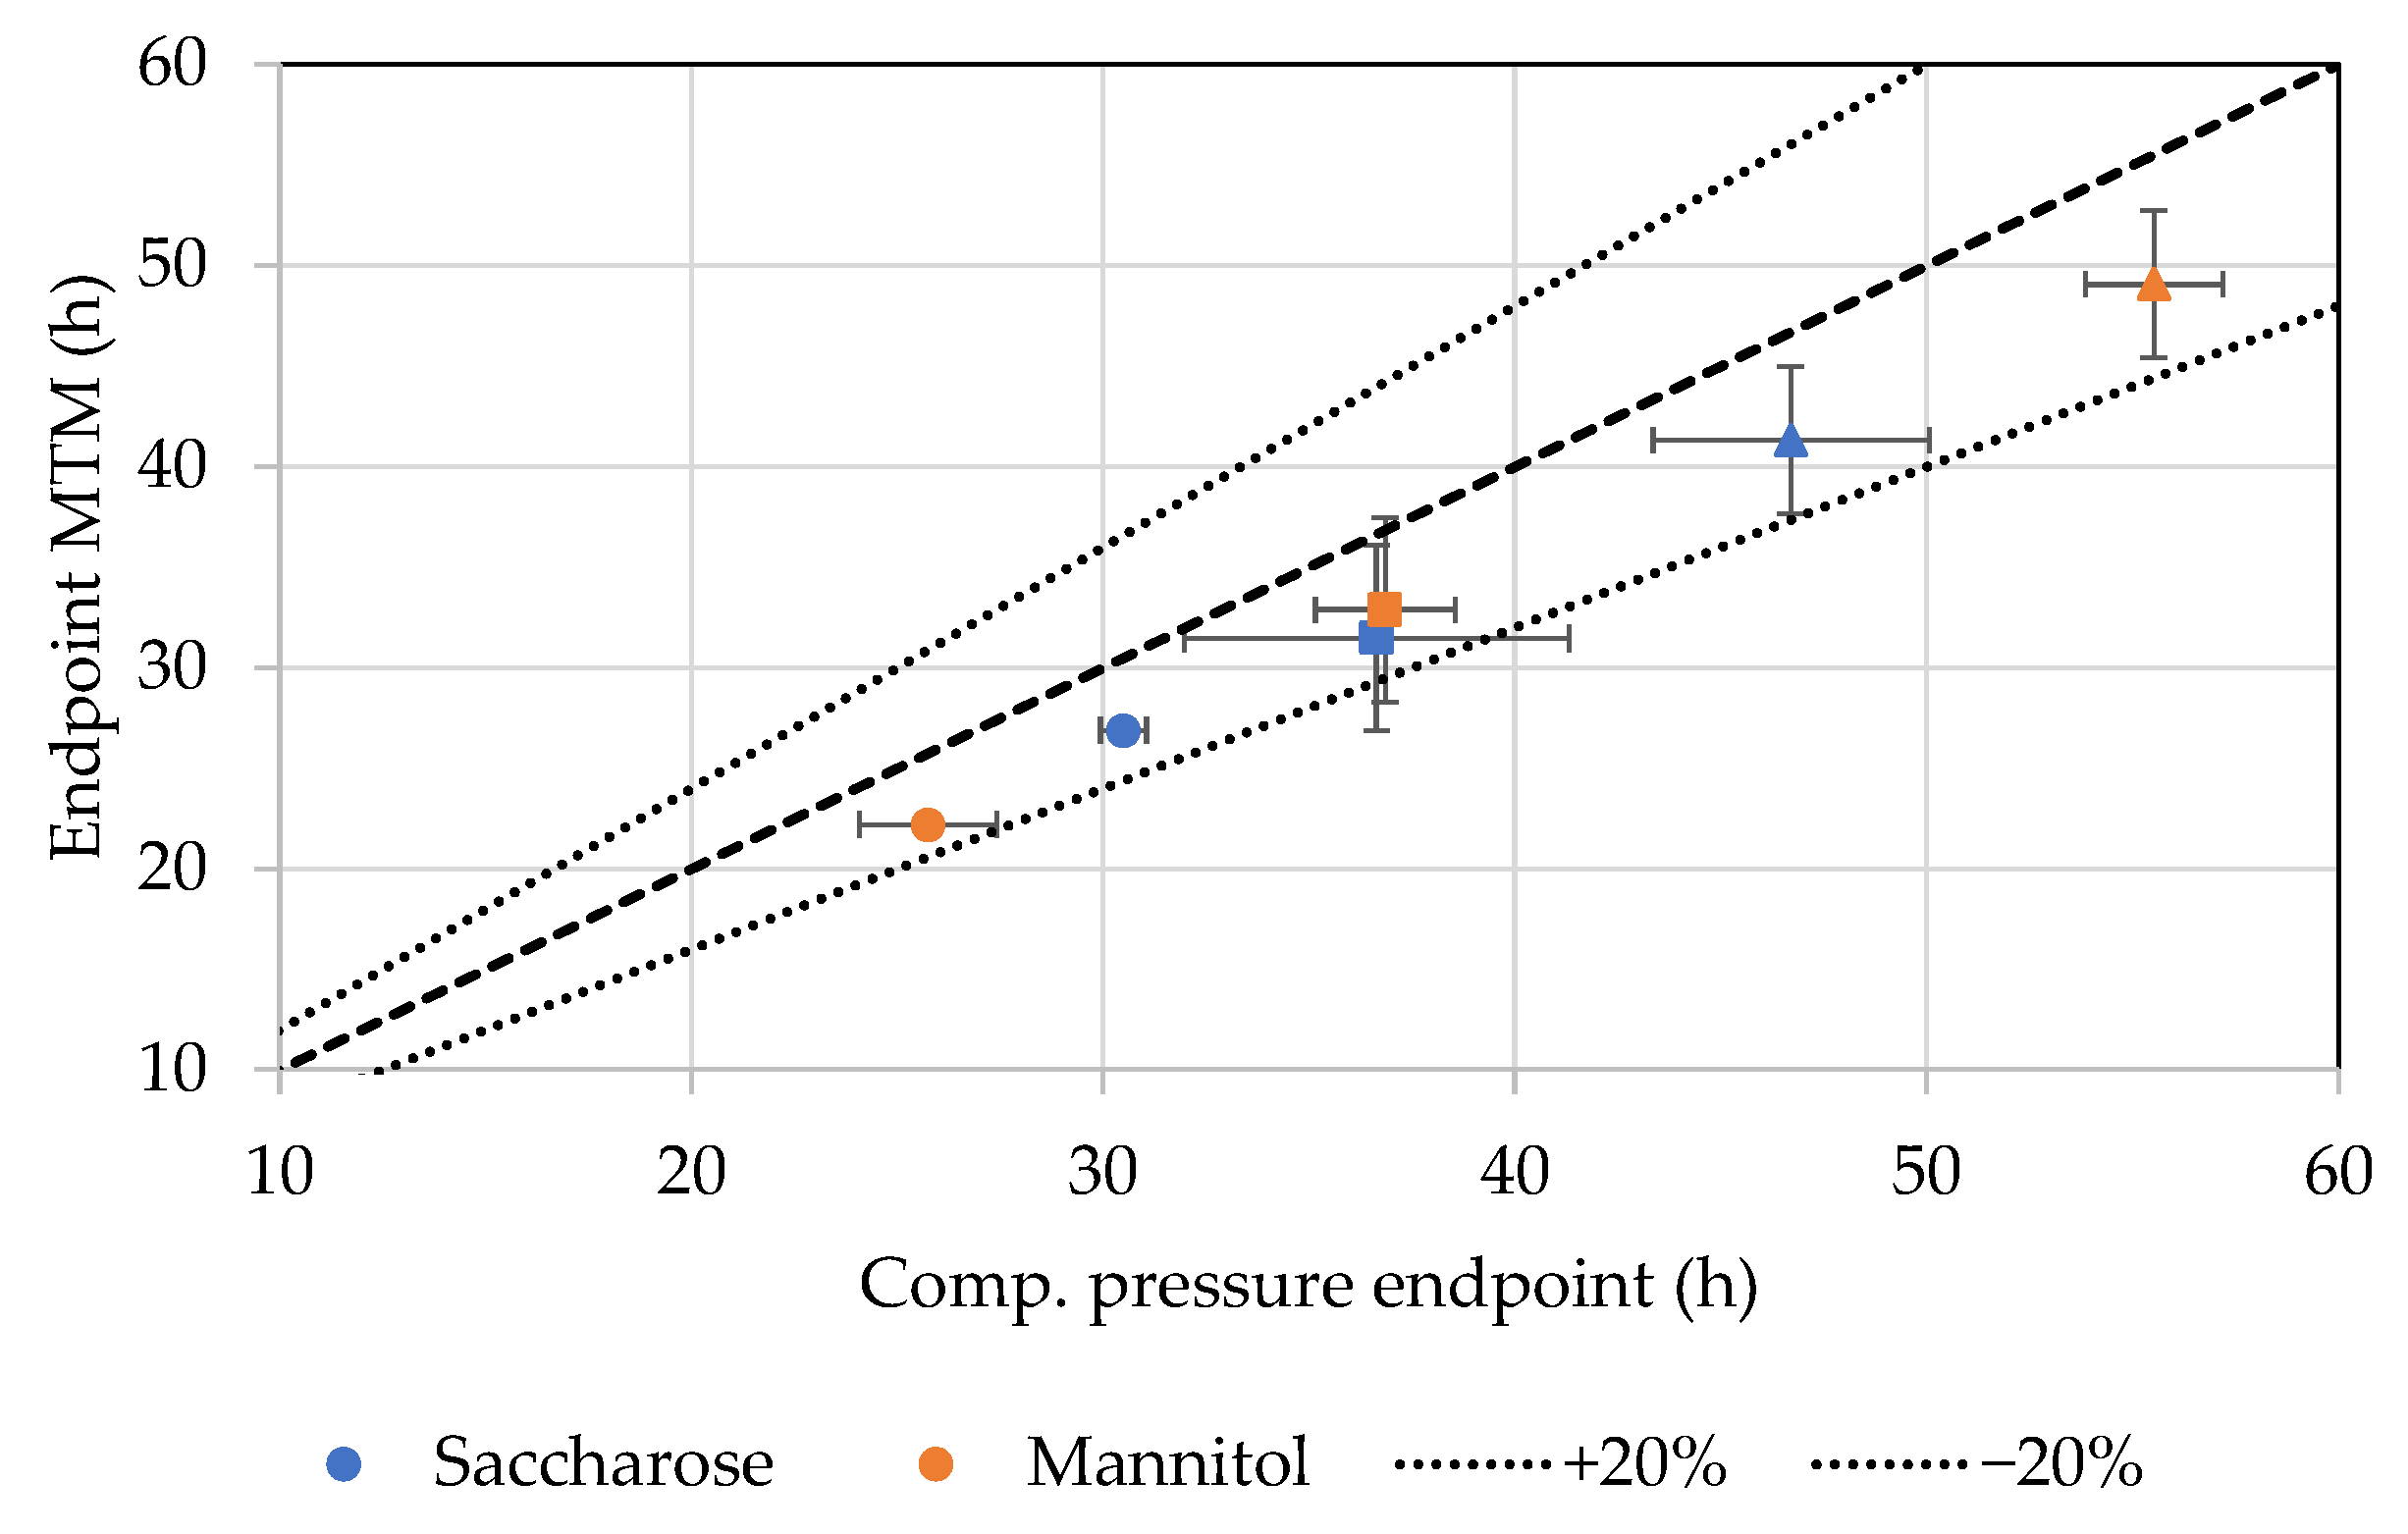
4.2. Comparative Pressure Measurement
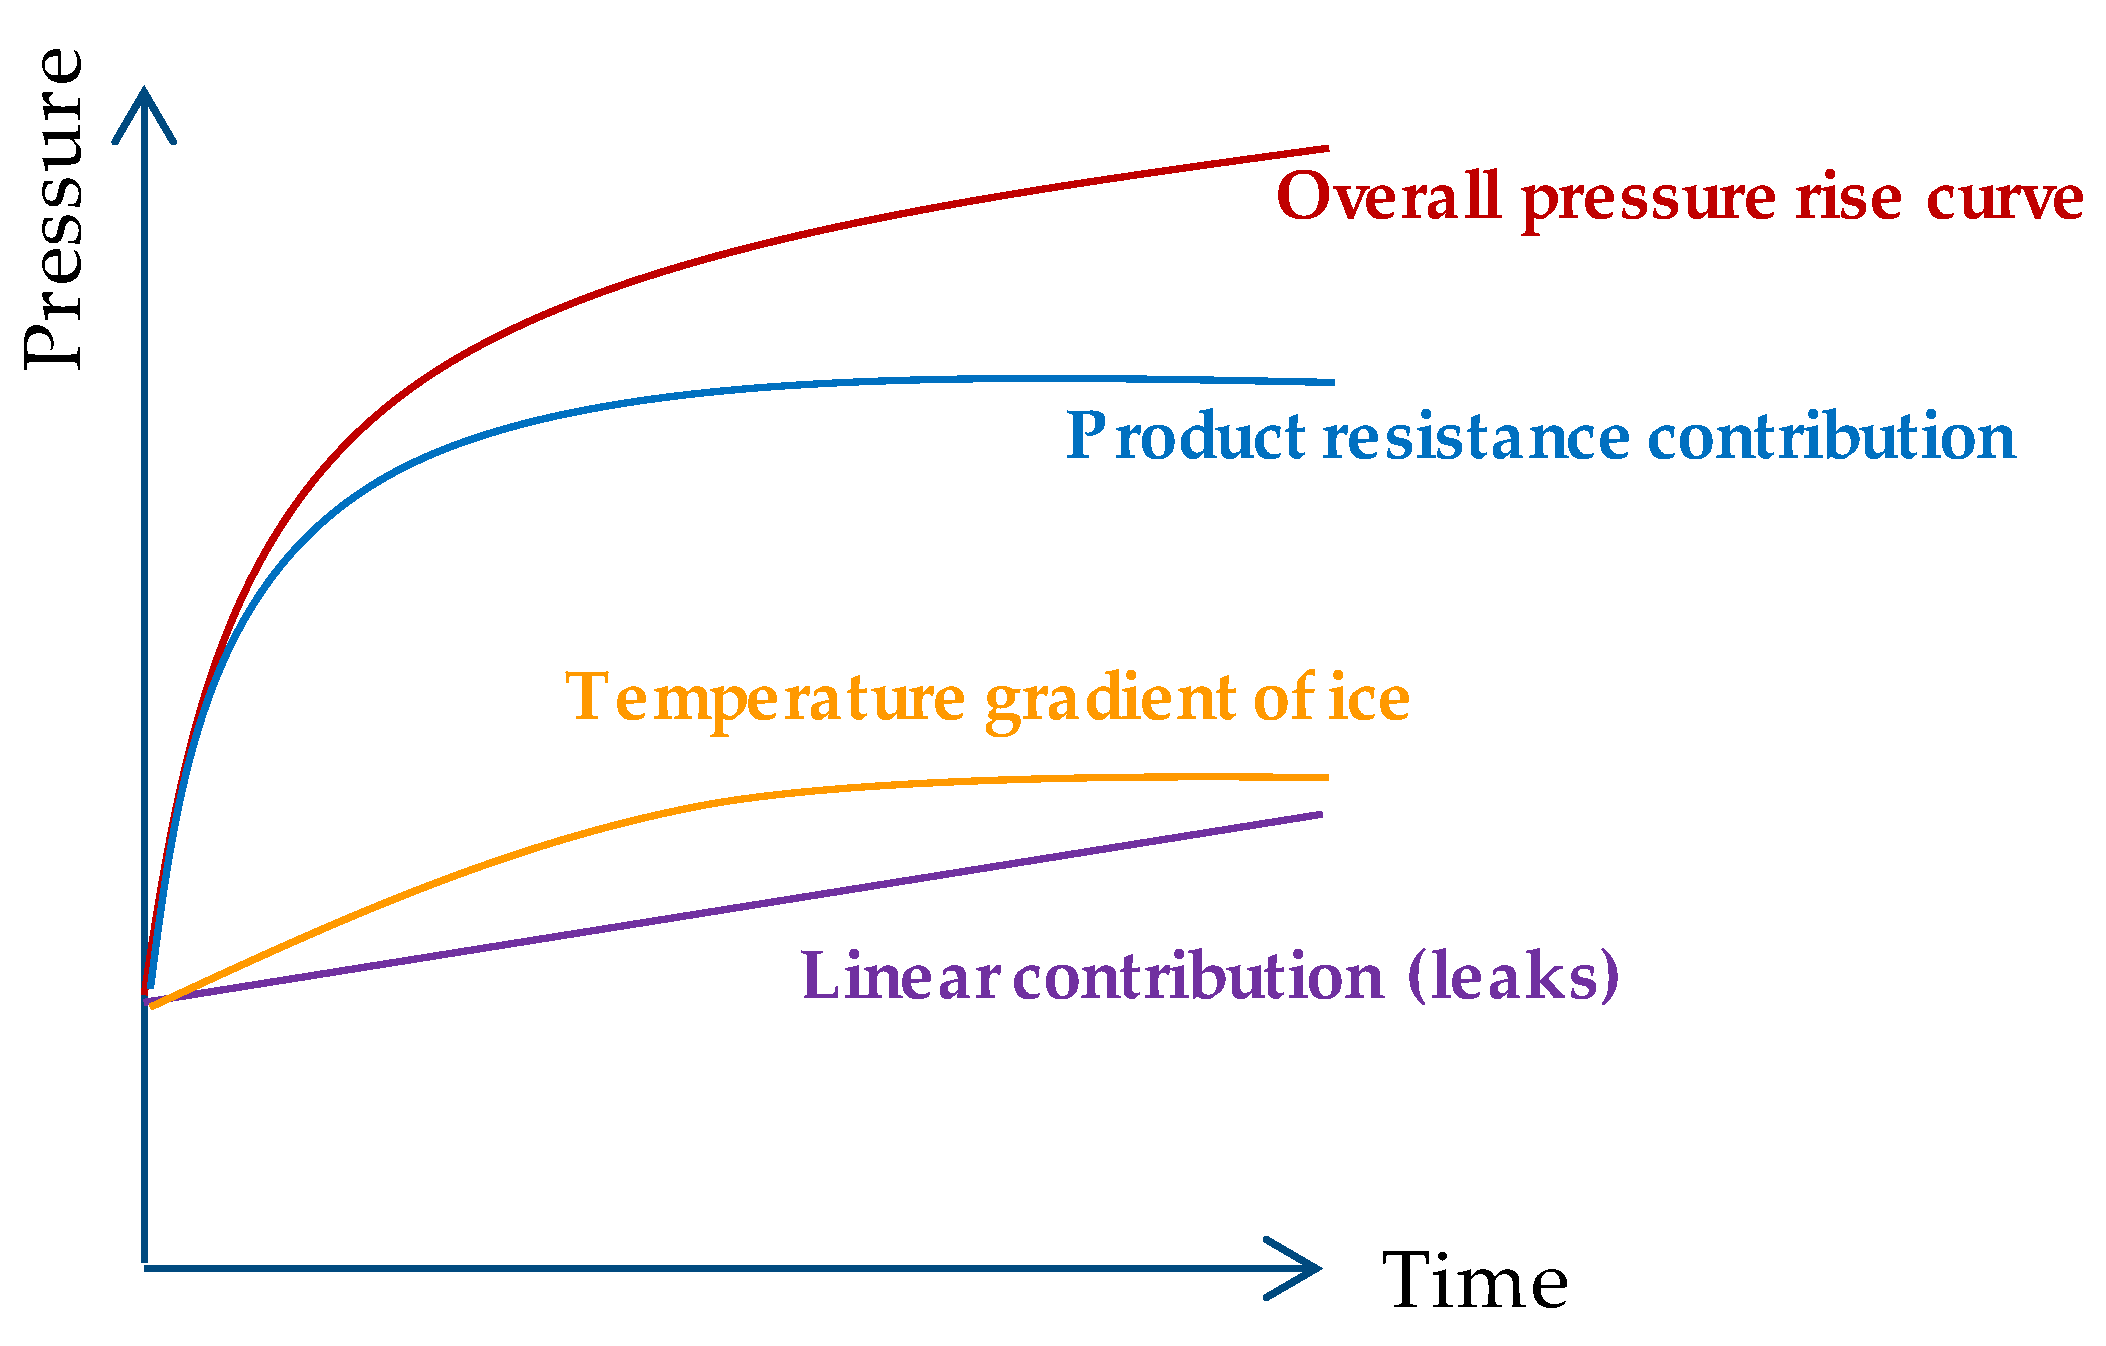
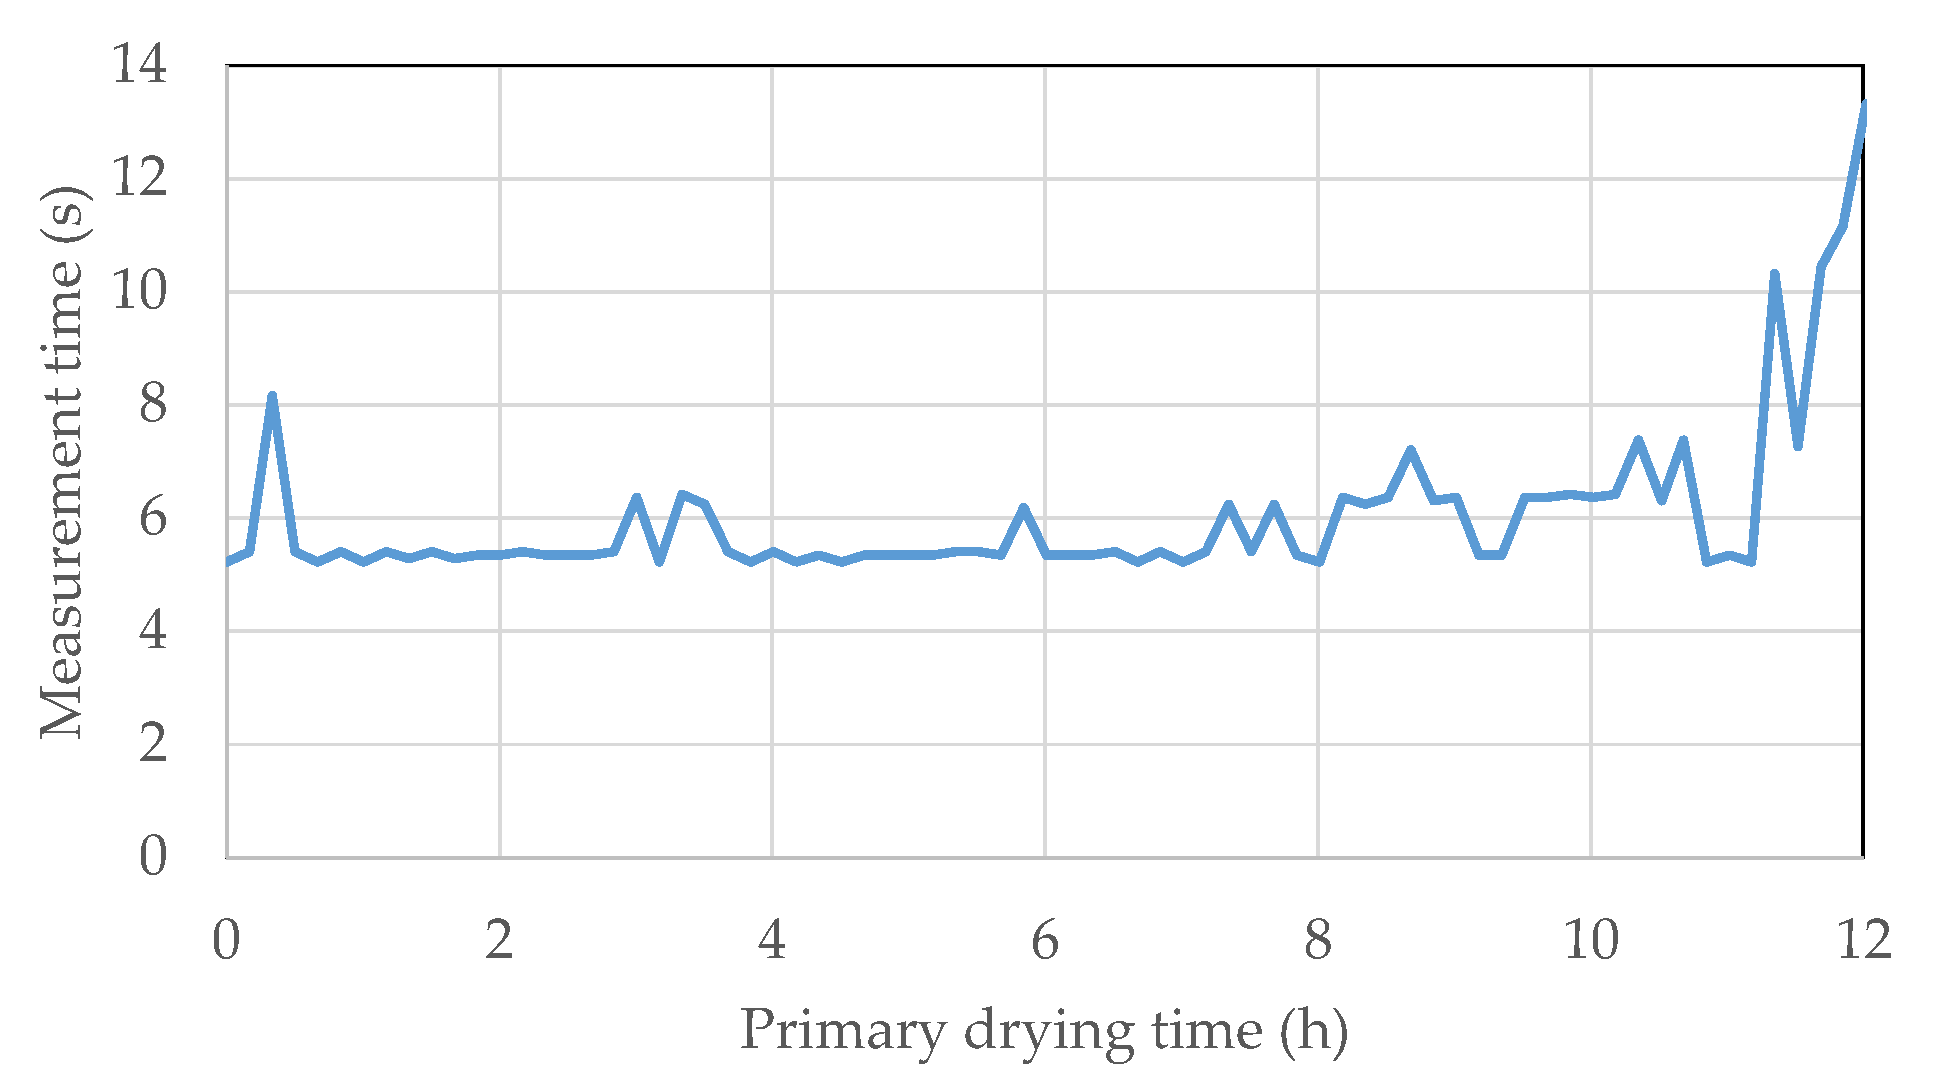
4.3. MTM
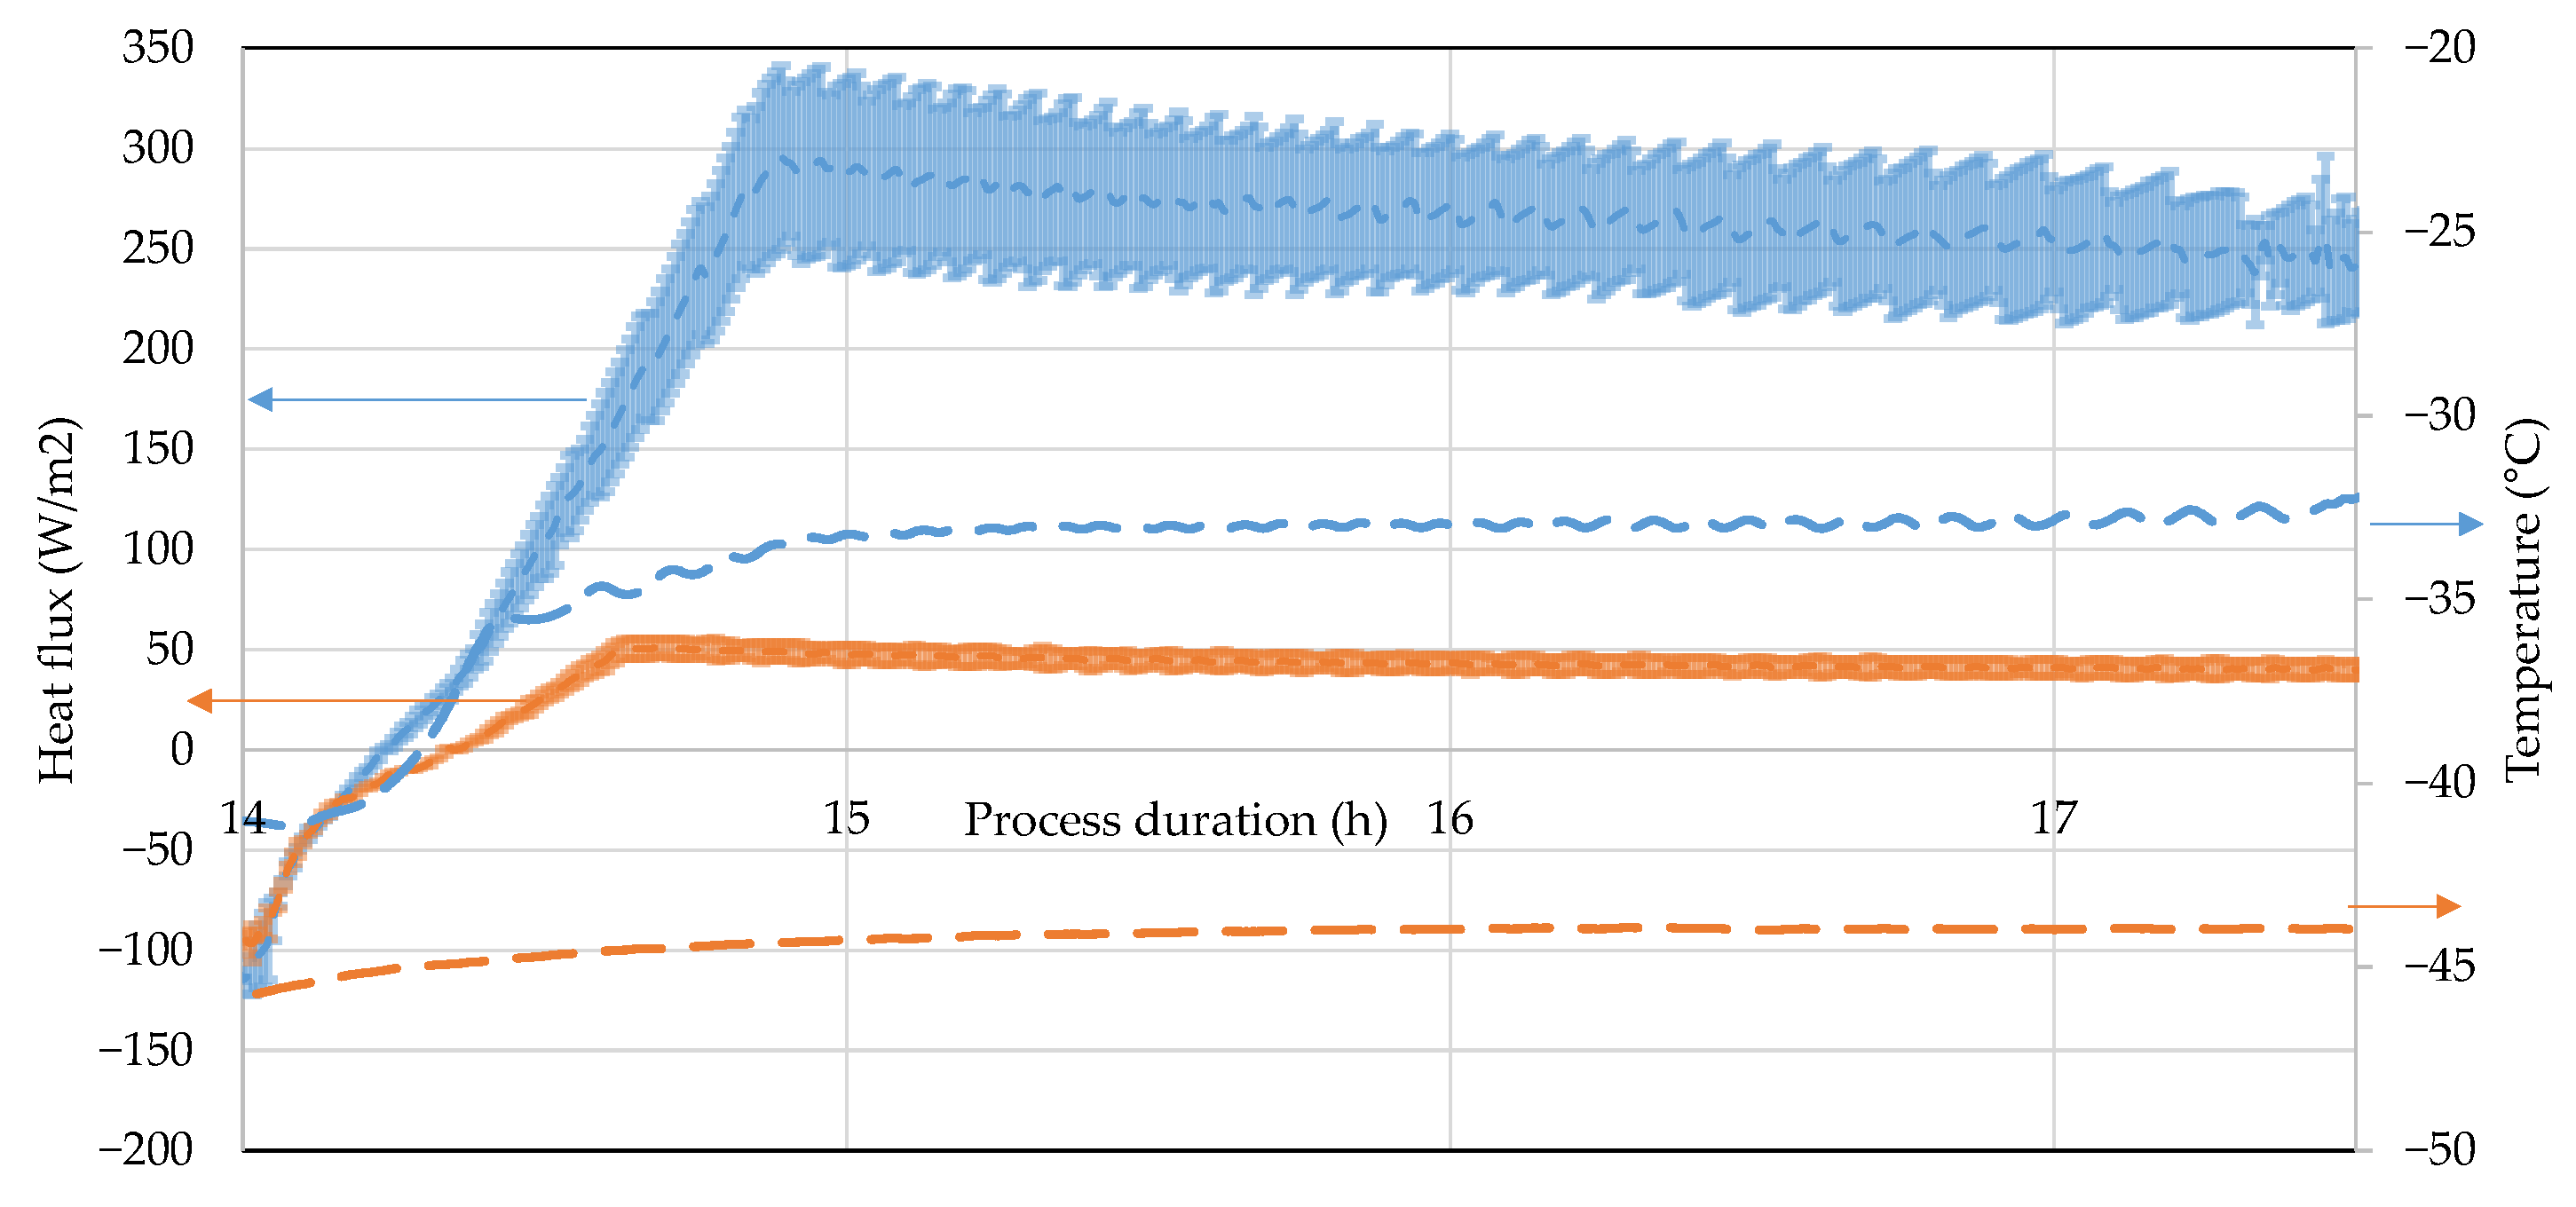
4.4. Heat Flux
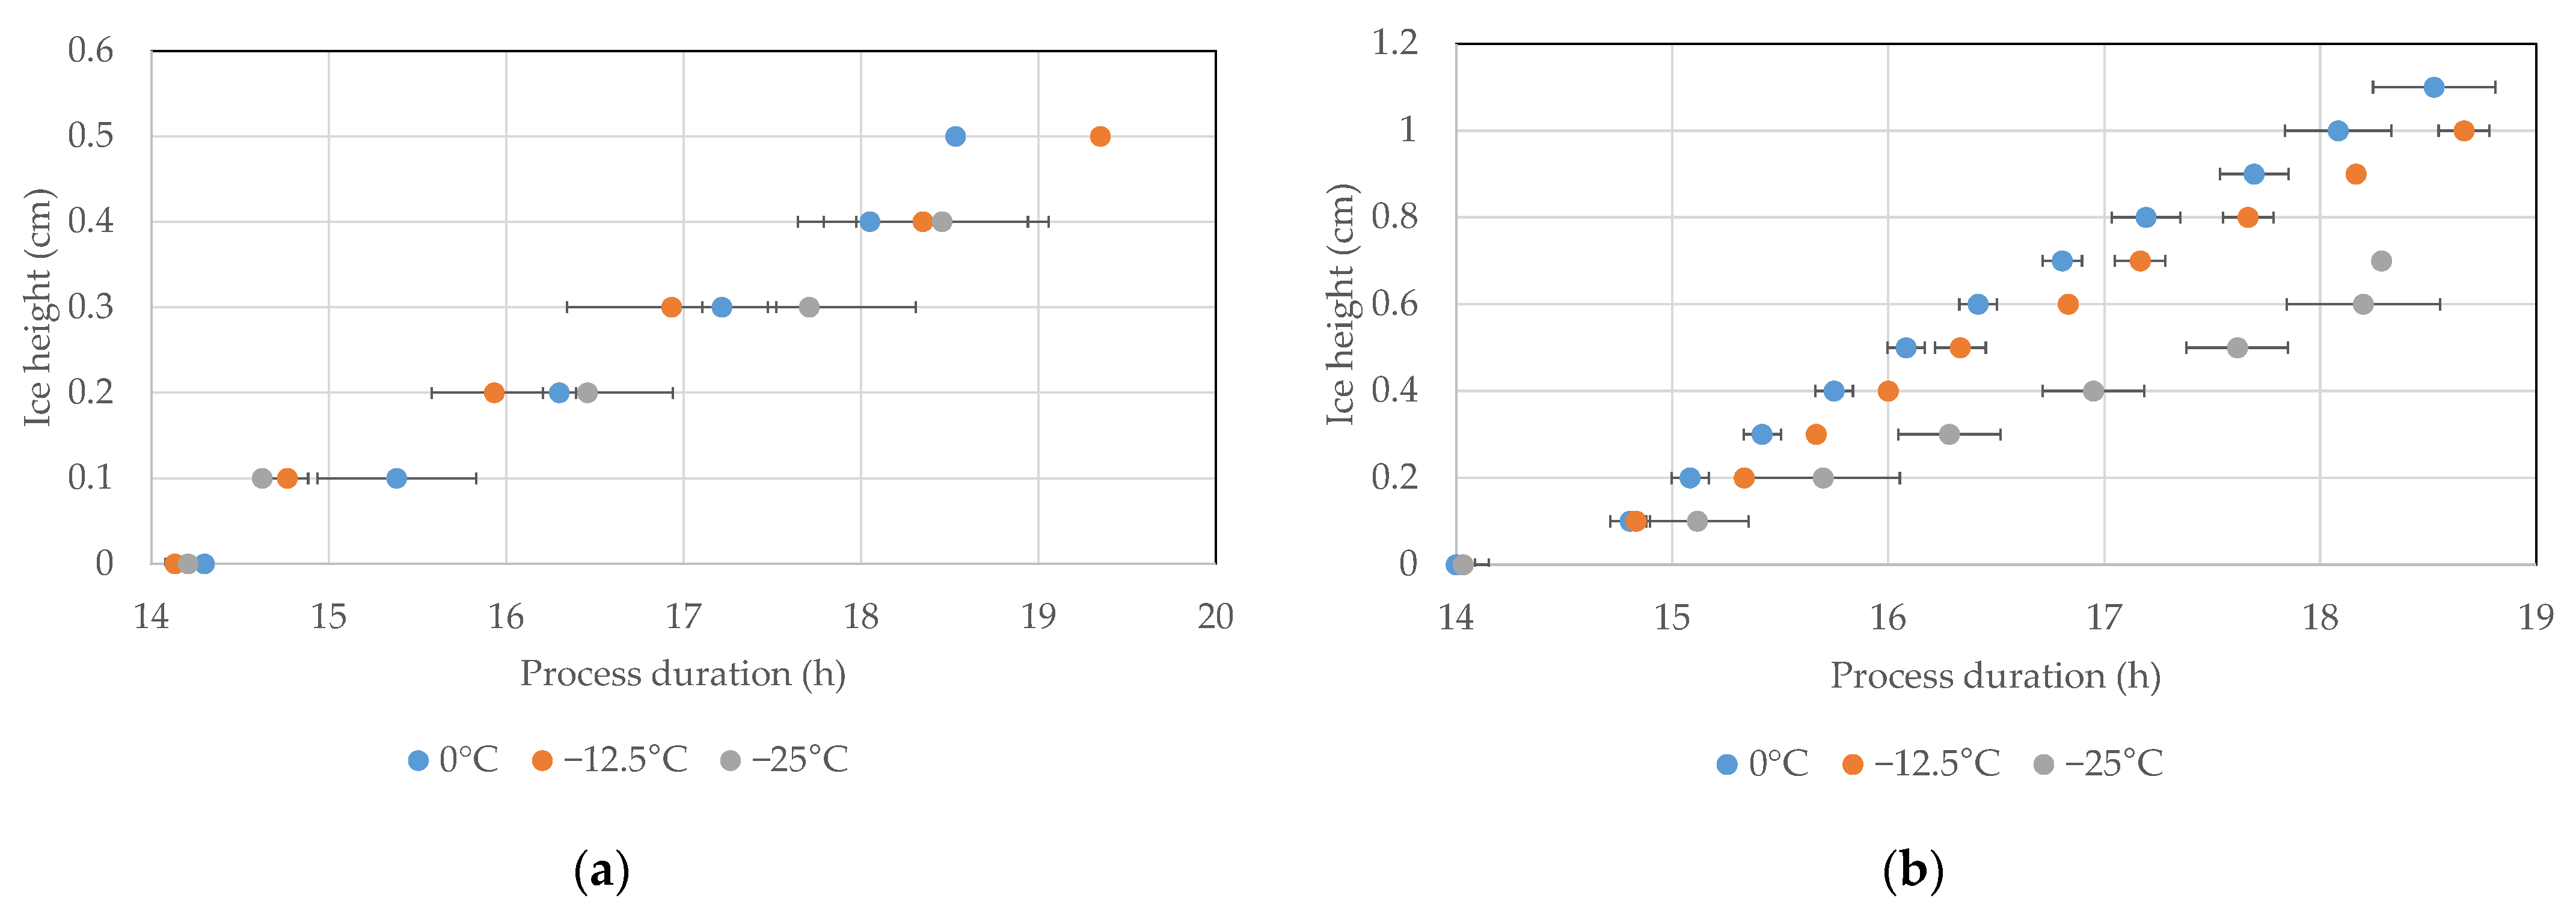
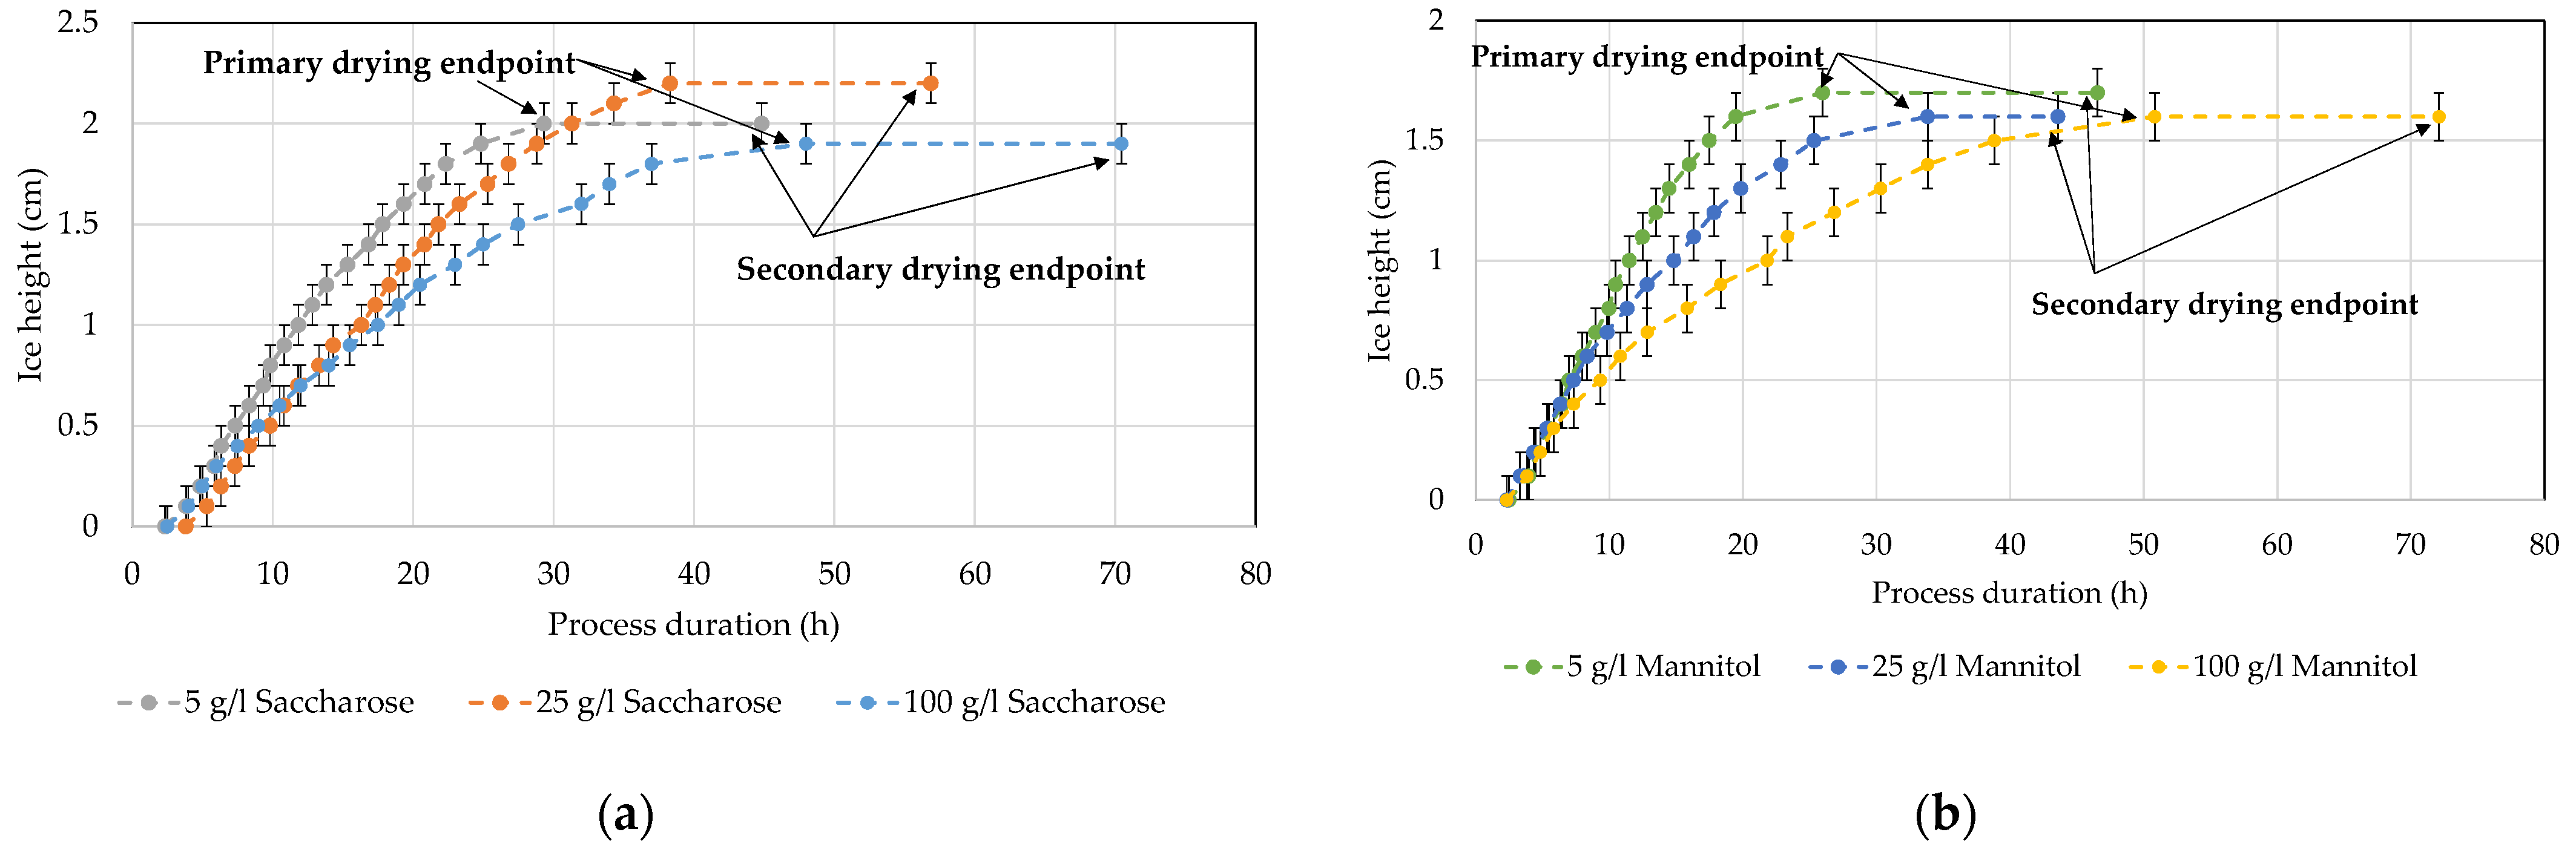
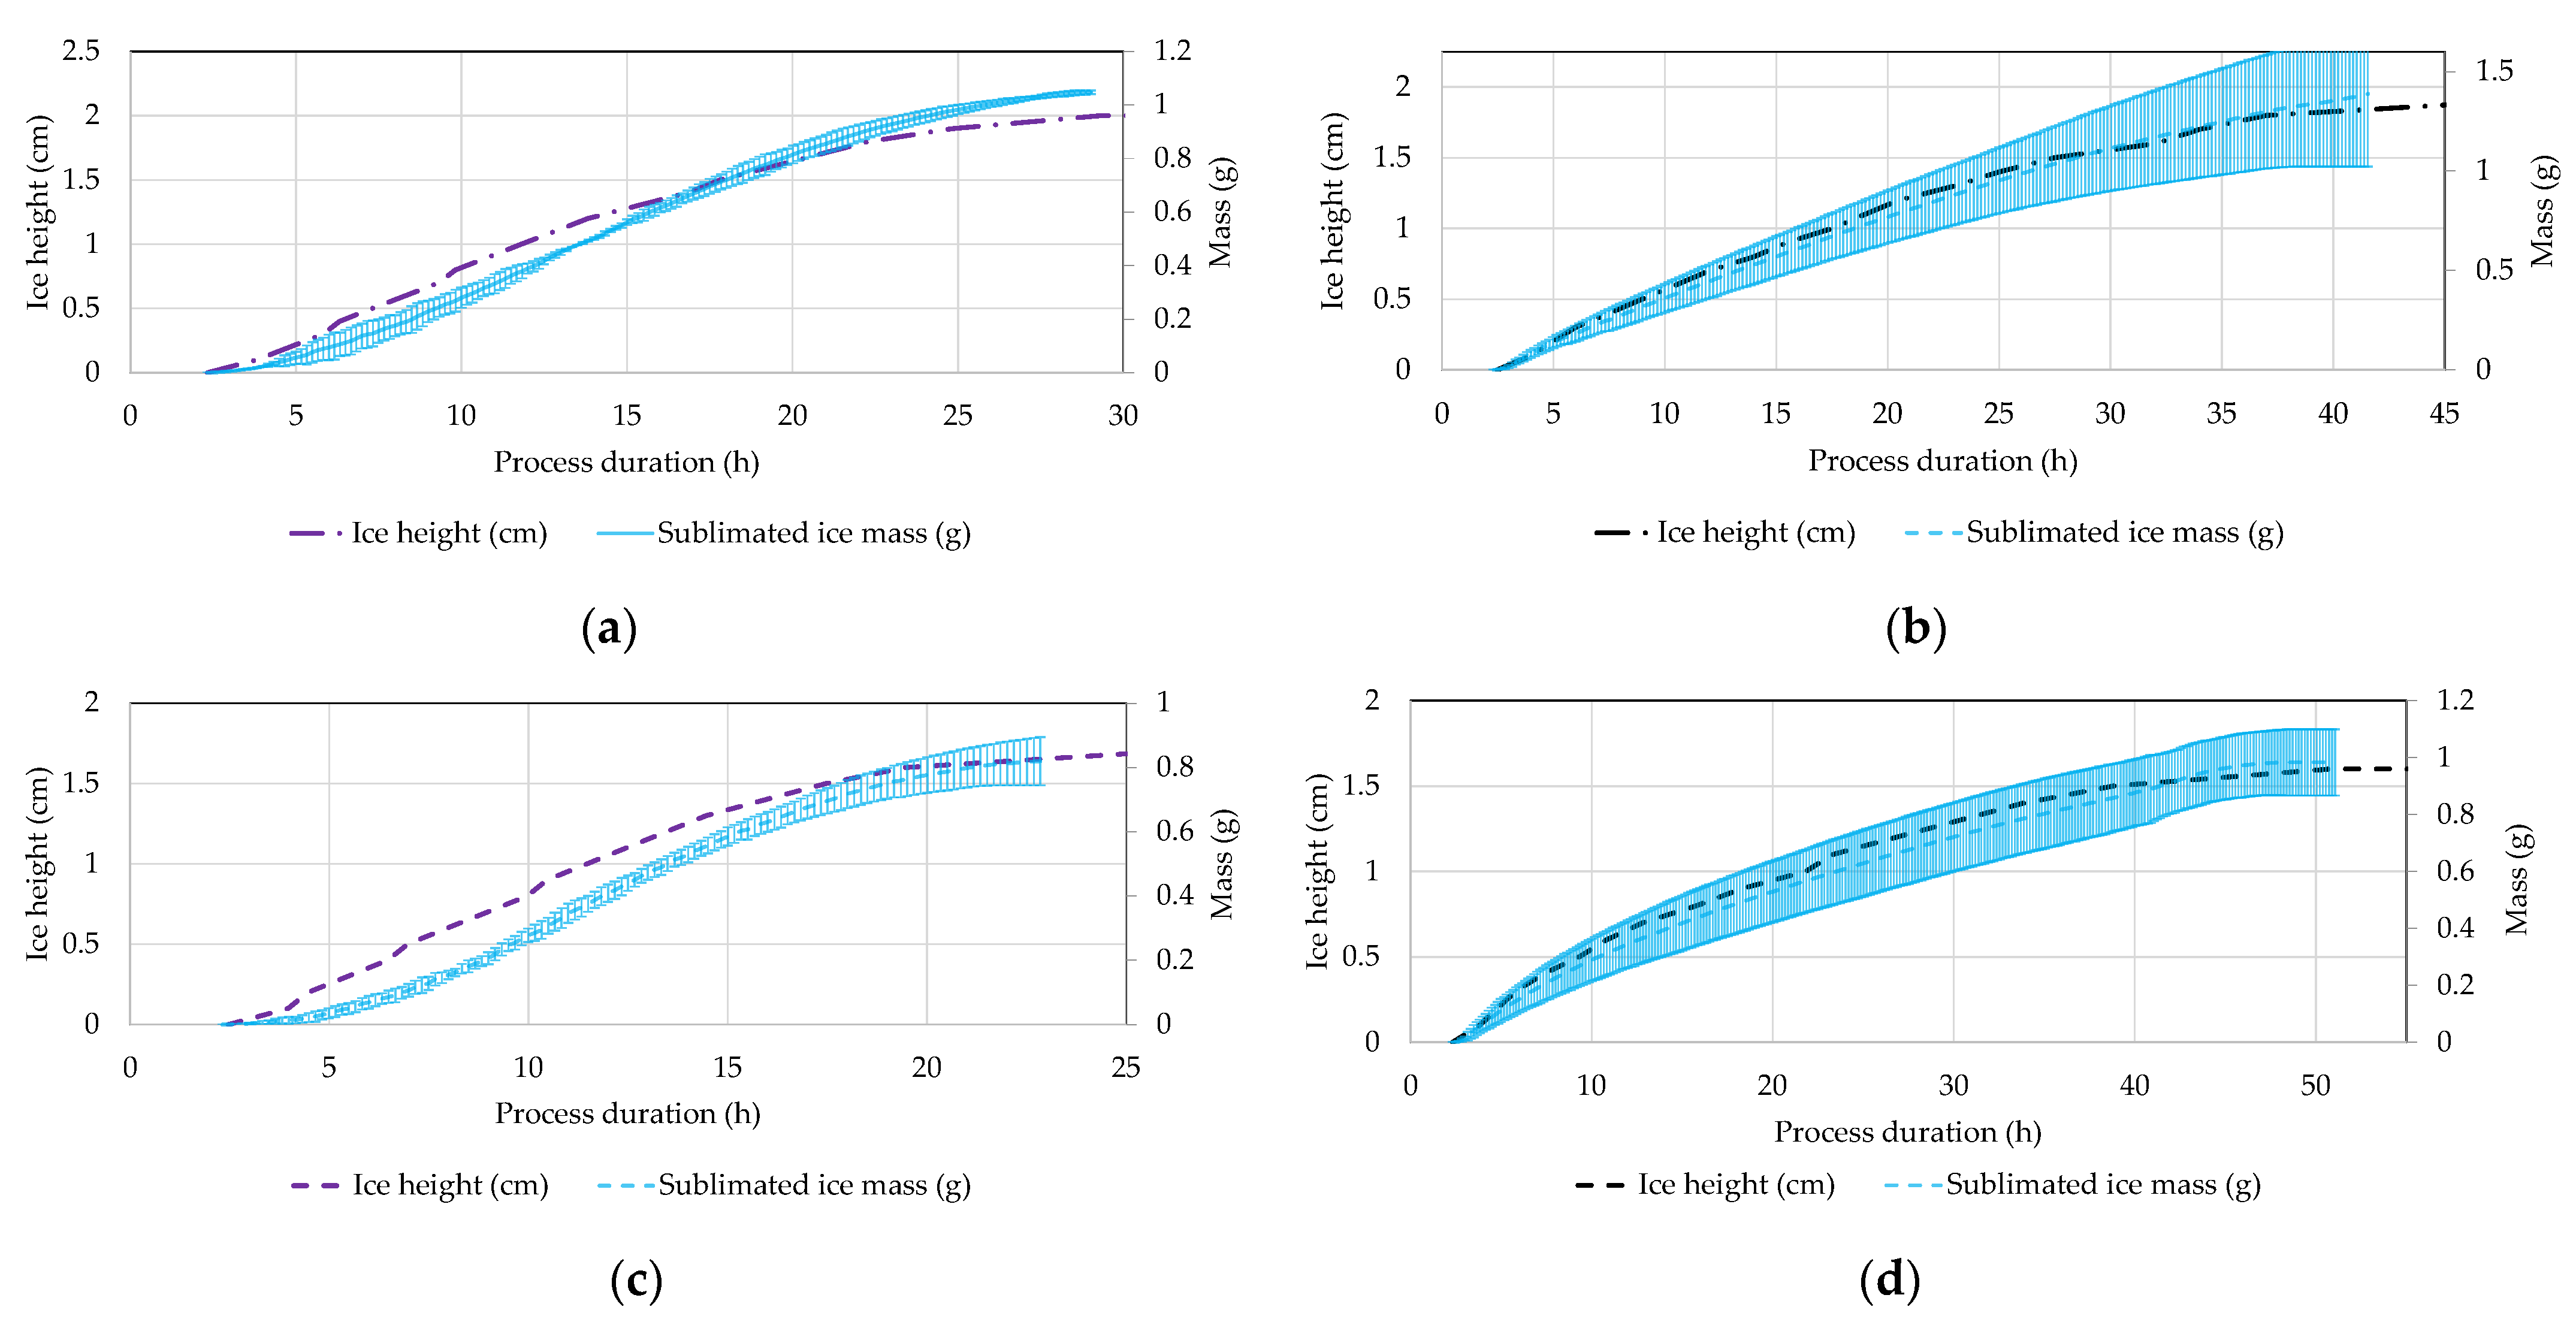
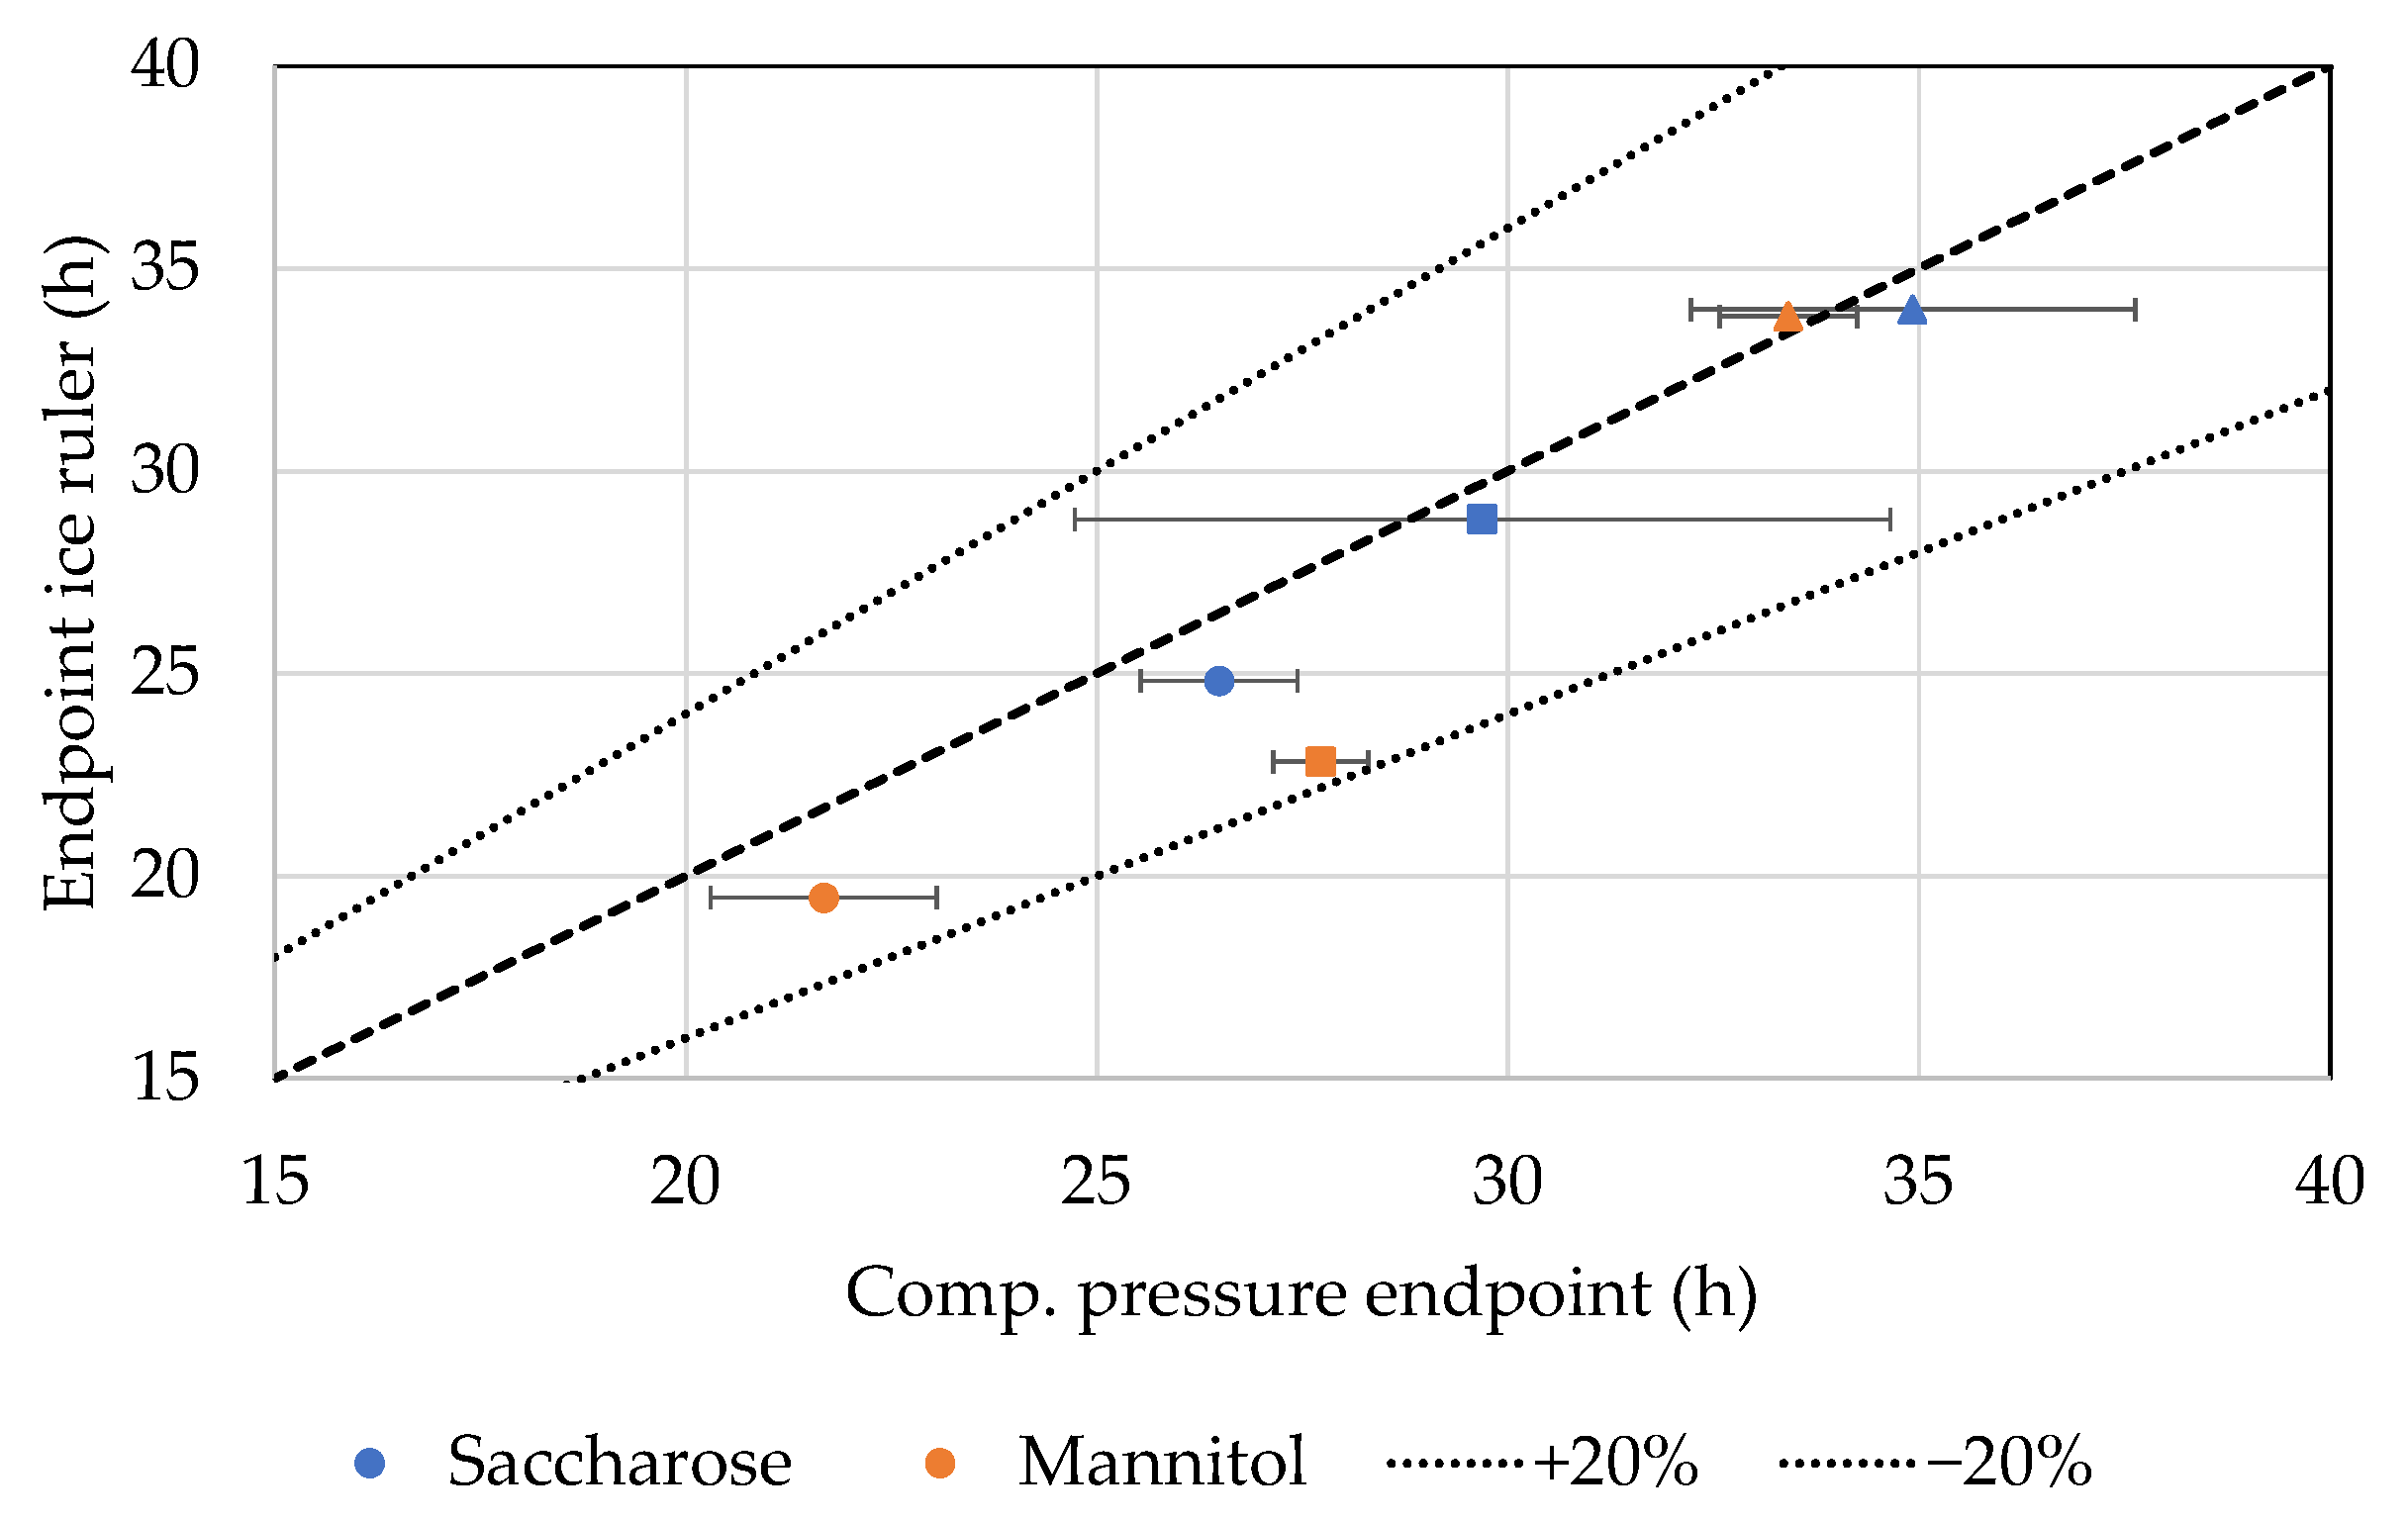
4.5. Ice Ruler
5. Discussion
Author Contributions
Funding
Acknowledgments
Conflicts of Interest
References
- Kawasaki, H.; Shimanouchi, T.; Kimura, Y. Recent Development of Optimization of Lyophilization Process. J. Chem. 2019, 2019, 9502856. [Google Scholar] [CrossRef]
- Tang, X.C.; Pikal, M.J. Design of Freeze-Drying Processes for Pharmaceuticals: Practical Advice. Pharm. Res. 2004, 21, 191–200. [Google Scholar] [CrossRef]
- Greiff, D. Development of cycles for lyophilization. Dev. Biol. Stand. 1992, 74, 85–92. [Google Scholar]
- FDA. PAT—A Framework for Innovative Pharmaceutical Development, Manufacturing, and Quality Assurance. FDA [Online], June 11. Available online: https://www.fda.gov/regulatory-information/search-fda-guidance-documents/pat-framework-innovative-pharmaceutical-development-manufacturing-and-quality-assurance (accessed on 15 February 2021).
- European Medicines Agency. ICH Guideline Q8 (R2) on Pharmaceutical Development. Available online: https://www.ema.europa.eu/en/documents/scientific-guideline/international-conference-harmonisation-technical-requirements-registration-pharmaceuticals-human-use_en-11.pdf (accessed on 24 June 2022).
- Helgers, H.; Schmidt, A.; Lohmann, L.J.; Vetter, F.L.; Juckers, A.; Jensch, C.; Mouellef, M.; Zobel-Roos, S.; Strube, J. Towards Autonomous Operation by Advanced Process Control—Process Analytical Technology for Continuous Biologics Antibody Manufacturing. Processes 2021, 9, 172. [Google Scholar] [CrossRef]
- Juckers, A.; Knerr, P.; Harms, F.; Strube, J. Advanced Process Analytical Technology in Combination with Process Modeling for Endpoint and Model Parameter Determination in Lyophilization Process Design and Optimization. Processes 2021, 9, 1600. [Google Scholar] [CrossRef]
- Klepzig, L.S.; Juckers, A.; Knerr, P.; Harms, F.; Strube, J. Digital Twin for Lyophilization by Process Modeling in Manufacturing of Biologics. Processes 2020, 8, 1325. [Google Scholar] [CrossRef]
- Juckers, A.; Knerr, P.; Harms, F.; Strube, J. Model-Based Product Temperature and Endpoint Determination in Primary Drying of Lyophilization Processes. Pharmaceutics 2022, 14, 809. [Google Scholar] [CrossRef]
- Willemer, H. Measurements of temperatures, ice evaporation rates and residual moisture contents in freeze-drying. Dev. Biol. Stand. 1992, 74, 123–134; discussion 135–136. [Google Scholar]
- Schneid, S.; Gieseler, H. Evaluation of a New Wireless Temperature Remote Interrogation System (TEMPRIS) to Measure Product Temperature During Freeze Drying. AAPS PharmSciTech 2008, 9, 729–739. [Google Scholar] [CrossRef]
- Moino, C.; Bourlés, E.; Pisano, R.; Scutellà, B. In-Line Monitoring of the Freeze-Drying Process by Means of Heat Flux Sensors. Ind. Eng. Chem. Res. 2021, 60, 9637–9645. [Google Scholar] [CrossRef]
- Chen, R.; Slater, N.K.; Gatlin, L.A.; Kramer, T.; Shalaev, E.Y. Comparative Rates of Freeze-Drying for Lactose and Sucrose Solutions as Measured by Photographic Recording, Product Temperature, and Heat Flux Transducer. Pharm. Dev. Technol. 2008, 13, 367–374. [Google Scholar] [CrossRef]
- De Beer, T.R.M.; Vercruysse, P.; Burggraeve, A.; Quinten, T.; Ouyang, J.; Zhang, X.; Vervaet, C.; Remon, J.P.; Baeyens, W.R.G. In-line and real-time process monitoring of a freeze drying process using Raman and NIR spectroscopy as complementary process analytical technology (PAT) tools. J. Pharm. Sci. 2009, 98, 3430–3446. [Google Scholar] [CrossRef] [PubMed]
- Brülls, M.; Folestad, S.; Sparén, A.; Rasmuson, A. In-situ near-infrared spectroscopy monitoring of the lyophilization process. Pharm. Res. 2003, 20, 494–499. [Google Scholar] [CrossRef]
- Presser, I. Innovative Online Messverfahren Zur Optimierung Von Gefriertrocknungsprozessen; Ludwig-Maximilians-Universität München: München, France, 2003. [Google Scholar]
- Antonello, A.B.; Fissore, D. In-Line Product Quality Control of Pharmaceuticals in Freeze-Drying Processes. In Modern Drying Technology; John Wiley & Sons, Ltd.: Hoboken, NJ, USA, 2011; pp. 91–154. [Google Scholar]
- Patel, S.M.; Pikal, M. Process Analytical Technologies (PAT) in freeze-drying of parenteral products. Pharm. Dev. Technol. 2009, 14, 567–587. [Google Scholar] [CrossRef]
- Read, E.; Shah, R.; Riley, B.; Park, J.; Brorson, K.; Rathore, A. Process analytical technology (PAT) for biopharmaceutical products: Part II. Concepts and applications. Biotechnol. Bioeng. 2009, 105, 285–295. [Google Scholar] [CrossRef]
- Fissore, D.; Pisano, R.; Barresi, A.A. Process analytical technology for monitoring pharmaceuticals freeze-drying–A comprehensive review. Dry. Technol. 2018, 36, 1839–1865. [Google Scholar] [CrossRef]
- Patel, S.M.; Doen, T.; Pikal, M.J. Determination of End Point of Primary Drying in Freeze-Drying Process Control. AAPS PharmSciTech 2010, 11, 73–84. [Google Scholar] [CrossRef]
- Patel, S.M.; Jameel, F.; Pikal, M.J. The Effect of Dryer Load on Freeze Drying Process Design. J. Pharm. Sci. 2010, 99, 4363–4379. [Google Scholar] [CrossRef]
- Zhou, D.; Shang, S.; Tharp, T.; Jameel, F.; Sinha, K.; Nere, N.K. Leveraging Lyophilization Modeling for Reliable Development, Scale-up and Technology Transfer. AAPS PharmSciTech 2019, 20, 263. [Google Scholar] [CrossRef]
- Wiggenhorn, M.; Presser, I.; Winter, G. The current state of PAT in freeze-drying. Am. Pharm. Rev. 2005, 8, 38–44. [Google Scholar]
- Tang, X.; Nail, S.L.; Pikal, M.J. Evaluation of manometric temperature measurement, a process analytical technology tool for freeze-drying: Part I, product temperature measurement. AAPS PharmSciTech 2006, 7, E95–E103. [Google Scholar] [CrossRef]
- Tang, X.C.; Nail, S.L.; Pikal, M.J. Evaluation of manometric temperature measurement (MTM), a process analytical technology tool in freeze drying, part III: Heat and mass transfer measurement. AAPS PharmSciTech 2006, 7, E105–E111. [Google Scholar] [CrossRef]
- Gieseler, H.; Kramer, T.; Pikal, M.J. Use of manometric temperature measurement (MTM) and SMART™ freeze dryer technology for development of an optimized freeze-drying cycle. J. Pharm. Sci. 2007, 96, 3402–3418. [Google Scholar] [CrossRef] [PubMed]
- Schneid, S. Investigation of Novel Process Analytical Technology (PAT) Tools for Use in Freeze-Drying Processes: Doctoralthesis; Friedrich-Alexander-Universität Erlangen-Nürnberg (FAU): Erlangen, Germany, 2009. [Google Scholar]
- Wegiel, L.A.; Ferris, S.J.; Nail, S.L. Experimental Aspects of Measuring the Vial Heat Transfer Coefficient in Pharmaceutical Freeze-Drying. AAPS PharmSciTech 2018, 19, 1810–1817. [Google Scholar] [CrossRef] [PubMed]
- Ari, K. Raman and Near-Infrared Spectroscopic Methods for In-Line Monitoring of Freeze-Drying Process; University of Eastern Finland: Joensuu, Finland, 2015; ISBN 78-952-61-1717-1. [Google Scholar]
- Grohganz, H.; Gildemyn, D.; Skibsted, E.; Flink, J.M.; Rantanen, J. Rapid Solid-State Analysis of Freeze-Dried Protein Formulations Using NIR and Raman Spectroscopies. J. Pharm. Sci. 2011, 100, 2871–2875. [Google Scholar] [CrossRef]
- Kauppinen, A.; Toiviainen, M.; Aaltonen, J.; Korhonen, O.; Järvinen, K.; Juuti, M.; Pellinen, R.; Ketolainen, J. Microscale Freeze-Drying with Raman Spectroscopy as a Tool for Process Development. Anal. Chem. 2013, 85, 2109–2116. [Google Scholar] [CrossRef]
- Pieters, S.; Heyden, Y.V.; Roger, J.-M.; D’Hondt, M.; Hansen, L.; Palagos, B.; De Spiegeleer, B.; Remon, J.-P.; Vervaet, C.; De Beer, T. Raman spectroscopy and multivariate analysis for the rapid discrimination between native-like and non-native states in freeze-dried protein formulations. Eur. J. Pharm. Biopharm. 2013, 85, 263–271. [Google Scholar] [CrossRef]
- Preskar, M.; Korasa, K.; Vrbanec, T.; Klement, D.; Vrečer, F.; Gašperlin, M. Applicability of Raman and near-infrared spectroscopy in the monitoring of freeze-drying injectable ibuprofen. Drug Dev. Ind. Pharm. 2021, 47, 758–769. [Google Scholar] [CrossRef]
- Romero-Torres, S.; Wikström, H.; Grant, E.R.; Taylor, L.S. Monitoring of mannitol phase behavior during freeze-drying using non-invasive Raman spectroscopy. PDA J. Pharm. Sci. Technol. 2007, 61, 131–145. [Google Scholar]
- Sampathkumar, K.; Cao, W.; Phillips, J.; Amgen, P. Applying Raman Spectroscopy to Design of Lyophilization Cycles for Protein Formulation Development. Am. Pharm. Rev. 2009, 12, 44–48. [Google Scholar]
- Sarraguça, M.C.; De Beer, T.; Vervaet, C.; Remon, J.-P.; Lopes, J.A. A batch modelling approach to monitor a freeze-drying process using in-line Raman spectroscopy. Talanta 2010, 83, 130–138. [Google Scholar] [CrossRef]
- Su, W.; Hao, H.; Glennon, B.; Barrett, M. Spontaneous Polymorphic Nucleation of d-Mannitol in Aqueous Solution Monitored with Raman Spectroscopy and FBRM. Cryst. Growth Des. 2013, 13, 5179–5187. [Google Scholar] [CrossRef]
- De Beer, T.; Burggraeve, A.; Fonteyne, M.; Saerens, L.; Remon, J.; Vervaet, C. Near infrared and Raman spectroscopy for the in-process monitoring of pharmaceutical production processes. Int. J. Pharm. 2011, 417, 32–47. [Google Scholar] [CrossRef]
- De Beer, T.R.M.; Allesø, M.; Goethals, F.; Coppens, A.; Heyden, Y.V.; De Diego, H.L.; Rantanen, J.; Verpoort, F.; Vervaet, C.; Remon, A.J.P.; et al. Implementation of a Process Analytical Technology System in a Freeze-Drying Process Using Raman Spectroscopy for In-Line Process Monitoring. Anal. Chem. 2007, 79, 7992–8003. [Google Scholar] [CrossRef]
- De Beer, T.; Wiggenhorn, M.; Hawe, A.; Kasper, J.; Almeida, A.; Quinten, T.; Friess, W.; Winter, G.; Vervaet, C.; Remon, J. Optimization of a pharmaceutical freeze-dried product and its process using an experimental design approach and innovative process analyzers. Talanta 2011, 83, 1623–1633. [Google Scholar] [CrossRef]
- Carfagna, M.; Rosa, M.; Hawe, A.; Frieß, W. Design of freeze-drying cycles: The determination of heat transfer coefficient by using heat flux sensor and MicroFD. Int. J. Pharm. 2022, 621, 121763. [Google Scholar] [CrossRef]
- Vollrath, I. Controlled Nucleation and Heat Flux Measurements as Innovative Technologies for Freeze-Drying; Ludwig-Maximilians-Universität München: München, Germany, 2018. [Google Scholar]
- Vollrath, I.; Pauli, V.; Friess, W.; Freitag, A.; Hawe, A.; Winter, G. Evaluation of Heat Flux Measurement as a New Process Analytical Technology Monitoring Tool in Freeze Drying. J. Pharm. Sci. 2017, 106, 1249–1257. [Google Scholar] [CrossRef]
- Carfagna, M.; Rosa, M.; Lucke, M.; Hawe, A.; Frieß, W. Heat flux sensor to create a design space for freeze-drying development. Eur. J. Pharm. Biopharm. 2020, 153, 84–94. [Google Scholar] [CrossRef]
- Mayeresse, Y.; Veillon, R.; Sibille, P.H.; Nomine, C. Freeze-drying process monitoring using a cold plasma ionization device. PDA J. Pharm. Sci. Technol. 2007, 61, 160–174. [Google Scholar]
- Barresi, A.; Pisano, R.; Fissore, D.; Rasetto, V.; Velardi, S.A.; Vallan, A.; Parvis, M.; Galan, M. Monitoring of the primary drying of a lyophilization process in vials. Chem. Eng. Process. Process Intensif. 2009, 48, 408–423. [Google Scholar] [CrossRef]
- Assegehegn, G.; la Fuente, E.B.-D.; Franco, J.M.; Gallegos, C. Freeze-drying: A relevant unit operation in the manufacture of foods, nutritional products, and pharmaceuticals. Adv. Food Nutr. Res. 2020, 93, 1–58. [Google Scholar] [CrossRef]
- Ganguly, A.; Stewart, J.; Rhoden, A.; Volny, M.; Saad, N. Mass spectrometry in freeze-drying: Motivations for using a bespoke PAT for laboratory and production environment. Eur. J. Pharm. Biopharm. 2018, 127, 298–308. [Google Scholar] [CrossRef]
- Fissore, D.; Pisano, R.; Barresi, A. On the Methods Based on the Pressure Rise Test for Monitoring a Freeze-Drying Process. Dry. Technol. 2010, 29, 73–90. [Google Scholar] [CrossRef]
- Lewis, L.M.; Johnson, R.E.; Oldroyd, M.E.; Ahmed, S.S.; Joseph, L.; Saracovan, I.; Sinha, S. Characterizing the Freeze–Drying Behavior of Model Protein Formulations. AAPS PharmSciTech 2010, 11, 1580–1590. [Google Scholar] [CrossRef]
- Milton, N.; Pikal, M.J.; Roy, M.L.; Nail, S.L. Evaluation of manometric temperature measurement as a method of monitoring product temperature during lyophilization. PDA J. Pharm. Sci. Technol. 1997, 51, 7–16. [Google Scholar]
- Tang, X.C.; Nail, S.L.; Pikal, M.J. Freeze-Drying Process Design by Manometric Temperature Measurement: Design of a Smart Freeze-Dryer. Pharm. Res. 2005, 22, 685–700. [Google Scholar] [CrossRef]
- Tang, X.C.; Nail, S.L.; Pikal, M.J. Evaluation of manometric temperature measurement, a process analytical technology tool for freeze-drying: Part II measurement of dry-layer resistance. AAPS PharmSciTech 2006, 7, E77–E84. [Google Scholar] [CrossRef]
- Awotwe-Otoo, D.; Agarabi, C.; Khan, M.A. An Integrated Process Analytical Technology (PAT) Approach to Monitoring the Effect of Supercooling on Lyophilization Product and Process Parameters of Model Monoclonal Antibody Formulations. J. Pharm. Sci. 2014, 103, 2042–2052. [Google Scholar] [CrossRef]
- Gieseler, H.; Kessler, W.J.; Finson, M.; Davis, S.J.; Mulhall, P.A.; Bons, V.; Debo, D.J.; Pikal, M.J. Evaluation of tunable diode laser absorption spectroscopy for in-process water vapor mass flux measurements during freeze drying. J. Pharm. Sci. 2007, 96, 1776–1793. [Google Scholar] [CrossRef]
- Kuu, W.Y.; Nail, S.L. Rapid freeze-drying cycle optimization using computer programs developed based on heat and mass transfer models and facilitated by tunable diode laser absorption spectroscopy (TDLAS). J. Pharm. Sci. 2009, 98, 3469–3482. [Google Scholar] [CrossRef]
- Kuu, W.Y.; O’Bryan, K.R.; Hardwick, L.M.; Paul, T.W. Product mass transfer resistance directly determined during freeze-drying cycle runs using tunable diode laser absorption spectroscopy (TDLAS) and pore diffusion model. Pharm. Dev. Technol. 2010, 16, 343–357. [Google Scholar] [CrossRef]
- Jameel, F.; Kessler, W.J.; Schneid, S. Application of PAT in Real-time Monitoring and Controlling of Lyophilization Process. In Quality by Design for Biopharmaceutical Drug Product Development; Jameel, F., Hershenson, S., Khan, M.A., Martin-Moe, S., Eds.; Springer: New York, NY, USA, 2015; pp. 605–647. ISBN 978-1-4939-2315-1. [Google Scholar]
- Kessler, W.J.; Gong, E. Tunable Diode Laser Absorption Spectroscopy in Lyophilization. In Lyophilization of Pharmaceuticals and Biologicals; Ward, K.R., Matejtschuk, P., Eds.; Springer: New York, NY, USA, 2019; pp. 113–141. ISBN 978-1-4939-8927-0. [Google Scholar]
- Sharma, P.; Kessler, W.J.; Bogner, R.; Thakur, M.; Pikal, M.J. Applications of the Tunable Diode Laser Absorption Spectroscopy: In-Process Estimation of Primary Drying Heterogeneity and Product Temperature During Lyophilization. J. Pharm. Sci. 2018, 108, 416–430. [Google Scholar] [CrossRef]
- Fissore, D.; Pisano, R.; Barresi, A.A. Monitoring of the Secondary Drying in Freeze-Drying of Pharmaceuticals. J. Pharm. Sci. 2011, 100, 732–742. [Google Scholar] [CrossRef]


| Critical Quality Attributes | Critical Process Parameters |
|---|---|
| Product integrity and stability | Freezing Shelf temperature Cooling rate Uncontrolled vs. controlled nucleation |
| Drug potency | Primary drying Shelf temperature Chamber pressure Duration |
| Reconstitution time | Secondary Drying Shelf temperature Chamber pressure Duration |
| Cake appearance |
| PAT | Literature |
|---|---|
| NIR and Raman | [14,15,30,31,32,33,34,35,36,37,38,39,40,41] |
| Heat flux | [12,13,42,43,44,45] |
| Comparative pressure | [7,9,21,28,46,47,48] |
| MS | [16,18,47,49] |
| MTM | [2,7,9,18,26,28,47,50,51,52,53,54] |
| TDLAS | [55,56,57,58,59,60,61] |
| Shelf Temperature [°C] | Pressure [mbar] | Duration [hh:mm] | |
|---|---|---|---|
| Freezing | 20 → −45 | 1000 | 01:05 |
| −45 | 1000 | 01:00 | |
| Primary drying | −45 | 0.15 | 00:01 |
| −45 → −30 | 00:15 | ||
| −30 | 08:00 | ||
| Secondary drying | −30 → 40 | 02:20 | |
| 40 | 12:00 |
| Substance | Concentration (g/L) | Relative Batch Heterogeneity (-) |
|---|---|---|
| Sucrose | 5 | 49.41% |
| 25 | 56.32% | |
| 100 | 59.08% | |
| Mannitol | 5 | 35.00% |
| 25 | 43.59% | |
| 100 | 58.26% |
| PAT Tool | Necessary Equipment | Objective | Rec. | Remarks |
|---|---|---|---|---|
| WTM | WTMplus sensor Transponder | Product temperature determination | Major advantages over wired sensors but invasive | |
| Comp. pressure | Pirani gauge Capacitive sensor | Pressure control | Pressure control can be obtained by either sensor Pirani: gas-type-dependent Capacitive: gas-type-independent | |
| Primary drying endpoint | Measures endpoint of the whole batch | |||
| MTM | Two-chamber freeze dryer with closable intermediate valve Analysis tool | Model parameter determination Rp | Noninvasive online measurement, value valid until 2/3 of primary drying | |
| Primary drying endpoint | Pressure rise can induce melt back if the recipe is too aggressive Optimized MTM for reduced measurement time | |||
| Heat flux | Heat flux sensor Datalogger Readout software | Nucleation temperature determination | Only measurement possible; combination with controlled nucleation required | |
| Model parameter determination Kv | Value significantly underestimated; more experience must be gained | |||
| Primary drying endpoint | Value in good agreement with WTM but exact positioning necessary | |||
| Ice ruler | Ice ruler Camera Analysis tool | Primary drying endpoint | Sublimated ice mass in good agreement with ice occupation Analysis algorithm required |
Publisher’s Note: MDPI stays neutral with regard to jurisdictional claims in published maps and institutional affiliations. |
© 2022 by the authors. Licensee MDPI, Basel, Switzerland. This article is an open access article distributed under the terms and conditions of the Creative Commons Attribution (CC BY) license (https://creativecommons.org/licenses/by/4.0/).
Share and Cite
Juckers, A.; Knerr, P.; Harms, F.; Strube, J. Emerging PAT for Freeze-Drying Processes for Advanced Process Control. Processes 2022, 10, 2059. https://doi.org/10.3390/pr10102059
Juckers A, Knerr P, Harms F, Strube J. Emerging PAT for Freeze-Drying Processes for Advanced Process Control. Processes. 2022; 10(10):2059. https://doi.org/10.3390/pr10102059
Chicago/Turabian StyleJuckers, Alex, Petra Knerr, Frank Harms, and Jochen Strube. 2022. "Emerging PAT for Freeze-Drying Processes for Advanced Process Control" Processes 10, no. 10: 2059. https://doi.org/10.3390/pr10102059
APA StyleJuckers, A., Knerr, P., Harms, F., & Strube, J. (2022). Emerging PAT for Freeze-Drying Processes for Advanced Process Control. Processes, 10(10), 2059. https://doi.org/10.3390/pr10102059