Article

Optimization of Total Saponin Extraction from Polyscias fruticosa Roots Using the Ultrasonic-Assisted Method and Response Surface Methodology

1
Faculty of Pharmacy, Buon Ma Thuot Medical University, 298 Ha Huy Tap Street, Tan An Ward, Buon Ma Thuot City 630000, Vietnam
2
National Institute of Medicinal Materials, 3B Quang Trung Street, Hoan Kiem District, Ha Noi 100000, Vietnam
3
Vietnam Academy of Science and Technology, Hanoi 100000, Vietnam
4
Institute of Applied Technology and Sustainable Development, Nguyen Tat Thanh University, Ho Chi Minh City 70000, Vietnam
5
Faculty of Environmental and Food Engineering, Nguyen Tat Thanh University, Ho Chi Minh City 70000, Vietnam
*
Authors to whom correspondence should be addressed.
Processes 2022, 10(10), 2034; https://doi.org/10.3390/pr10102034
Submission received: 2 September 2022 / Revised: 3 October 2022 / Accepted: 4 October 2022 / Published: 8 October 2022

Abstract

:
Polyscias fruticosa (L.) Harms is commonly used for medicinal purposes in Vietnam. In traditional medicine, the plant is used to cure ischemia, reduce inflammation, and increase cerebral blood circulation. Triterpene saponins are the major chemical constituents found in the roots of P. fruticosa. This compound exhibited a broad spectrum of biological effects, including lowering blood sugar, suppressing tumor growth and inflammation. This study focused on optimizing the process of total saponins extraction from P. fruticosa roots using the ultrasonic-assisted extraction (UAE) method, ethanol solvent and response surface methodology, and Box–Behnken design model, then evaluating the cytotoxic effect against some cancer cell lines. The results showed that under the optimal conditions, including an extraction temperature of 60 °C and ultrasonic power of 185 W in 65 min, the maximum extraction yield and total saponin content were 14.51 ± 1.15% and 41.24 ± 1.68 mg/g, respectively. Moreover, the saponin extract had cytotoxic effects against A549, HepG2, PC-3, and Hela. The results of this study confirmed that triterpene saponin is an important chemical component which is present in a high content in P. fruticosa roots and gives rise to significant biological activities. In addition, UAE can be used as a highly efficient method for triterpene saponins extraction from P. fruticosa roots.

1. Introduction

Polyscias fruticosa L. (Araliaceae) is commonly used for medicinal and therapeutic purposes worldwide. This plant is distributed in many Asian countries, including Vietnam, China, and India [1,2]. Previous studies have reported that the extracts from P. fruticosa root and leaves contain a significantly high level of saponins, followed by polyacetylenes, polyphenols, polyscioside, alkaloids, glycosides, amino acids, essential oils, and vitamins B1, B2, B6, and C, thus, giving rise to a broad range of well-recognized pharmacological effects, including hypoglycemic, hepatoprotective, antioxidant, antimicrobial, anti-inflammatory, antidepressant, and anti-stress [3,4]. P. fruticosa is favorably used in (1) treatments against neurodegenerative and inflammatory diseases, as well as (2) strengthening the immunity system and (3) improving metabolism, memory, and fertility [5,6,7,8]. For instance, one study has shown that the saponin compounds present in the methanol extract of P. fruticosa leaves synergistically exerted inhibitory activity against α-amylase and α-glucosidase which are responsible for carbohydrate hydrolysis in diabetes treatment [9]. In addition, P. fruticosa leaves extract was reported to prevent in vivo degradation of dopaminergic neurons in larval and adult Drosophila models containing ubiquitin carboxyl-terminal hydrolase (dUCH)-knockdown, thus, being regarded as a potential agent for Parkinson’s disease treatment [10]. Moreover, the plant extract also exerted inhibitory action against the growth of Staphylococcus aureus, E. coli, Bacillus subtilis, and Candida albicans, due to the presence of saponins and polyacetylenes [11]. Despite various biological activities, the anti-cancer activity of P. fruticosa extract is still unexploited.
The major constituent of P. fruticosa root extracts is known as saponins (approximately 1.65%) [12,13]. Saponins are naturally occurring glycosides with significant structural variability and are widely recognized as a natural anti-cancer agent [14]. Recently, the mechanisms of action of plant-based saponins have been typically known to induce apoptosis and autophagy in various cancer cell types and xerograph tumors via (1) caspases and reactive oxygen species (ROS) generation, (2) upregulate peroxiredoxin (Prdx1 and Prdx2) and metalloproteinases (MMP-2 and MMP-9) proteins involved in redox homeostasis and metastasis, respectively, (3) downregulate numerous signaling pathways, and (4) alter the G2/M cell cycle [15,16,17,18,19]. While studies on saponins and their biological activity are numerous, the extraction of saponins and their effects have remained limitedly known.
The ultrasound-assisted extraction (UAE) method is recognized as a frequently used green technology with several advantages such as increasing extraction efficiency, affordability, reduced use of hazardous chemicals and solvents, minimizing the loss and degradation of the extract as well as the volatile compounds [20,21]. Many naturally occurring anti-cancer agents have been extracted with high efficiency and recovery by UAE, such as mangiferin from Mangifera indica L. [22], taxol from Taxus mairei [23], flavonoids from Celastrus hindsii [24], and tannins and polyphenols from Pistacia lentiscus [25]. The extraction of saponins with anti-cancer activity from plants such as Curcuma angustifolia, Psidium guajava, Rhus tripartite, and Calotropis gigantea, have still not been reported from P. fruticose [26,27,28,29]. Simultaneously, response surface methodology (RSM) is also commonly employed for extraction optimization of plant-based compounds and analysis of the interactions between different factors as well as the effect of each factor on the response values. Box–Behnken design (BBD) is a constituent of RSM which is suitable for three-level experimental designs [30]. The extraction processes optimized by using RSM have been reported to display improved extraction efficiency and yield, while allowing the adjustment of various factors.
Considering the aforementioned gaps, the present work performed saponin extraction from P. fruticosa roots using UAE and optimized the extraction conditions (i.e., ultrasonic power, extraction time, and temperature) using RSM. In addition, the cytotoxic effects of the obtained P. fruticosa roots extract was investigated against A549, HepG2, PC-3, and Hela cells. These findings have shown that UAE is an effective method for saponins extraction from P. fruticosa roots, thereby being used as a promising drug for the production of anti-cancer medicines.

2. Materials and Methods

2.1. Plant Samples

Fully mature and healthy P. fruticosa (at 5 years of age) were harvested between November and December 2020 in a local farm located in Dak Lak province, Vietnam (12.7100° N, 108.2378° E), then authenticated using the DNA method (Phusa Biochem Ltd. Company, Can Tho City, Vietnam). Within 24 h after harvesting, soil and dirt was washed off the plants. Afterwards, the P. fruticosa roots were separated, cut into pieces of 0.5 cm, and dried at 60 ± 5 °C for 48 h using a Memmert UF110 oven (Germany) until the moisture was below 10%. The dried roots were allowed to cool down in a vacuum desiccator (JEIOTECH VDR-25, Jeiotech Co., Seoul, Korea) and the moisture content was maintained by an Ohaus MB45 moisture analyzer balance (Pine Brook, NJ, USA). Finally, P. fruticosa root was ground into fine powder and stored in vacuum polyethylene bags for subsequent experiments.

2.2. Extraction Process

P. fruticosa root powder (50 g) was weighed and added to a three-neck flask, then dissolved completely with 70% ethanol at a solvent to material ratio of 20:1. The extraction temperature was adjusted by using an ultrasonic homogenizer (UP200Ht, Germany) and a water bath. The extraction time and power were also adjusted. The extract was separated from the solid phase by filtration using a Buchner funnel. Finally, the concentrated process yielded the extract with a moisture content of less than 15%.

2.3. Total Saponin Content Determination

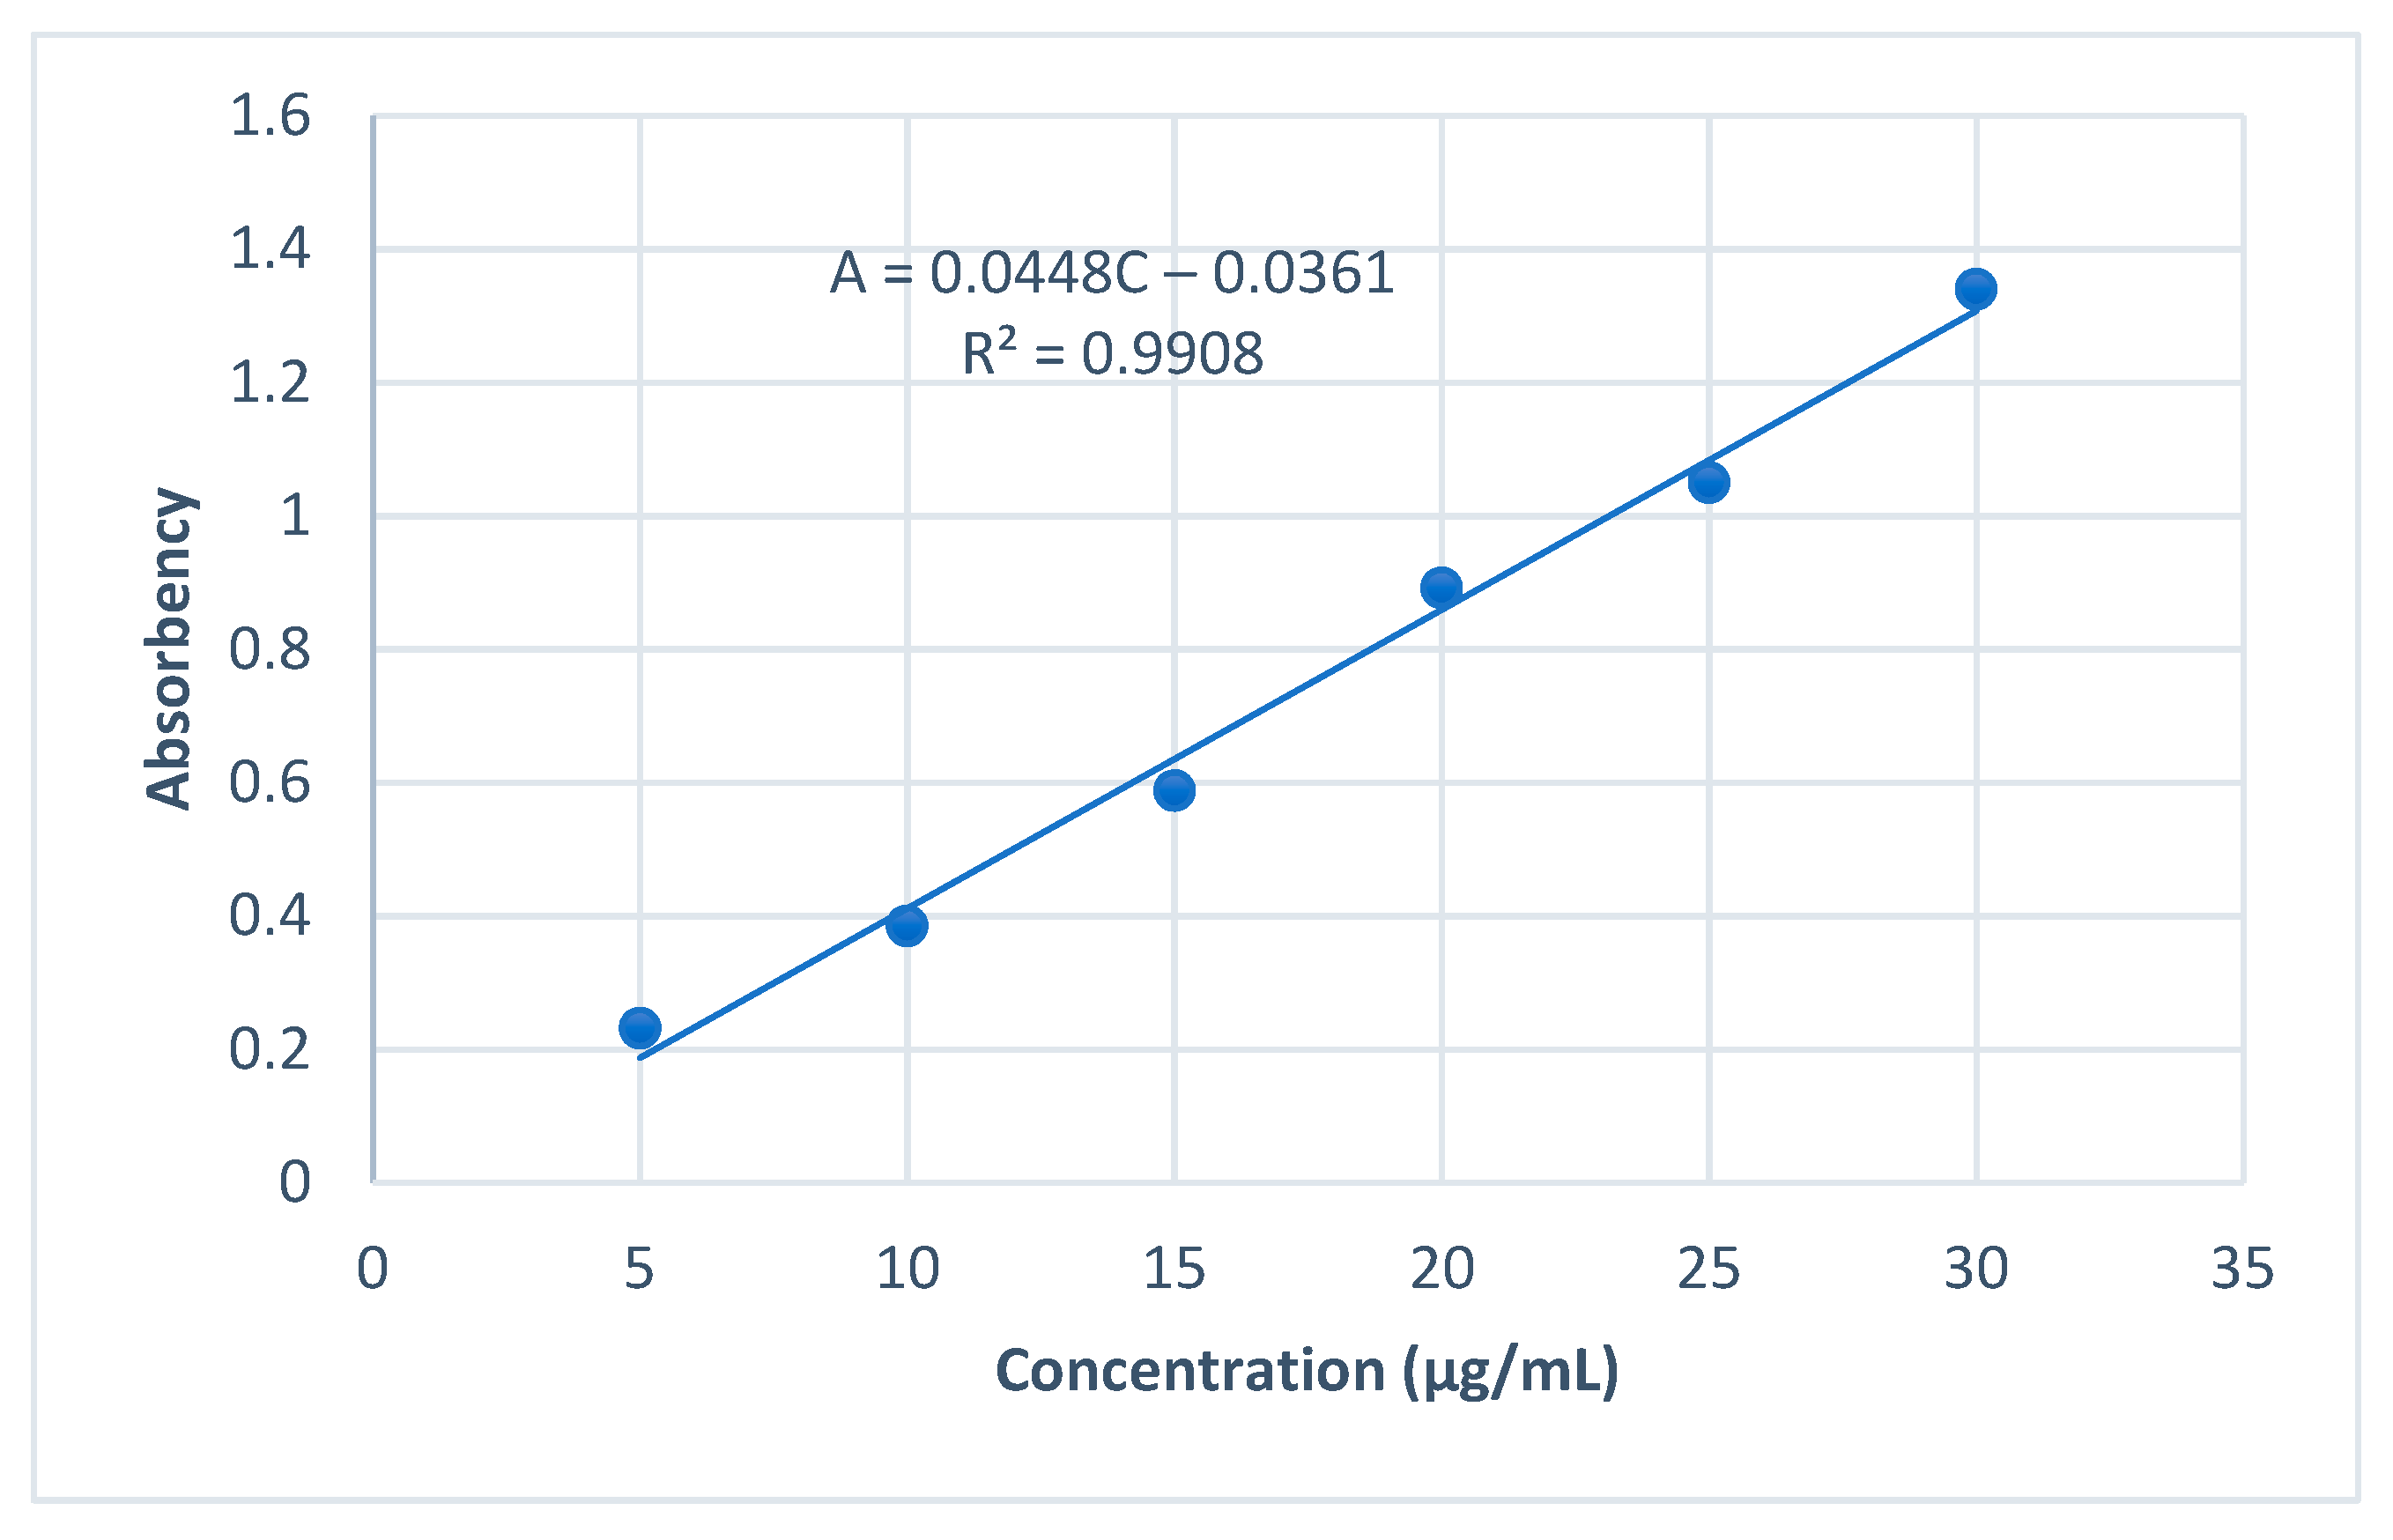
2.3.1. The Standard Curve

TSC was determined following the description of Zhaobao et al. (2001), with minor adjustments [31]. The standard curve used in the analysis was prepared as follows. Different volumes of oleanolic acid (0.1 mg/mL) from 0.5 to 3 mL were prepared. A total of 0.6 mL of prepared solvent was mixed with vanillin–acetic acid solution (5% w/v) and perchloric acid, followed by 20 min incubation at 70 °C in a water bath. Then, the tubes were cooled down for 2 min. After adding ethyl acetate to obtain 5 mL, the tubes were cooled down at room temperature. Absorbance measurements were performed at 300–800 nm using a double beam UV/Vis spectrophotometer (Shimazu, UV-1800, Japan). The maximum adsorption was at 550 nm and absorbance was measured using a glass cell (1 cm).
The linear relationship between the concentration of the standard and the absorbance value is demonstrated by Figure 1 and Equation (1) below:
A = 0.0448 C 0.0361 ; R 2 = 0.9908
where C (µg/mL) is TSC and A is the absorbance at 550 nm.

2.3.2. Determination of TSC

The extract was diluted with 0.2 mL of ethanol in a test tube and the absorbance measurement was performed. Total saponin content (TSC) was calculated using Equation (2) below:
TSC   ( mg / g ) = C     10 3     K     V W = 10 3     A + 0.0361 0.0448     K     V W
where V is the total volume of extract (mL), W is the dried sample weight (g), A is absorbance, and K is dilution.

2.4. Extraction Yield

The yield of extraction (%) was calculated as follows:
Y ( % ) = W 1 W × 100
where W1 and W are the weight of the extract and dried sample (g), respectively.

2.5. Experiment Design and Optimization

The optimization of saponin extraction employed the RSM in the Box–Behnken model. The extraction yield and TSC were dependent variables, while ultrasonic power, extraction temperature, and time were independent variables. The variables were applied to the second order polynomial equation, as described by Tran et al. (2021) [32]. Design-Expert 12.0.0 software (Stat-Ease, MN, USA) was used to produce 17 sets of process factors (Table 1 and Table 2). To confirm the model’s validity, the approximation results were examined using an Analysis of Variance (ANOVA). The best conditions were then estimated using the final model and validated using an actual experiment.

2.6. Cytotoxicity Assays

The cytotoxicity of the saponin extract from P. fruticosa roots was evaluated on four established cell lines using the MTT assay as described by Wei et al. [33]. Briefly, A549 (CLS 300114), HepG2 (CLS 300198), PC-3 (CLS 300312), and Hela (CLS 300675) were purchased from Germany and maintained at the Institute of Biotechnology, Vietnam Academy of Science and Technology. The culture medium included Eagle’s minimum essential medium (EMEM), Dulbecco’s modified Eagle’s medium (DMEM), and 10% fetal bovine serum thermoactive activity (FBS) purchased from Sigma-Aldrich (St. Louis, MO, USA). The cell lines were incubated in 95% air and 5% CO2 in a CB 220 incubator (Thermo Scientific) at 37 °C. The cytotoxicity of P. fruticosa roots was evaluated using the MTT [3-(4,5-dimethylthiazol-2-yl)-2,5- diphenyltetrazolium bromide] assay and expressed as an IC50 value [34].

2.7. Statistical Analysis

The RSM model with a Box–Behnken design was constructed by using Design Expert 12.0.0 software (Stat-Ease Inc., Minneapolis, MN, USA). The data analysis employed an analysis of variance (ANOVA) with a 95% statistical significance level by using Statgraphics Centurion 15.0 (Statpoint, Inc., Washington, DC, USA).

3. Results and Discussion

3.1. Optimization of the Saponin Extraction Process

Based on the results from the preliminary study, the ultrasound power, extraction temperature, and time were selected as 150 W, 55 °C, and 60 min, respectively. The results of extraction yield and TSC are illustrated in Figure 2.
Firstly, the extraction temperature was varied from 35 to 75 °C. Results showed that as the temperature was raised from 35 to 55 °C, the extraction yield and TSC were also proportionally increased from 9.51 to 14.32% and from 29.14 to 40.88 mg/g, respectively (Figure 2a). Both extraction yield and TSC were then slightly increased to 14.40% and 41.05 mg/g, respectively, as the temperature continued to increase to 65 °C. Finally, when the extraction temperature reached 75 °C, the yield remained unchanged while the TSC decreased to 39.17 mg/g. A possible explanation could be that the high temperatures are likely to accelerate the diffusion of compounds, leading to increased extraction yield and TSC [35]. However, excessively high extraction temperature (75 °C) would reduce the ability to extract saponins, probably due to the decomposition and denaturation of saponins, thus, leading to reduced TSC. Similar results were reported by Anh et al. [36]. Thus, to ensure extraction yield and manage energy consumption, the extraction temperature at 55 °C was selected as the baseline level (0) for subsequent experiments (Table 1).
Secondly, the extraction time was varied from 20 to 100 min. Results showed that after 60 min of extraction, both extraction yield and TSC increased significantly from 8.22 to 14.38% and from 20.45 to 41.32 mg/g, respectively (Figure 2b). During the next 20 min of extraction, these values remained relatively unchanged at 14.41% and 41.42 mg/g, respectively. This can be explained by the equilibrium achieved as the solutes initially diffused into the solvent. Prolonging the extraction time not only contributed only a negligible amount to the extraction efficiency but also consumed energy and added to the production expenses [37]. Therefore, the extraction time of 60 min was selected as the baseline level (0) for the subsequent experiments (Table 1).
Lastly, the ultrasonic power was varied from 50 to 250 W (Figure 2c). The results showed that as the ultrasonic power increased from 50 to 150 W, the extraction yield and TSC increased proportionally from 7.16 to 14.42% and from 18.21 to 41.44 mg/g, respectively. Further adding the ultrasonic power to 200 W reduced these values slightly to 41.40 mg/g and 14.38%, respectively. When the output power was at 250 W, both extraction yield and TSC decreased quickly to 13.84% and 37.87 mg/g, which can be explained by the fact that ultrasonic vibrations may tear down the plasma membrane of plants, thus, allowing for easier diffusion. However, excessive ultrasonic power would produce air bubbles which decelerated the extraction process. The surface area of contact between the sample and the solvent was reduced, resulting in decreased performance. A comparable observation was obtained by Yan et al. [38]. Hence, the ultrasonic power of 150 W was used for the further experiments (Table 1).

3.2. Statistical Prediction and Analysis Model

The results from the RSM analysis with a Box–Behnken are demonstrated in Table 3 and Table 4.
The experimental design matrix was composed of 17 experiments with 17 groups of outcomes. The model was analyzed using ANOVA and statistical significance was determined as p < 0.05. According to these results, all models were statistically significant. (Table 3). The model’s coefficients of determination (R2) were 0.9842 and 0.9553 of the response variability, confirming the model’s competence and accuracy within the restricted limits. The lack of fit of F- and p-values were non-significant (p > 0.05). This suggested that the polynomial model was accurate enough for further analysis.
Regression Equations (4) and (5) showed that all A, B, and C technological parameters had a progressive effect on the responding values. Particularly, the order of positive effects changed from C to A (C < B < A), indicating the coefficients of C, B, and A in regression Equation (4). However, in regression Equation (5), the order was different from B to A to C (B < A < C), corresponding to the coefficients of B, A, and C in regression Equation (5). The squared effects A2, B2, and C2 have little influence on the values of the regression equations.

3.3. Response Surfaces Analysis

The 3D response surfaces are demonstrated in Figure 3.
The optimization regions are represented as the dark red zones on the response surfaces. There, the objective function values of Y1 and Y2 lay within their regions of maximum values. Figure 3a shows that the response surfaces of A/B and A/C show a larger optimization area than that of B/C, so it can be seen that the influence of the two technology factors A and B is greater than that of C. Furthermore, the effect of the technological factors on Y1 was statistically varied. When extraction temperature, time, and ultrasonic power reached below 0, the Y1 value was also reduced. Conversely, when these technological factors increased from 0 to 1, the Y1 value increased to the maximum value. This can be explained by the fact that the increasing extraction temperature, time, and ultrasonic power within the experimental range accelerated the mass transfer process. In particular, a high temperature would reduce the solvent viscosity and promote the dissolution [39]. High ultrasonic power would actively break the material cell membrane and provide favorable conditions for dissolving the chemicals upon release into the environment [39]. The prolonged extraction time would ensure complete extraction of compounds from their sources.
Similarly, Figure 3b shows that the response surfaces of A/C and B/C show a larger optimal region than that of A/B. Therefore, it can be concluded that the influence of factors A and C is larger than B. These results are completely consistent with the degree of influence of technological factors on the regression Equations (4) and (5) [40,41]. Simultaneously, it can be seen that Y2 reached the maximum values as extraction temperature and time were within the range from 0 to 0.5. As aforementioned, when the temperature and time were below 0, the process of mass transfer occurred, thus, reducing the extraction yield and TSC. However, at an excessively high temperature for a long time (>0.5), the saponin content can be degraded and the TSP can be lowered [36]. The ultrasonic power did not affect the Y2 value significantly, although a maximum Y2 value was obtained when the ultrasonic power was from 0.5 to 1.
To maximize the extraction yield and TSC, optimization was performed by using second-order regression equations. The significance of the two results was determined as follows: extraction yield (Y1) at level 3 and TSC (Y2) at level 5. The predicted results showed that the extraction yield and TSC attained their maximum at an extraction temperature of 58.8 °C in 64.9 min, and 184.4 W of ultrasonic power (Table 5 and Figure 4). However, the optimal extraction conditions were selected as an extraction temperature of 60 °C and ultrasonic power of 185 W in 65 min. Under these conditions, the predicted and experimental values of extraction yield were 14.72% and 14.51 ± 1.15%; and were 42.61 mg/g and 41.24 ± 1.68 mg/g for TSC, respectively. As these two values are almost equivalent, this established model has a high degree of compatibility.

3.4. Cytotoxic Activity

The saponin extract obtained by the UAE method was evaluated for its inhibitory activity against the proliferation of A549, HepG2, PC-3, and Hela. The results are shown in Table 6. A moderate inhibition was observed for all tested cell lines, as indicated by IC50 values of 18.5, 14.3, 20.4, and 25.2 µg/mL, respectively. The IC50 values of the positive control (Paclitaxel) were 3.5, 3.8, 3.7, and 4.0 ng/mL, respectively. These results are similar to some previous studies on the genus Polyscias, in which the triterpene saponins isolated from this genus showed inhibitory effects on some cancer cell lines such as A2780, HepG2, U87MG, and AML12 [42]. These data suggest that the extraction of saponins from the roots of P. fruticosa using the UAE method has potential for biological applications.

4. Conclusions

UAE is one of the commonly used extraction methods for natural-based compounds. In this study, the UAE method and ethanol solvent were employed for saponin extraction from P. fruticosa roots. Then, RSM with a Box–Behnken design was used to optimize the process and obtain high TSC. The results from the present study showed that under the optimal conditions (ultrasonic power 185 W, extraction temperature 60 °C in 65 min), the extraction yield and TSC were 14.51 ± 1.15 (%) and 41.24 ± 1.68 mg/g, respectively. The saponin extract exhibited cytotoxic effects against A549, HepG2, PC-3, and Hela. These findings suggest that saponins extraction from P. fruticosa can be a potential anti-cancer agent for the treatment of lung, liver, prostate, and cervical cancers.

Author Contributions

Conceptualization, L.X.D., T.Q.T. and P.T.H.M.; methodology, L.T.K., H.T.T.H. and H.V.C.; software, L.T.K., H.T.T.H. and H.T.B.; validation, H.V.C. and T.T.H.; investigation, H.T.B., P.T.H.M., L.X.D. and T.Q.T.; writing—original draft preparation, L.T.K. and L.X.D.; writing—review and editing, T.T.H. and D.T.N.P.; visualization, T.Q.T. and H.T.B. All authors have read and agreed to the published version of the manuscript.

Funding

This research received no external funding.

Acknowledgments

The authors are thankful to the support of Buon Ma Thuot Medical University, Buon Ma Thuot city, Vietnam, in this study.

Conflicts of Interest

The authors declare no potential conflict of interest with respect to the research, authorship, and/or publication of this article.

References

  1. Vo, V.C. Dictionary of Vietnamese Medicinal Plants; Publishing House Medicine: Ho Chi Minh City, Vietnam, 1997. [Google Scholar]
  2. Nguyen, T.-T.-D.; Nguyen, Q.-D.; Nguyen, T.-V.-L. Kinetic Study on Chlorophyll and Antioxidant Activity from Polyscias Fruticosa (L.) Harms Leaves via Microwave-Assisted Extraction. Molecules 2021, 26, 3761. [Google Scholar] [CrossRef]
  3. Huan, V.D.; Yamamura, S.; Ohtani, K.; Kasai, R.; Yamasaki, K.; Nham, N.T.; Chau, H.M. Oleanane Saponins from Polyscias fruticosa. Phytochemistry 1998, 47, 451–457. [Google Scholar] [CrossRef]
  4. Lutomski, J.; Luan, T.C. Polyacetylenes in the Araliaceae family. Part III. Herba Pol. 1992, 2, 53–61. [Google Scholar]
  5. Nguyen, T.T.H.; Luong, K.B. Research on anti-depressant and anti-stress effects of Polyscias fruticosa. J. Med. Mater. 2001, 6, 84–86. [Google Scholar]
  6. Nguyen, T.T.H.; Nguyen, T.A.N. Study on hepatoprotective effects of Dinh Lang based on the mechanism of antioxidant effect. J. Med. Mater. 2004, 9, 85–89. [Google Scholar]
  7. Nguyen, T.T.H.; Tran, T.M.X. Memory-improving effect of alcohol extract from Dinh lang leaves (Polyscias fruticosa L. Harms, Araliaceae). Ho Chi Minh City J. Med. 2008, 12, 170–175. [Google Scholar]
  8. Boye, A.; Osei Owusu, A.; Koffuor, G.; Barku, V.; Asiamah, E.; Asante, E. Assessment of Polyscias fruticosa (L.) Harm (Araliaceae) Leaf Extract on Male Fertility in Male Wistar Rats. J. Intercult. Ethnopharmacol. 2018, 1, 45–56. [Google Scholar] [CrossRef]
  9. Hanh, T.T.H.; Dang, N.H.; Dat, N.T. α-Amylase and α-Glucosidase Inhibitory Saponins from Polyscias Fruticosa Leaves. J. Chem. 2016, 2016, 1–5. [Google Scholar] [CrossRef] [Green Version]
  10. Ly, H.T.; Nguyen, T.T.H.; Le, V.M.; Lam, B.T.; Mai, T.T.T.; Dang, T.P.T. Therapeutic Potential of Polyscias fruticosa (L.) Harms Leaf Extract for Parkinson’s Disease Treatment by Drosophila Melanogaster Model. Oxidat. Med. Cell. Longev. 2022, 2022, 1–18. [Google Scholar] [CrossRef]
  11. Bensita, M.B.; Nilani, P.; Sandhya, S.M. Studies on the Adaptogenic and Antibacterial Properties of Polyscias fructicosa (L.) Harms. Anc. Sci. Life 1999, 18, 231–246. [Google Scholar]
  12. Do, V.M.; Tran, C.L.; Nguyen, T.P. Polysciosides J and K, Two New Oleanane-Type Triterpenoid Saponins from the Leaves of Polyscias fruticosa (L.) Harms. Cultivating in An Giang Province, Viet Nam. Nat. Prod. Res. 2020, 34, 1250–1255. [Google Scholar] [CrossRef]
  13. Bernard, B.M.; Pakianathan, N.; Venkataswamy, R.; Divakar, M.C. A Pharmacognostic Report on the Leaf and Root of Polyscias fruticosa (L.) Harms. Anc. Sci. Life 1998, 18, 165–172. [Google Scholar] [PubMed]
  14. Man, S.; Gao, W.; Zhang, Y.; Huang, L.; Liu, C. Chemical Study and Medical Application of Saponins as Anti-Cancer Agents. Fitoterapia 2010, 81, 703–714. [Google Scholar] [CrossRef]
  15. Peng, L.; Hu, C.; Zhang, C.; Lu, Y.; Man, S.; Ma, L. Anti-Cancer Activity of Conyza Blinii Saponin against Cervical Carcinoma through MAPK/TGF-β/Nrf2 Signaling Pathways. J. Ethnopharmacol. 2020, 251, 112503. [Google Scholar] [CrossRef] [PubMed]
  16. Tai, W.C.-S.; Wong, W.-Y.; Lee, M.M.-L.; Chan, B.D.; Lu, C.; Hsiao, W.-L.W. Mechanistic Study of the Anti-Cancer Effect of Gynostemma pentaphyllum Saponins in the Apc Min/+ Mouse Model. Proteomics 2016, 16, 1557–1569. [Google Scholar] [CrossRef] [PubMed]
  17. Cheng, Y.; He, W.; He, Y. Gleditsia Saponin C Induces A549 Cell Apoptosis via Caspase-Dependent Cascade and Suppresses Tumor Growth on Xenografts Tumor Animal Model. Front. Pharmacol. 2018, 8, 988. [Google Scholar] [CrossRef] [Green Version]
  18. Zhou, J.-L.; Huang, X.-Y.; Qiu, H.-C.; Gan, R.-Z.; Zhou, H.; Zhu, H.-Q.; Zhang, X.-X.; Lu, G.-D.; Liang, G. SSPH I, a Novel Anti-Cancer Saponin, Inhibits Autophagy and Induces Apoptosis via ROS Accumulation and ERK1/2 Signaling Pathway in Hepatocellular Carcinoma Cells. Onco. Targets Ther. 2020, 13, 5979–5991. [Google Scholar] [CrossRef]
  19. Chen, P.-S.; Shih, Y.-W.; Huang, H.-C.; Cheng, H.-W. Diosgenin, a Steroidal Saponin, Inhibits Migration and Invasion of Human Prostate Cancer PC-3 Cells by Reducing Matrix Metalloproteinases Expression. PLoS ONE 2011, 6, e20164. [Google Scholar] [CrossRef] [Green Version]
  20. Dzah, C.S.; Duan, Y.; Zhang, H.; Wen, C.; Zhang, J.; Chen, G.; Ma, H. The Effects of Ultrasound Assisted Extraction on Yield, Antioxidant, Anticancer and Antimicrobial Activity of Polyphenol Extracts: A Review. Food Biosci. 2020, 35, 100547. [Google Scholar] [CrossRef]
  21. Gharibzahedi, S.M.T.; Marti-Quijal, F.J.; Barba, F.J.; Altintas, Z. Current Emerging Trends in Antitumor Activities of Polysaccharides Extracted by Microwave- and Ultrasound-Assisted Methods. Int. J. Biol. Macromol. 2022, 202, 494–507. [Google Scholar] [CrossRef] [PubMed]
  22. Loan, N.T.T.; Long, D.T.; Yen, P.N.D.; Hanh, T.T.M.; Pham, T.N.; Pham, D.T.N. Purification Process of Mangiferin from Mangifera Indica, L. Leaves and Evaluation of Its Bioactivities. Processes 2021, 9, 852. [Google Scholar] [CrossRef]
  23. Li, L.; Chen, Y.; Ma, Y.; Wang, Z.; Wang, T.; Xie, Y. Optimization of Taxol Extraction Process Using Response Surface Methodology and Investigation of Temporal and Spatial Distribution of Taxol in Taxus Mairei. Molecules 2021, 26, 5485. [Google Scholar] [CrossRef]
  24. Pham, D.-C.; Nguyen, H.-C.; Nguyen, T.-H.L.; Ho, H.-L.; Trinh, T.-K.; Riyaphan, J.; Weng, C.-F. Optimization of Ultrasound-Assisted Extraction of Flavonoids from Celastrus Hindsii Leaves Using Response Surface Methodology and Evaluation of Their Antioxidant and Antitumor Activities. BioMed Res. Int. 2020, 2020, 1–9. [Google Scholar] [CrossRef] [Green Version]
  25. Detti, C.; dos Santos Nascimento, L.B.; Brunetti, C.; Ferrini, F.; Gori, A. Optimization of a Green Ultrasound-Assisted Extraction of Different Polyphenols from Pistacia lentiscus, L. Leaves Using a Response Surface Methodology. Plants 2020, 9, 1482. [Google Scholar] [CrossRef]
  26. Tlili, H.; Macovei, A.; Buonocore, D.; Lanzafame, M.; Najjaa, H.; Lombardi, A.; Pagano, A.; Dossena, M.; Verri, M.; Arfa, A.B.; et al. The Polyphenol/Saponin-Rich Rhus Tripartita Extract Has an Apoptotic Effect on THP-1 Cells through the PI3K/AKT/MTOR Signaling Pathway. BMC Complement. Med. Ther. 2021, 21, 153. [Google Scholar] [CrossRef]
  27. Hasballah, K.; Sarong, M.; Rusly, R.; Fitria, H.; Maida, D.R.; Iqhrammullah, M. Antiproliferative Activity of Triterpenoid and Steroid Compounds from Ethyl Acetate Extract of Calotropis Gigantea Root Bark against P388 Murine Leukemia Cell Lines. Sci. Pharm. 2021, 89, 21. [Google Scholar] [CrossRef]
  28. Park, K.-R.; Leem, H.H.; Lee, J.; Kwon, I.K.; Hong, J.T.; Yun, H.-M. Anti-Cancer Effects of Hederoside C, a Pentacyclic Triterpene Saponin, through the Intrinsic Apoptosis and STAT3 Signaling Pathways in Osteosarcoma. Am. J. Cancer Res. 2021, 11, 4541–4550. [Google Scholar] [PubMed]
  29. Hemanth, K.M.; Sunil, K.J.; Spandana, V.; Sandeep, B.P. Anticancer Activity of Terpenoid Saponin Extract of Psidium Guajava on MCF-7 Cancer Cell Line Using DAPI and MTT Assays. Afr. J. Pharm. Pharmacol. 2021, 15, 206–211. [Google Scholar] [CrossRef]
  30. Ferreira, S.L.C.; Bruns, R.E.; Ferreira, H.S.; Matos, G.D.; David, J.M.; Brandão, G.C.; da Silva, E.G.P.; Portugal, L.A.; dos Reis, P.S.; Souza, A.S.; et al. Box-Behnken Design: An Alternative for the Optimization of Analytical Methods. Anal. Chim. Acta 2007, 597, 179–186. [Google Scholar] [CrossRef]
  31. Zhaobao, X.; Chunhong, T.; Gang, C.; Zhisong, S. Studied on corlorimetric determination of oleanolic acid in Chinese quince. Nat. Prod. Res. Dev. 2001, 13, 23–26. [Google Scholar]
  32. Tran, Q.T.; Pham, T.D.; Nguyen, T.D.; Luu, V.H.; Nghi Do, H.; Duy Le, X.; Nguyen, P.H.; Nguyen, M.C.; Luu, V.C.; Pham, M.Q.; et al. Optimization of Murrayafoline A Ethanol Extraction Process from the Roots of Glycosmis Stenocarpa, and Evaluation of Its Tumorigenesis Inhibition Activity on Hep-G2 Cells. Open Chem. 2021, 19, 830–842. [Google Scholar] [CrossRef]
  33. Wei, Y.; Chen, T.; Wang, S.; Shen, C.; Yan, S.; Song, Z.; Liu, Y.; Yang, F.; Hai, P.; Li, Y. Separation of a New Triterpenoid Saponin Together with Six Known Ones from Clematis Tangutica (Maxim.) Korsh and Evaluation of Their Cytotoxic Activities. Nat. Prod. Res. 2021, 1–8. [Google Scholar] [CrossRef] [PubMed]
  34. Mosmann, T. Rapid Colorimetric Assay for Cellular Growth and Survival: Application to Proliferation and Cytotoxicity Assays. J. Immunol. Methods 1983, 65, 55–63. [Google Scholar] [CrossRef]
  35. Richter, B.E.; Jones, B.A.; Ezzell, J.L.; Porter, N.L.; Avdalovic, N.; Pohl, C. Accelerated Solvent Extraction: A Technique for Sample Preparation. Anal. Chem. 1996, 68, 1033–1039. [Google Scholar] [CrossRef]
  36. Anh, T.T.; Thanh Huyen, N.T.; Lam, T.D. Effect of Extracting Process on Saponin Content and Antioxidant Activity of Gleditschia fera (Lour.) Merr Dried Fruit Extract. IOP Conf. Ser. Mater. Sci. Eng. 2019, 544, 012026. [Google Scholar] [CrossRef]
  37. Muhammad, U.; Zhu, X.; Lu, Z.; Han, J.; Sun, J.; Tayyaba, S.; Abbasi, B.; Ali Siyal, F.; Dhama, K.; Saqib, J. Effects of Extraction Variables on Pharmacological Activities of Vine Tea Extract (Ampelopsis Grossedentata). Int. J. Pharmacol. 2018, 14, 495–505. [Google Scholar] [CrossRef]
  38. Yan, F.; Fan, K.; He, J.; Gao, M. Ultrasonic-Assisted Solvent Extraction of Carotenoids from Rapeseed Meal: Optimization Using Response Surface Methodology: Extraction of Carotenoids. J. Food Qual. 2015, 38, 377–386. [Google Scholar] [CrossRef]
  39. Almusallam, I.A.; Mohamed Ahmed, I.A.; Babiker, E.E.; Al Juhaimi, F.Y.; Fadimu, G.J.; Osman, M.A.; Al Maiman, S.A.; Ghafoor, K.; Alqah, H.A.S. Optimization of Ultrasound-Assisted Extraction of Bioactive Properties from Date Palm (Phoenix dactylifera, L.) Spikelets Using Response Surface Methodology. LWT 2021, 140, 110816. [Google Scholar] [CrossRef]
  40. Toan, T.Q.; Phong, T.D.; Tien, D.D.; Linh, N.M.; Mai Anh, N.T.; Hong Minh, P.T.; Duy, L.X.; Nghi, D.H.; Pham Thi, H.H.; Nhut, P.T.; et al. Optimization of Microwave-Assisted Extraction of Phlorotannin from Sargassum Swartzii (Turn.) C. Ag. with Ethanol/Water. Nat. Prod. Commun. 2021, 16, 1934578X2199618. [Google Scholar] [CrossRef]
  41. Kuete, V.; Tankeo, S.B.; Saeed, M.E.M.; Wiench, B.; Tane, P.; Efferth, T. Cytotoxicity and Modes of Action of Five Cameroonian Medicinal Plants against Multi-Factorial Drug Resistance of Tumor Cells. J. Ethnopharmacol. 2014, 153, 207–219. [Google Scholar] [CrossRef]
  42. Chaturvedula, V.S.P.; Schilling, J.K.; Miller, J.S.; Andriantsiferana, R.; Rasamison, V.E.; Kingston, D.G. New Cytotoxic Oleanane Saponins from the Infructescences of Polyscias Amplifolia from the Madagascar Rainforest. Planta Med. 2003, 69, 440–444. [Google Scholar] [CrossRef] [PubMed]
Figure 1. The standard curve of oleanolic acid.
Processes 10 02034 g001
Figure 2. The effects of extraction temperature (a), extraction time (b), and ultrasonic power (c) on extraction yield and TSC content from the root of P. fruticosa (L.) Harms.
Processes 10 02034 g002aProcesses 10 02034 g002b
Figure 3. Response surface of the extraction yield (a) and TSC (b).
Processes 10 02034 g003
Figure 4. Optimal conditions by the solution of ramps.
Processes 10 02034 g004
Table 1. Independent variables and their corresponding levels.
Independent VariablesCodesVariable Range (Δ)Levels
−101
Z1: Extraction temperature (°C)A10455565
Z2: Extraction time (min)B20406080
Z3: Ultrasonic power (W)C50100150200
Table 2. Experimental design and response values.
RunABCY1 (%)Y2 (mg/g)
1−1 −107.68 ± 0.1729.90 ± 0.19
2+1−1012.79 ± 0.1334.85 ± 0.22
3−1+1010.92 ± 0.1832.30 ± 0.19
4+1+1013.72 ± 0.1536.68 ± 0.18
5−10−18.83 ± 0.2136.66 ± 0.23
6+10−112.52 ± 0.2237.57 ± 0.24
7−10+19.55 ± 0.1638.85 ± 0.21
8+10+113.88 ± 0.1141.51 ± 0.27
90−1−19.83 ± 0.1235.05 ± 0.22
100+1−113.41 ± 0.1937.39 ± 0.26
110−1+110.95 ± 0.1439.00 ± 0.28
120+1+114.05 ± 0.1540.63 ± 0.22
1300013.80 ± 0.2241.66 ± 0.25
1400013.88 ± 0.1441.52 ± 0.27
1500014.50 ± 0.1740.35 ± 0.29
1600014.44 ± 0.2239.37 ± 0.28
1700014.36 ± 0.1840.17 ± 0.24
(Y1 is the extraction yield, Y2 is TSC).
Table 3. Regression coefficient of the predicted second-order polynomial models for extraction yield and TSC.
SourceY1Y2
F-Valuep-ValueF-Valuep-Value
Model48.37<0.0001 *16.630.0006 *
A179.13<0.0001 *18.180.0037 *
B83.02<0.0001 *7.350.0302 *
C10.500.0142 *19.370.0032 *
AB7.580.0284 *0.070.7970 NS
AC0.580.4704 NS0.670.4411 NS
BC0.320.5891 NS0.110.7514 NS
A285.21<0.0001 *39.480.0004 *
B225.020.0016 *56.190.0001 *
C229.330.0010 *6.310.0403 *
Lack of fit2.480.2008 NS1.530.3368 NS
R20.98420.9553
Adj- R20.96360.8981
*p < 0.05 = significant; NS = non-significant.
Table 4. Empirical second-order polynomial model of extraction yield and TSC content.
ResponseModel EquationsR2p-Value
Extraction yieldY1 = 14.20 + 1.99A + 1.36B + 0.48C − 0.58AB − 1.89A2 − 1.03B2 − 1.11C2  (4) 0.9842<0.0001
TSC Y2 = 40.61 + 1.61A + 1.02B + 1.66C − 3.27A2 − 3.91B2 + 1.31C2  (5)0.95530.0006
Table 5. The values of the independent variable and real variables.
Independent VariablesReal Variables
ABCExtraction Temperature (°C)Extraction Time (min)Ultrasonic Power (W)
0.3750.2450.68758.864.9184.4
Table 6. The cytotoxic activity of P. fruticosa root extract against several cancer cell lines.
SampleIC50
A549HepG2PC-3Hela
P. fruticosa extract (mg/mL)18.514.320.425.2
Paclitaxel a (ng/mL)3.53.83.74.0
a positive control.
Publisher’s Note: MDPI stays neutral with regard to jurisdictional claims in published maps and institutional affiliations.

