Article

Pore Size Distribution Characterization by Joint Interpretation of MICP and NMR: A Case Study of Chang 7 Tight Sandstone in the Ordos Basin

1
Research Institute of Petroleum Exploration and Development, PetroChina, Beijing 100083, China
2
State Key Laboratory of Petroleum Resources and Prospecting, China University of Petroleum, Beijing 102249, China
3
College of Geosciences, China University of Petroleum, Beijing 102249, China
4
No. 10 Oil Production Plant, PetroChina Changqing Oilfield Company, Qingcheng 745100, China
5
Exploration and Development Research Institute of Tarim Oilfield Company, PetroChina, Korla 841000, China
6
School of Energy Science and Engineering, Henan Polytechnic University, Jiaozuo 454003, China
*
Authors to whom correspondence should be addressed.
Processes 2022, 10(10), 1941; https://doi.org/10.3390/pr10101941
Submission received: 7 August 2022 / Revised: 12 September 2022 / Accepted: 14 September 2022 / Published: 26 September 2022
(This article belongs to the Special Issue Physical, Chemical and Biological Processes in Energy Geoscience)

Abstract

:
Pore size distribution characterization of unconventional tight reservoirs is extremely significant for an optimized extraction of petroleum from such reservoirs. In the present study, mercury injection capillary pressure (MICP) and low-field nuclear magnetic resonance (NMR) are integrated to evaluate the pore size distribution of the Chang 7 tight sandstone reservoir. The results show that the Chang 7 tight sandstones are characterized by high clay mineral content and fine grain size. They feature complex micro-nano-pore network system, mainly composed of regular primary intergranular pores, dissolved pores, inter-crystalline pores, and micro-fractures. Compared to the porosity obtained from MICP, the NMR porosity is closer to the gas-measured porosity (core analysis), and thus can more accurately describe the total pore space of the tight sandstone reservoirs. The pore throat distribution (PTD) from MICP presents a centralized distribution with high amplitude, while the pore size distribution (PSD) derived from NMR shows a unimodal distribution or bimodal distribution with low amplitude. It is notable that the difference between the PSD and the PTD is always related to the pore network composed of large pores connecting with narrow throats. The PSD always coincides very well with the PTD in the very tight non-reservoirs with a much lower porosity and permeability, probably due to the pore geometry that is dominated by the cylindrical pores. However, a significant inconsistency between the PSD and PTD in tight reservoirs of relatively high porosity and low permeability is usually associated with the pore network that is dominated by the sphere-cylindrical pores. Additionally, Euclidean distance between PSD and PTD shows a good positive correlation with pore throat ratio (PTR), further indicating that the greater difference of pore bodies and pore throats, the more obvious differentiation of two distributions. In summary, the MICP and NMR techniques imply the different profiles of pore structure, which has an important implication for deep insight into pore structure and accurate evaluation of petrophysical properties in the tight sandstone reservoir.

1. Introduction

With the growth in energy needs and advances in horizontal drilling and hydraulic fracturing techniques, tight oil reservoirs have become a focus for hydrocarbon exploration and exploitation in recent years [1,2]. In China, the Chang 7 of the Ordos Basin was regarded as one of the most typical lacustrine tight reservoirs, which possessed enormous potential for exploration and exploitation [3]. A large amount of hydrocarbon accumulates in the pore systems of these tight reservoirs, and these pore structures are one of the dominant factors controlling the properties of the reservoir rocks [4]. Therefore, a full understanding of pore geometry is critical for accurately evaluating the petrophysical properties and optimizing petroleum extraction from the tight reservoir.
It is a challenge to evaluate the pore structure of tight oil reservoirs due to the broad PSD, with a significant portion being nanoscale pores and substantially constricted pore throats [5,6,7,8]. However, the pore network system composed of pore bodies and their connecting throats controls the crucial storage space of hydrocarbon and the significant flowing pathway during petroleum accumulation and extraction. Therefore, it is highly important to effectively evaluate PSD and obtain pore throat distribution (PTD).
Mercury injection capillary pressure (MICP) has been a viable tool for reservoir rock characterization for over six decades [9,10] since Purcell [11] first introduced this technique into the petroleum industry. It was widely used to measure the porosity and PSD in porous materials [12], because it is fast and provides abundant information about pore structure and a wide range of pore sizes [13,14]. Washburn [15] mentioned a capillary tube model, which laid theoretical foundation for porous material pore structure determination using MICP method. This model gives an assumption that porous media is comprised of capillary tubes with different diameters. The PSD can be calculated according to a pressure–volume curve produced by mercury intrusion process [12].
Low-field nuclear magnetic resonance (NMR) is an important method for evaluating pore structure, fluid properties, and petrophysical properties of rocks [16,17,18,19,20,21]. This technique was widely used in the evaluation of various petroleum reservoirs, such as clastic rocks, carbonate rocks, and volcanic rocks, for nearly five decades [11,22,23,24,25]. In recent years, it has become an indispensable tool for characterizing reservoir properties, such as PSD, porosity, permeability, wettability, fluid movability, and saturation, due to the nondestructive feature, convenience in sample processing, and short test time [6,26,27,28,29].
Except for advantages described above, however, both methods also exhibit their own limitations. First, MICP allows calculation of the PTD, while NMR allows the PSD, due to the discrepancy of mercury intrusion method and fluid relaxation mechanism in porous materials [10,11,15,17]. In addition, MICP can usually identify pores down to about 3 nm due to the limitation of injection pressure. Excessive mercury injection pressure above about 70 MPa probably results in micro-fractures or some pore structure distortion occurring at the lower pore size limit (~3 nm) [12,30]. The NMR T2 spectrum can be used to describe the entire pore distribution range, but the conversion of transverse relaxation time to pore size is constrained by many factors, such as lithology, paramagnetic minerals, and fluid types [17,20]. Consequently, it is necessary to combine these two methods to interpret pore size distribution of tight sandstone reservoir.
In this paper, based on the analysis of petrology and pore characteristics, we report the combination of MICP and NMR techniques that is performed to evaluate pore structure and calculate pore structure parameters and PSD. Additionally, we also make a comparison between the PSD derived from NMR and the PTD determined by MICP and give a detailed explanation of their similarities and differences. In short, a comprehensive understanding of the characteristics of pore structure of tight sandstone reservoir is highly important for accurate evaluation of the petrophysical properties of reservoir rocks and a successful exploitation.

2. Materials and Methods

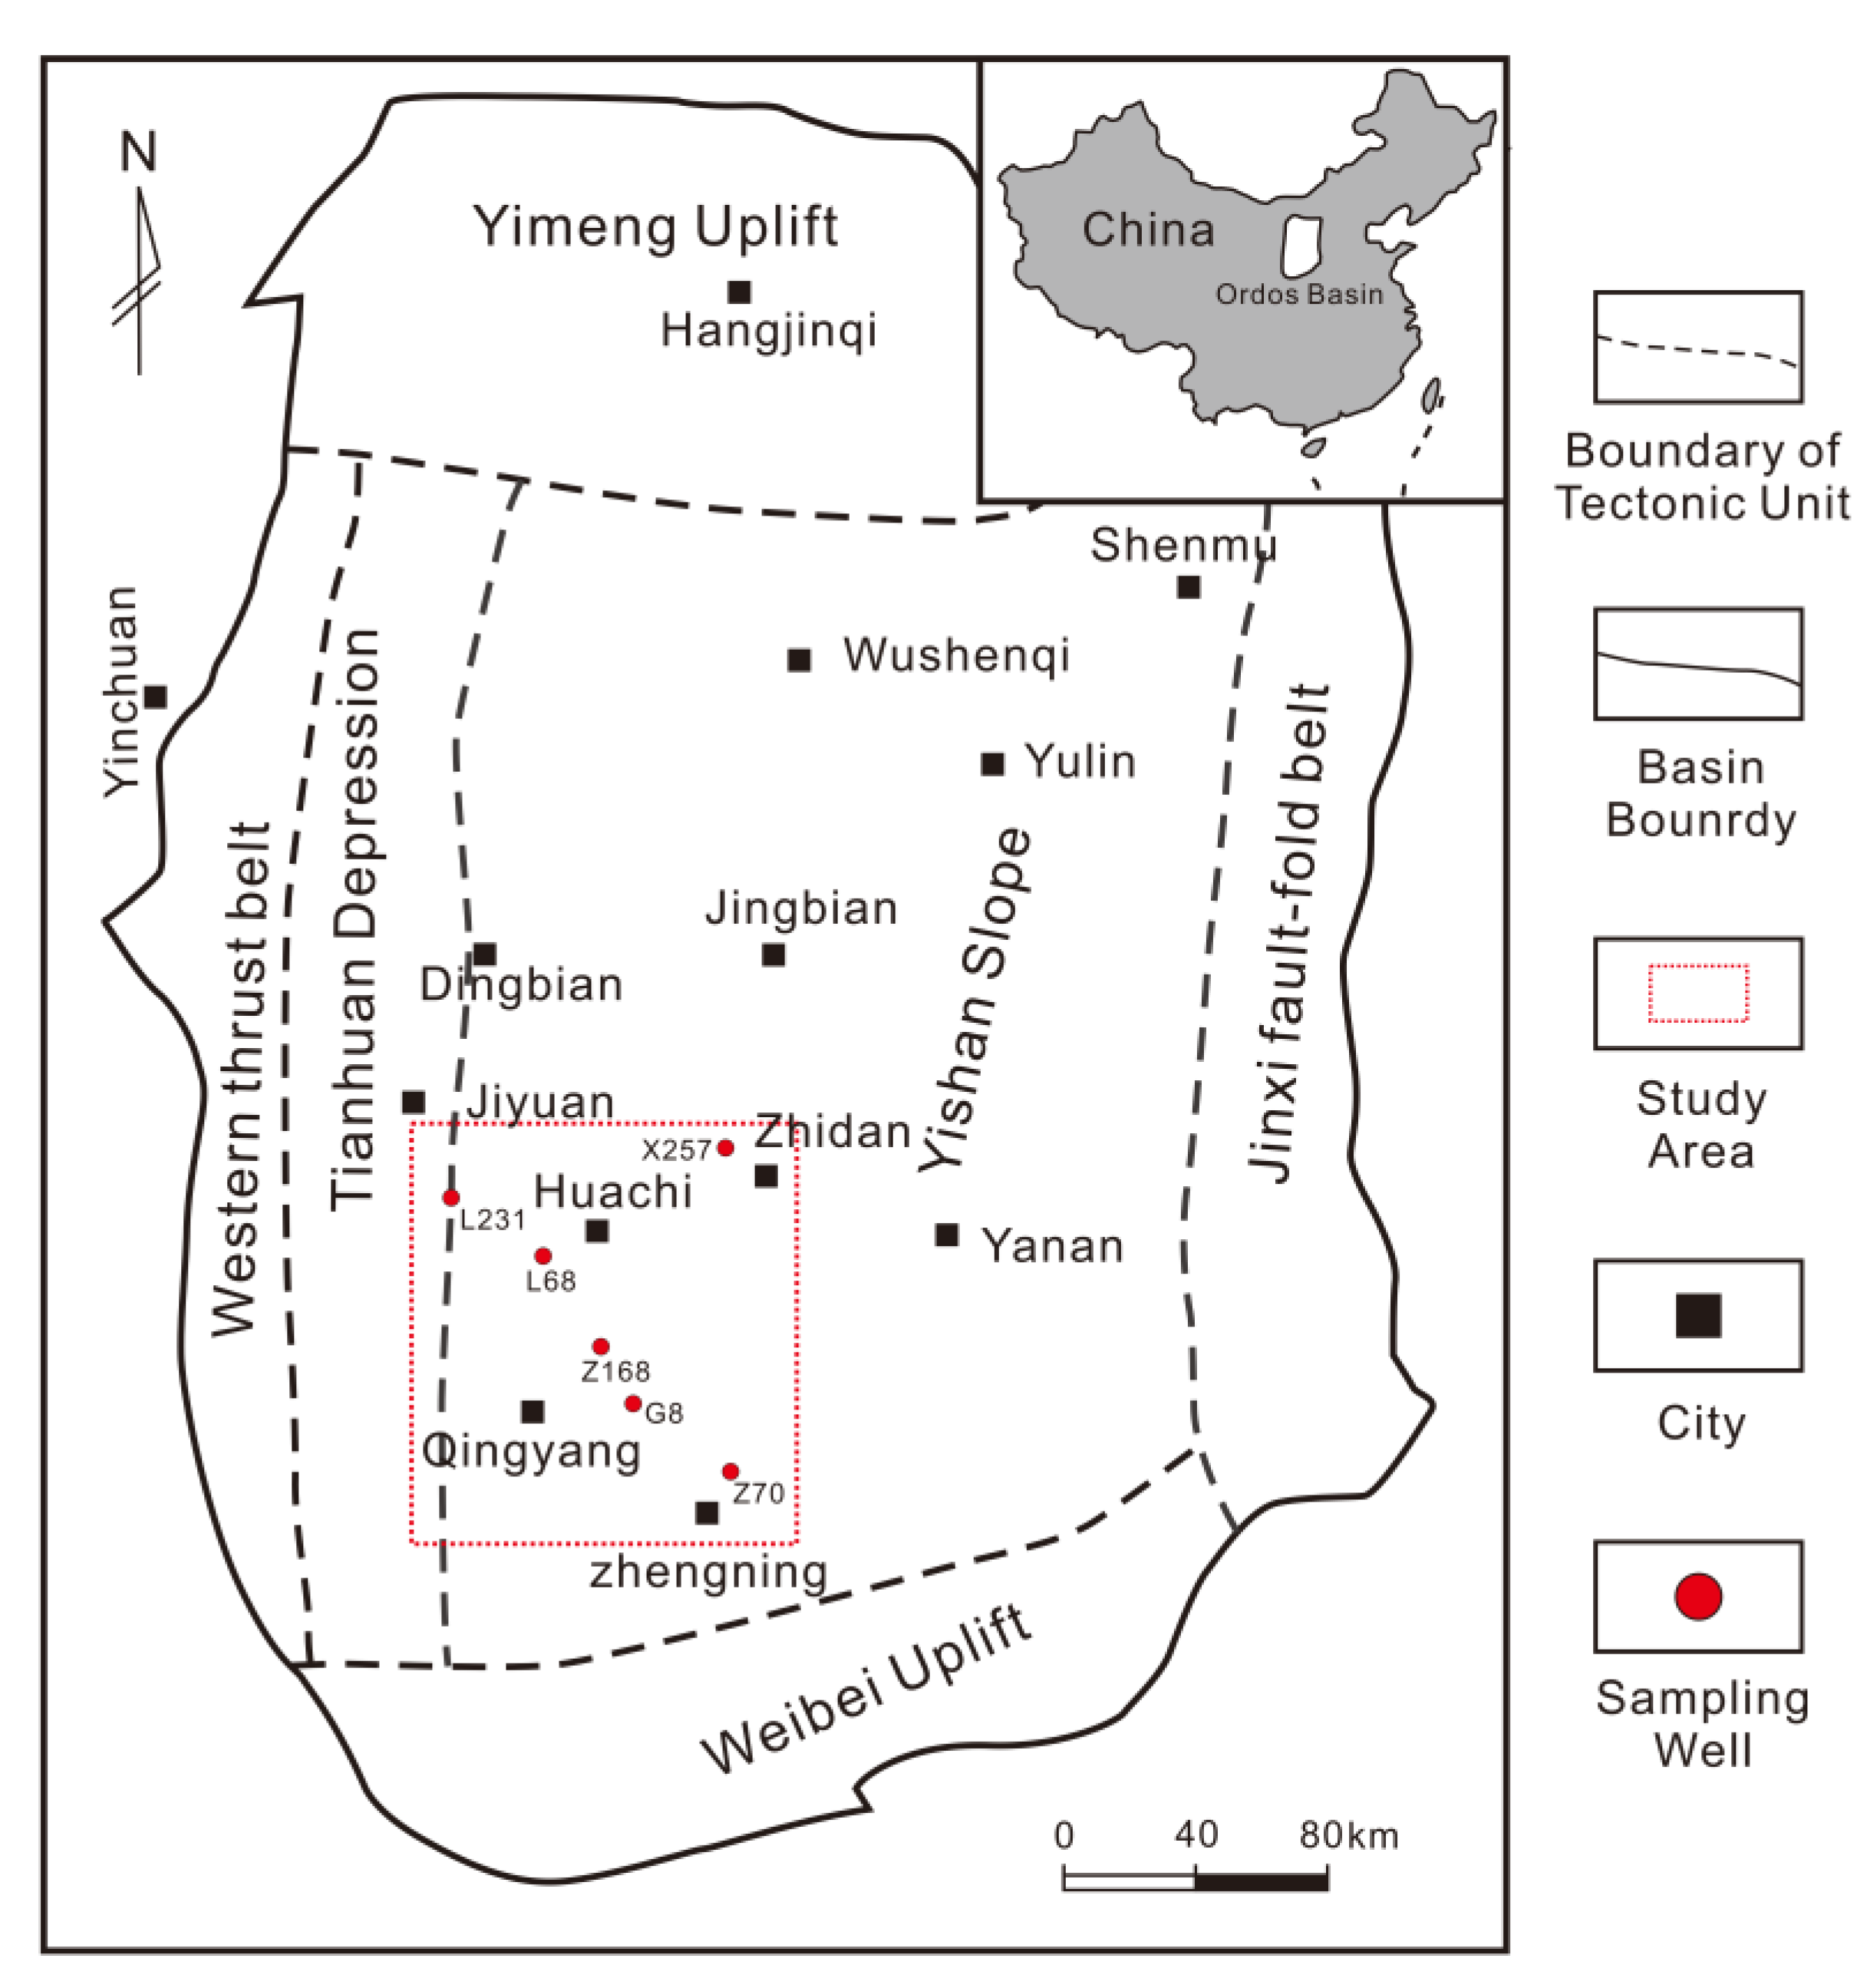
2.1. Geological Setting and Samples

The Ordos Basin is located in the center of China (Figure 1), which has undergone multiple tectogeneses and was a multicycle superimposed basin, with the sediment changing from marine-continental transitional faces to continental faces in the Triassic [31,32]. The Chang 7 deposited a set of lacustrine detrital sediment rocks with a thickness of approximately 100 m and is regarded as one of the most typical lacustrine tight reservoirs in China, which mainly consists of fine sandstone and siltstone of gravity flow in delta front faces, as well as dark mudstone and black shale of semi-deep and deep lacustrine faces [33]. Due to a deep burial depth (>2000 m) and long-time evolution, the Chang 7 is significantly influenced by mechanical compaction, dissolution, and cementation, including clay minerals, carbonate, and silicate cements, and has formed a set of very tight sandstone reservoirs [34].
Sixteen core samples were collected from six wells in the southwest area of the Ordos Basin (Figure 1). These samples are from the Chang 7 tight sandstone succession of the Upper Triassic Yanchang Formation, with a well depth interval of about 1720–2070 m. Cylindrical plugs drilled from those samples were prepared with about 2.5 cm in diameter and length, and were cleaned by hot extraction solvent. The porosity and permeability analysis, low-field NMR, and MICP analysis were then performed successively on these samples. In addition, thin section analysis, SEM, mineral composition, and grain size analysis were conducted to determine petrology and pore characteristics.

2.2. MICP

The MICP method is based on the fact that mercury behaves as a nonwetting liquid when in contact with most substances [11]. Consequently, mercury does not spontaneously penetrate into the openings and pores of these substances unless pressure is applied. With increasing pressure, smaller pore throats are invaded by mercury [35].
The capillary pressure (Pc) required for mercury to penetrate pores is a function of the contact angle (θHg) between mercury and the porous material to be intruded, its gas/liquid surface tension (σHg), and pore radius (rp) [12]. This relationship was provided by the Young–Laplace equation with the assumption of cylindrical pores as the Washburn equation [36,37]:
P c = 2 σ Hg cos θ Hg r p
Equation (1) indicates that, with increasing pressure, mercury progressively intrudes into narrower pores for constant values of σHg and θHg. The volume of mercury penetrating the pores is measured directly as the increasing applied pressure.
The mercury porosimetry experiments were performed with a Micromeritics AutoPore IV 9520 porosimeter. The results of mercury porosimetry are generally displayed as graphs of capillary pressure versus cumulative mercury intrusion. The equivalent pore radius was computed according to the capillary pressure using the Washburn equation with Pc ranging from approximately 0.003 to 413 MPa, using a contact angle of 130° [38] and surface tension of 485 dyne/cm [39]. Therefore, the corresponding pore radius ranges from 1.8 nm to 218 μm.

2.3. NMR

In porous rocks, the transverse relaxation T2 of NMR measurement is composed of surface relaxation, bulk relaxation, and diffusion relaxation, which can be expressed as Equation (2) [17,40]:
1 T 2 = 1 T 2 B + 1 T 2 S + 1 T 2 D = 1 T 2 B + ρ 2 S V + D γ 2 G 2 TE 2 12
where T2B (ms) is the bulk relaxation time, T2S (ms) is the surface relaxation time, T2D (ms)is the diffusion-induced relaxation time, ρ2 (μm/ms) is the surface relaxivity, S is the surface area of pore and V is the volume of the pore, D (μm2/ms) is the molecular diffusion coefficient of the pore fluid, G (G/cm) is the field-strength gradient, γ is the gyromagnetic ratio and TE (ms) is the inter-echo spacing used in the CPMG sequence.
The bulk relaxation is produced by interactions of hydrogen nuclei of fluid, which can be negligible due to its long relaxation time compared to the surface relaxation [17]. Diffusion relaxation occurs in the inhomogeneous (gradient) magnetic field and it is almost close to zero in the homogeneous magnetic field [41]. So, the transverse relaxation T2 can be approximated as the surface relaxation generated by interactions between fluid nuclei and solid interface (pore walls). That is, Equation (2) is converted to Equation (3):
1 T 2 1 T 2 S = ρ 2 S V
This relationship is based on an important assumption that diffusion within the pore is in the fast diffusion, which is valid when ρ2γ/D << 1 [40]. In the condition of the fast diffusion, the limit diffusion across the pore is much more rapid than the relaxation at the pore surface [42] and is met in most reservoir rocks [43].
The ρ2 is close to a constant coefficient when the measured samples come from the same region, same formation, and similar lithology [20]. Therefore, the surface relaxation is a function of the surface-to-volume ratio (S/V) of the pores, which means that the small pores have short T2 times and the large ones have long T2 times. Additionally, the S/V depends on pore geometry. Consequently, Equation (3) is converted to Equation (4):
1 T 2 = ρ 2 F s R
where Fs is the shape factor, which is a constant with values of 3 and 2 for spherical and cylindrical pores [44], respectively. R is pore radius (μm). Therefore, there is a linear relationship between the value of T2 and pore size for the same area and formation and negligible lithological difference in clastic rocks.
The NMR measurements were conducted on a SPEC-023 instrument. It has a constant magnetic field strength of 1200 Gauss and a resonance frequency of 2.38 MHz. The measurement parameters were set as follows: echo spacing, 0.2 ms; waiting time, 3 s; echo numbers, 2048; and number of scans, 64 [27]. After the measurements, transverse relaxation time (T2) distributions were computed by multi-exponential inversion of the echo data with 64 preset decay times logarithmically spaced from 0.1 ms to 10 s [17]. The samples were fully saturated in water for 48 h under an ambient pressure of 30 MPa. In addition, the centrifugation was performed on the 100% water-saturated core plugs under a centrifugal force of 2.76 MPa (400 psi) for 1.5 h to obtain irreducible water condition. The centrifuge pressure used in the centrifuge experiment, which is an empirical value derived from the repeated experiment. The higher centrifugal force may induce a change in the pore structure [45]. The T2 spectrum at the water-saturated and irreducible conditions are obtained successively.

3. Results

3.1. Petrology and Pore Characteristics

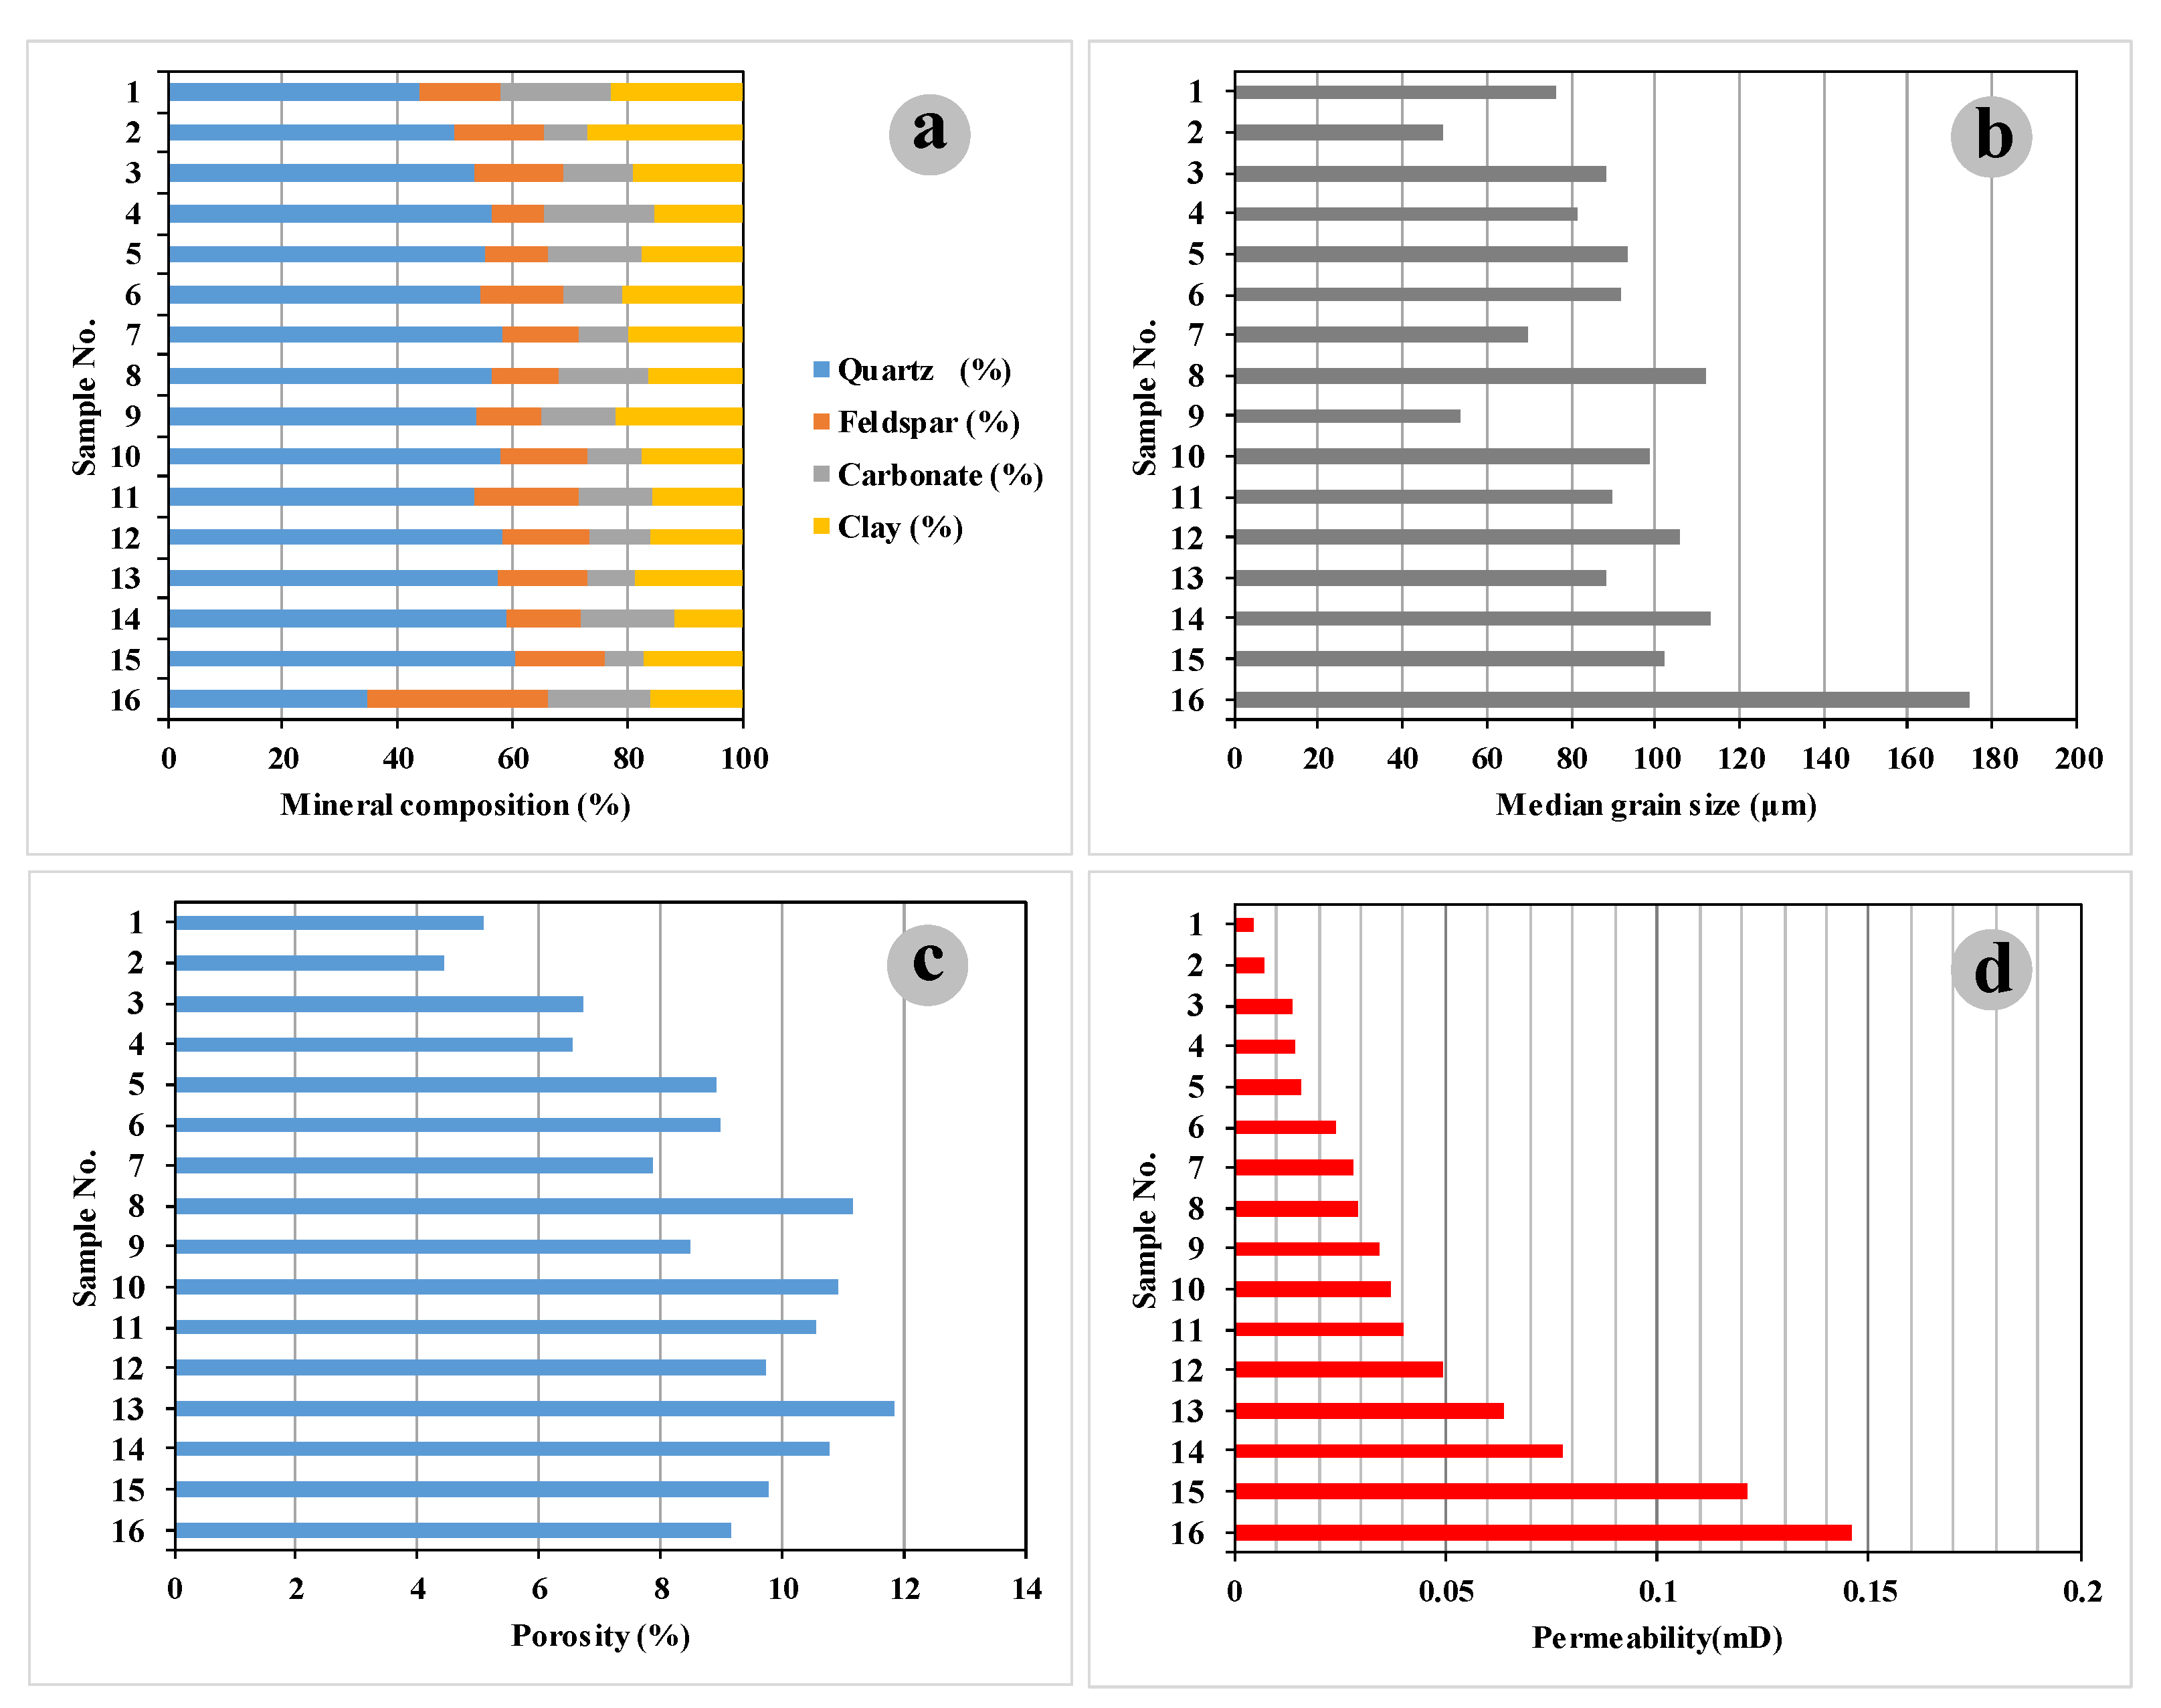
3.1.1. Petrology Characteristics

The Chang 7 tight sandstones in the study area are mainly made up of lithic arkose and feldspathic litharenite [12,34]. The content of quartz mainly ranges from about 50% to 60%, except for one sample with a lower quartz content of about 35% (Figure 2a). As a sedimentary debris, feldspar generally have lower content of about 10–15% compared with quartz. The content of carbonate minerals shows large fluctuations, ranging from 5% to 20%, while that of clay minerals is generally high and relatively stable from 15% to 20% (Figure 2a). In addition, skeleton particles are mainly composed of quartz, feldspar, and lithic fragment (Figure 3a,b), while the interstitial material is mainly composed of high content clastic clay matrix, as well as cements dominated by carbonate, silicate, illite, and chlorite minerals (Figure 3c,j–l). Laser grain size analysis shows that the median grain size of most samples mainly ranges from 80 to 100 μm (Figure 2b), which reveals a predominantly fine size fraction in the Chang7 tight sandstones (Figure 3a–f) [46]. Therefore, the Chang 7 tight sandstones are composed of silt fine clastic grains and are characterized by high content of clay minerals or carbonate carbon minerals. Moreover, fine grain structure and high clay content lead to strong compaction and the precipitation of carbonate cements in the pores, which finally leads to complex pore structure and micro-nano pore throat system in the Chang 7 tight sandstones (Figure 3).
The porosity varies from 4% to 12% and can be divides into two parts, mainly ranging from 4% to 6% and from 8% to 10% (Figure 2c). The permeability shows significant change, mainly ranging from about 0.01 mD to 0.10 mD (Table 1, Figure 2d). Additionally, the lower part of porosity (4–6%) always corresponds to the ultra-low permeability, less than 0.02 mD, indicating that such tight sandstones are generally not effective in the tight oil accumulation [47] and are non-reservoir rocks, such as samples of No.1 to No.4.

3.1.2. Pore Characteristics

Four types of pores are recognized in the Chang 7 tight sandstone reservoirs, including residual intergranular pores, dissolved pores, inter-crystalline pores, and micro-fractures (Figure 3). Residual primary intergranular pores are relatively larger in size but fewer in number, with pore diameter mainly ranging from 10 to 100 μm. The shape of these pores is usually triangular or polygonal with smooth and straight edges (Figure 3d,e,g) [12]. Fine throats (nanoscale) always occur in the position of grain contacts due to a fierce mechanical compaction and presence of grain coating chlorite (Figure 3d,e,g) [2]. These large residual intergranular pores connected with fine throats can form a special pore network with large pore bodies and small pore throats. Dissolved pores are produced by the dissolution of unstable minerals, such as feldspar and carbonate cement (Figure 3e,h) [48], which are an important component to the pore space of the Chang 7 tight sandstones. These pores are characterized by rather irregular pore surfaces and large pore sizes, generally ranging from several hundred nanometers to 100 μm. These pores are usually connected by fine throats due to a heterogeneity of the grain dissolution. Inter-crystalline pores are widely distributed and generated from the precipitation of authigenic quartz, albite, ankerite, and clay minerals (Figure 3i–l), including illite, chlorite, and mixed-layer illite/smectite, in intergranular pores and dissolved pores. The dimensions of these pores are generally smaller than several microns, and the inter-crystalline pores within authigenic quartz or albite are larger than those within clay minerals ranging within the nanoscale (Figure 3i–l). These pores often work as throats connecting other pores, such as residual intergranular pores, dissolution pores, and relatively large inter-crystalline pores.
Micro-fractures are also observed in some samples, with widths ranging from 2 μm to 10 μm, while their lengths were up to 10 mm (Figure 3f). These are significant for the percolation capacity of the tight reservoir due to the connection to large of micro pores.

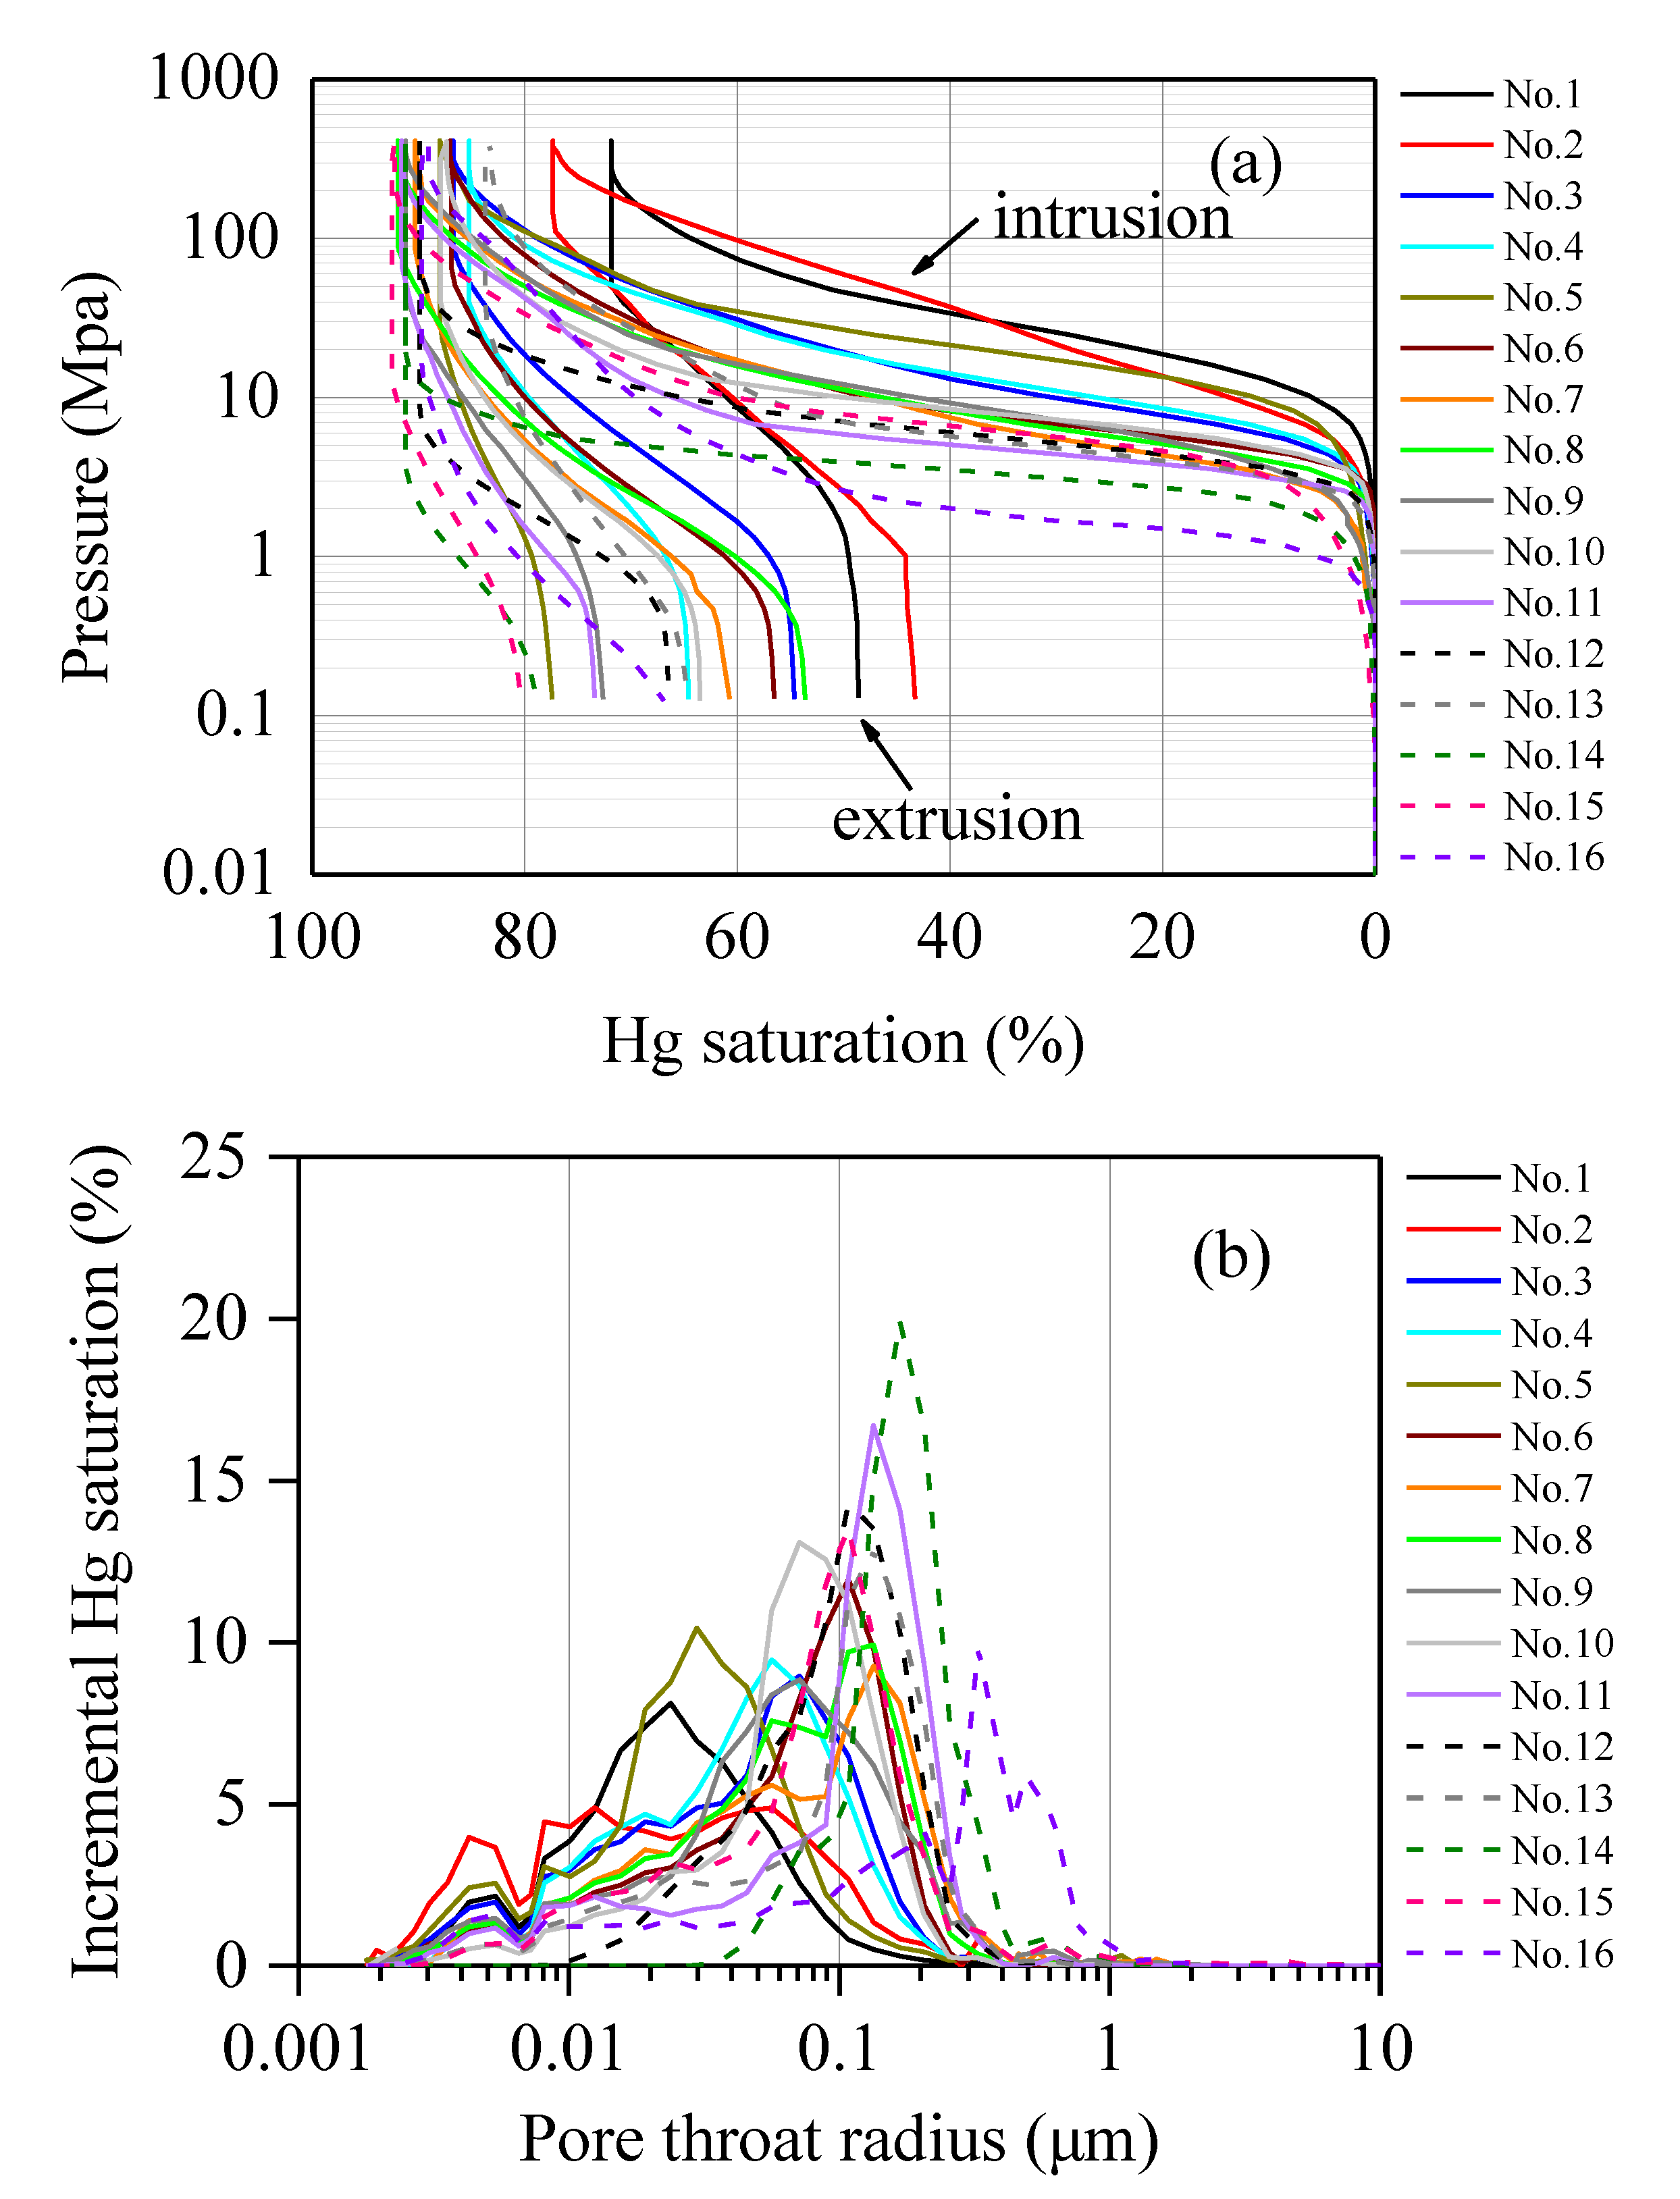
3.2. MICP Curves and Parameters

MICP is a useful tool to obtain the information of pore structure and pore throat distribution (PTD) [9,10,49,50]. MICP curves can directly and visually reflect pore geometry characteristics and are easily used to calculate pore structure parameters and PTD. The main mercury injection capillary pressure of the Chang 7 tight sandstone distributes from 1 MPa to 100 MPa (Figure 4a), indicating that the dominant portion of pore throats is in the nanoscale (0.00735–0.735 μm). The displacement pressure (Pd) is between 0.94 MPa and 6.82 MPa, with an average value of 2.92 MPa, while the median capillary pressure (Pc50) ranges from 2.9 MPa to 59.51 MPa, with an average value of 16.33 MPa, suggesting that hydrocarbon cannot easily enter into these tight reservoirs without overpressure (Table 1). In addition, the PTD has a wide distribution, mainly ranging from 0.01 μm to 1 μm (Figure 4b). The maximum pore throat radius (rmax) is between 0.94 μm and 6.82 μm, with an average value of 2.92 μm. The median pore throat radius (r50) ranges from 0.012 μm to 0.284 μm, with an average value of 0.085 μm [47]. The line section slope of the MICP curves is a visual indication of pore throat sorting characteristics that the smaller is the line slope, and the better is the sorting quality, which can be quantified by sorting coefficients (So) of approximately 0.81 to 2.03, with an average So of 1.51 (Table 1). In short, Chang 7 tight sandstone reservoir is characterized by high capillary pressure, a dominant nanoscale pore throat, and poorer sorting.
The mercury intrusion and extrusion curves exhibit significant hysteresis (Figure 4a), indicating that a large amount of injected mercury remains in the pore network after complete mercury withdrawal. This phenomenon is intimately related to the crucial role of the connectivity of the pore network system in filling the pore space with mercury [51]. During the extrusion process, mercury remains trapped in the pore bodies of the ink-bottle pores due to the difference in capillary pressure between the pore bodies and pore throats [26,52]. This difference can be roughly defined by the parameter of the pore throat ratio (PTR). The PTR is the average ratio of the pore volume and the throat volume derived from the mercury injection curve and ejection curve, respectively. The PTR ranges from 1.27 to 7.44, with an average of 3.35 (Table 1). Additionally, a large amount of mercury trapped in the pores can also be quantified by the pore structure parameters, e.g., the maximum mercury saturation (Smax) and mercury withdrawal efficiency (We). The maximum mercury saturation (Smax) ranges from 71.83% to 92.46% and its mean is 87.33%. In addition, mercury withdrawal efficiency (We) is between 11.85% and 44.04%, with an average value of 26.75%. It is apparent that about 40% to 80% of mercury remains trapped in the pore network (Figure 4a).

3.3. NMR T2 Spectrum

The NMR T2 spectra of the Chang 7 tight sandstones mainly exhibit the unimodal or bimodal distributions (Figure 5), which generally occur in sandstone and shale rocks [27,53]. The T2 spectrum mainly distributes from 0.1 to 100 ms, showing a unimodal distribution, unimodal distribution with a positive skewness, or bimodal distribution (Figure 5). According to Equation (4), the T2 spectra of saturated water implies the PSD of rocks, and the long T2 relaxation time indicates the large pores and the short T2 relaxation time indicates the small pores. Therefore, the samples with unimodal distribution would have larger percentage composition of small pores than those with bimodal distribution.
As is shown in Figure 5, the left peak (or the peak of the unimodal distribution) and right peak of the T2 distribution present at 1 to 10 ms and 10 to 100 ms, respectively. The peak number and location of the T2 distribution can reflect the pore type of rocks. The left peak is representative of the micro pores mainly composed of clay inter-crystallite pores and micro dissolved pores (Figure 3), while the right peak is indicative of residual primary intergranular pores and some macro pores generated from particle dissolution, which are the dominant contribution to permeability. In addition, the T2 geometric mean (T2gm) ranges from 0.78 to 5.94 ms, with an average value of 3.46 ms [27], which further indicates a tight pore system has been developed in the Chang 7 tight sandstones.
Fluid flow in a porous media is mainly controlled by PSD, interfacial tension, and wettability [6,28,36]. For porous reservoirs, the interfacial tension and wettability changes would significantly affect oil migration and recovery [54,55,56,57]. However, it is generally believed that the interfacial tension and wettability of the core plugs are consistent, considering that they are from the same stratum and contain similar lithology. Therefore, the fluid flow is mainly controlled by pore throat size during centrifugation.
After centrifugation, the right peak is almost completely absent except in sample No. 5 and No. 11, while the left peak remains, indicating that the fluid in the small pores is not easy to flow (Figure 5). The fluid trapped in the large pores (>10 ms) for No. 5 and No. 11 is probably due to occurrence of a large amount of the complex pore geometry that is composed of large pores connected with fine throats (or ink bottle pores) [27,58]. The irreducible fluid is mainly around 0.1 to 10 ms (Figure 5), consisting of clay-bound water and capillary-bound water that are limited in clay micro pores and small capillary pores, respectively. This phenomenon is mainly related with the sufficient molecular adsorption force and capillary pressure generated from the pore fluid interaction with the clay mineral surface or pore walls of the rocks. The T2cutoff is a relaxation time threshold that divides the T2 distribution into the movable fluid and irreducible fluid, ranging from 0.87 to 7.73 ms, with an average value of 3.00 ms (Table 2) [27]. The movable water saturation (Sm) of Chang 7 tight sandstone ranges from 32.01% to 84.84%, with an average value of 50.53%, while the irreducible water saturation (Sir) ranges from 15.06% to 67.99%, with an average value of 49.47% (Table 2). Consequently, the movable water volume is about a half of the total pore volume. This result suggests that these micro pores contribute a significant portion of the storage space but may not be important for oil or gas percolation in tight sandstone reservoirs.

4. Discussion

4.1. Comparison of Pore Volume and Size from MICP and NMR
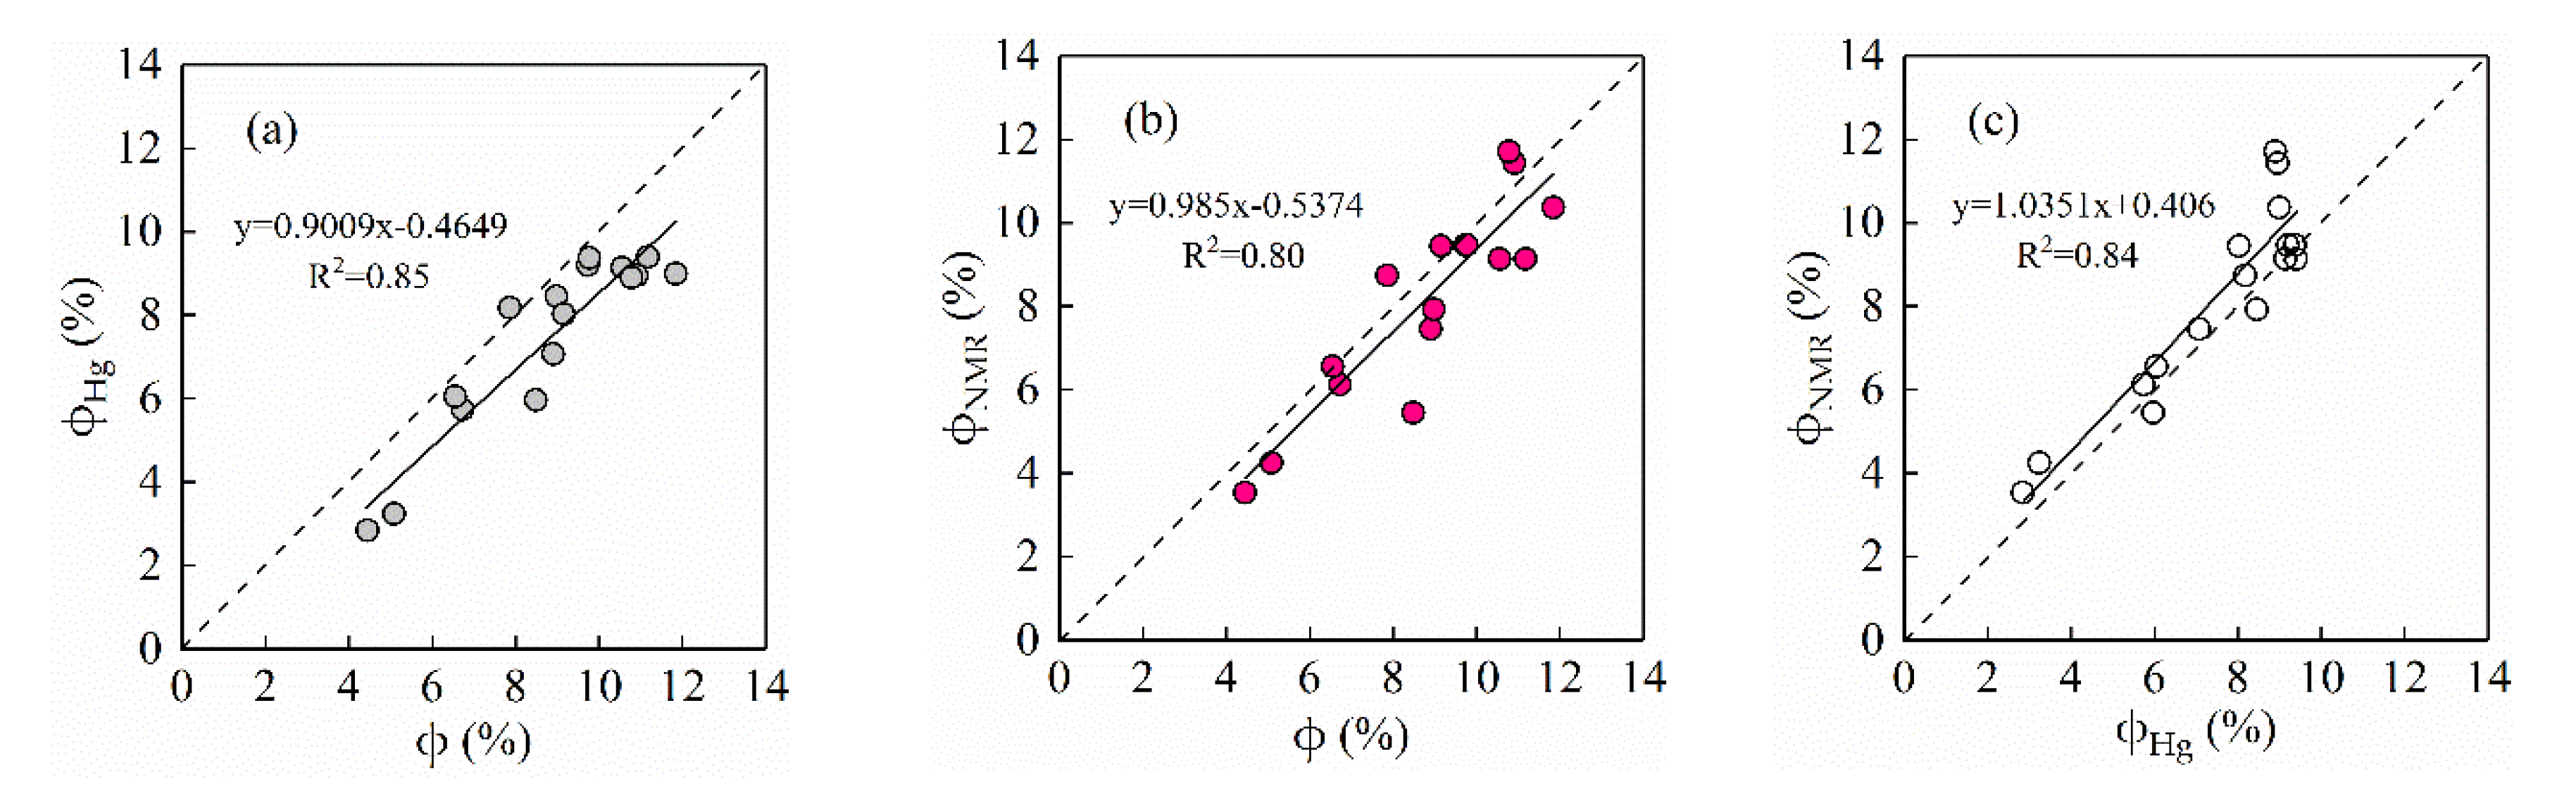
Petrophysical parameters obtained from MICP and NMR always present disagreement due to the differences in test principles and corresponding petrophysical properties [10,11,17,19,50]. Therefore, the porosity and pore or pore throat size obtained from both MICP and NMR are compared with each other to clarify the difference between two methods in pore space and size characterization.

4.1.1. Porosity

As is shown in Figure 6, there are good correlations between gas-measured porosity (φ), MICP porosity (φMICP), and NMR porosity (φNMR) despite some differences. φ from core analysis is usually considered as the total porosity due to an assumption of gas molecules moving into almost all connected pore spaces. The porosity from MICP is always lower than the total porosity because of incomplete mercury injection, which is mainly caused by limited intruded mercury pressure. The deviation between φ and φNMR may be related to several reasons: the presence of paramagnetic minerals [59], gas molecules being smaller than water molecules [19], or external surface water of core plugs. In short, φNMR is much closer to φ, and thus can more accurately describe the total pore space of tight sandstone reservoirs when compared to mercury intrusion porosimetry.

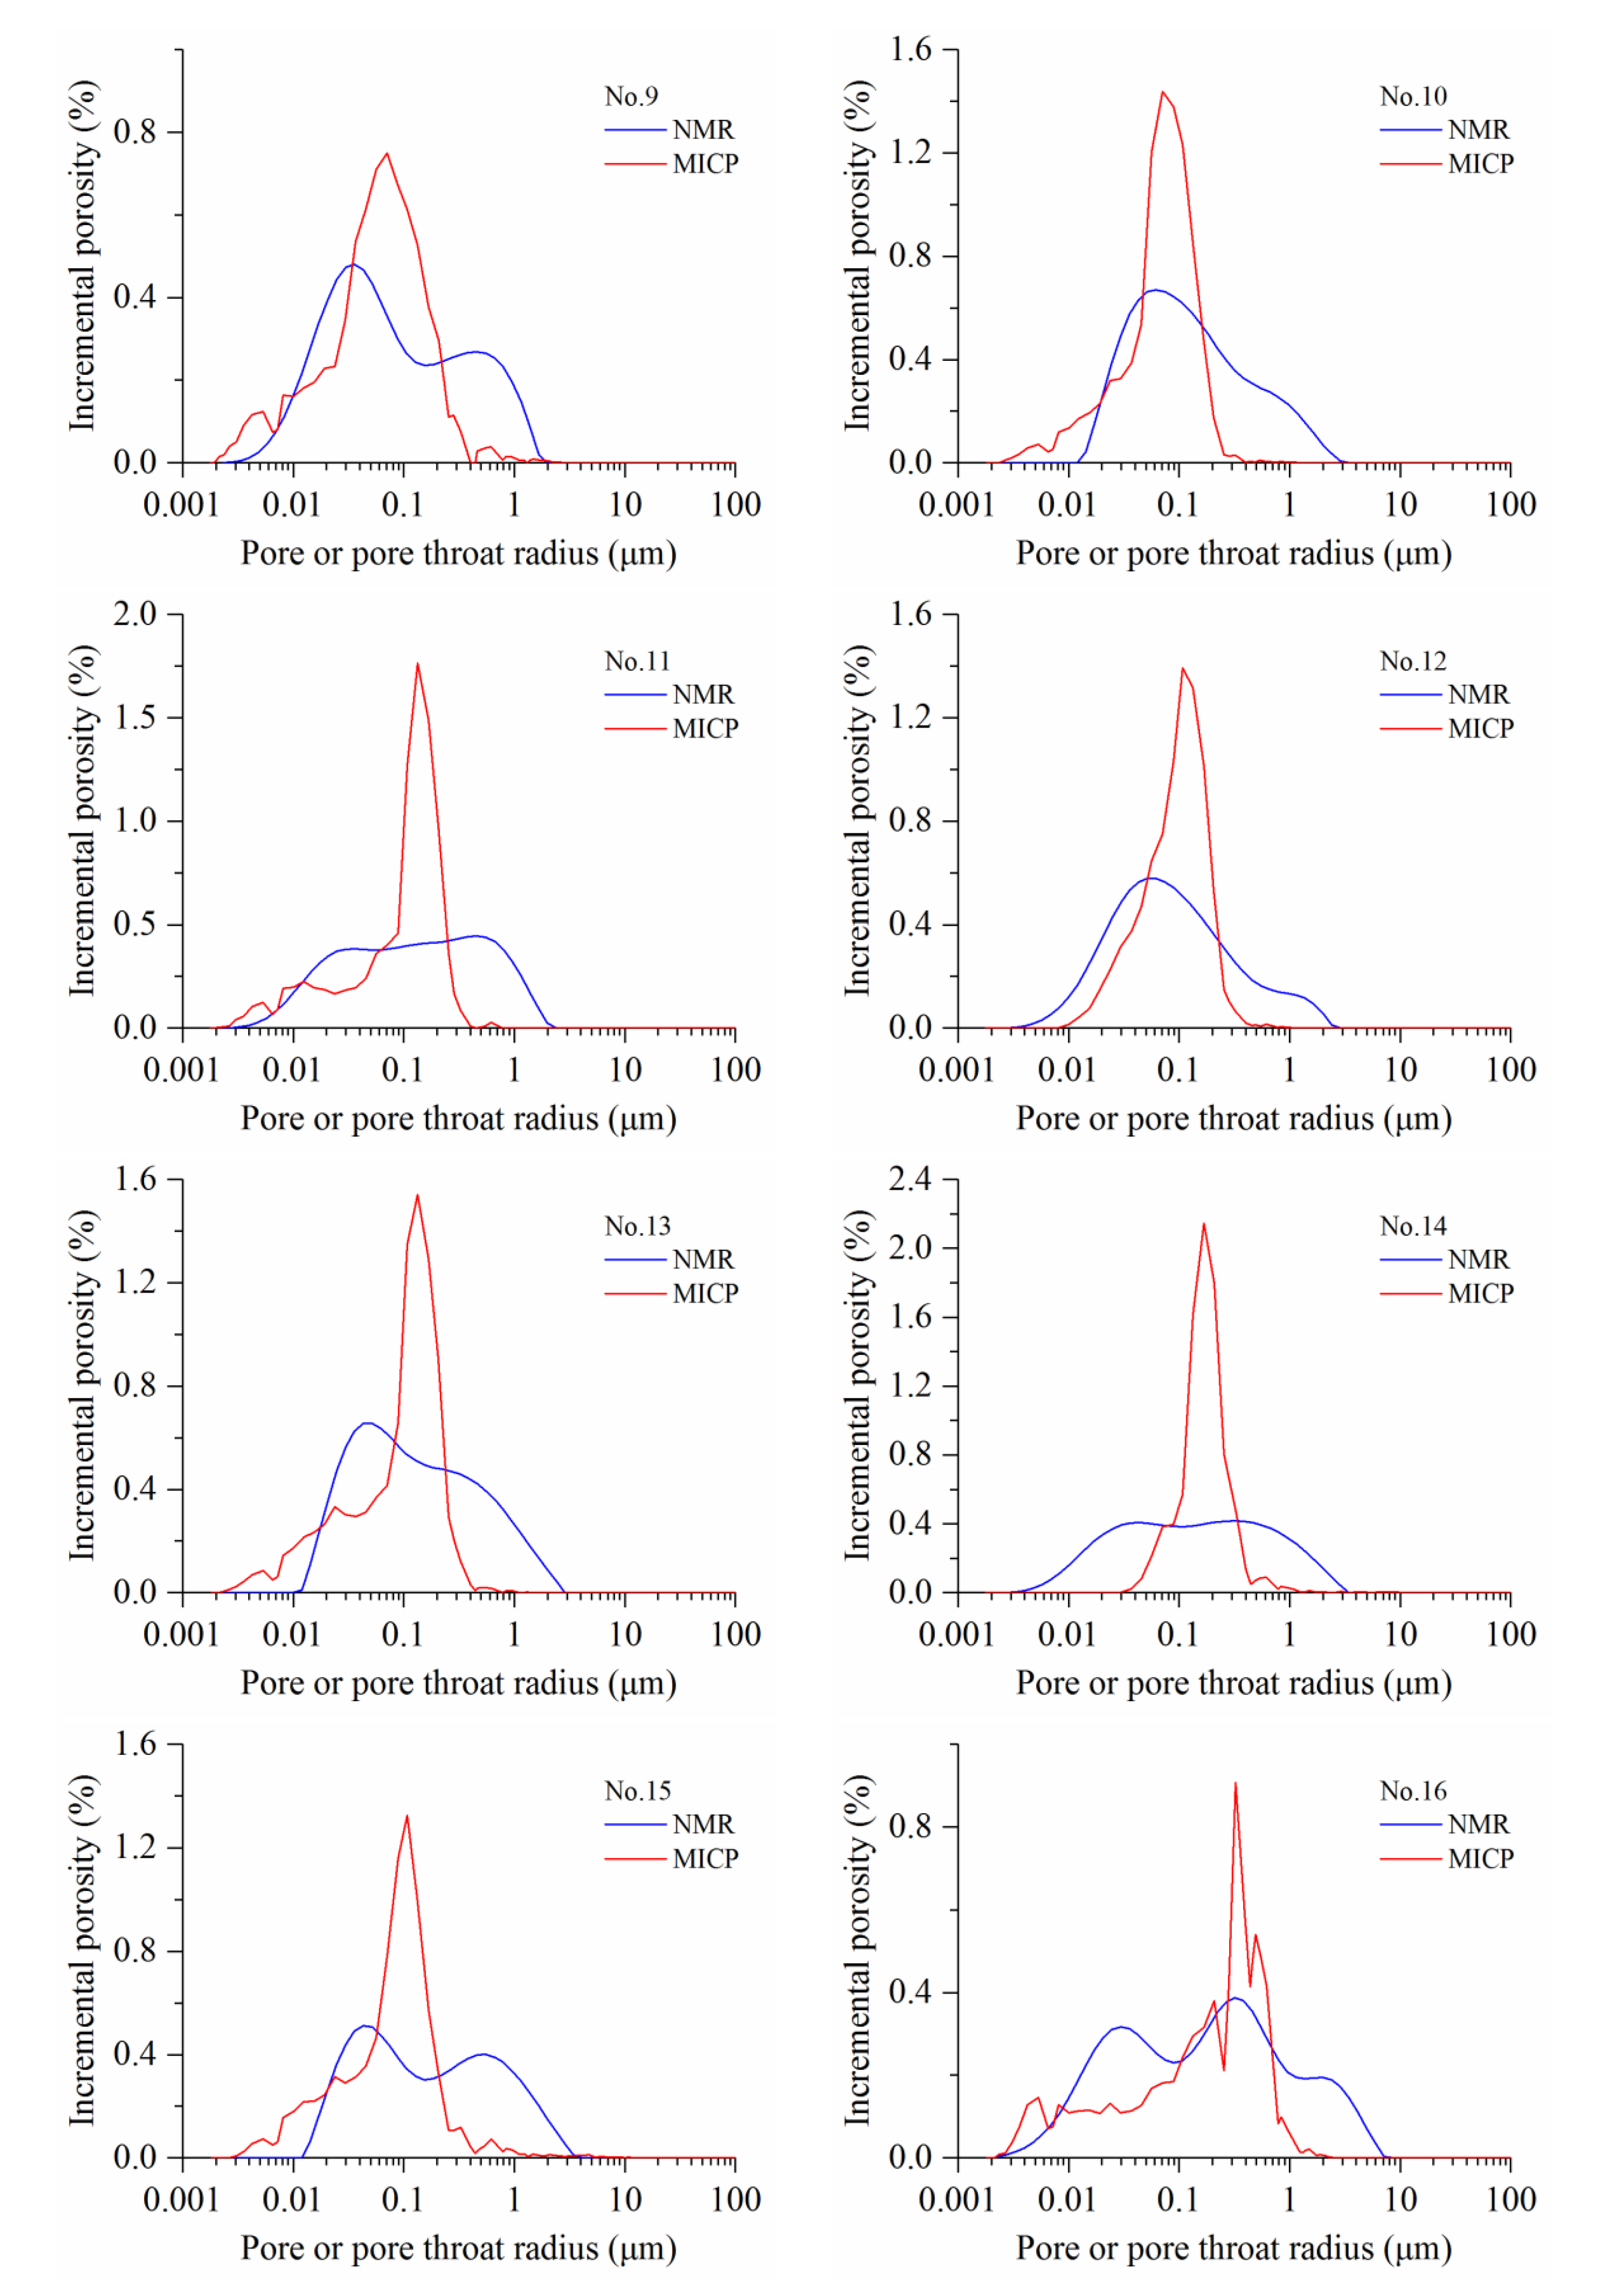
4.1.2. Pore and Pore Throat Size

Figure 7 shows the method of obtaining the pore radius and pore throat radius corresponding to the different pore volume percentages of the cumulative distribution curves of MICP and NMR. The results are shown in Table 2.
The result shows that the pore radius (R75) and pore throat radius (r75) corresponding to the upper quartile provide a good match, except for a slight deviation in some samples (Figure 8a). It is notable that the median pore radius (R50) almost coincides with the median pore throat radius (r50), which is important for accurately predicting permeability by use of R50 (Figure 8b). The pore radius corresponding to the low quartile (R25) is slightly larger than the pore radius corresponding to the low quartile (r25) (Figure 8c), while the pore radius R2.5 significantly exceeds the pore throat radius r2.5 on the location of cumulative percentage of 2.5% (Figure 8d). This indicates that pore size and throat size differ greatly from each other in the large-size pore system. Although there is significant difference between pore and throat in tight sandstones, the medians of the pore and pore throat radius show greatly consistent scalar values, which is highly valuable for the accurate and indirect evaluation of permeability and capillary pressure by use of R50.

4.2. Pore Size Distribution

4.2.1. Calibration of PSD

In NMR relaxation, the hydrogen atoms in smaller pores experience a greater surface relaxation, and thus relax and decay faster than that in the larger pores. So, the T2 distribution of rocks with water saturation corresponds to the PSD: large pores correspond to a long relaxation time and small pores to a short relaxation time. There was a linear relationship between the T2 value and pore size in single pores of clastic rocks, as Equation (4) verified. Therefore, the T2 distribution can be calibrated to the PSD. Previously, many researchers directly overlapped the PTD derived from MICP to the T2 distribution to obtain the PSD, based on the similarity of PTD and PSD in conventional reservoirs [23,60,61,62]. However, the PSD and PTD tend to present obvious differences due to the complex pore structure in tight sandstone reservoirs, which makes the reliability of calibrated PSD for this method low or even incorrect. Li et al. [63] found that there was not a noticeable difference within 0.05 μm between pore size and throat size when considering the similarity of pore volumes derived from MICP and nitrogen adsorption. Thus, the T2 distribution can be converted into the PSD through the “T2cutoff” method proposed by Yao et al. [19]. Although the method is based on a centrifuge experiment controlled by the Washburn equation, the effect of the significant difference between the pore and pore throat in the large pore system is avoidable to a great extent. The “T2cutoff” method is as follows:
For any relaxation time (T2i) in a T2 relaxation distribution, the corresponding pore size (Ri) can be determined by Equation (4).
R i = ρ 2 F s × T 2 i = C × T 2 i
where C is a constant conversion coefficient representative of the shape factor (Fs) and surface relaxivity (ρ2).
As a specific T2i, the T2cutoff can be used to calculate the conversion coefficient C. Thus, the following formula is converted from Equation (5):
R c = C × T 2 cutoff
where Rc is the cut-off pore radius, i.e., the minimal pore radius (μm) for water to discharge at the centrifuge pressure.
In the centrifuge experiment, Rc can be obtained from the following formula based on the Washburn equation:
R c = 2 σ Wr cos θ wr p centr
where Pcentr is the centrifuge pressure in MPa; Rc is the cut-off pore radius, the minimal pore radius (μm) for water to discharge at Pcentr; θwr is the contact angle between water molecule and pore surface; and σwr is the interfacial tension of rocks and water.
The σwr and θwr of rock to water vary with samples due to the mineral composition difference. They are assigned with values of 0.072 N/m and 0° according to the fact that the rock is completely water-wet after cleaning [64]. Therefore, the Rc that corresponds to T2cutoff under the centrifuge pressure of 2.76 MPa is 0.05 μm.
The T2cutoff can be obtained from centrifuge experiment and NMR test. The detailed method to obtain a T2cutoff is based on Li et al. [27]. Therefore, the PSD from NMR T2 distribution can be determined according to Equations (6) and (7).

4.2.2. The PSD and PTD

An average conversion coefficient (Cav = 0.023 μm/ms) is used when calibrating the PSD from the T2 distribution. The PSD of the 16 tight sandstone samples is shown in Figure 9. The result shows that the constructive PSD is not always a good match with the PTD determined by MICP, with some of the samples presenting significant difference between the two distributions.
The NMR-derived PSD presents a broad distribution with pore radius spanning three orders of magnitude from nanoscale to several microns. The PSD can be mainly divided into three groups based on the distribution shape and petrophysical properties.
The first group (No. 1, No. 2, No. 3, and No. 4) is a unimodal distribution similar to a logarithmic normal distribution, and some of them present a slightly positive skewness, including a weak tail due to the presence of a few large pores (Figure 9). The peak of the PSD is mainly located in the range of 0.02 to 0.04 μm, while the peak of the PTD ranges within 0.02 to 0.06 μm. It is notable that the PSD of this group always coincides very well with the PTD, probably due to the similar pore geometry. The pores of this group are mainly composed of intergranular triangular or sheet-like micro pores (generally less than 0.2 μm). These pores are related to the fierce compaction and/or tight cementation because petrography composition of these tight sandstones is mainly characterized by very-fine grain and high clay, plastic grain, or carbonate content (Figure 2, Figure 3 and Figure 10). Additionally, samples of this group are the extremely tight non-reservoir rock, which are mainly characterized by a very low porosity and an extremely low permeability, generally with a porosity less than 7% and permeability less than 0.015 mD (Table 1, Figure 2).
The second group (No. 6, No. 7, No. 10, and No. 12) is a unimodal distribution with a positive skewness (Figure 9). They include an obvious tail or minor peak which is mainly related to large pores (Figure 9). The dominant peak is located at 0.04 μm, while its right tail is approximately 0.2 to 3 μm and reveals a second minor population accounting for approximately 20% to 30% of the total pore volume. The pores of this group are composed of a large number of small pores and a small number of large pores. These large pores are probably generated from the limited dissolution. Additionally, the porosity and permeability of this sandstone is generally about 7% to 11% and 0.02 to 0.03 mD, respectively. However, the sample No.8 presents a logarithmic normal distribution (unimodal), with a maximum pore radius exceeding 1 μm and a peak value of approximately 0.1 μm. A large number of clay inter-crystalline pores are observed under SEM (Figure 3j) and the macro petrophysical properties are closer to the second group.
The third group (No. 5, No. 9, No. 11, No. 13, No. 14, No. 15, and No. 16) presents a typical bimodal distribution (Figure 9). The left peak ranges within 0.1 μm with the peak located in 0.02 μm. The right peak distributes from 0.1 to 10 μm with the peak location mainly ranging from 0.2 to 1 μm. Obviously, the pore system of this group possesses two modes, with one corresponding to clay inter-crystalline pores dominated by micro pores and another corresponding to macro pores mainly composed of residual primary intergranular pores and large dissolved pores or inter-crystalline pores (Figure 3 and Figure 10). The two pore types may form the pore geometry of large pores connecting with narrow throats, which further expounds the main reason of the difference between PSD and PTD. The porosity and permeability of the third group is generally more than 9% and 0.04 mD, respectively.
The PTD from MICP always presents a unimodal distribution with a negative skewness including a left tail (Figure 9). In particular, the sample of No.16 presents a second population with small pore throats (<0.1 μm). The PTD is characterized by leptokurtosis and high amplitude, which indicates that the main pore throat presents a concentrated distribution, significantly different from the low-amplitude and platykurtic bimodal distribution of the PSD from NMR. In fact, it is the special pore structure where the finer throats with centralized distribution control much of the larger pores that results in the main difference between the PSD and PTD in tight sandstones.

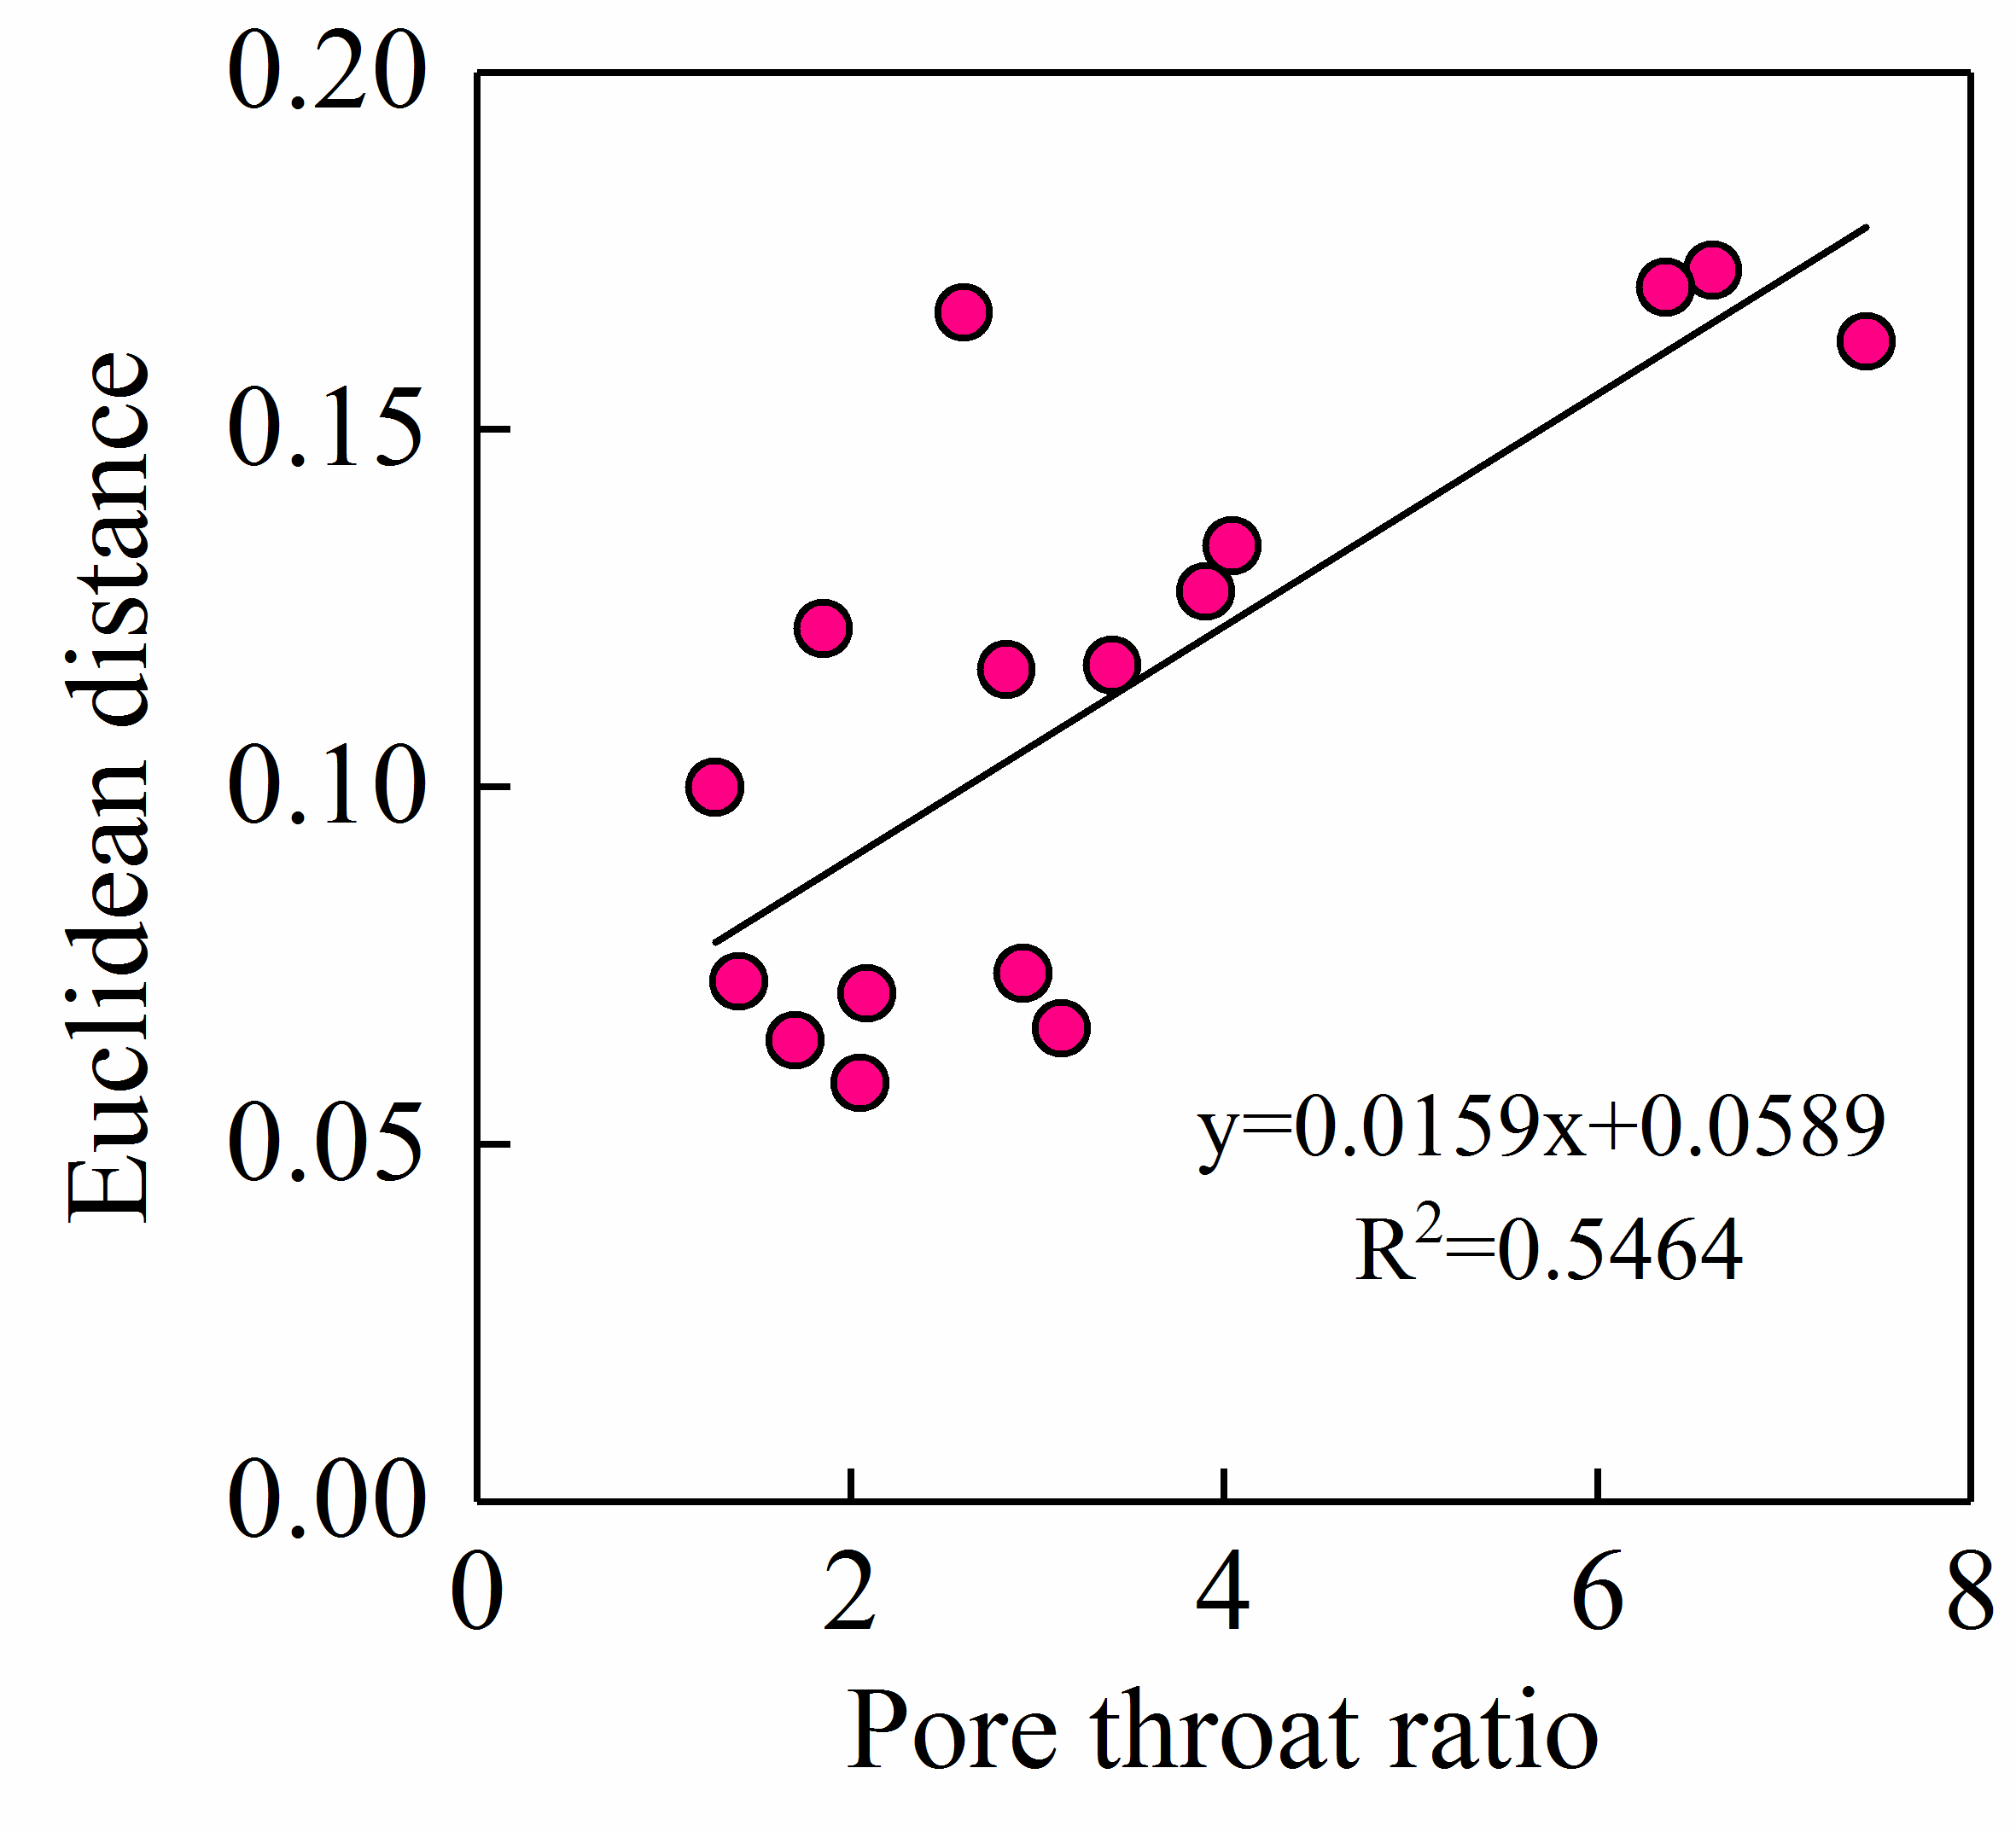
4.3. The Difference between MICP-PTD and NMR-Derived PSD

4.3.1. The Pore Network Model

The pore network, which is composed of large pore bodies and fine pore throats, is a system of storage space and percolation pathways for fluids. Macro pores of residual intergranular pores or dissolution pores comprise pore bodies that are connected by the fine passages composed of necking throats and clay inter-crystalline micro pores.
It is noteworthy that two pore network models are identified in the Chang 7 tight reservoir of the study area (Figure 10). One is the cylindrical pore model (CPM) composed of the flaky throat, curved flaky throat, and tubular throat, while the other is the sphere-cylindrical pore model (SPM), also known as ink-bottle pores [58], composed of large pore bodies connecting necking throats.
The flaky throat or curved flaky throat originates from the close contact of grains (line contact or even concavo-convex contact) under fierce compaction, and tubular throats are widely distributed in clay inter-crystalline pores and micro dissolved pores (Figure 10A). The tight sandstones of these throat types tend to have a very fine throat (generally, radius <0.2 μm). Therefore, the samples that are dominated by the CPM are always related to the very tight non-reservoir rock in the study area (e.g., No. 1 to No. 4). However, the pore network of the SPM dominant is composed of large amounts of necking throats, characterized by large pores connecting with narrow throats (Figure 10A). It is usually connected with the tight reservoirs of relatively high porosity and low permeability (e.g., No. 5, No. 11, and No. 13 to No. 16). Necking throats are generated from the spot contact of grains caused by fierce compaction or grain coating chlorite. Rocks of this type are characterized by interstitial material of low content or dissolution of material and grains, which is favorable to residual intergranular pores, dissolution pores, and relatively large inter-crystalline pores. Additionally, clay inter-crystalline pores are also one of the most important components in the samples of SPM dominant. These pores can act as throats, form ink-bottle pores in combination with macro pores and then control the flow percolation. The abundant micro pores in clay minerals are a main contributor to the left peak of NMR-derived PSD and the fine tail of the PTD from MICP.
These two pore network models make a vast difference between the PSD and PTD. As is discussed above, the PSD and PTD are in a good agreement in the CPM dominant, whereas they show a large discrepancy in the SPM dominant (Figure 9 and Figure 10C).

4.3.2. Difference of Pores and Throats

The CPM is assumed to study pore geometry of porous material in mercury porosimetry, but in fact, as discussed above, the network of pores and throats in rocks is more similar to the SPM [10,65], also referred to as ink-bottle pores [58] (Figure 10). The ink-bottle pores, which comprise a serial of narrow throats (small pores) connecting to the expanded pore bodies (large pores), are widely distributed in reservoir rocks, especially in tight sandstone reservoirs. Therefore, the real pore geometry is quite different from the cylinder pore assumption, and this assumption can lead to significant differences between the MICP analysis and reality. In the MICP experiment, mercury gradually breaks through the narrow throats with increasing injection pressure, and then enters into the pore bodies connected by these throats. The injected mercury volume under a certain pressure is equal to the total volume of these pores and throats. However, the pore throat radius controlled by this injected pressure equates to the radius of the largest entrance of a pore void and is smaller than the real pore body radius (Figure 10).
The connectivity of the pore system of ink-bottle pores deteriorates with increasing the PTR in reservoir rocks, and thus the similarity of the PTD and PSD decreases. That is, an increase in PTR reflects a decrease in the volume of cylindrical pores or an increase in the volume of ink-bottle pores (sphere-cylindrical pores), which makes reservoir rocks a transformation from the CPM dominant to the SPM dominant and further presents more significant differences between the two distribution curves.
Euclidean distance is introduced to define the similarity of the two curves of the PTD and PSD. Euclidean distance is a numerical description of the total distance between points or vectors in space [66] and is widely applied for quantification of similarity or for classification in many research fields [67,68,69]. Therefore, it can be used to characterize the similarity of the two curves: the smaller the Euclidean distance is, the higher the similarity between the curves is [70]. Euclidean distance can be expressed as follows [66]:
D edu = x = x i , i = 1 n ( y i NMR y i MICP ) 2
where Dedu is the Euclidean distance, xi is the pore radius or pore throat radius, and y i NMR and y i MICP are the incremental porosity of NMR-derived PSD and MICP-PTD in fraction, respectively.
The result shows that the Euclidean distance increases with the increasing PTR of the Chang 7 tight sandstones (Figure 11), which indicates that the difference in pore body and throat size controls the similarity between the PTD and PSD and further reflects the phenomenon of “large pores connecting with narrow throats” in tight sandstones. In the MICP experiment, this phenomenon makes the volume of large pores connected by narrow throats attached to the corresponding throat volume, with the PTD visually shifting the smaller pore size direction compared to the authentic pore size distribution [58]. As discussed above, it is not rigorous or even wrong to directly overlap the curve of the T2 distribution to the curve of PTD to obtain the PSD of NMR. In addition, Euclidean distance can effectively evaluate the similarity of the PTD obtained from MICP and NMR-derived PSD and indicate pore network characteristics (CPM and SPM) in tight sandstones.

5. Conclusions

In this study, based on the analysis of petrology and pore characteristics, the MICP and NMR techniques were combined to evaluate the PSD and PTD in the Chang 7 tight sandstone reservoirs, and the CPM and SPM (pore network models) were proposed to reveal their differences. The conclusions are as follows:
High capillary pressure, dominated nanoscale pore throat, and low mercury withdrawal efficiency indicate that ink-bottle pores and necking throats are developed in the Chang 7 tight sandstones. The micro pores filled with irreducible fluid contribute a significant portion of the storage space but may not be important for oil or gas percolation in tight sandstone reservoirs.
The comparison of pore and throat radius corresponding to different pore volume percentage suggests that pore and throat size dominantly differ in the large-size pore compartment. The constructive PSD does not always match well with the PTD determined by MICP. The main pore throat presents a centralized distribution, while the PSD of NMR is a low-amplitude and platykurtic bimodal distribution. In very tight core samples, the PSD always coincides very well with PTD probably due to the pore network dominated by cylindrical pores, while the samples of high porosity and permeability present a significant difference between the two distributions due to the pore network dominated by the sphere-cylindrical pores.
The CPM and SPM effectively explain the difference between PSD and PTD of the Chang 7 tight sandstones, providing us a good insight into the heterogeneity of pore geometry (pore and throat). This is of great significance for the application of MICP and NMR techniques to evaluate the pore structure and petrophysical properties of tight sandstone reservoirs.

Author Contributions

Conceptualization, C.L.; methodology, C.L., F.Y. and Z.H.; formal analysis, C.L. and X.L.; investigation, C.L.; resources, P.W.; writing—original draft preparation, C.L.; writing—review and editing, C.L., X.F. and Z.H.; visualization, C.L. and F.Y. All authors have read and agreed to the published version of the manuscript.

Funding

This research was funded by National Natural Science Foundation of China and grant number [NO. 41472114].

Data Availability Statement

The data presented in this study are available on request from the corresponding author. The data are not publicly available due to patent protection.

Acknowledgments

Support from the National Natural Science Foundation of China is highly acknowledged.

Conflicts of Interest

The authors declare no conflict of interest.

References

  1. Zou, C.; Tao, S.; Yang, Z.; Yuan, X.; Zhu, R.; Hou, L.; Jia, J.; Wang, F.; Wu, S.; Bai, B.; et al. New advance in unconventional petroleum exploration and research in China. Bull. Mineral. Petrol. Geochem. 2012, 31, 312–322. [Google Scholar]
  2. Zhou, Y.; Ji, Y.; Xu, L.; Che, S.; Niu, X.; Wan, L.; Zhou, Y.; Li, Z.; You, Y. Controls on reservoir heterogeneity of tight sand oil reservoirs in Upper Triassic Yanchang Formation in Longdong Area, southwest Ordos Basin, China: Implications for reservoir quality prediction and oil accumulation. Mar. Pet. Geol. 2016, 78, 110–135. [Google Scholar] [CrossRef]
  3. Li, C.; Liu, G.; Cao, Z.; Niu, Z.; Wang, P.; Zhang, M.; Zhang, K. The study of Chang 7 tight sandstone micro pore characteristics in Longdong area, Ordos Basin. Nat. Gas Geosci. 2016, 27, 1236–1247. [Google Scholar]
  4. Hu, Z.; Gaus, G.; Seemann, T.; Zhang, Q.; Littke, R.; Fink, R. Pore structure and sorption capacity investigations of Ediacaran and Lower Silurian gas shales from the Upper Yangtze platform, China. Geomech. Geophys. Geo-Energy Geo-Resour. 2021, 7, 1–26. [Google Scholar] [CrossRef]
  5. Nelson, P.H. Pore-throat sizes in sandstones, tight sandstones, and shales. AAPG Bull. 2009, 93, 329–340. [Google Scholar] [CrossRef]
  6. Rezaee, R.; Saeedi, A.; Clennell, B. Tight gas sands permeability estimation from mercury injection capillary pressure and nuclear magnetic resonance data. J. Pet. Sci. Eng. 2012, s88–s89, 92–99. [Google Scholar] [CrossRef]
  7. Zhao, H.; Ning, Z.; Wang, Q.; Zhang, R.; Zhao, T.; Niu, T.; Zeng, Y. Petrophysical characterization of tight oil reservoirs using pressure-controlled porosimetry combined with rate-controlled porosimetry. Fuel 2015, 154, 233–242. [Google Scholar] [CrossRef]
  8. Hu, Z.; Lu, S.; Klaver, J.; Dewanckele, J.; Amann-Hildenbrand, A.; Gaus, G.; Littke, R. An Integrated Imaging Study of the Pore Structure of the Cobourg Limestone—A Potential Nuclear Waste Host Rock in Canada. Minerals 2021, 11, 1042. [Google Scholar] [CrossRef]
  9. Comisky, J.; Santiago, M.; Mccollom, B.; Buddhala, A. Sample Size Effects on the Application of Mercury Injection Capillary Pressure for Determining the Storage Capacity of Tight Gas and Oil Shales. In Proceedings of the Canadian Unconventional Resources Conference, Society of Petroleum Engineers, Calgary, AB, Canada, 15–17 November 2011. [Google Scholar]
  10. Schmitt, M.; Fernandes, C.P.; Wolf, F.G.; Neto, J.A.B.D.C.; Rahner, C.P.; Santos, V.S.S.D. Characterization of Brazilian tight gas sandstones relating permeability and angstrom-to micron-scale pore structures. J. Nat. Gas Sci. Eng. 2015, 27, 785–807. [Google Scholar] [CrossRef]
  11. Purcell, W.R. Capillary pressures-their measurement using mercury and the calculation of permeability therefrom. J. Pet. Technol. 1949, 1, 39–48. [Google Scholar] [CrossRef]
  12. Cao, Z.; Liu, G.; Zhan, H.; Li, C.; Yuan, Y.; Yang, C.; Jiang, H. Pore structure characterization of chang-7 tight sandstone using MICP combined with N2GA techniques and its geological control factors. Sci. Rep. 2016, 6, 36919. [Google Scholar] [CrossRef] [PubMed]
  13. Bustin, R.M.; Bustin, A.M.M.; Cui, A.; Ross, D.; Pathi, V.M. Impact of shale properties on pore structure and storage characteristics. In Proceedings of the Society of Petroleum Engineers Shale Gas Production Conference, Fort Worth, TX, USA, 16–18 November 2008; p. SPE119892. [Google Scholar]
  14. Zhang, N.; He, M.; Zhang, B.; Qiao, F.; Sheng, H.; Hu, Q. Pore structure characteristics and permeability of deep sedimentary rocks determined by mercury intrusion porosimetry. J. Earth Sci. 2016, 27, 670–676. [Google Scholar] [CrossRef]
  15. Washburn, E.W. Note on the method of determining the distribution of pore sizes in a porous material. Proc. Natl. Acad. Sci. USA 1921, 7, 115–116. [Google Scholar] [CrossRef] [PubMed]
  16. Timur, A. Pulsed nuclear magnetic resonance studies of porosity, movable fluid, and permeability of sandstones. J. Pet. Technol. 1969, 21, 775–786. [Google Scholar] [CrossRef]
  17. Coates, G.; Xiao, L.; Prammer, M. NMR Logging Principles and Applications; Halliburton Energy Services: Houston, TX, USA, 1999; pp. 2–72. [Google Scholar]
  18. Al-Mahrooqi, S.H.; Grattoni, C.A.; Moss, A.K.; Jing, X.D. An investigation of the effect of wettability on NMR characteristics of sandstone rock and fluid systems. J. Pet. Sci. Eng. 2003, 39, 389–398. [Google Scholar] [CrossRef]
  19. Yao, Y.; Liu, D.; Che, Y.; Tang, D.; Tang, S.; Huang, W. Petrophysical characterization of coals by low-field nuclear magnetic resonance (NMR). Fuel 2010, 89, 1371–1380. [Google Scholar] [CrossRef]
  20. Xiao, L.; Xie, R.; Liao, G. NMR Logging Principles and Applications of Complex Hydrocarbon Reservoirs in China; Science Press: Beijing, China, 2012; pp. 2–6. [Google Scholar]
  21. Wang, F.; Tang, T.; Liu, T.; Zhang, H. Evaluation of the pore structure of reservoirs based on NMR T2 Spectrum decomposition. Appl. Magn. Reson. 2016, 47, 361–373. [Google Scholar] [CrossRef]
  22. Cohen, M.H.; Mendelson, K.S. Nuclear magnetic relaxation and the internal geometry of sedimentary rocks. J. Appl. Phys. 1982, 53, 1127–1135. [Google Scholar] [CrossRef]
  23. Hodgkins, M.A.; Howards, J.J. Application of NMR logging to reservoir characterization of low-resistivity sands in the Gulf of Mexico. AAPG Bull. 1999, 83, 114–127. [Google Scholar]
  24. Westphal, H.; Surholt, I.; Kiesl, C.; Thern, H.; Kruspe, T. NMR Measurements in carbonate rocks: Problems and an approach to a solution. Pure Appl. Geophys. 2005, 162, 549–570. [Google Scholar] [CrossRef]
  25. Xu, H.; Tang, D.; Zhao, J.; Li, S. A precise measurement method for shale porosity with low-field nuclear magnetic resonance: A case study of the Carboniferous–Permian strata in the Linxing area, eastern Ordos Basin, China. Fuel 2015, 143, 47–54. [Google Scholar] [CrossRef]
  26. Hinai, A.A.; Rezaee, R.; Esteban, L.; Labani, M. Comparisons of pore size distribution: A case from the western Australian gas shale formations. J. Unconv. Oil Gas Resour. 2014, 8, 1–13. [Google Scholar] [CrossRef]
  27. Li, C.; Liu, G.; Cao, Z.; Yuan, W.; Wang, P.; You, Y. Analysis of petrophysical characteristics and water movability of tight sandstone using low-field nuclear magnetic resonance. Nat. Resour. Res. 2020, 29, 2547–2573. [Google Scholar] [CrossRef]
  28. Soete, J.; Claes, S.; Claes, H.; Erthal, M.; Hamaekers, H.; De Boever, E.; Foubert, A.; Klitzsch, N.; Swennen, R. Unravelling the pore network and its behaviour: An integrated NMR, MICP, XCT and petrographical study of continental spring carbonates from the Ballık area, SW Turkey. Depos. Recor 2020, 8, 292–316. [Google Scholar] [CrossRef]
  29. Zhang, N.; Wang, S.; Zhao, F.; Sun, X.; He, M. Characterization of the pore structure and fluid movability of coal-measure sedimentary rocks by nuclear magnetic resonance (NMR). ACS Omega 2021, 6, 22831–22839. [Google Scholar] [CrossRef]
  30. Clarkson, C.R.; Solano, N.; Bustin, R.M.; Bustin, A.M.M.; Chalmers, G.R.L.; He, L.; Melnichenko, Y.B.; Radliński, A.P.; Blach, T.P. Pore structure characterization of north american shale gas reservoirs using USANS/SANS, gas adsorption, and mercury intrusion. Fuel 2013, 103, 606–616. [Google Scholar] [CrossRef]
  31. Yang, J. Tectonic Evolution and Oil-gas Reservoirs Distribution in Ordos Basin; Petroleum Industry Press: Beijing, China, 2002; pp. 36–37. [Google Scholar]
  32. Yuan, W.; Liu, G.; Xu, L.; Niu, X.; Li, C. Petrographic and geochemical characteristics of organic-rich shale and tuff of the upper triassic yanchang formation, ordos basin, China: Implications for lacustrine fertilization by volcanic ash. Can. J. Earth Sci. 2019, 56, 47–59. [Google Scholar] [CrossRef]
  33. Yang, H.; Dou, W.; Liu, X.; Zhang, L. Analysis on sedimentary facies of member 7 in Yanchang Formation of Triassic in Ordos Basin. Acta Sedimentol. Sin. 2010, 28, 254–263. [Google Scholar]
  34. Zhu, H.; Zhong, D.; Yao, J.; Sun, H.; Niu, X.; Liang, X.; You, Y.; Li, X. Alkaline diagenesis and its effects on reservoir porosity: A case study of Upper Triassic Chang 7 Member tight sandstone in Ordos Basin, NW China. Pet. Explor. Dev. 2015, 42, 56–65. [Google Scholar] [CrossRef]
  35. Wardlaw, N.C. Pore Geometry of carbonate rocks as revealed by pore casts and capillary pressure. AAPG Bull. 1976, 60, 245–257. [Google Scholar]
  36. Rootare, H.M.; Prenzlow, C.F. Surface area from mercury porosimetry measurements. J. Phys. Chem. 1967, 71, 2733–2735. [Google Scholar] [CrossRef]
  37. Giesche, H. Mercury porosimetry: A general (practical) overview. Part. Part. Syst. Charact. 2006, 23, 9–19. [Google Scholar] [CrossRef]
  38. Gan, H.; Nandi, S.P.; Walker, P.L. Nature of the porosity in American coals. Fuel 1972, 51, 272–277. [Google Scholar] [CrossRef]
  39. Mosher, K.; He, J.; Liu, Y.; Rupp, E.; Wilcox, J. Molecular simulation of methane adsorption in micro- and mesoporous carbons with applications to coal and gas shale systems. Int. J. Coal Geol. 2013, 109, 36–44. [Google Scholar] [CrossRef]
  40. Kenyon, W.E. Petrophysical principles of applications of NMR logging. Log Analyst. 1997, 38, 21–40. [Google Scholar]
  41. Daigle, H.; Johnson, A.; Thomas, B. Determining fractal dimension from nuclear magnetic resonance data in rocks with internal magnetic field gradients. Geophysics 2014, 79, 425–431. [Google Scholar] [CrossRef]
  42. Brownstein, K.R.; Tarr, C.E. Importance of classical diffusion in NMR studies of water in biological cells. Phys. Rev. A 1979, 19, 2446–2453. [Google Scholar] [CrossRef]
  43. Kleinberg, R.L.; Horsfield, M.A. Transverse relaxation processes in porous sedimentary rock. J. Magn. Reson. 1990, 88, 9–19. [Google Scholar] [CrossRef]
  44. Sigal, R.F. Pore-size distributions for organic-shale-reservoir rocks from nuclear-magnetic-resonance spectra combined with adsorption measurements. SPE J. 2015, 20, 824–830. [Google Scholar] [CrossRef]
  45. Yan, W.; Sun, J.; Cheng, Z.; Li, J.; Sun, Y.; Shao, W.; Shao, Y. Petrophysical characterization of tight oil formations using 1D and 2D NMR. Fuel 2017, 206, 89–98. [Google Scholar] [CrossRef]
  46. Folk, R.L.; Ward, W.C. Brazos River bar: A study in the significance of grain size parameters. J. Sediment. Res. 1957, 27, 3–16. [Google Scholar] [CrossRef]
  47. Li, C.; Liu, G.; Cao, Z.; Sun, M.; You, Y.; Liu, N. Oil charging pore throat threshold and accumulation effectiveness of tight sandstone reservoir using the physical simulation experiments combined with NMR. J. Pet. Sci. Eng. 2022, 208, 109338. [Google Scholar] [CrossRef]
  48. Giles, M.R.; Boer, R.B.D. Origin and significance of redistributional secondary porosity. Mar. Pet. Geol. 1990, 7, 378–397. [Google Scholar] [CrossRef]
  49. Mastalerz, M.; Drobniak, A.; Hower, J. Controls on reservoir properties in organic-matter-rich shales: Insights from MICP analysis. J. Pet. Sci. Eng. 2021, 196, 107775. [Google Scholar] [CrossRef]
  50. Zhou, Y.; You, L.; Zi, H.; Lan, Y.; Cui, Y.; Xu, J.; Fan, Q.; Wang, G. Determination of pore size distribution in tight gas sandstones based on Bayesian regularization neural network with MICP, NMR and petrophysical logs. J. Nat. Gas Sci. Eng. 2022, 100, 104468. [Google Scholar] [CrossRef]
  51. Kaufmann, J.; Loser, R.; Leemann, A. Analysis of cement-bonded materials by multi-cycle mercury intrusion and nitrogen sorption. J. Colloid Interface Sci. 2009, 336, 730–737. [Google Scholar] [CrossRef]
  52. Wardlaw, N.C.; Malcolm, M.; Li, Y. Pore and throat size distributions determined by mercury porosimetry and by direct observation. Carbonates Evaporites 1988, 3, 1–16. [Google Scholar] [CrossRef]
  53. Rylander, E.; Philip, M.S.; Jiang, T.; Lewis, R. NMR T2 distributions in the Eagle Ford shale: Reflections on pore size. In Proceedings of the SPE Unconventional Resources Conference, The Woodlands, TX, USA, 10–12 April 2013; p. SPE164554. [Google Scholar]
  54. Schowalter, T.T. Mechanics of secondary hydrocarbon migration and entrapment. AAPG Bull. 1979, 63, 723–760. [Google Scholar]
  55. Hognesen, E.J.; Strand, S.; Austad, T. Waterflooding of Preferential Oil-wet Carbonates: Oil Recovery Related to Reservoir Temperature and Brine Composition. In Proceedings of the SPE Europec/EAGE Annual Conference, Madrid, Spain, 13–16 June 2005; p. SPE94166. [Google Scholar]
  56. Meng, W.; Haroun, M.R.; Sarma, H.K.; Adeoye, J.T.; Aras, P.; Punjabi, S.; Rahman, M.M.; Al Kobaisi, M. A novel approach of using phosphate-spiked smart brines to alter wettability in mixed oil-wet carbonate reservoirs. In Proceedings of the Abu Dhabi International Petroleum Exhibition and Conference, Abu Dhabi, United Arab Emirates, 9–12 November 2015; p. SPE17755. [Google Scholar]
  57. Dai, C.; Cheng, R.; Sun, X.; Liu, Y.; Zhou, H.; Wu, Y.; You, Q.; Zhang, Y.; Sun, Y. Oil migration in nanometer to micrometer sized pores of tight oil sandstone during dynamic surfactant imbibition with online NMR. Fuel 2019, 245, 544–553. [Google Scholar] [CrossRef]
  58. Wardlaw, N.C.; Mckellar, M. Mercury porosimetry and the interpretation of pore geometry in sedimentary rocks and artificial modelsy. Powder Technol. 1981, 29, 127–143. [Google Scholar] [CrossRef]
  59. Lala, A.M.S.; El-Sayed, N.A.A. Effect of pore framework and radius of pore throats on permeability estimation. J. Afr. Earth Sci. 2015, 110, 64–74. [Google Scholar] [CrossRef]
  60. Volokitin, Y.; Looyestijn, W.J.; Slijkerman, W.F.J.; Hofman, J.P. A Practical approach to obtain primary drainage capillary pressure curves from NMR core and log Data. Petrophysics 2001, 42, 334–343. [Google Scholar]
  61. Liu, T.; Wang, S.; Fu, R.; Zhou, M.; Li, Y.; Luo, M. Analysis of rock pore throat structure with NMR spectra. Oil Geophys. Prospect. 2003, 18, 737–742. [Google Scholar]
  62. Li, H.; Zhu, J.; Guo, H. Methods for calculating pore radius distribution in rock from NMR T2 spectra. Chin. J. Magn. Reson. 2008, 25, 273–280. [Google Scholar]
  63. Li, H.; Guo, H.; Li, H.; Liu, W.; Jiang, B.; Hua, J. Thickness analysis of bound water film in tight reservoir. Nat. Gas Geosci. 2015, 26, 186–192. [Google Scholar]
  64. Yang, S.; Wei, J. Reservoir Physics; Petroleum Industry Press: Beijing, China, 2004; pp. 188–208. [Google Scholar]
  65. Liu, P.; Chen, X. Foam Metel; Centrol South University Press: Changsha, China, 2012; pp. 298–309. [Google Scholar]
  66. Mesquita, D.P.P.; Gomes, J.P.P.; Junior, A.H.S.; Nobre, J.S. Euclidean distance estimation in incomplete datasets. Neurocomputing 2017, 248, 11–18. [Google Scholar] [CrossRef]
  67. Wang, C.; Jiang, M.; Liu, Z. A new method to distinguish sedimentary environment based on the data of the grain size frequency distribution. Bull. Tianjing Inst. Geol. Min. Res. 1989, 23, 61–69. [Google Scholar]
  68. Yang, T.; Li, T.; Zhang, J.; Li, J.; Liu, H.; Wang, Y. Rapid identification of bolete mushrooms by UV spectroscopy combined with Euclidean distance and principal component analysis. Food Sci. 2014, 35, 105–109. [Google Scholar]
  69. Ghosh, A.; Barman, S. Application of Euclidean distance measurement and principal component analysis for gene identification. Gene 2016, 583, 112–120. [Google Scholar] [CrossRef]
  70. Wang, X.; Wang, W.; Zhang, K.; Bi, K. Approaching the study on the similarity analysis of HPLC fingerprints spectra for traditional Chinese medicines. J. Shenyang Pharm. Univ. 2003, 20, 360–362. [Google Scholar]
Figure 1. Tectonic division of the Ordos Basin and location of the study area and sampling wells.
Processes 10 01941 g001
Figure 2. Mineral composition (a), median grain size (b), porosity (c) and permeability (d) of the Chang 7 tight sandstones.
Processes 10 01941 g002
Figure 3. Petrology and pore characteristics of the Chang 7 tight sandstone reservoirs in the Ordos Basin. (a,b) Z168, 1754.56 m, fine-grained, subrounded to subangular, poorly sorted lithic arkose. Qtz—quartz; F—feldspar; RF—rock fragment. (c) H144, 2554.10 m, ankerite cement (blue) is the most common pore-filling constituents, thin section colored by the mixture of sodium alizarinsulfonate and potassium ferricyanide. (d) X257 1927.10 m, micro-scale regular residual primary intergranular pores. (e) Z388, 2080.77 m, large amounts of dissolved pores, including feldspar dissolved pores and lithic fragment dissolved pores. (f) W100, 1968.00 m, micro-fractures. (g) X257, 1927.10 m, microscale regular residual primary intergranular pores, SEM. (h) Z70, 1617.10 m, feldspar dissolved pores, SEM. (i) G8, 1795.60 m, authigenic albite inter-crystalline pores. (j) Z168, 1725.40 m, clay inter-crystallite pores developed in rolled sheet illite, SEM. (k) X257, 1927.10 m, nanoscale triangular or planar clay inter-crystallite pores developed in foliated chlorite aggregates, argon ion polishing, SEM. (l) X257, 1927.10 m, nanoscale clay inter-crystalline pores developed in foliated chlorite aggregates, SEM.
Processes 10 01941 g003
Figure 4. Intrusion and extrusion curves (a) and pore throat distribution curves (b) of the Chang 7 tight sandstones in the Ordos Basin derived from MICP.
Processes 10 01941 g004
Figure 5. The 100% water-saturated and irreducible T2 spectrum distribution of the Chang 7 tight sandstones in the Ordos Basin.
Processes 10 01941 g005aProcesses 10 01941 g005b
Figure 6. Cross-plots of φ and φHg (a), φ and φNMR (b), φHg and φNMR (c). φ: Gas-measured porosity. φHg: MICP porosity. φNMR: NMR porosity. Data of φNMR is from Li et al. [27].
Processes 10 01941 g006
Figure 7. The method to calculate pore radius and pore throat radius corresponding to 2.5%, 25%, 50%, and 75% of the cumulative pore volume percentage from NMR and MICP.
Processes 10 01941 g007
Figure 8. Plots of pore radius and pore throat radius. (a) The plot of r75 and R75 show a good match except for sample 14. (b) The plot of r50 from Li et al. [47] and R50. r50 are closely equal to R50, indicating R50 can be used in place of r50 to predict permeability [27]. The plot of r25 and R25 (c), r2.5 and R2.5 (d) show that pore radius is much larger than pore throat radius in macropore interval.
Processes 10 01941 g008
Figure 9. The NMR pore size distribution (PSD) and MICP pore throat distribution (PTD) of the Chang 7 tight sandstones in the Ordos Basin. An average conversion coefficient (Cav = 0.023 μm/ms) is used when the PSD is derived from the T2 distribution. When comparing to the PTD and PSD, a discrepancy is found. This inconsistency is mainly because MICP quantifies pore throat size distribution, while NMR reveals the pore body size distribution.
Processes 10 01941 g009aProcesses 10 01941 g009b
Figure 10. The pore network model of the Chang 7 tight sandstones in the Ordos Basin. (A) (a) No. 4, L231, 2027.90 m, large amounts of tubular/cylindrical throats or long strip throats are developed in the very tight sandstones, including: (a1) the curved lamellar throat, (a2) the laminated throat; (a3) the tubular throat. (b) Necking throats are fine throats connecting large-size pore bodies and small-size pore throats, origin from the close contact of grains caused by fierce compaction and grain coating chlorite. (b1) No. 15, L231, 2022.25 m; (b2) No. 5, L231, 2108.13 m. (B) Pore network model. (C) The cumulative PSD (or PTD) from MICP and NMR. No. 4, the cylindrical pore model (CPM), the PSD and PTD match well with each other. No. 5, the sphere-cylindrical pore model (SPM), a significant difference between the PSD and PTD is presented due to large amounts of necking throats.
Processes 10 01941 g010
Figure 11. The relationship between the Euclidean distance and pore throat ratio (PTR).
Processes 10 01941 g011
Table 1. The pore structure parameters from MICP.
Sample No.SoPc50
(MPa)
Pd
(MPa)
rmax
(μm)
Smax
(%)
We
(%)
PTRφHg
(%)
r2.5
(μm)
r25
(μm)
r75
(μm)
11.6946.116.820.10871.8332.422.083.240.1040.0340.002
21.8759.514.390.16777.3544.041.272.850.1730.0430.003
31.5919.373.560.20686.7036.991.705.740.2030.0840.010
41.4318.973.560.20685.2124.223.136.060.1950.0750.012
51.5126.886.020.12289.3311.857.447.070.2130.0480.009
61.4911.022.870.25686.9935.041.858.450.2120.1180.016
71.6911.421.840.40090.3132.782.058.180.4150.1510.019
81.5311.302.600.28391.9241.671.409.390.2580.1290.021
91.6512.211.830.40191.2020.413.905.970.4710.1170.020
101.2310.064.400.16787.8727.732.618.960.2140.1100.028
111.545.902.250.32691.5919.834.049.140.2930.1800.033
120.987.112.260.32689.8826.092.839.200.2870.1550.051
131.497.062.880.25683.7122.733.408.990.3180.1670.017
140.813.940.940.78291.2313.586.368.900.6450.2540.135
151.597.864.390.16792.4613.136.619.370.8340.1390.032
162.032.591.190.61989.7025.492.928.030.9170.4600.032
So: sorting coefficient. Pd: displacement pressure. Pc50: median capillary pressure. rmax: maximum pore throat radius. Smax: maximum mercury saturation. We: mercury withdrawal efficiency. PTR: the pore throat ratio, the average ratio of the pore volume and the throat volume derived from the mercury injection curve and ejection curve, respectively; PTR = S R S max S R , SR is the residual mercury saturation in the pores after completely mercury withdrawal. φHg: the porosity derived from MICP. r2.5, r25, and r75 (μm) are the pore-throat radius corresponding to 2.5%, 25% and 75% of mercury injection cumulative saturation, respectively.
Table 2. The petrophysical parameters from NMR and centrifuge experiment.
Sample No.Sir*
(%)
Sw*
(%)
C
(μm/ms)
R2.5
(μm)
R25
(μm)
R50
(μm)
R75
(μm)
167.9932.010.0270.1510.0370.0220.013
258.5741.430.0470.0680.0250.0160.010
356.8043.200.0340.1530.0530.0290.017
456.4743.530.0240.4910.0960.0400.021
563.8536.150.0060.8260.2610.0900.034
653.0246.980.0270.5250.0770.0380.019
758.8741.130.0190.9540.1230.0460.023
858.3741.630.0110.6300.2210.0840.030
940.8059.200.0271.0190.1750.0660.026
1042.2657.740.0151.3180.1770.0640.028
1152.4747.530.0091.1840.3080.0920.032
1255.5744.430.0141.2240.2290.0850.038
1339.6060.400.0171.3470.3100.0830.034
1444.9455.060.0121.6800.3810.1220.038
1526.8373.170.0240.9540.3060.0690.024
1615.0684.940.0573.4140.4190.1280.032
* Data from Li et al. [27]. Sir: irreducible water saturation. Sw: movable water saturation. C is a constant conversion coefficient representative of the shape factor (Fs) and surface relaxivity (ρ2). R2.5, R25, R50, and R75 (μm) are the pore radius corresponding to 2.5%, 25%, 50%, and 75% of cumulative pore volume percentage from NMR, respectively.
Publisher’s Note: MDPI stays neutral with regard to jurisdictional claims in published maps and institutional affiliations.

