Article

In Vitro Digestion and Fecal Fermentation of Polysaccharides from Hawthorn and Its Impacts on Human Gut Microbiota

Department of Nutritional and Food Safety, College of Food Science and Technology, Hebei Agricultural University, Baoding 071001, China
*
Author to whom correspondence should be addressed.
Processes 2022, 10(10), 1922; https://doi.org/10.3390/pr10101922
Submission received: 3 July 2022 / Revised: 25 August 2022 / Accepted: 13 September 2022 / Published: 22 September 2022

Abstract

:
Polysaccharides are biological macromolecules that are difficult to absorb into intestinal epithelial cells for exerting activities, whereas the interaction between polysaccharides and gut microbiota might be an alternative method. This study aimed to explore the in vitro digestion of hawthorn polysaccharides (HPS) and their interaction with the gut microbiota. Results showed that the content of reducing sugars increased slightly during gastric digestion. However, no free monosaccharide was detected during the whole simulated digestion process, indicating that HPS was indigestible. The total carbohydrate residue decreased during in vitro fermentation. This result was due to the utilization by the gut microbiota. Meanwhile, short-chain fatty acids were produced due to the utilization of HPS. Notably, HPS could significantly modulate the composition of human gut microbiota; in particular, the relative abundances of Megasphaera, Acidaminococcus and Mitsuokella increased, whereas the relative abundances of Escherichia Shigella and Fusobacterium decreased. It was suggested that HPS could decrease the abundances of harmful intestinal microbiota and regulate the proportion of beneficial bacteria in the intestinal tract. Overall, the beneficial effects of HPS were believed to be related to the gut microbiota and could be used as a potential dietary supplement.

1. Introduction

Hawthorn (Crataegus pinnatifida) is a large genus of fruit-bearing trees or shrubs distributed in Europe, East Asia, and North America, belonging to the Rosaceae family [1]. Hawthorn is reported to be one of the most widespread materials with medicinal values in the world; its leaves, flowers, and fruits contain various bioactive compounds. In China, hawthorn has been used as a source of medicinal and edible homologous species from ancient time because of its good taste with therapeutic effects on digestion [2]. Considerable reports have suggested that hawthorn fruit bioactive effects, such as antianxiety and anti-oxidation [3], among which the greatest clinical use of hawthorn is to treat cardiovascular diseases [4].
Hawthorn contains abundant minerals, proteins, phenolic compounds, and polysaccharides. There are large amounts of polysaccharides in hawthorn, and polysaccharides are among the most important bioactive components in hawthorn, which has attracted more and more attention because of its various health-promoting activities. Previous studies have found that hawthorn polysaccharide is composed of glucose, arabinose, fucose, galactose, galacturonic acid, rhamnose, and xylose [5] linked by α-1,4 glycosidic bonds [1]. Recent studies have suggested that HPS had beneficial effects on the treatment of various diseases, such as inflammation [6], high blood pressure, colon cancer [5], and immunosuppression [7]. Clearly, HPS is a valuable functional food ingredient. However, it is not clear how HPS performs these functions.
As types of biological macromolecules, polysaccharides have low bioavailability due to their high molecular weight and the lack of polysaccharide-degrading enzyme genes in the human body [8]. At present, the in vitro digestion study of polysaccharides is mainly based on the simulated digestion of saliva, gastric juice, and intestinal juice [9], and investigated by the change in molecular weight, reducing sugar content, and free monosaccharides [10]. Previous studies indicated that the content of reducing sugar in different sources of polysaccharides increased, and no free monosaccharides were released during gastrointestinal digestion, for instance, wheat germ polysaccharide [11], soybean polysaccharide [12], pumpkin polysaccharide [13], etc. The microbiota in the colon could ferment and utilize most of the indigestible polysaccharides, which could interact with gut microbiota and promote productions of multiple metabolites, especially short-chain fatty acids (SCFAs) [14,15]. In fact, polysaccharides have been regarded as prebiotics; a mass of evidence has confirmed that the intake of polysaccharides altered the abundances of the gut microbiota, which especially increased with the SCFAs producing intestinal microbiota, for example, Lactobacillus and Bifidobacterium [16]. The complex interactions between polysaccharides and gut microbiota have been shown to be beneficial for regulating health [17]. However, there are limited studies on HPS digestion and its interaction with intestinal microbiota.
Therefore, this study investigated the changes in structural characteristics of HPS during simulated in vitro digestion and fermentation of gut microbiota. In addition, the interactions with gut microbiota and HPS were also studied. This study provided evidence for HPS to maintain intestinal health through interaction with intestinal microbiota, and supported the evaluation of its nutritional value and wider application in the development of new nutritional products.

2. Materials and Methods

2.1. Materials and Chemicals

Mature “Da Jinxing” hawthorn fruits were obtained from City Xinglong, Hebei Province, in China. Alpha-amylase, pepsin, pancreatin, trypsin, and bile salt were purchased from Beijing Solarbio Technology Co., Ltd. (Beijing, China). Cysteine, hemin, and vitamin K1 were all purchased from Shanghai Macklin Biochemical Co., Ltd. (Shanghai, China). All other chemicals and reagents used were of analytical grade. Hawthorn polysaccharides (HPS) were extracted using our previous reported method [5].

2.2. In Vitro Digestion of HPS

2.2.1. Simulated Saliva–Gastrointestinal Digestion

The simulated saliva–gastrointestinal digestion of HPS was performed based on the method with some modifications, as described by Yuan [18]. In general, the simulated saliva was prepared with 0.1529 g NaCl, 0.2982 g KCl, 0.0266 g CaCl2, 0.0863 g α-amylase, and 200 mL distilled water (pH 6.9 ± 0.05). In total, 2.4 mL of HPS solution (5.0 mg/mL) and 2.4 mL of simulated saliva were added into each centrifugal tube at 37 °C in a water bath shaker. After 5 min of incubation, the digestion solution was collected and boiled for 30 s to terminate the reaction.
Afterwards, 0.31 g NaCl, 0.11 g KCl, 0.015 g CaCl2, and 0.0331 g of pepsin were added into 100.0 mL of distilled water and 1.6 mL of the above solution, and added into the salivary digestion solution; then, the pH was adjusted to pH 3.0 ± 0.05 by HCl (0.1 M). After incubation at 37 °C for 1.0, 2.0, 4.0, and 6.0 h, the reaction solution was taken out at the corresponding time and boiled for 30 s to terminate the reaction.
Finally, 70 mg/mL of trypsin and 40 mg/mL of bile salts were added into the saliva–gastric digested samples at a ratio of 1:3 (v/v), and the pH was adjusted to 7.0 ± 0.05 with NaHCO3 (1 M). After incubation in a shaker at 37 °C for 1.0, 2.0, 4.0, and 6.0 h, the reaction solution was taken out at the corresponding time and boiled for 30 s to terminate the reaction.

2.2.2. Determination of the Content of Reducing Sugars

The contents of reducing sugars (CR) in digestion samples were determined using the 3,5-dinitrosalicylic acid (DNS) colorimetric method according to the previous method with minor modifications [19]. In total, 600 µL of the DNS solution was added into 200 µL of the HPS digestion solution at each stage; then, 3.2 mL distilled water was added into the above solution in a boiling water bath for 15 min after cooling. The absorbance was measured at 550 nm.

2.2.3. Determination of Free Monosaccharide

The analysis of free monosaccharide composition in digestion HPS samples was performed using the method of pre-column 1-phenyl-3-methyl-5-pyrazolone (PMP) derivatization, which was recorded in our previous reference [20]. In total, 120 µL 0.3 M NaOH and 120 µL 0.5 M PMP methanol were added into 200 µL HPS digestion solution of each stage, respectively; then, the above solution was placed into a water bath at 70 °C for 2 h, and cooled to room temperature after the reaction. In total, 120 µL 0.3 M HCl was added into the above solution for neutralization; finally, 2 mL chloroform was added to remove unreacted PMP in the solution. The upper aqueous phase was analyzed by high-performance liquid chromatography after passing through 0.45 μm aqueous phase membrane.

2.2.4. Infrared Spectroscopy Analysis of Digestion Products

In total, 20 µL of HPS digested sample after freeze-drying and 0.2 g potassium bromide (KBr) powder were mixed and pressed into 1 mm slices. Spectral scanning of HPS digestion samples in the region of 500–4000 cm−1 was carried out using infrared spectroscopy [14].

2.2.5. Scanning Electron Microscope (SEM) Analysis

After spraying gold on each sample and taping to the holder, HPS and digested HPS (salivary digestion of HPS for 0.05 h, saliva–gastric digestion of HPS for 6 h, and saliva–gastric-intestinal digestion of HPS for 6 h) were observed and collected by using an electron microscope (SEM, Hitachi SU8020, Tokyo, Japan) at 200× and 500× magnifications, respectively [21].

2.3. In Vitro Fermentation of HPS

2.3.1. In Vitro Fermentation Using Human Fecal Inoculum

Fresh fecal matter was collected from 4 healthy volunteers (2 females and 2 males, aged from 18 to 30 with no gastrointestinal disorders and no treatment history of antibiotic use for the last three months). All volunteers were informed of the purpose and the procedure of this study and provided their written consent for this experiment. This research was approved by the Research Ethics Committee of College of Food Science and Technology in Hebei Agricultural University (REC-2020-025). In total, 10% of fecal slurry (w/v) was obtained by diluting the sample with sterile modified saline solution (cysteine-HCl 0.5 g/L and NaCl 9.0 g/L), homogenizing and centrifuging at 4 °C, 500 rmp for 5 min, and then the supernatant was collected. The fermentation medium was prepared according to methods with some modifications [22]. Then, 2.0 mL of the supernatant was mixed with 18.0 mL of sterilized fermentation medium and 4.0 mL 50.0 mg/mL of HPS (the HPS group), respectively. The fermentation medium and fresh feces were set as the blank group and the fresh manure group, respectively, under the same conditions. Then the mixture was incubated in a constant temperature shaker at 37 °C. The anaerobic conditions were maintained throughout the manure fermentation process by using a C-22 anaerobic chamber purchased from Mitsubishi Japan. The fermented samples were collected at 0, 6, 12, and 24 h and placed in an ice-water bath for 15 min to terminate the reaction for further analysis.

2.3.2. Determination of pH, CR and Carbohydrate Content during In Vitro Fermentation

The supernatant at the fermentation time of 0, 6, 12, and 24 h were centrifuged at 4000 rpm for 10 min and then the pH was determined.
The CR in fermentation samples was determined according to the methods above.
Additionally, the determination of total sugar content was carried out using the phenol–sulfuric acid method with minor modifications [23].

2.3.3. Determination of Monosaccharide

The pre-column PMP derivatization and HPLC analysis of monosaccharide composition in fermentation HPS samples were measured by the methods above.

2.3.4. Determination of SCFAs

Agilent 7890 series gas chromatography system (Agilent Technologies, Palo Alto, CA, USA) equipped with HPINNOWAX column (30 m × 0.25 cm × 0.25 μm, Agilent Technologies, Palo Alto, CA, USA) was used to determine the concentration of SCFA with fermentation time of 0, 6, 12, and 24 h [24]. Briefly, the fermented broths were centrifuged at 4000 rmp for 10 min. The supernatant (1 mL) was added into 2 mL of hexane, left to stand for 20 min, and centrifuged at 3000 rpm for 10 min. Finally, the mixture was filtered through a 0.25 μm membrane filter, and then the filtrate analyzed by using Agilent 7890A gas chromatography equipped with a 30 m × 0.25 mm, 0.25 μm film thickness, polar DB-FFAP capillary column (Agilent Technologies, Palo Alto, CA, USA) under the following conditions: N2 flow rate was 24 mL/min and the initial temperature was 90 °C for 2 min, rising to 150 °C at a rate of 6 °C/min and holding for 0.5 min. The injection temperature and detector temperature were 200 °C and 240 °C, respectively.

2.3.5. Gut Microbiota Analysis during In Vitro Fermentation

DNA in samples after fermentation for 24 h was extracted using a Genomic DNA Kit (Tiangen, Beijing, China). The final DNA quality was checked by 1% agarose gel electrophoresis. The V3-V4 region of the bacterial 16S rRNA gene was amplified with 338F (5′-ACTCCTACGGGAGGCAGCAG-3′) and 806R (5′-GGACTACHVGGGTWTCTAAT-3′) primer pairs using an ABI GeneAmp® 9700 PCR thermocycler (ABI, Los Angeles, CA, USA). The PCR products were extracted from 2% agarose gel and recovered by cutting the gels using an AxyPrep DNA Gel Extraction Kit (Axygen Biosciences, Union City, CA, USA). Referring to the preliminary quantitative results of electrophoresis, the PCR products were treated with QuantiFluor ™- ST quantification system (Promega, Madison, WI, USA) was used for detection and quantification, and then the corresponding proportion was mixed according to the sequencing volume requirements of each sample.
Amplicons were quantified, pooled, and sequenced using an Illumina MiSeq machine, according to the standard protocols by Majorbio Bio-Pharm Technology Co., Ltd. (Shanghai, China). The similarity of sequences ≥97% was assigned to the same operational taxonomic units (OTUs). The sequences were pruned using UCHIME and annotated with a threshold of 70% using an RDP classifier based on the Silva database (SSU123). Alpha diversity was used to analyze the complexity of the sample species diversity.

2.4. Statistical Analysis

All experiments were repeated three times, and data were expressed as mean ± standard deviation (SD). The 64-bit of Origin 2018 (Northampton, MA, USA) was used to plot the experimental data. Significant difference analysis was performed using SPSS 19 software data (Stanford, CA, USA). The values of p < 0.05 or 0.01 were considered to be statistically significant.

3. Results and Discussion

3.1. Dynamic Changes in HPS during In Vitro Digestion

3.1.1. Changes in CR in HPS

The CR released from HPS during in vitro digestion was analyzed, and the results were shown in Table 1. The original CR in HPS without digestion was 0.082 ± 0.0041 mg/mL. The CR was 0.083 ± 0.0023 mg/mL after 5 min of saliva digestion, which had no significant difference compared with the original CR, suggesting that HPS could not be degraded by the simulated saliva. Afterwards, the CR remarkably increased from 0.100 ± 0.0055 mg/mL to 0.104 ± 0.0077 mg/mL during gastric digestion, and was generally stable during intestinal digestion, which ranged from 0.105 ± 0.0061 mg/mL to 0.107 ± 0.0064 mg/mL. It was confirmed that the HPS could be hydrolyzed at acid environment and digestive enzymes during gastrointestinal digestion [8]. Compared with the original CR, the CR significantly increased during saliva–gastrointestinal digestion. The reason for this was that the breakage of glycosidic bonds in polysaccharides led to the increase in reducing sugar content [25].

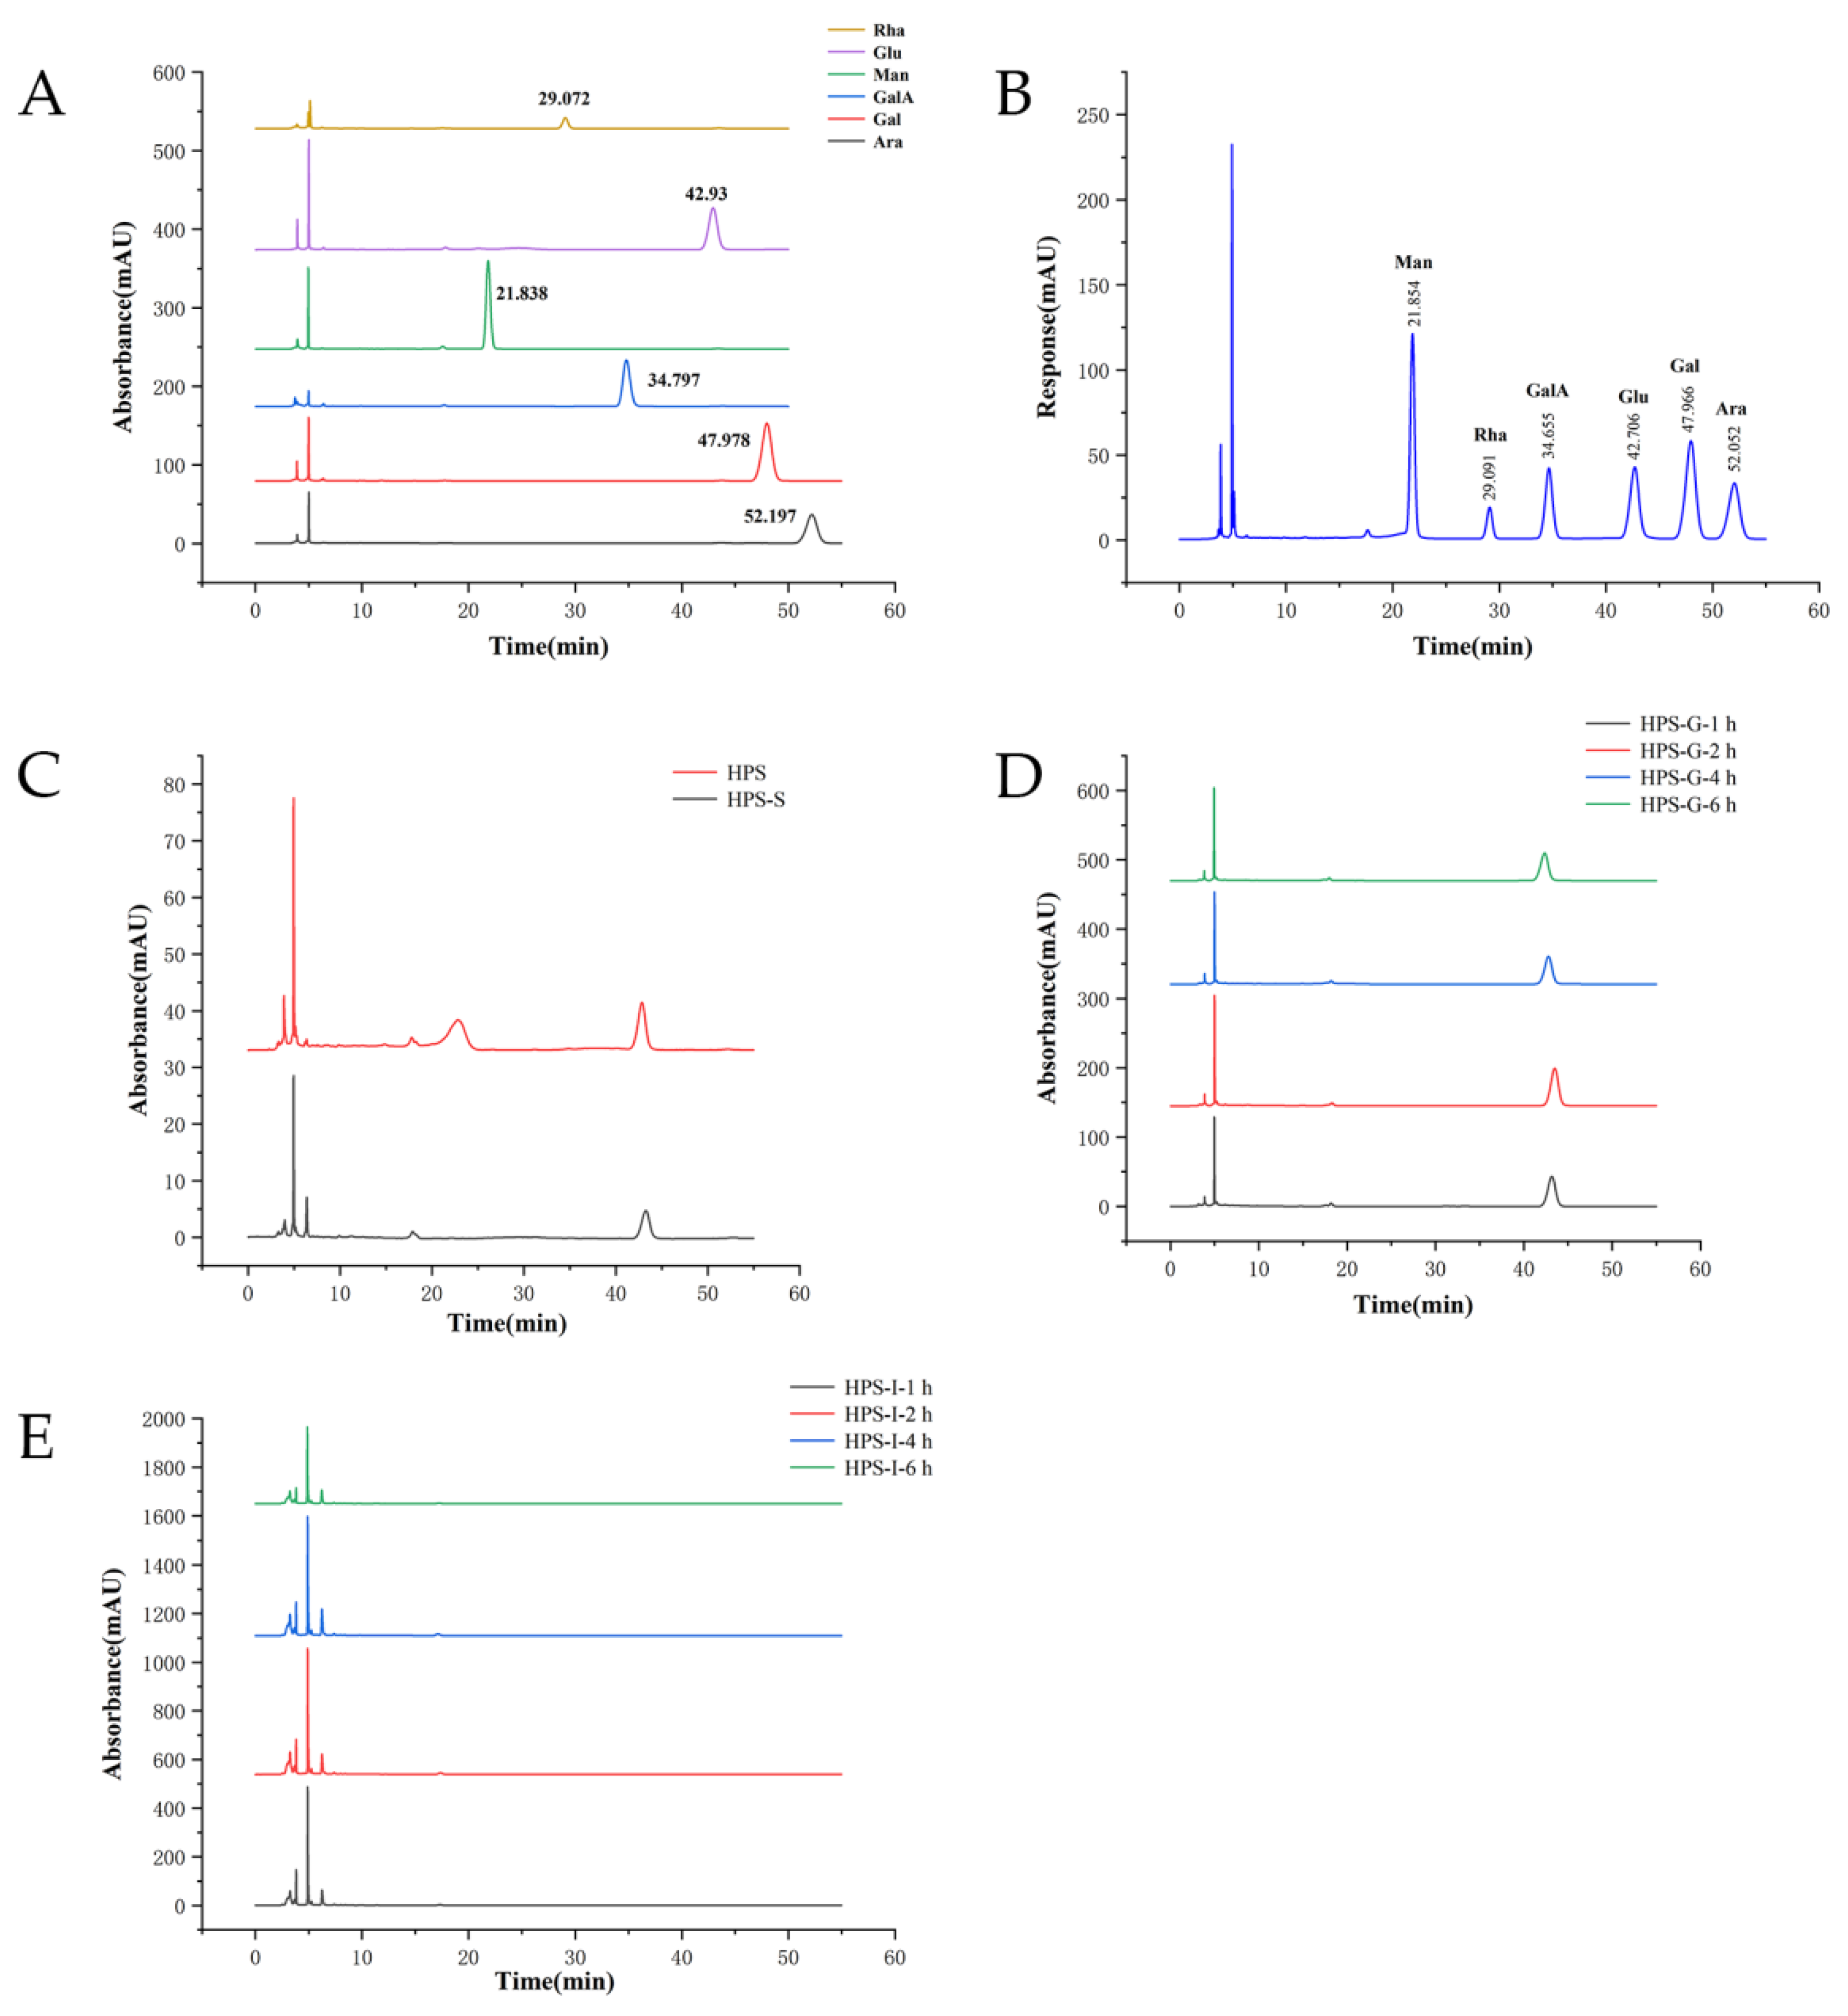
3.1.2. Changes in Free Monosaccharides in HPS

In addition, the production of free monosaccharides by HPS during in vitro digestion was analyzed (Figure 1). The results showed that no free monosaccharides were released from HPS during in vitro digestion. Similar results were surveyed in the constituent monosaccharides of OPP-D and its digested samples from okra (Abelmoschus esculentus) [26]. However, glucose was not detected during the intestinal digestion, which may be because glucose is unstable on the HPS branch chain and is easily degraded by the intestine in the low pH environment. [18].

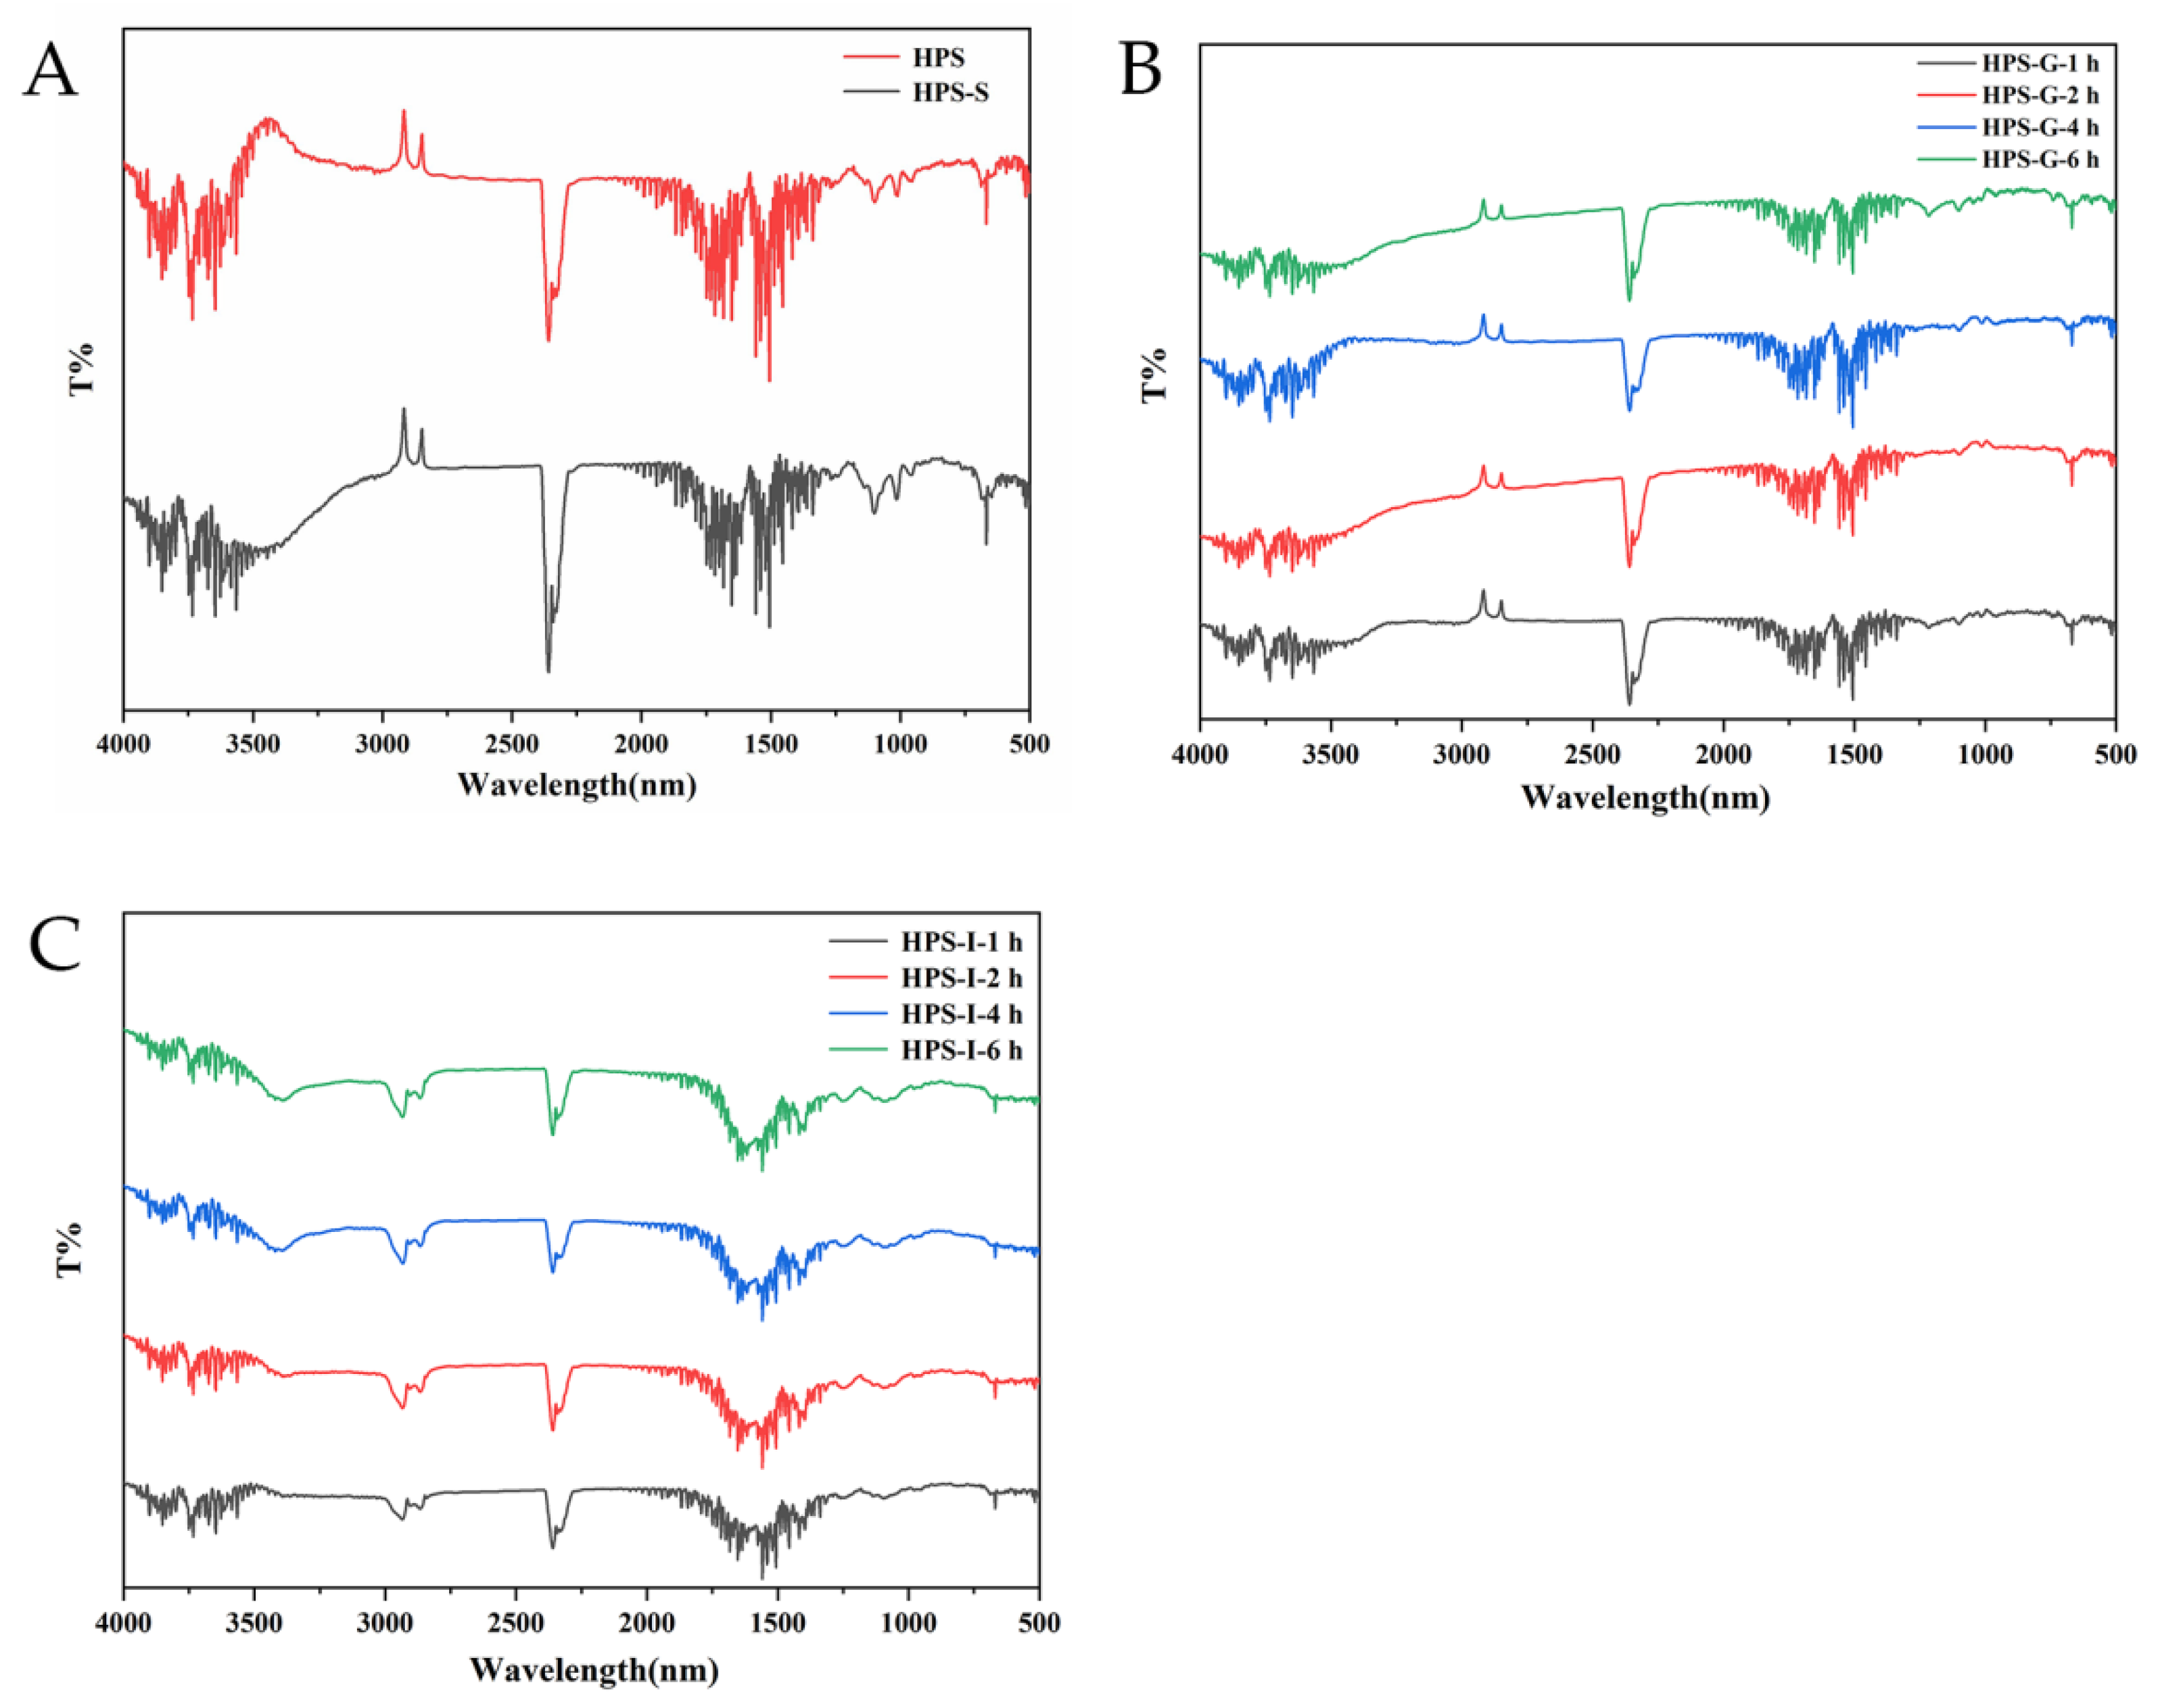
3.1.3. Changes in FT-IR Spectra

The FT-IR spectra of HPS digested samples were explored, and the results were shown in Figure 2. Briefly, the signal at 2358 cm−1 was the vibration absorption peak of the C-H [27]. The signal bands ranging from 2000 to 1300 cm−1 were the C=O tensile vibrations [14]. The absorption peak at 1500 cm−1 might be due to the tensile vibration of C-H or O-H [28]. These results are similar to previous studies which the absorption peak of okra polysaccharide at 1419 cm−1 was confirmed as C-H or O-H vibration and the signal bands ranging from 3000 to 2800 cm−1 were the C-H tensile vibrations [19]. Moreover, results were shown that the saliva-gastrointestinal digestion in vitro would not change the other structural features of HPS.

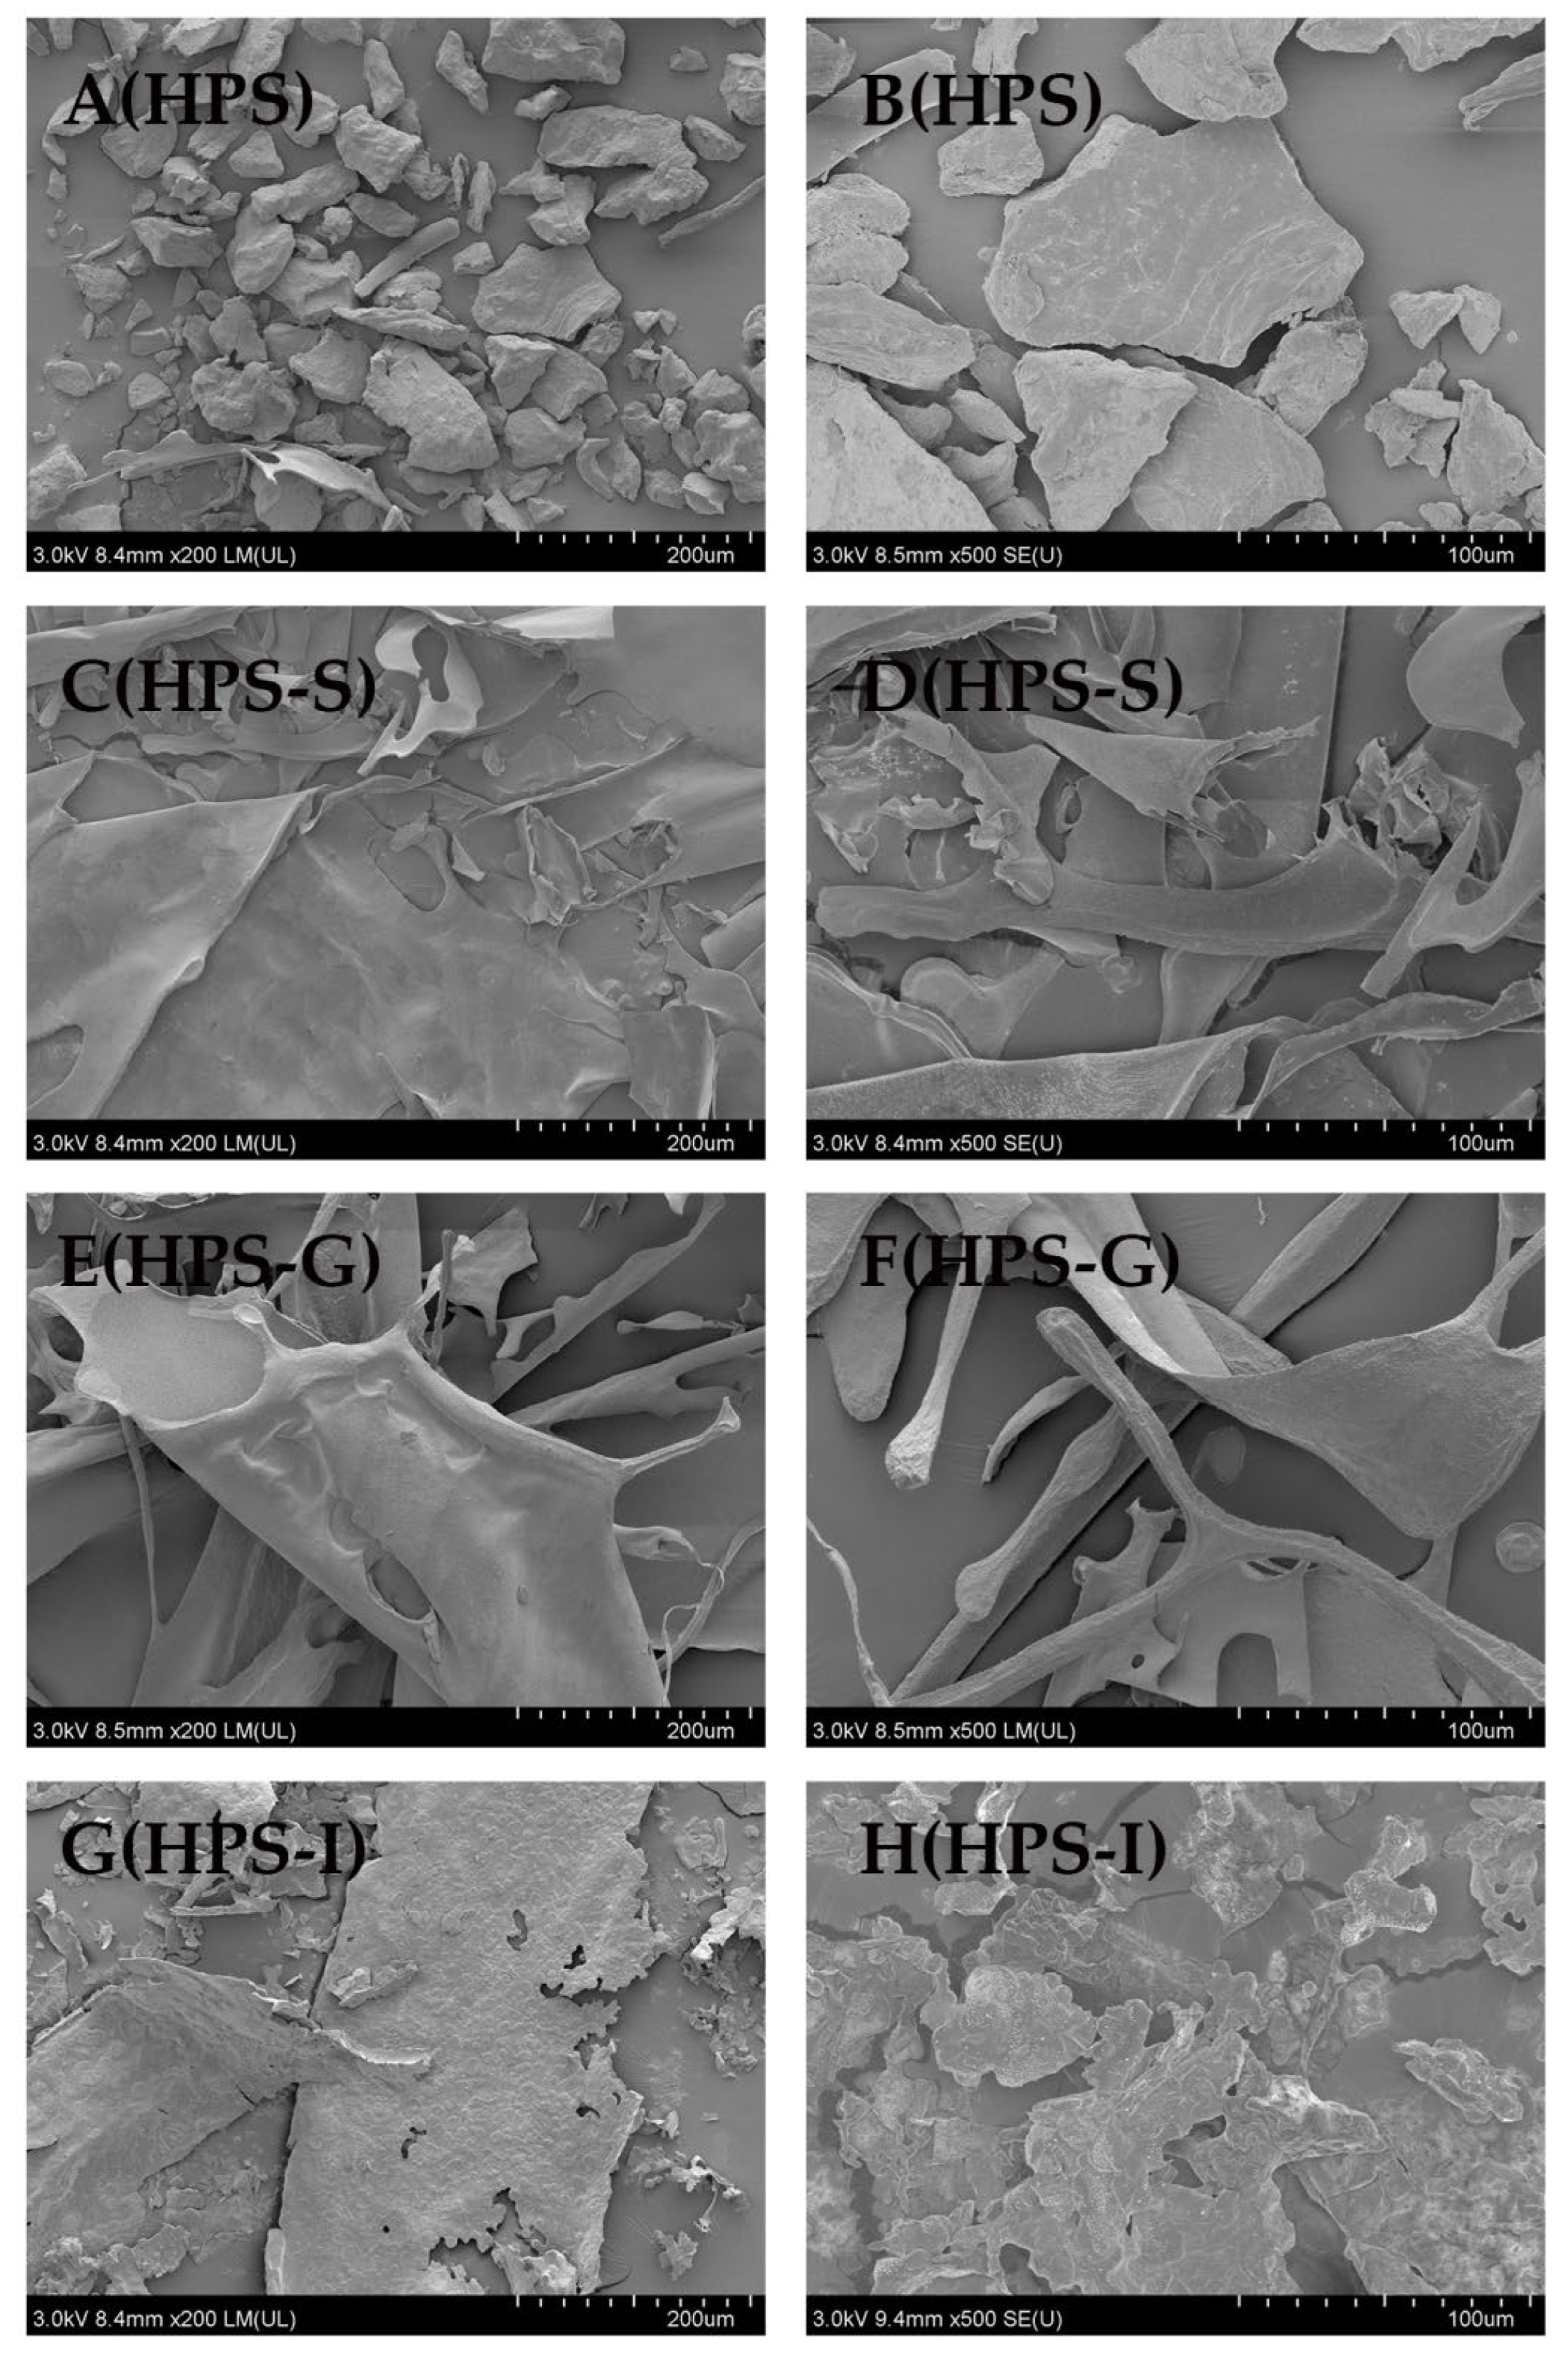
3.1.4. Surface Structure of HPS during In Vitro Digestion

SEM is an important way to observe surface morphology, and we analyzed the surface morphology after HPS simulated in vitro digestion. As shown in Figure 3, HPS showed a smooth flake or block structure. After salivary digestion, the HPS structure was still flaky, which is similar to the undigested surface. The shape of the sample had changed into trips after gastric digestion for 6 h. After 6 h of intestinal digestion, the HPS surface was rugged, with obvious protrusions and many cavities and cracks. Li et al. also reported that the surface structure of tea polysaccharides showed similar changes during in vitro digestion [27]. The structural changes in HPS may be due to the interplay between polysaccharides, digestive enzymes and electrolytes during simulated gastrointestinal digestion, thus forming irregular pieces [28].

3.2. Dynamic Changes in HPS during In Vitro Fermentation

3.2.1. Changes in pH, CR, and Residual Carbohydrates in HPS

The changes in pH after 0, 6, 12, and 24 h of fermentation were shown in Table 2. In the blank group, the pH decreased from 8.29 ± 0.046 to 7.19 ± 0.026 after 24 h fermentation and then remained stable and alkalescent. Meanwhile, the pH of the HPS groups descended suddenly from 7.37 ± 0.026 to 5.37 ± 0.026, which is significantly lower than that of the blank group (p < 0.05). These results might infer that the SCFAs produced continuously decreased the pH of their surroundings during in vitro fermentation [29].
Most indigestible polysaccharides could be decomposed by the intestinal microbiota to produce reducing sugars, which could be used as a carbon source [17]. As shown in Table 3, CR of HPS in the fermentation broth increased first at 6 h, and then decreased, which ranged from 0.388 ± 0.060 mg/mL to 0.300 ± 0.080 mg/mL in HPS, indicating that both of them demonstrated a degradation in polysaccharides in the process of fermentation; afterwards, reducing sugars produced by HPS could be used by the intestinal microbiota [30].
With the prolongation of fermentation time, the residual carbohydrate in HPS group decreased gradually. In detail, the residual carbohydrate after 24 h fermentation in HPS group significantly decreased to 94.77%, respectively, indicating that carbohydrates were fermented and utilized by intestinal microbiota. Our results were similar to the study detailing how the CR of aloe polysaccharides and pH decreased continuously during fecal fermentation [29].

3.2.2. Changes in Free Monosaccharides in HPS

Human gut microbiota could degrade and use polysaccharides, leading to changes in monosaccharide composition [31]. The structure of glycosidic bond and monosaccharide composition determined the degradation rate of polysaccharides during fermentation [32]. In the initial fermentation of HPS, we detected mannose; the content was 14.196 ± 0.368. With the prolongation of fermentation time, mannose could not be detected. The reason for this result might be that monosaccharides were utilized by the gut microbiota. Some bacteria metabolized glycans by secreting carbohydrate-active enzymes, such as Bacteroides, Firmicutes, and Bifidobacterium [33].

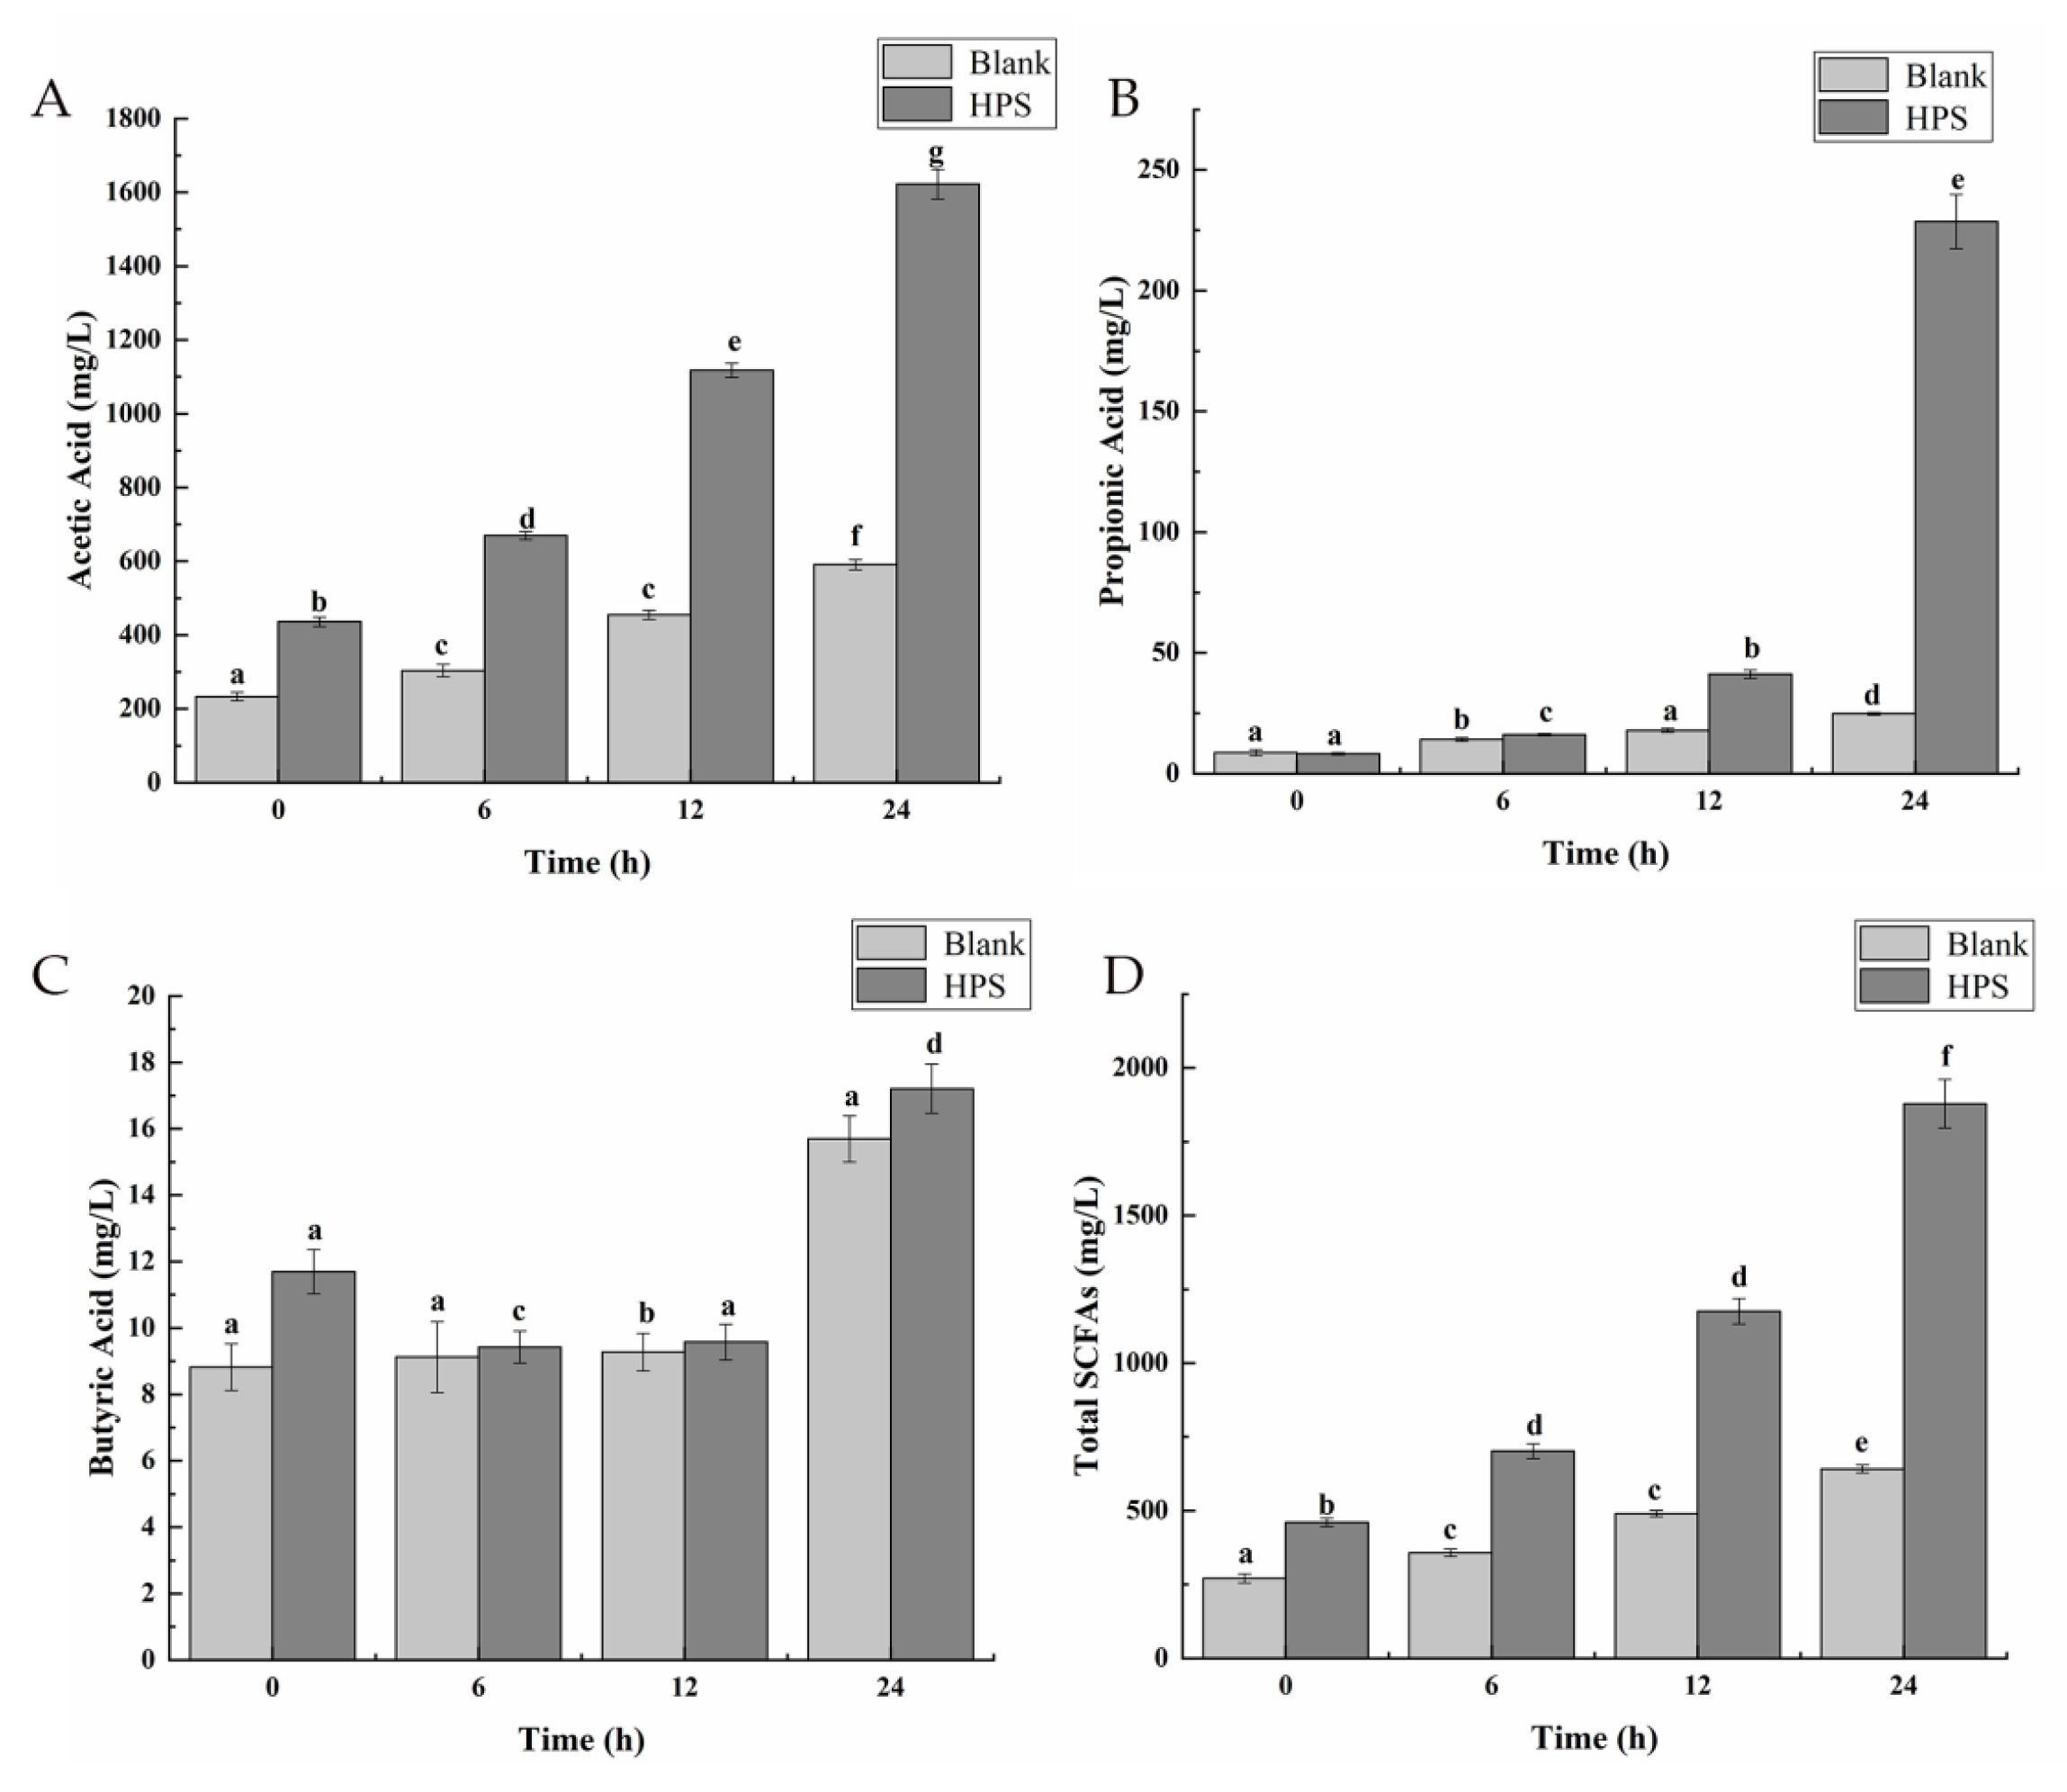
3.2.3. Effects of HPS on SCFAs Production

SCFAs were the main products of microbial fermentation polysaccharides [34]. Studies have shown that SCFAs that were produced by polysaccharides in fermentation could lower the pH of gut surroundings and inhibit the proliferation of some pathogens and colon cancer, which plays an important role in maintaining human safety [35]. Therefore, we detected the SCFA concentrations during the fermentation of HPS. The concentrations of SCFAs during in vitro fermentation of HPS were shown in Figure 4. Numerous studies have confirmed that acetic acid was an important energy source for intestinal cells [36], which was related to some effects on lipid metabolism [37]. Butyric acid could maintain intestinal homeostasis and provide energy for intestinal epithelial cells, which played an important role in preventing colitis and colon cancer [38]. Propionic acid is associated with the reduction in serum cholesterol levels, which also can improves insulin sensitivity and exert immunosuppression [39]. Compared with the blank group, the final concentration of total SCFAs increased in the HPS group from 6 to 24 h, suggesting that HPS had a positive effect on production of SCFAs. In detail, acetic acid and butyric acid were significantly higher in the HPS group compared with the blank group at any fermentation time point (p < 0.05). At 24 h, the concentrations of propionic acid were significantly higher than in the blank group. The results were identical with the results of a study on polysaccharides from Rosa roxburghii Tratt fruit [30], of which acetic acid and propionic acid were the main fermentation products, and the content of total fatty acids in fermentation products increased.

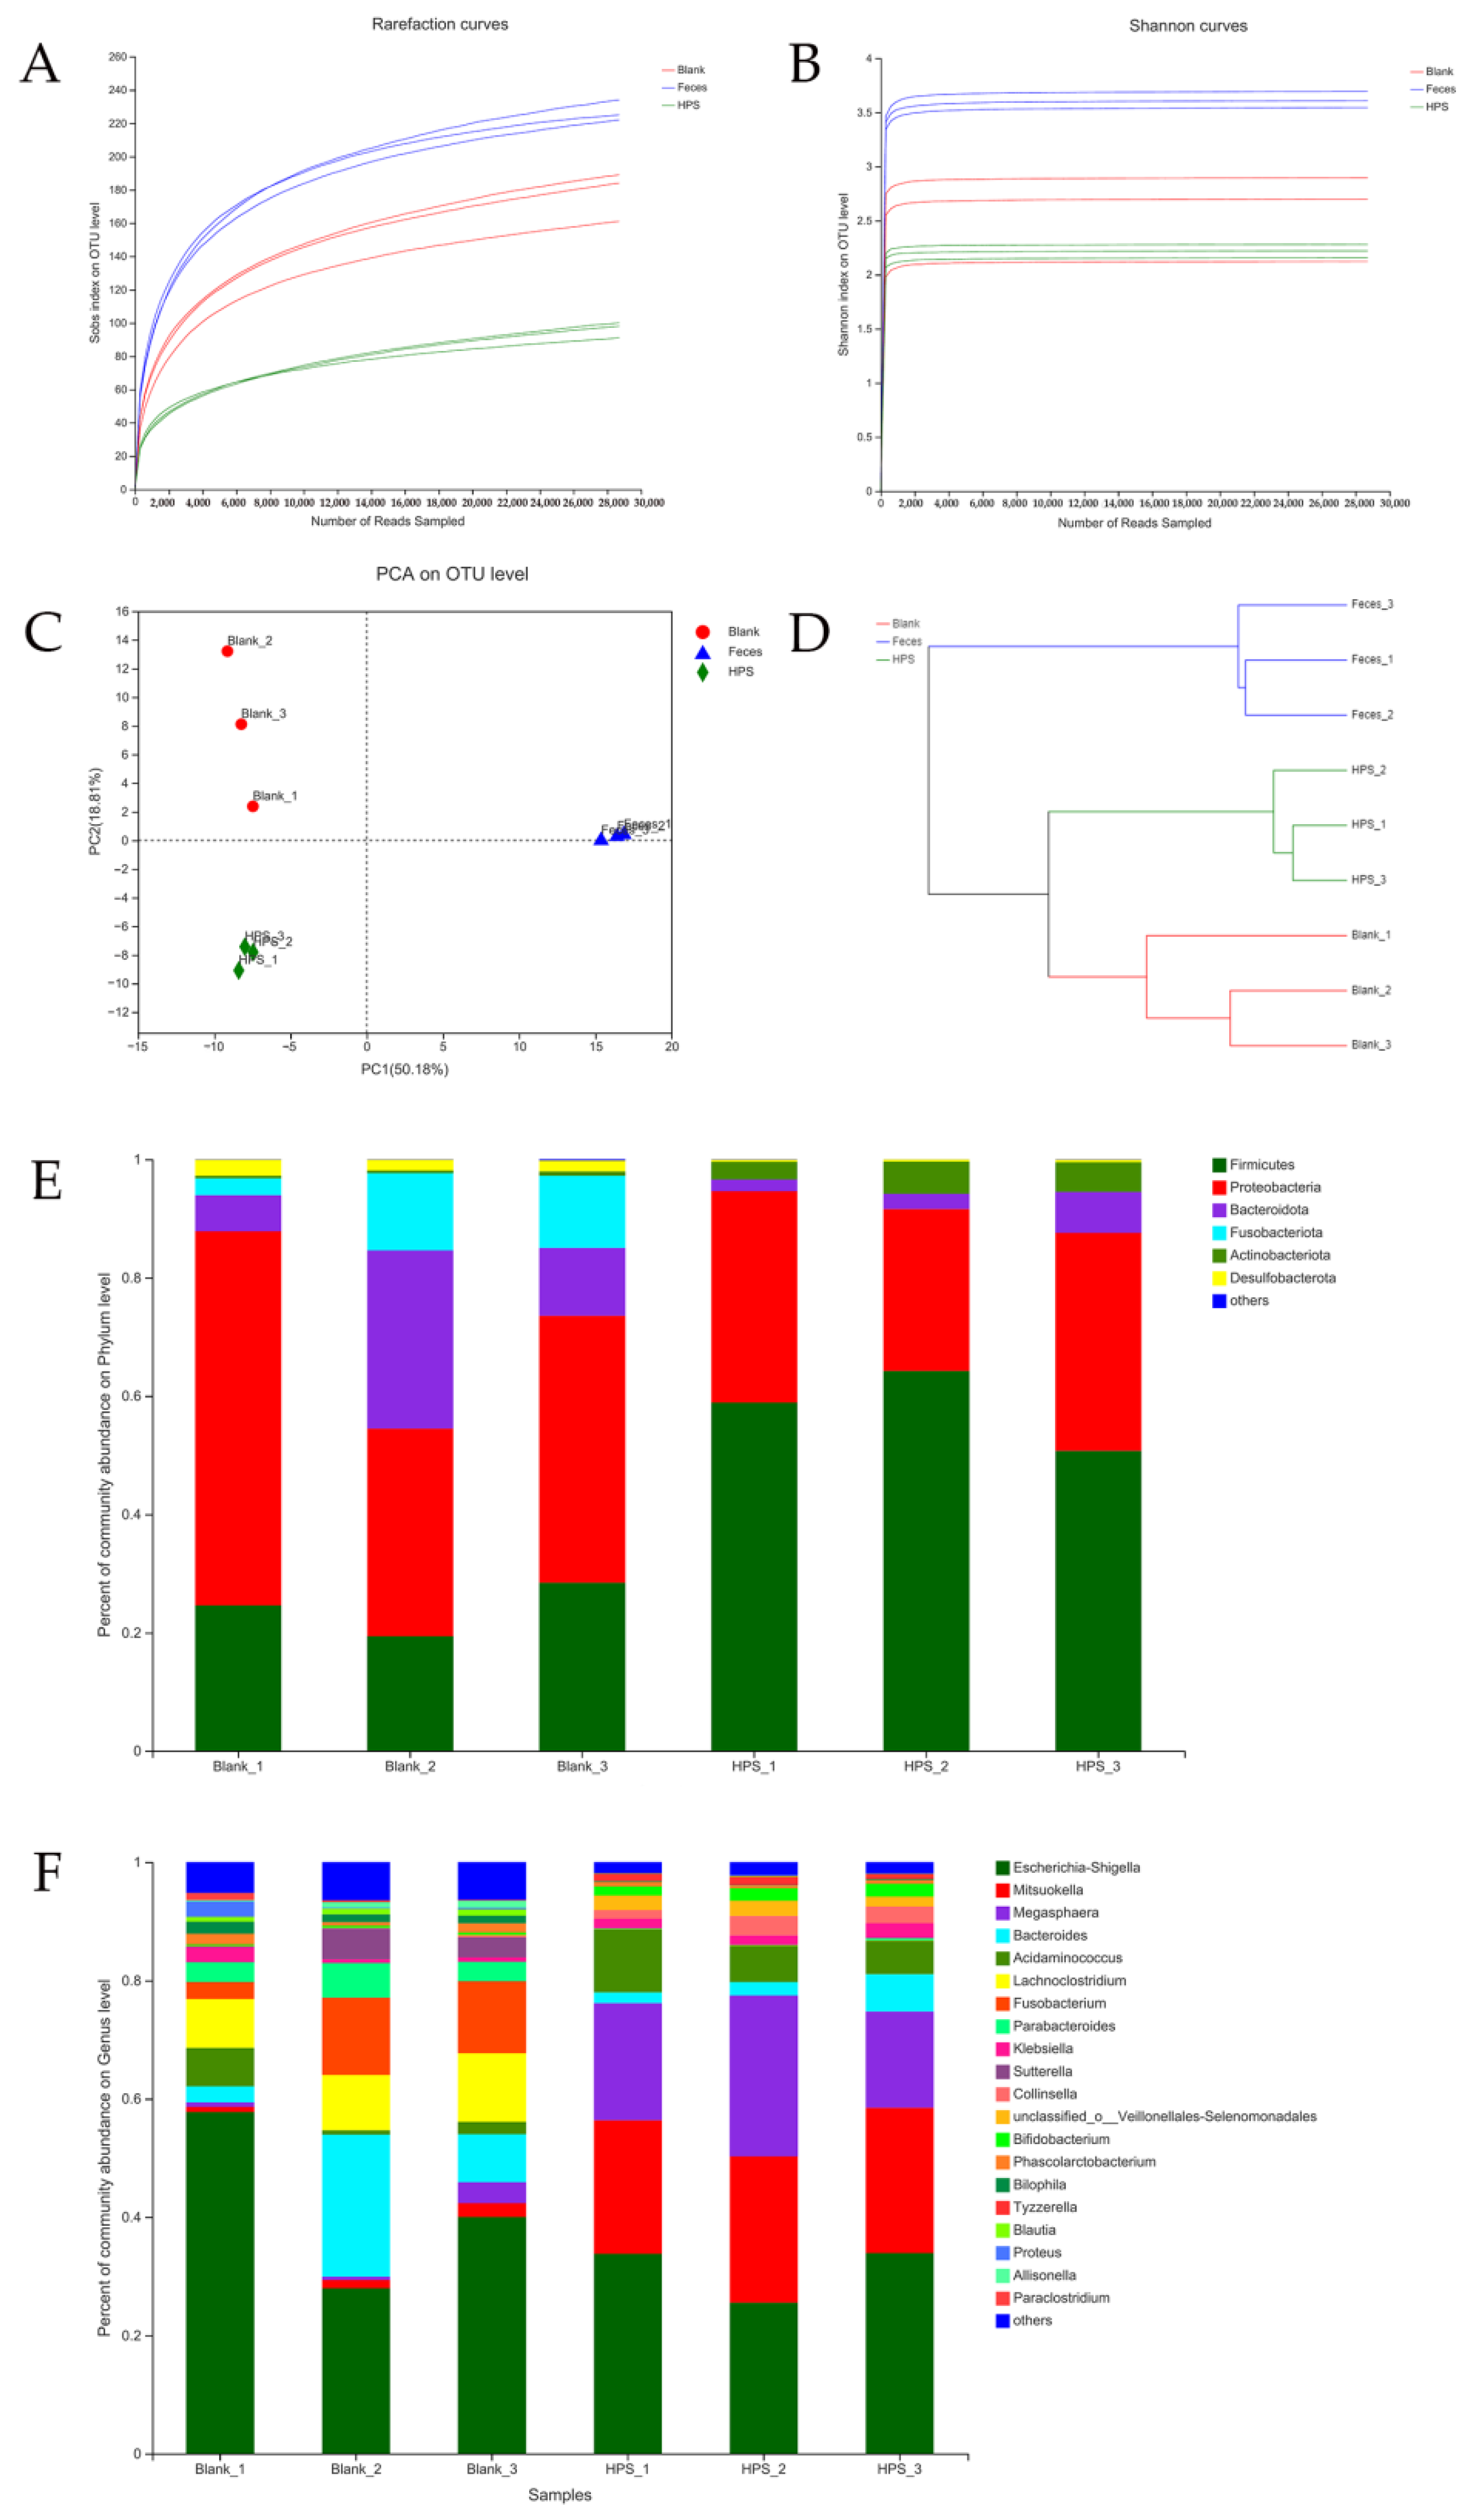
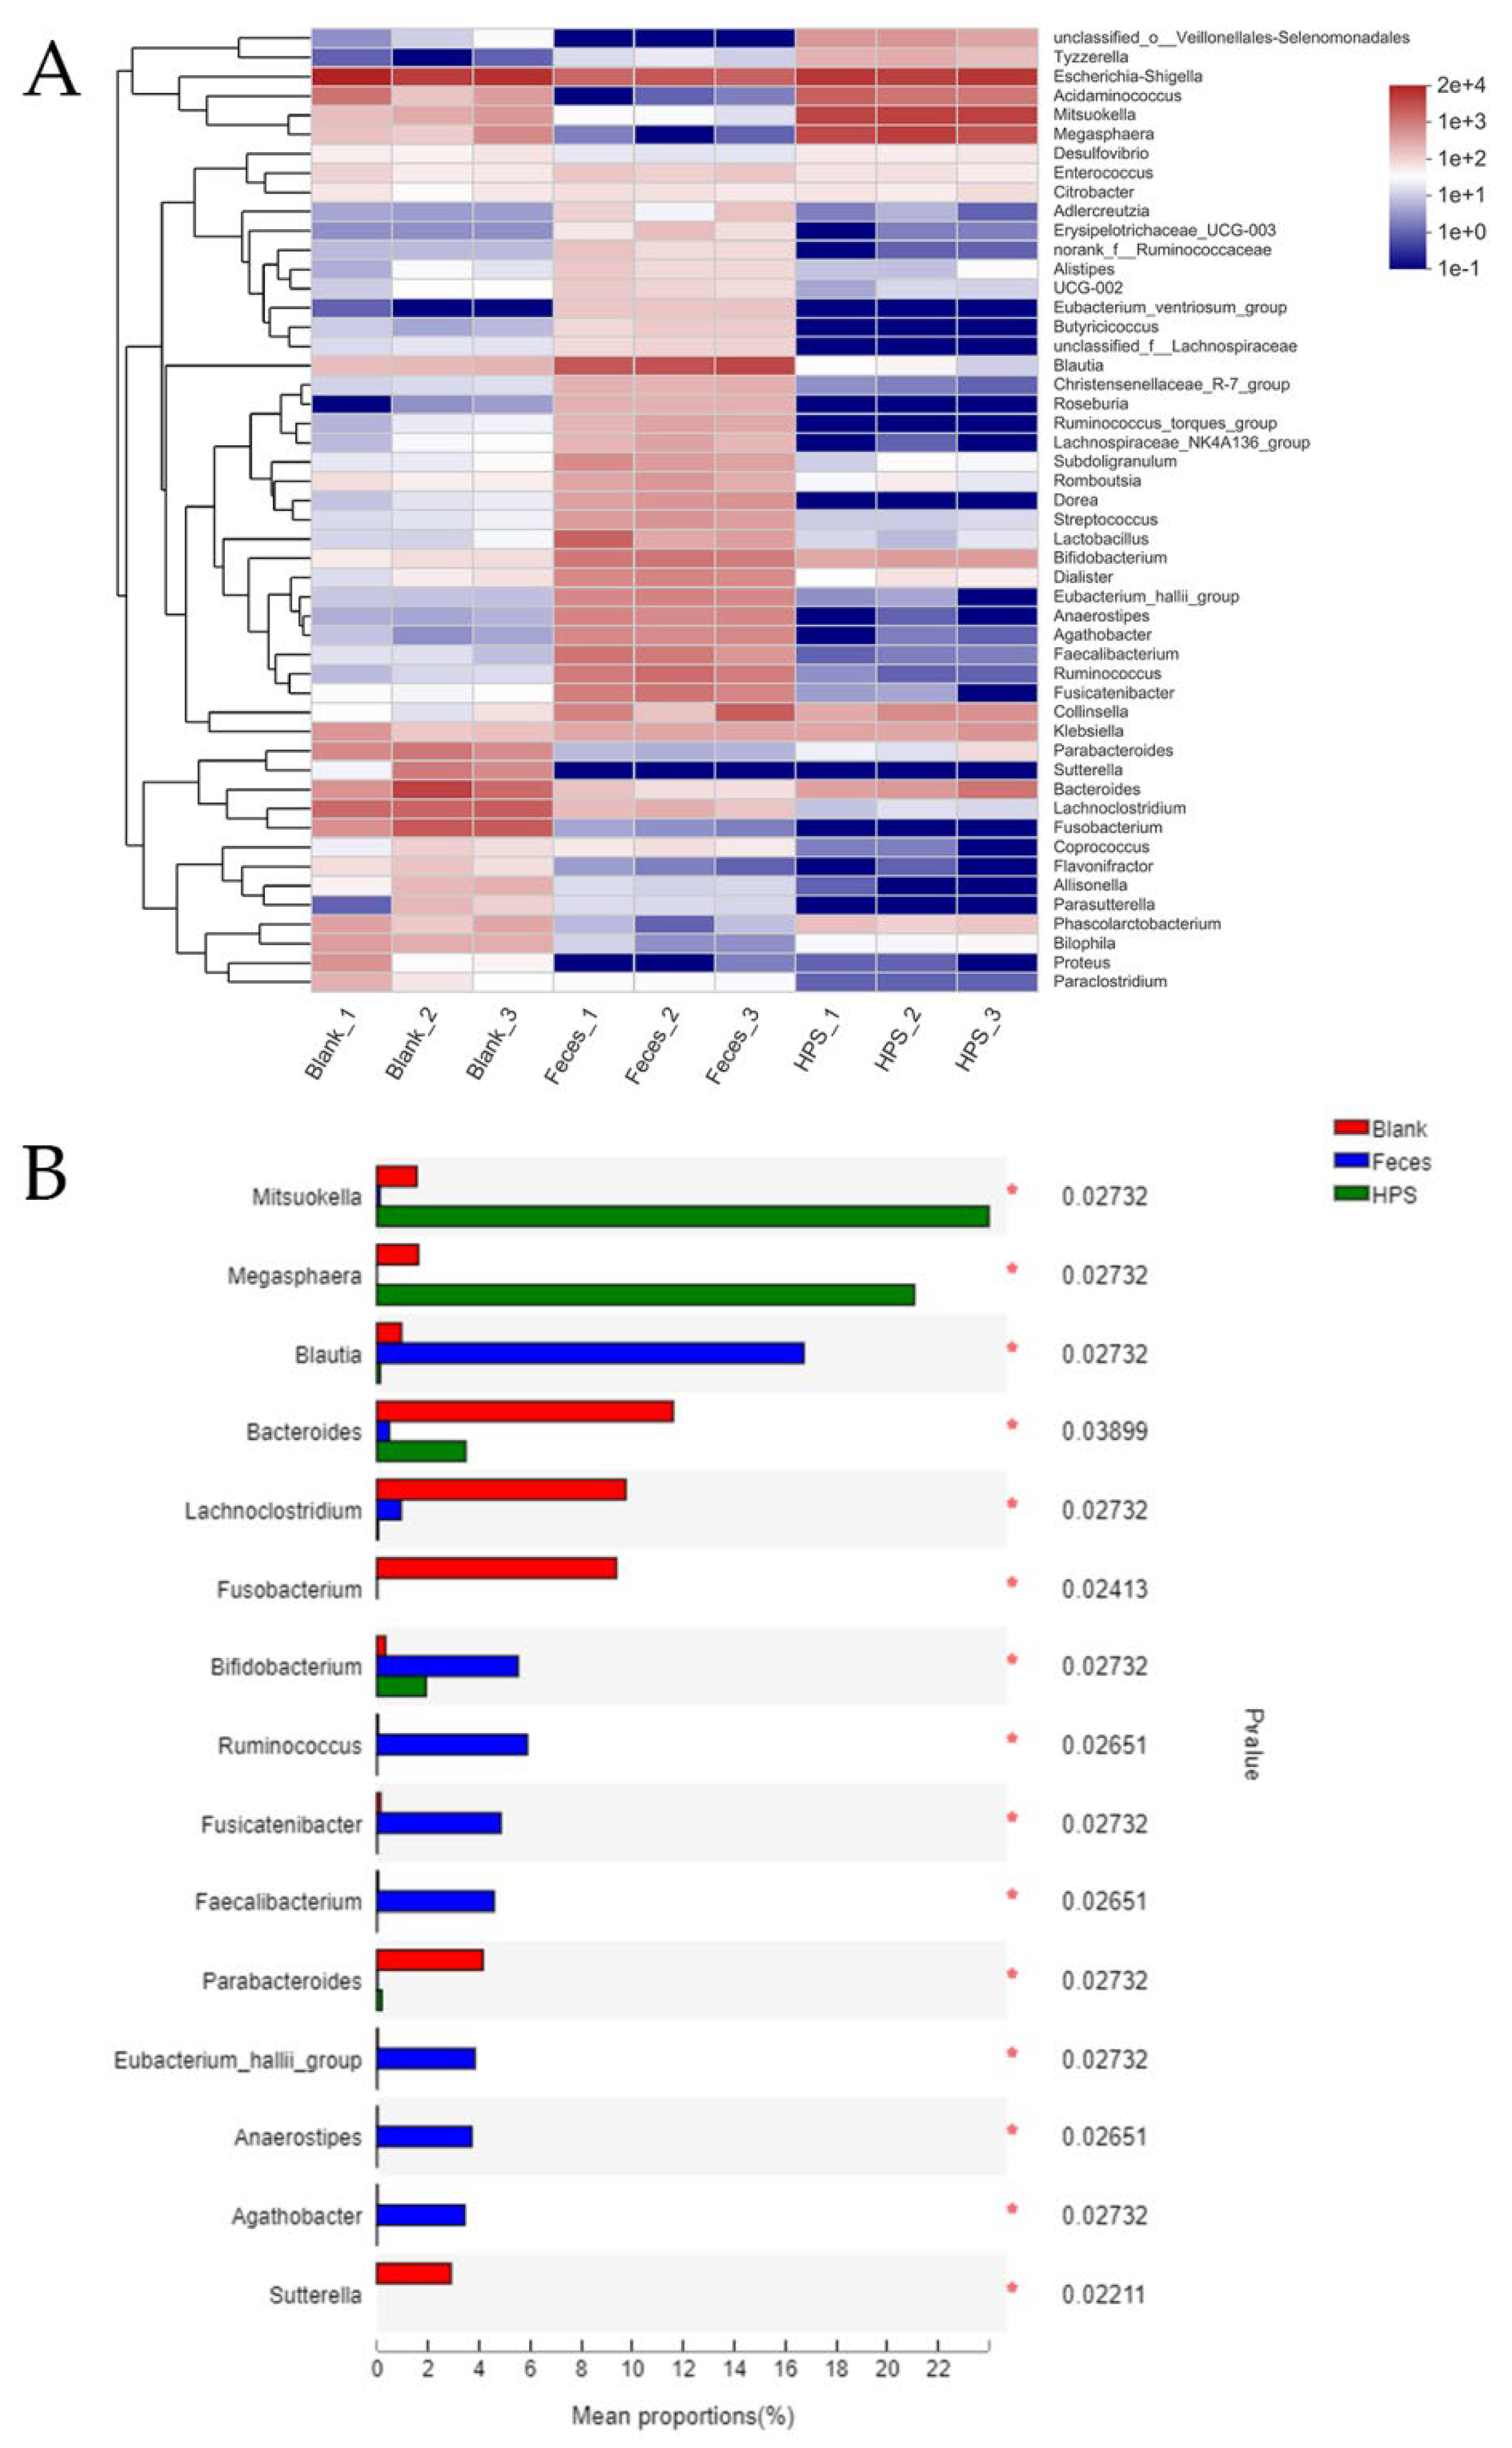
3.2.4. Effects of HPS on Gut Microbiota

The results of Shannon curves and rarefaction curves were shown in Figure 5A,B, which were used to estimate whether sample size and sequencing depth were enough to investigate the intestinal microbiota. These curves showed that the Shannon curve tended to be flat with the increase in sequencing depth and sample size, which indicated that the data were reasonable and could reflect the diversity and richness of the gut microbiota.
The alpha diversity results, including Chao1, ACE, Shannon, and Simpson, were shown in Table 4. The Chao1 and ACE index in the HPS group were significantly lower than the blank group (p < 0.05). The Shannon and Simpson index in the HPS group had no significant difference with the blank group. The diversity and abundance of gut microbiota in the HPS group were lower than that in the blank group and the original feces group.
The principal component analysis (PCA) was objectively performed to reveal the diversity between the microbiota. As shown in Figure 5C, PC1 and PC2 contributed 50.18% and 18.81% of the variation, respectively. In general, cluster tree (Figure 5D) and PCA revealed that the intestinal microbiota of HPS group was significantly different from that of the blank group and the original feces group.
As shown in Figure 5E, the microbiota structure of each group was presented at the phylum level. Compared with the blank group, the abundance of Firmicutes in the HPS group markedly increased (p < 0.05), whereas Bacteroides and Proteobacteria displayed the opposite change (p < 0.05). The results indicated that HPS can promote the proliferation of Firmicutes. Certain Firmicutes could generate SCFAs by fermenting non-digestible carbohydrates in the intestine, thus playing a role in promoting the health of the host [40]. The abundance of Fusobacteria has not been detected in HPS, which was identical to the results of a study of polysaccharides from snow chrysanthemum [17]. This result indicated that the lower pH after 24 h fermentation might inhibit the growth of Fusobacteria, which was regarded as a pathogen, and increased due to the loss of nutrition [41].
Moreover, as shown in Figure 5F at the genus level, compared with the blank group, the abundances of Megasphaera were significantly increased, which was similar to the studies referenced in [26,42]. Megasphaera could normalize the production of high lactic acid, thus promoting the production of butyric acid [42]. Meanwhile, the abundances of Acidaminococcus and Mitsuokella were significantly increased in the HPS group. However, the abundances of Escherichia Shigella and Fusobacterium were significantly decreased, which was consistent with the results of a study of polysaccharides from okra [26]. The results showed that the structure of intestinal microbiota in HPS group changed, which promoted the production of short-chain fatty acids in the intestinal tract.
According to Figure 6, at the genus level, the treatment of HPS significantly influenced the abundance of key genera. In the HPS group, the genera of Megasphaera, Mitsuokella and Bifidobacterium were markedly richer than in the blank group (p < 0.05). Among them, the Megasphaera and Mitsuokella were the main intestinal microbiota for hydrolyzing and utilizing the HPS. Bifidobacterium had a positive effect on improving constipation and diarrhea [43]. Compared with the blank group, the abundance of Fusobacterium, Lachnoclostridium, Parabacteroides, and Sutterella decreased significantly (p < 0.05). Fusobacterium and Sutterella had negative effects on colitis and colon cancer [44,45]. It was suggested that the HPS could decrease the abundances of harmful intestinal microbiota and regulate the proportion of beneficial bacteria in intestinal tract, similar to the results reported recently in [16].

4. Conclusions

In this study, it was found that reducing the sugar content and molecular structure of HPS had nearly no significant change under the simulated in vitro digestion. Moreover, HPS could be decomposed into monosaccharides and immediately utilized by intestinal microbiota during in vitro fecal fermentation. Therefore, HPS could regulate the composition and abundances of intestinal microbiota; HPS significantly increased the abundance of Firmicutes at the phylum level, whereas Bacteroides and Proteobacteria decreased. Additionally, the abundances of Megasphaera, Acidaminococcus and Mitsuokella significantly increased at the genus level, whereas the abundances of Escherichia shigella and Fusobacterium significantly decreased. The above results showed that HPS could interact with microorganisms in the intestine to change the structure of the intestinal microbiota in the HPS group, thus promoting the production of SCFAs. All the results suggest that HPS can promote the proliferation of intestinal beneficial bacteria and promote intestinal health.

Author Contributions

Conceptualization, W.Z.; Data curation, K.Z. and X.H.; Formal analysis, X.H.; Funding acquisition, Z.G.; Investigation, K.Z. and R.P.; Methodology, W.Z.; Project administration, Z.G.; Software, K.Z., R.P., X.L. and X.C.; Supervision, Q.Z.; Validation, K.Z.; Visualization, K.Z.; Writing—original draft, K.Z.; Writing—review and editing, Q.Z. and W.Z. All authors have read and agreed to the published version of the manuscript.

Funding

This research received no external funding.

Institutional Review Board Statement

Not applicable.

Informed Consent Statement

Not applicable.

Data Availability Statement

Data of the measurement results are available from the authors.

Acknowledgments

This study was supported by the Key Research and Development plan in Hebei Province Project (20327120D), the Hebei Province Modern Agricultural Industry System Innovation Team Project (HBCT2018110205), the grant of food science and engineering discipline in Hebei province double first-class construction fund project (2016SPGCA18), and the Research Project on the Business Expenses for Basic Scientific Research of Hebei Provincial Universities (KY2021050).

Conflicts of Interest

The authors declare no conflict of interest.

References

  1. Guo, Q.; Du, J.; Jiang, Y.; Goff, H.D.; Cui, S.W. Pectic polysaccharides from hawthorn: Physicochemical and partial structural characterization. Food Hydrocoll. 2019, 90, 146–153. [Google Scholar] [CrossRef]
  2. Chai, W.M.; Chen, C.M.; Gao, Y.S.; Feng, H.L.; Ding, Y.M.; Shi, Y.; Zhou, H.T.; Chen, Q.X. Structural analysis of proanthocyanidins isolated from fruit stone of Chinese hawthorn with potent antityrosinase and antioxidant activity. J. Agric. Food Chem. 2014, 62, 123–129. [Google Scholar] [CrossRef] [PubMed]
  3. Wu, M.; Liu, L.; Xing, Y.; Yang, S.; Li, H.; Cao, Y. Roles and Mechanisms of Hawthorn and Its Extracts on Atherosclerosis: A Review. Front. Pharm. 2020, 11, 118. [Google Scholar] [CrossRef] [PubMed]
  4. Yao, M.; Ritchie, H.E.; Brown-Woodman, P.D. A reproductive screening test of hawthorn. J. Ethnopharmacol. 2008, 118, 127–132. [Google Scholar] [CrossRef] [PubMed]
  5. Ma, L.; Xu, G.B.; Tang, X.; Zhang, C.; Zhao, W.; Wang, J.; Chen, H. Anti-cancer potential of polysaccharide extracted from hawthorn (Crataegus.) on human colon cancer cell line HCT116 via cell cycle arrest and apoptosis. J. Funct. Foods 2020, 64, 103677. [Google Scholar] [CrossRef]
  6. Li, T.; Chen, X.; Huang, Z.; Xie, W.; Tong, C.; Bao, R.; Sun, X.; Li, W.; Li, S. Pectin oligosaccharide from hawthorn fruit ameliorates hepatic inflammation via NF-κB inactivation in high-fat diet fed mice. J. Funct. Foods 2019, 57, 345–350. [Google Scholar] [CrossRef]
  7. Yu, Z.; Song, G.; Liu, J.; Wang, J.; Zhang, P.; Chen, K. Beneficial effects of extracellular polysaccharide from Rhizopus nigricans on the intestinal immunity of colorectal cancer mice. Int. J. Biol. Macromol. 2018, 115, 718–726. [Google Scholar] [CrossRef]
  8. Li, X.; Guo, R.; Wu, X.; Liu, X.; Ai, L.; Sheng, Y.; Song, Z.; Wu, Y. Dynamic digestion of tamarind seed polysaccharide: Indigestibility in gastrointestinal simulations and gut microbiota changes in vitro. Carbohydr. Polym. 2020, 239, 116194. [Google Scholar] [CrossRef]
  9. Carnachan, S.M.; Bootten, T.J.; Mishra, S.; Monro, J.A.; Sims, I.M. Effects of simulated digestion in vitro on cell wall polysaccharides from kiwifruit (Actinidia spp.). Food Chem. 2012, 133, 132–139. [Google Scholar] [CrossRef]
  10. Thondre, P.S.; Monro, J.A.; Mishra, S.; Henry, C.J.K. High molecular weight barley β-glucan decreases particle breakdown in chapattis (Indian flat breads) during in vitro digestion. Food Res. Int. 2010, 43, 1476–1481. [Google Scholar] [CrossRef]
  11. Yun, L.; Li, D.; Yang, L.; Zhang, M. Hot water extraction and artificial simulated gastrointestinal digestion of wheat germ polysaccharide. Int. J. Biol. Macromol. 2019, 123, 174–181. [Google Scholar] [CrossRef] [PubMed]
  12. Wang, S.; Shao, G.; Yang, J.; Zhao, H.; Qu, D.; Zhang, D.; Zhu, D.; He, Y.; Liu, H. Contribution of soybean polysaccharides in digestion of oil-in-water emulsion-based delivery system in an in vitro gastric environment. Food Sci. Technol. Int. 2020, 26, 444–452. [Google Scholar] [CrossRef]
  13. Yu, M.; Xiao, B.; Hao, X.; Tan, J.; Gu, J.; Wang, G.; Wang, W.; Zhang, Y. Pumpkin polysaccharide preparation, simulated gastrointestinal digestion, and in vivo biodistribution. Int. J. Biol. Macromol. 2019, 141, 1293–1303. [Google Scholar] [CrossRef] [PubMed]
  14. Yuan, Q.; Lin, S.; Fu, Y.; Nie, X.R.; Liu, W.; Su, Y.; Han, Q.H.; Zhao, L.; Zhang, Q.; Lin, D.R.; et al. Effects of extraction methods on the physicochemical characteristics and biological activities of polysaccharides from okra (Abelmoschus esculentus). Int. J. Biol. Macromol. 2019, 127, 178–186. [Google Scholar] [CrossRef] [PubMed]
  15. Liu, Y.T.; Duan, X.Y.; Duan, S.Q.; Li, C.; Hu, B.; Liu, A.P.; Wu, Y.L.; Wu, H.J.; Chen, H.; Wu, W.J. Effects ofin vitrodigestion and fecal fermentation on the stability and metabolic behavior of polysaccharides from Craterellus cornucopioides. Food Funct. 2020, 11, 6899–6910. [Google Scholar] [CrossRef] [PubMed]
  16. Guan, N.; He, X.; Wang, S.; Liu, F.; Huang, Q.; Fu, X.; Chen, T.; Zhang, B. Cell Wall Integrity of Pulse Modulates the in Vitro Fecal Fermentation Rate and Microbiota Composition. J. Agric. Food Chem. 2020, 68, 1091–1100. [Google Scholar] [CrossRef]
  17. Wu, D.-T.; Yuan, Q.; Guo, H.; Fu, Y.; Li, F.; Wang, S.-P.; Gan, R.-Y. Dynamic changes of structural characteristics of snow chrysanthemum polysaccharides during in vitro digestion and fecal fermentation and related impacts on gut microbiota. Food Res. Int. 2021, 141, 109888. [Google Scholar] [CrossRef] [PubMed]
  18. Yuan, Q.; He, Y.; Xiang, P.Y.; Wang, S.P.; Cao, Z.W.; Gou, T.; Shen, M.M.; Zhao, L.; Qin, W.; Gan, R.Y.; et al. Effects of simulated saliva-gastrointestinal digestion on the physicochemical properties and bioactivities of okra polysaccharides. Carbohydr. Polym. 2020, 238, 116183. [Google Scholar] [CrossRef]
  19. Wu, D.T.; Fu, Y.; Guo, H.; Yuan, Q.; Nie, X.R.; Wang, S.P.; Gan, R.Y. In vitro simulated digestion and fecal fermentation of polysaccharides from loquat leaves: Dynamic changes in physicochemical properties and impacts on human gut microbiota. Int. J. Biol. Macromol. 2021, 168, 733–742. [Google Scholar] [CrossRef]
  20. Han, X.; Bai, B.; Zhou, Q.; Niu, J.; Yuan, J.; Zhang, H.; Jia, J.; Zhao, W.; Chen, H. Dietary supplementation with polysaccharides from Ziziphus Jujuba cv. Pozao intervenes in immune response via regulating peripheral immunity and intestinal barrier function in cyclophosphamide-induced mice. Food Funct. 2020, 11, 5992–6006. [Google Scholar] [CrossRef]
  21. Feng, X.; Bie, N.; Li, J.; Zhang, M.; Feng, Y.; Ding, T.; Zhao, Y.; Wang, C. Effect of in vitro simulated gastrointestinal digestion on the antioxidant activity, molecular weight, and microstructure of polysaccharides from Chinese yam. Int. J. Biol. Macromol. 2022, 207, 873–882. [Google Scholar] [CrossRef] [PubMed]
  22. Fu, X.; Cao, C.; Ren, B.; Zhang, B.; Huang, Q.; Li, C. Structural characterization and in vitro fermentation of a novel polysaccharide from Sargassum thunbergii and its impact on gut microbiota. Carbohydr. Polym. 2018, 183, 230–239. [Google Scholar] [CrossRef] [PubMed]
  23. Zeng, C.B.; Ye, G.Y.; Li, G.C.; Cao, H.; Wang, Z.H.; Ji, S.G. RID serve as a more appropriate measure than phenol sulfuric acid method for natural water-soluble polysaccharides quantification. Carbohydr. Polym. 2022, 278, 12. [Google Scholar] [CrossRef] [PubMed]
  24. Nie, X.-R.; Fu, Y.; Wu, D.-T.; Huang, T.-T.; Jiang, Q.; Zhao, L.; Zhang, Q.; Lin, D.-R.; Chen, H.; Qin, W. Ultrasonic-Assisted Extraction, Structural Characterization, Chain Conformation, and Biological Activities of a Pectic-Polysaccharide from Okra (Abelmoschus esculentus). Molecules 2020, 25, 1155. [Google Scholar] [CrossRef]
  25. Wu, D.T.; Liu, W.; Han, Q.H.; Du, G.; Li, H.Y.; Yuan, Q.; Fu, Y.; Zhao, L.; Zhang, Q.; Li, S.Q.; et al. Physicochemical characteristics and antioxidant activities of non-starch polysaccharides from different kiwifruits. Int. J. Biol. Macromol. 2019, 136, 891–900. [Google Scholar] [CrossRef]
  26. Wu, D.-T.; Nie, X.-R.; Gan, R.-Y.; Guo, H.; Fu, Y.; Yuan, Q.; Zhang, Q.; Qin, W. In vitro digestion and fecal fermentation behaviors of a pectic polysaccharide from okra (Abelmoschus esculentus) and its impacts on human gut microbiota. Food Hydrocoll. 2021, 114, 106577. [Google Scholar] [CrossRef]
  27. Li, W.; Wang, C.; Yuan, G.; Pan, Y.; Chen, H. Physicochemical characterisation and α-amylase inhibitory activity of tea polysaccharides under simulated salivary, gastric and intestinal conditions. Int. J. Food Sci. Tech. 2018, 53, 423–429. [Google Scholar] [CrossRef]
  28. Guo, D.; Lei, J.; He, C.; Peng, Z.; Liu, R.; Pan, X.; Meng, J.; Feng, C.; Xu, L.; Cheng, Y.; et al. In vitro digestion and fermentation by human fecal microbiota of polysaccharides from Clitocybe squamulose. Int. J. Biol. Macromol. 2022, 208, 343–355. [Google Scholar] [CrossRef]
  29. Liu, C.; Du, P.; Cheng, Y.; Guo, Y.; Hu, B.; Yao, W.; Zhu, X.; Qian, H. Study on fecal fermentation characteristics of aloe polysaccharides in vitro and their predictive modeling. Carbohydr. Polym. 2021, 256, 117571. [Google Scholar] [CrossRef]
  30. Wang, L.; Li, C.; Huang, Q.; Fu, X.; Liu, R.H. In vitro digestibility and prebiotic potential of a novel polysaccharide from Rosa roxburghii Tratt fruit. J. Funct. Foods 2019, 52, 408–417. [Google Scholar] [CrossRef]
  31. Zhou, X.; Zhang, Z.; Huang, F.; Yang, C.; Huang, Q. In Vitro Digestion and Fermentation by Human Fecal Microbiota of Polysaccharides from Flaxseed. Molecules 2020, 25, 4354. [Google Scholar] [CrossRef] [PubMed]
  32. Everard, A.; Lazarevic, V.; Derrien, M.; Girard, M.; Muccioli, G.M.; Neyrinck, A.M.; Possemiers, S.; Van Holle, A.; Francois, P.; de Vos, W.M.; et al. Responses of Gut Microbiota and Glucose and Lipid Metabolism to Prebiotics in Genetic Obese and Diet-Induced Leptin-Resistant Mice. Diabetes 2011, 60, 2775–2786. [Google Scholar] [CrossRef] [PubMed]
  33. Chen, L.; Liu, J.; Ge, X.; Xu, W.; Chen, Y.; Li, F.; Cheng, D.; Shao, R. Simulated digestion and fermentation in vitro by human gut microbiota of polysaccharides from Helicteres angustifolia L. Int. J. Biol. Macromol. 2019, 141, 1065–1071. [Google Scholar] [CrossRef] [PubMed]
  34. Zhang, X.; Aweya, J.J.; Huang, Z.-X.; Kang, Z.-Y.; Bai, Z.-H.; Li, K.-H.; He, X.-T.; Liu, Y.; Chen, X.-Q.; Cheong, K.-L. In vitro fermentation of Gracilaria lemaneiformis sulfated polysaccharides and its agaro-oligosaccharides by human fecal inocula and its impact on microbiota. Carbohydr. Polym. 2020, 234, 115894. [Google Scholar] [CrossRef] [PubMed]
  35. Xu, X.; Xu, P.; Ma, C.; Tang, J.; Zhang, X. Gut microbiota, host health, and polysaccharides. Biotechnol. Adv. 2013, 31, 318–337. [Google Scholar] [CrossRef]
  36. Kimura, I. Host Energy Regulation via SCFAs Receptors, as Dietary Nutrition Sensors, by Gut Microbiota. Yakugaku Zasshi 2014, 134, 1037–1042. [Google Scholar] [CrossRef]
  37. Ferchaud-Roucher, V.; Pouteau, E.; Piloquet, H.; Zair, Y.; Krempf, M. Colonic fermentation from lactulose inhibits lipolysis in overweight subjects. Am. J. Physiol.-Endocrinol. Metab. 2005, 289, E716–E720. [Google Scholar] [CrossRef]
  38. Rodriguez-Cabezas, M.E.; Galvez, J.; Lorente, M.D.; Concha, A.; Camuesco, D.; Azzouz, S.; Osuna, A.; Redondo, L.; Zarzuelo, A. Dietary fiber down-regulates colonic tumor necrosis factor alpha and nitric oxide production in trinitrobenzenesulfonic acid-induced colitic rats. J. Nutr. 2002, 132, 3263–3271. [Google Scholar] [CrossRef]
  39. Laparra, J.M.; Sanz, Y. Interactions of gut microbiota with functional food components and nutraceuticals. Pharmacol. Res. 2010, 61, 219–225. [Google Scholar] [CrossRef]
  40. Chen, G.; Xie, M.; Wan, P.; Chen, D.; Ye, H.; Chen, L.; Zeng, X.; Liu, Z. Digestion under saliva, simulated gastric and small intestinal conditions and fermentation in vitro by human intestinal microbiota of polysaccharides from Fuzhuan brick tea. Food Chem. 2018, 244, 331–339. [Google Scholar] [CrossRef]
  41. Xu, S.Y.; Chen, X.Q.; Liu, Y.; Cheong, K.L. Ultrasonic/microwave-assisted extraction, simulated digestion, and fermentation in vitro by human intestinal flora of polysaccharides from Porphyra haitanensis. Int. J. Biol. Macromol. 2020, 152, 748–756. [Google Scholar] [CrossRef] [PubMed]
  42. Ding, Y.; Yan, Y.; Peng, Y.; Chen, D.; Mi, J.; Lu, L.; Luo, Q.; Li, X.; Zeng, X.; Cao, Y. In vitro digestion under simulated saliva, gastric and small intestinal conditions and fermentation by human gut microbiota of polysaccharides from the fruits of Lycium barbarum. Int. J. Biol. Macromol. 2019, 125, 751–760. [Google Scholar] [CrossRef] [PubMed]
  43. Yasukawa, Z.; Inoue, R.; Ozeki, M.; Okubo, T.; Takagi, T.; Honda, A.; Naito, Y. Effect of Repeated Consumption of Partially Hydrolyzed Guar Gum on Fecal Characteristics and Gut Microbiota: A Randomized, Double-Blind, Placebo-Controlled, and Parallel-Group Clinical Trial. Nutrients 2019, 11, 2170. [Google Scholar] [CrossRef] [PubMed]
  44. Ma, S.; Qian, C.; Li, N.; Fang, Z.; Zhao, J.; Zhang, H.; Chen, W.; Liu, Z.; Lu, W. Protein diets with the role of immune and gut microbial regulation alleviate DSS-induced chronic ulcerative colitis. Food Sci. Nutr. 2021, 9, 1259–1270. [Google Scholar] [CrossRef] [PubMed]
  45. Leung, A.; Tsoi, H.; Yu, J. Fusobacterium and Escherichia: Models of colorectal cancer driven by microbiota and the utility of microbiota in colorectal cancer screening. Expert Rev. Gastroenterol. Hepatol. 2015, 9, 651–657. [Google Scholar] [CrossRef] [PubMed]
Figure 1. Peak time of six monosaccharides (A); HPLC chromatogram of monosaccharide mixture (B); changes in free monosaccharides released from HPS during digestion. HPS, hawthorn polysaccharides; HPS-S, salivary digestion of HPS for 0.05 h (C); HPS-G-1 h, HPS-G-2 h, HPS-G-4 h, and HPS-G-6 h (D), saliva–gastric digestion of HPS for 1, 2, 4, and 6 h, respectively; HPS-I-1 h, HPS-I-2 h, HPS-I-4 h, and HPS-I-6 h (E), saliva–gastrointestinal digestion of HPS for 1, 2, 4, and 6 h, respectively.
Processes 10 01922 g001
Figure 2. Changes in FT-IR spectra during digestion. HPS, hawthorn polysaccharides; HPS-S, salivary digestion of HPS for 0.05 h (A); HPS-G-1 h, HPS-G-2 h, HPS-G-4 h, and HPS-G-6 h (B), saliva–gastric digestion of HPS for 1, 2, 4, and 6 h, respectively; HPS-I-1 h, HPS-I-2 h, HPS-I-4 h and HPS-I-6 h (C), saliva–gastrointestinal digestion of HPS for 1, 2, 4, and 6 h, respectively.
Processes 10 01922 g002
Figure 3. Comparison of scanning electron microscope (SEM) images of different digested samples ((A): undigested, 200×; (B): undigested, 500×; (C): salivary digestion of HPS for 0.05 h, 200×; (D): salivary digestion of HPS for 0.05 h, 500×; (E): saliva–gastric digestion of HPS for 6 h, 200×; (F): saliva–gastric digestion of HPS for 6 h, 500×; (G): saliva–gastrointestinal digestion of HPS for 6 h, 200×; (H): saliva–gastrointestinal digestion of HPS for 6 h, 500×).
Processes 10 01922 g003
Figure 4. Changes in content of SCFAs during the fecal fermentation of HPS, acetic acid (A), propionic acid (B), butyric acid (C), and total SCFAs (D) (the sum of acetic acid, propionic acid, and butyric acid). The values are expressed as the mean ± SEM (n = 3). Different letters indicated statistical differences (p < 0.05).
Processes 10 01922 g004
Figure 5. Rarefaction curves (A), Shannon curves (B), and principal component analysis (C) and unweighted UniFrac cluster tree (D) of gut microbiota of Blank, Feces, and HPS samples during in vitro digestion. Plots showed the changes in human gut microbiota in phylum level (E) and genus level (F).
Processes 10 01922 g005
Figure 6. Heatmap of analysis at the genus level for different groups (A); the species differences were compared among the groups at the genus level (B).
Processes 10 01922 g006
Table 1. Changes in reducing sugar contents in HPS during in vitro digestion.
ProcessesTime (h)CR (mg/mL)
Origin-0.082 ± 0.0041 a
Saliva digestion0.050.083 ± 0.0023 a
Saliva–gastric digestion10.100 ± 0.0055 b
20.102 ± 0.0082 b
40.103 ± 0.0010 b
60.104 ± 0.0077 c
Saliva–gastrointestinal digestion10.105 ± 0.0061 c
20.106 ± 0.0056 c
40.107 ± 0.0042 c
60.107 ± 0.0064 c
The values are expressed as the mean ± SEM (n = 3). Different letters indicated statistical differences (p < 0.05).
Table 2. Changes in pH during the fecal fermentation of HPS.
GroupsTime (h)pH
Blank08.29 ± 0.046 a
67.53 ± 0.044 b
127.37 ± 0.044 c
247.19 ± 0.026 c
HPS07.37 ± 0.026 d
66.54 ± 0.035 e
126.17 ± 0.026 f
245.37 ± 0.026 g
The values are expressed as the mean ± SEM (n = 3). Different letters indicated statistical differences (p < 0.05).
Table 3. Changes in CR and residual carbohydrate HPS during in vitro fermentation.
ContentTime (h)HPS
CR (mg/mL)00.388 ± 0.0060 a
60.437 ± 0.0040 b
120.301 ± 0.0079 c
240.300 ± 0.0080 c
Residual carbohydrate (%)0100.00 ± 0.0600 a
697.09 ± 0.1967 b
1296.51 ± 0.1808 c
2494.77 ± 0.1374 d
The values are expressed as the mean ± SEM (n = 3). Different letters indicated statistical differences (p < 0.05).
Table 4. Effects of HPS on Alpha diversity of human gut microbiota.
Groups.Chao1ACEShannonSimpson
Blank230.27 ± 12.57 a211.52 ± 10.99 a2.57 ± 0.40 a0.179 ± 0.096 a
Original feces253.74 ± 12.05 a249.62 ± 10.50 b3.62 ± 0.07 b0.048 ± 0.006 b
HPS129.36 ± 14.99 b129.64 ± 13.11 c2.22 ± 0.06 a0.216 ± 0.115 a
The values are expressed as the mean ± SEM (n = 3). Different letters indicated statistical differences (p < 0.05).
Publisher’s Note: MDPI stays neutral with regard to jurisdictional claims in published maps and institutional affiliations.

