1. Introduction
The navigation safety problem of ships is always an essential issue in the maritime field. For all maneuvering ships, accidents of collision often happen, especially in busy waterways with a high density of ship traffic, such as ports, inland waterways, and canals [
1,
2]. Thus, for investigating this problem it is necessary to consider Automatic Identification System (AIS) data. AIS data contains various types of information, including a ship’s position, speed, course, and type, among others [
3,
4]. The original communication of AIS data between different ships or between ships and coastal stations is limited to equipment with Very High Frequency (VHF) radio waves. The problem can be solved by transmitting information with satellite and VHF transceivers. The applications and research based on AIS data has increased rapidly in the last two decades. Not only so that AIS data can obtain accurate ship information to avoid collisions, but also so the data can achieve surveillance of a ship’s performance. Some researchers have investigated the performance of ships and developed a realistic model for waterways to improve safety and efficiency [
5,
6]. Moreover, AIS data can also be considered for voyage management of ships, which is helpful for high traffic ports, canals, or fishing grounds [
7]. It is known that AIS data has many benefits for solving safety and cost-efficiency problems.
On the unpredictable seas, in practice a ship’s dynamic is usually a complex and nonlinear system [
8]. Because the effects of seas waves, winds, and currents exist simultaneously, more accuracy and safe ship steering become important issues. AIS data can also perform a crucial role for ship dynamic modeling and analysis in ship steering problems. It is known that nonlinear systems are more complicated to analyze directly than linear systems with some non-causality properties. For the design method of the controller or observer, it is also not cost-efficient. In fuzzy control theory, the Takagi-Sugeno (T-S) fuzzy model is proposed as a powerful tool for representing nonlinear systems [
9,
10,
11]. The main feature is that a class of nonlinear systems is expressed as many linear T-S fuzzy subsystems with If–Then rules. The structure of each linear subsystem can be constructed after selecting the operating point and membership function for practical nonlinear systems. Then, these linear subsystems can all be blended together via the membership function to approximate the original nonlinear systems. Via the T-S Fuzzy model, many fruitful linear control theories and analysis methods can be applied to nonlinear systems. In the maneuvering or steering of a ship, the accuracy and safety of the ship’s trajectory mainly depend on the experience of experts. The concept of the fuzzy theory is to convert the thinking or understanding of people into mathematical expressions. Thus, these experiences can also be captured and represented in the membership function of the T-S fuzzy model. Based on the T-S fuzzy model, many researchers have already put their efforts into controlling and analyzing nonlinear ship steering systems [
12,
13]. Moreover, multiple performance problems have also been discussed for the fuzzy controller design of continuous and discrete-time ship dynamic systems [
14,
15]. Extending the results of the type-1 T-S fuzzy control method, actuator saturated type-2 fuzzy control theory has been proposed [
16]. From [
12,
13,
14,
15,
16], it is obvious that the T-S fuzzy can describe the nonlinear ship dynamic system well, and the corresponding fuzzy controller provides a better controlled performance for the ship.
The design problem for estimating ship motion has become an important issue [
17,
18,
19]. For the information of AIS data, the received time between two AIS data sets has an interval. Moreover, some AIS data may be wild points, which will seriously impair judgment and decision-making of ships. In emergency situations, it will often cause accidents because of the decision errors. Thus, realistically estimating a ship’s motion or position is necessary to be developed. Nowadays, AIS data has also been applied to unmanned vessels [
20,
21]. With the growing number of ships and the development of unmanned aerial vehicle ships, the accuracy and safety of the steering trajectory have become more critical problems. Observer equipment is a helpful tool for estimating the states and parameters in dynamic systems [
22]. Via the design method of the observer, the state of the dynamic system can be estimated when the error dynamic converges to zero. The observer design method has been combined with various control theories and successfully applied to practical systems, such as gasoline engines and underwater robots [
23,
24]. In [
25], the observer has been designed to estimate the surge and sway velocity for under-actuated ships. Using AIS data, the nonlinear observer has also been applied in designing the exogenous Kalman filter for the visualization and prediction of ship dynamics [
26]. Via the T-S fuzzy model, some fruitful fuzzy observer design methods have been developed to estimate and control nonlinear systems such as singular systems [
27]. However, the T-S fuzzy model-based observer design method has not been applied to estimating ship dynamics with AIS data.
This paper provides an estimating method for ship trajectories based on AIS data via the T-S fuzzy model. Referring to [
26], nonlinear ship dynamic systems can be constructed, and the AIS data measurement method is also applied to represent ship dynamics. Based on nonlinear ship systems, a nonlinear observer is proposed to estimate ship dynamics. However, a nonlinear observer is more challenging to design since the dynamics of the ship become more complex. Thus, the T-S fuzzy model is applied to represent the nonlinear ship dynamic system. Via selecting the appropriate operating point and range, each subsystem of the T-S fuzzy model can be constructed. Considering the value of applied AIS data and the T-S fuzzy modeling method, a nine rules T-S fuzzy model is obtained. Based on the T-S fuzzy model, the observer can also be designed for each linear subsystem with the same premise part of the model. The advantages of this T-S fuzzy observer can be summarized in two aspects. Firstly, the more complex nonlinear observer design method is avoided. Since nonlinear systems can be approximated by the T-S fuzzy model, the various linear observer design methods developed by many professional researchers can be applied to efficiently observe nonlinear system dynamics. Moreover, the overall T-S fuzzy observer is obtained by “blending” all the observer subsystems with membership functions. Finally, the estimating results of AIS data are obtained for each state by the nonlinear observer and T-S fuzzy observer separately.
Up to the present time, the problem of ship safety has always been a crucial issue, especially in crowded areas such as ports canals with heavy traffic. How to reduce or avoid collisions between ships is the most important thing. Nowadays, AIS data is widely applied in the marine field. Because AIS data contains a lot of ship information, it plays an important role in the problem of safety. It is known that well-known optimization methods such as genetic algorithms or neural network methods can be used to estimate the trajectory for ships. However, applying genetic algorithms or neural network methods requires a great amount of data for training. In addition, large amounts of training data will cause the estimation time to lengthen. Therefore, the purpose of this paper is to develop a simple and effective observer design method based on the T-S fuzzy model to estimate a typical ship’s trajectory via AIS data. It has also been shown that the proposed T-S fuzzy observer can be successfully extended to estimate the trajectories of other ships. In the future, the proposed design method could be combined with genetic algorithms or neural network methods to produce a hybrid optimization approach to efficiently estimate a ship’s AIS data.
The contributions of this paper can be summarized as follows. A T-S fuzzy observer design method is proposed based on AIS data in this paper. The ship trajectories and dynamics of most ships can be estimated by the proposed design method. Using the T-S fuzzy modelling method, the nonlinear ship dynamic system can be represented in many linear fuzzy subsystems. It also means that the nonlinear observer design method can be converted into a linear design problem. Thus, the complex mathematical computation of nonlinear systems can be avoided. Designing the linear observer is more cost-effective than the nonlinear observer in practical applications. Based on the T-S fuzzy model, a T-S fuzzy observer design method is developed in this paper to estimate ship dynamics which are nonlinear. A nonlinear observer design method has been proposed in [
26] to estimate AIS data. However, selecting the observer gains for the observer cannot be known. In addition, the observer developed in [
26] is designed in a nonlinear form in which the observer gains must be solved based on the designer’s experience. For this reason, a T-S observer gain design algorithm is proposed in this paper to solve this problem. Combining the proposed algorithm into the observer design method, the T-S fuzzy observer can be designed more effectively and systematically. Moreover, with the T-S fuzzy observer, the route of each ship is anticipated such that collisions can be avoided effectively.
The organization of this paper is presented as follows. In
Section 2, the application of AIS data is introduced, and a nonlinear observer is constructed by referring to [
26]. In
Section 3, the modeling process of the nine rules T-S fuzzy model is proposed, and the T-S fuzzy observer is also designed. In
Section 4, the simulation results of the nonlinear observer and T-S fuzzy observer are presented. In
Section 5, some conclusions and future works are given.
2. Applications of AIS Data and the Nonlinear Observer
This section introduces the nonlinear ship dynamic system and the application of AIS data. Then, the nonlinear observer are designed to estimate ship dynamics with AIS data. Referring to [
26], the nonlinear observer design method and the application of AIS data can be introduced as follows. Firstly, the following nonlinear dynamic equations can be presented for the positioning of ships.
where
denotes a north position of the ship,
denotes an east position,
denotes forward speed,
denotes course,
denotes linear acceleration, and
denotes course rate. In the nonlinear ship dynamic systems, the inputs
and
can be designed as follows.
where
and
are given time constants, and
is the saturation function. The saturation function is applied to avoid wild points of AIS data. In the dynamic system of input (5) and (6),
and
are measured from AIS data as follows.
where
,
,
,
denote the last three measurement times,
denote the last three measurements of forward speed of AIS data, and
denote the last three measurements of course rate of AIS data.
It is noted that the saturation problem between the actuator and system control input is an important issue for most practical engineering systems. Nowadays, the saturation problem is also considered for system states in popular network systems, and a similar saturation technique is applied [
28]. Based on this method, the nonlinear dynamics of a ship can be described as (1)–(8). The AIS measurement data need to be converted to apply the nonlinear ship dynamic system (1)–(8) in practice. In AIS measurement data, the positions of the ship are selected in longitude and latitude. Referring to [
26], the World Geodetic System (WGS-48) is applied to map longitude and latitude measurements into Cartesian coordinates. For the sake of paper brevity the process of the mapping method, which is detailed in [
26], is not presented. The nonlinear observer is designed as follows based on the nonlinear ship dynamic system (1)–(8).
where
,
,
,
is the observed state for the state of the system (1)–(4), and
,
,
,
are observer gains.
In the observer design method for (9) and (10), the observer gains
,
,
,
must be selected with positive values. The following dynamic error system can be obtained by subtracting (9)–(12) from (1)–(4).
where
and
.
To estimate system states accurately, the dynamics of error system are required to converge to zero. That is, a stable performance needs to be achieved for dynamic error system (13). In control theory, the stability of (13) can be guaranteed since all the eigenvalues of the matrix have a positive real part. That is, the values of , , , are all required to be set as positive.
However, the nonlinear observer is challenging to design directly when the dynamic ship system (1)–(8) is complex. The T-S fuzzy model is known as a powerful tool to represent a nonlinear target system by many linear subsystems. Based on the T-S fuzzy model, many linear observer design methods can also be applied to estimate the state dynamics of nonlinear systems. Instead of the nonlinear observer, an efficient T-S fuzzy modeling method is applied to construct a nonlinear ship dynamic system into the T-S fuzzy model with nine fuzzy rules. Then, the T-S fuzzy observer can also be designed based on the constructed model. Moreover, an observer gain design algorithm is also proposed to adjust the observer gain. Then, the more suitable T-S fuzzy observer can be obtained to solve the estimating problem of AIS data. In the next section, a T-S fuzzy observer design method is proposed with an algorithm.
3. Takagi-Sugeno Fuzzy Modeling and Observer Design for AIS Data-Based Ship Trajectories
In this section, the nonlinear ship dynamic system (1)–(9) is represented in a nine rules T-S fuzzy model by modeling the proposed method [
29]. Moreover, the T-S fuzzy observer is also designed based on the model. Firstly, the operating point and range of the membership function need to be selected. Referring to the AIS data applied in the simulation of this paper, a range of about
to
is selected for the state
for system (1)–(9). Moreover, the operating points are considered as follows.
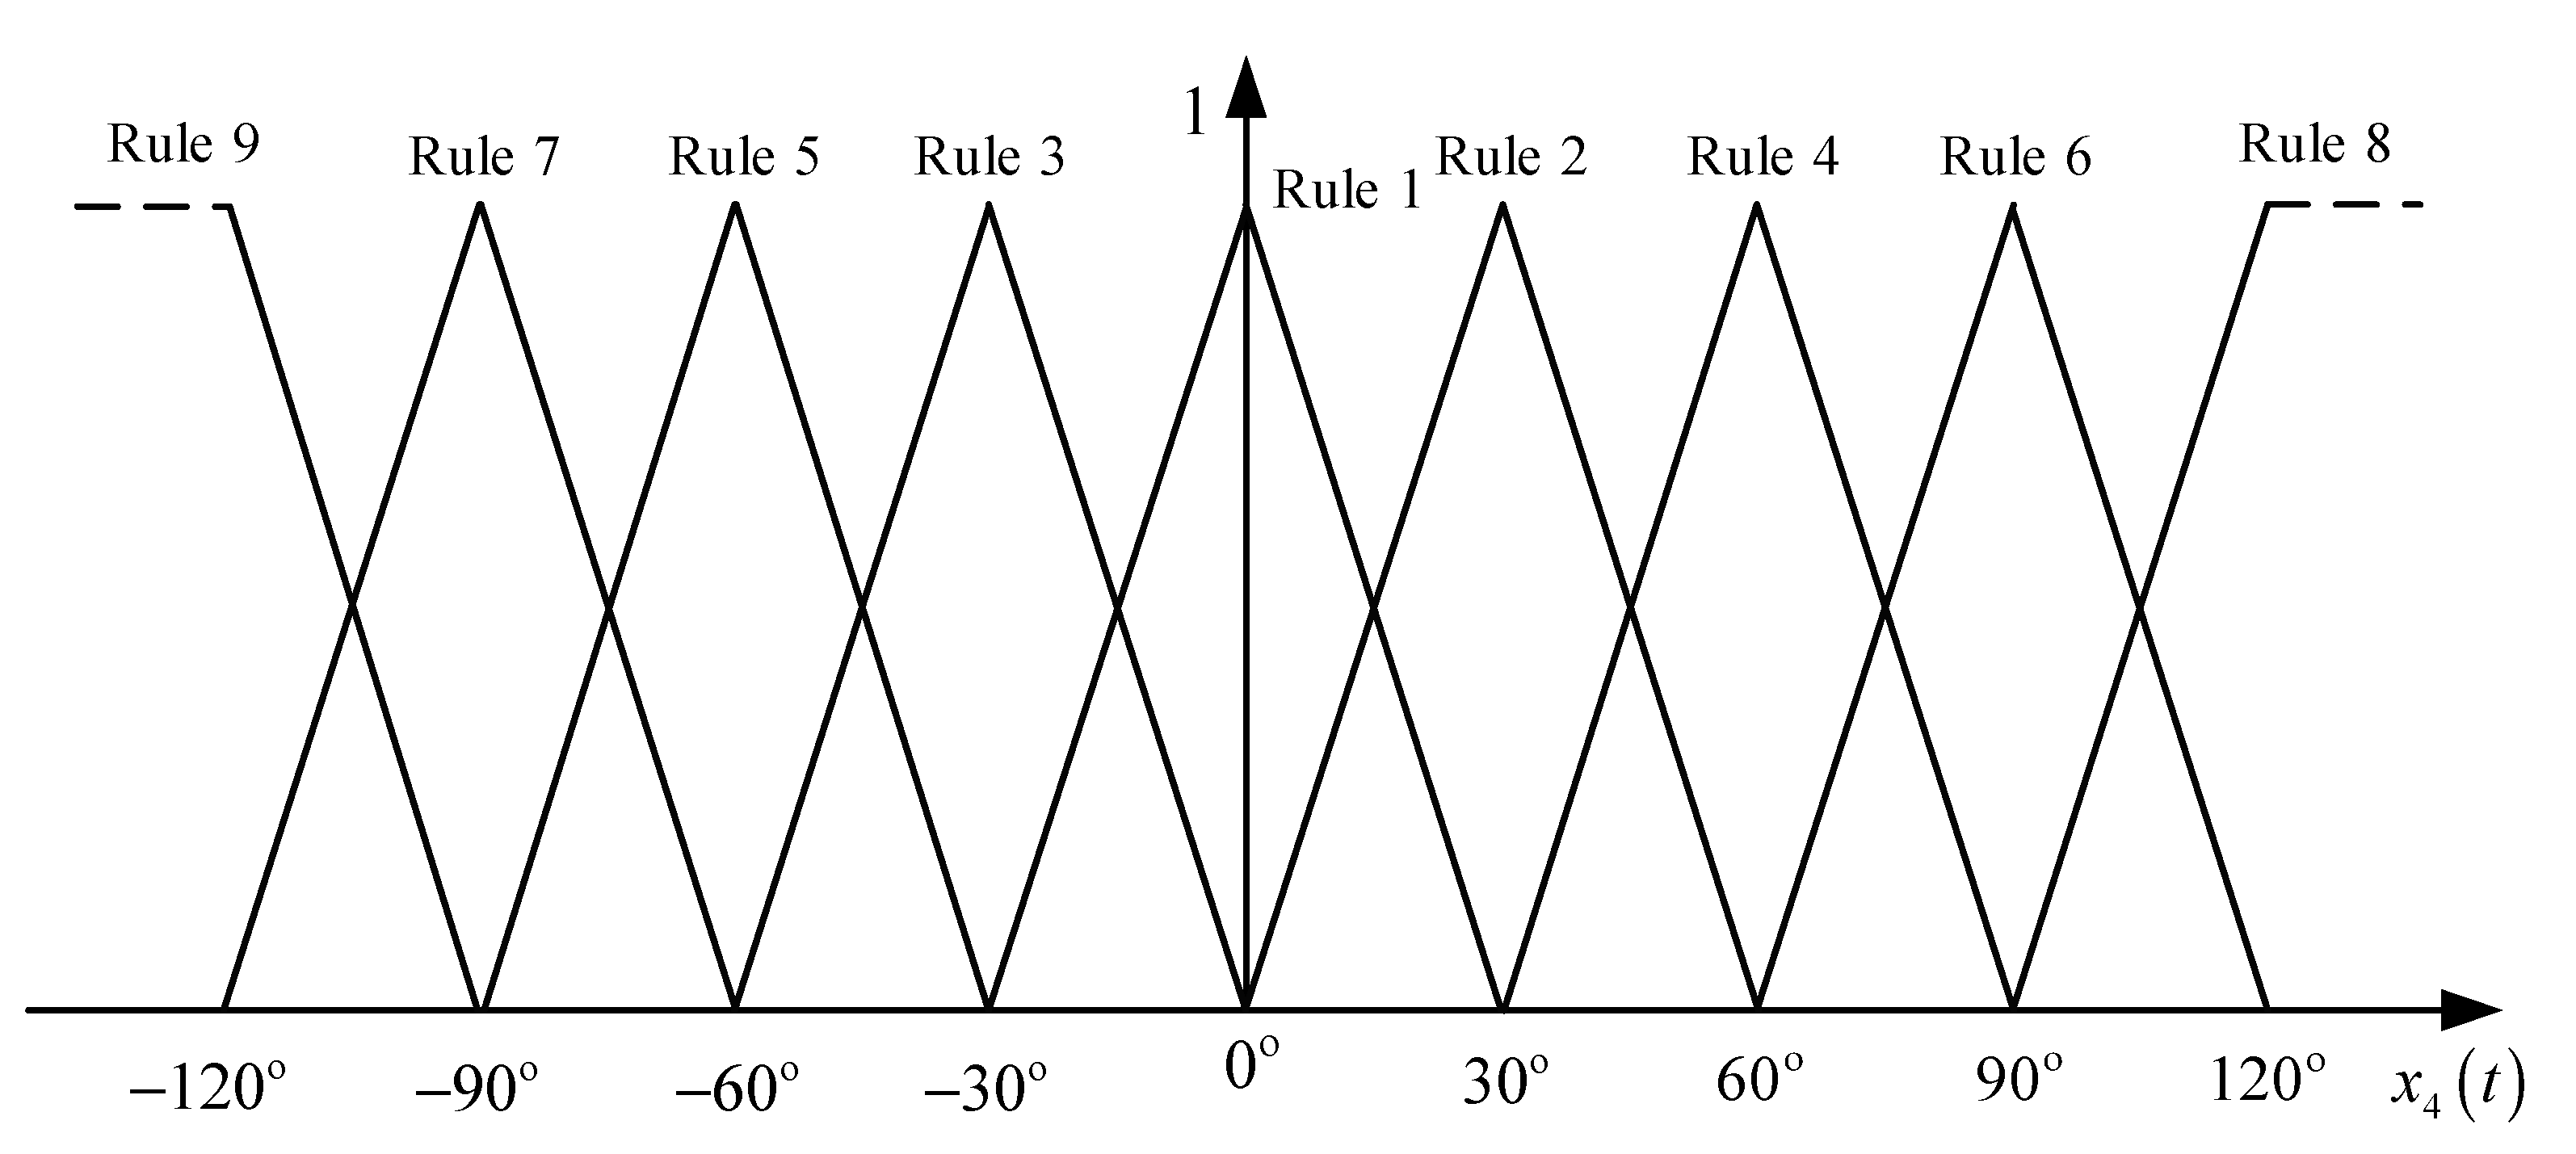
Then, the membership function can be presented in
Figure 1 from the operating points (14).
In
Figure 1, it can be seen that for the operating point
, the fuzzy subsystem of Rule 1 is constructed. Similarly, the fuzzy subsystem of Rule 2 can be constructed by selecting
. In fuzzy control theory, there are many types of membership functions such as the triangular type, Gaussian type, etc. To demonstrate the efficiency of the T-S fuzzy model, the more straightforward triangular type is considered to establish the membership functions.
Based on the membership function in
Figure 1, the following T-S fuzzy model in nine rules is presented.
where
to
and
to
are the system matrices. Referring to the T-S fuzzy modeling method in [
29], the system matrices can be obtained with operating points (14) as follows. Firstly, the nonlinear ship dynamic system (1)–(4) is considered as
Then, the state matrices
to
can be obtained as follows.
where
is the number of fuzzy rules and
. Via the computing method of (29) with operating points
to
in (14), the following system matrices can be obtained based on the form of (28).
Similarly, the input matrices can be obtained as follows. Thus, the input matrices for each rule can be obtained as
where
Moreover, the items
to
are transferred into
to
for the constructing process (32) of matrices
. The difference of operating points for a nonlinear system (24)–(27) is related to the system state
, which is the component of nonlinear items. That is, the different operating points are not required for the control input. And it will also increase the complexity in applications. It is same for
to
in the constructing process of state matrices, the operating points of the control input are selected for each rule as
. Then, the following input matrices can be obtained via the calculation of (32).
Then, the following overall T-S fuzzy model can be obtained by blending (15)–(23) with the membership functions presented in
Figure 1.
where
,
,
and
is the grade of the membership of
. Note that the
y-axis of the membership functions in
Figure 1 are called membership grades. That is,
is the value of the
y-axis, which is possibly from 0 to 1 and related to the state
at each time point.
Based on the T-S fuzzy model (15)–(23), the T-S fuzzy observer can be designed for each subsystem as follows.
Note that each observer is constructed with the same premise part of the T-S fuzzy model (15)–(23) such that the observer rule is guaranteed to design for each related model rule. For observer rule (35),
represents the fuzzy sets named as “Rule i” in
Figure 1. For example,
is applied as a triangular set “Rule 1” in
Figure 1. Moreover, the fuzzy set “Rule 1” can also be described as the system’s operating point about
. Thus, the expression method of the T-S fuzzy model (35) is the same as the meaning of (15)–(23). Similar to the process from (15)–(23) to (34), the following overall observer is obtained by blending.
where
denotes the observer gains of the T-S fuzzy model. For the same reason of the nonlinear observer mentioned above, the values of
,
,
,
are required to be positive.
The above nine rules T-S fuzzy model is constructed for the nonlinear ship dynamic system (1)–(4) by an efficient T-S fuzzy modeling method. Via the T-S fuzzy model representation, many valuable linear controller or observer design methods can be applied to nonlinear systems. Considering the nonlinear ship dynamic system (1)–(4), the T-S fuzzy observer is designed as (36) for estimating the state of dynamic ship motion based on AIS data. This paper proposes an algorithm to design observer gain
for the T-S fuzzy observer (36). With this algorithm, the applications of the proposed T-S fuzzy observer can be improved efficiently. To begin with the algorithm, the AIS data must be set for the T-S fuzzy observer. Thus, the vector
is established with the north-position data, and
,
and
are established with the east-position AIS data, forward speed and course, respectively. It has to be noted that these vectors are a series of discrete data which can represent the above ship information corresponding to the data of each received time. To implement the T-S fuzzy observer (36), all these discrete-time data are necessary to be converted into a continuous-time function. Considering the accuracy in practical applications, an efficient method called first-order hold [
30] is utilized for the vectors
,
,
,
, such that the sampling time is set as the received time of AIS data. Then, the state function
,
,
,
can be defined, and the state vector
can be obtained to be the objective state vector for the T-S fuzzy observer (36). Based on the above statements, the algorithm of the design of observer gain
can be proposed for the T-S fuzzy observer (36) as follows.
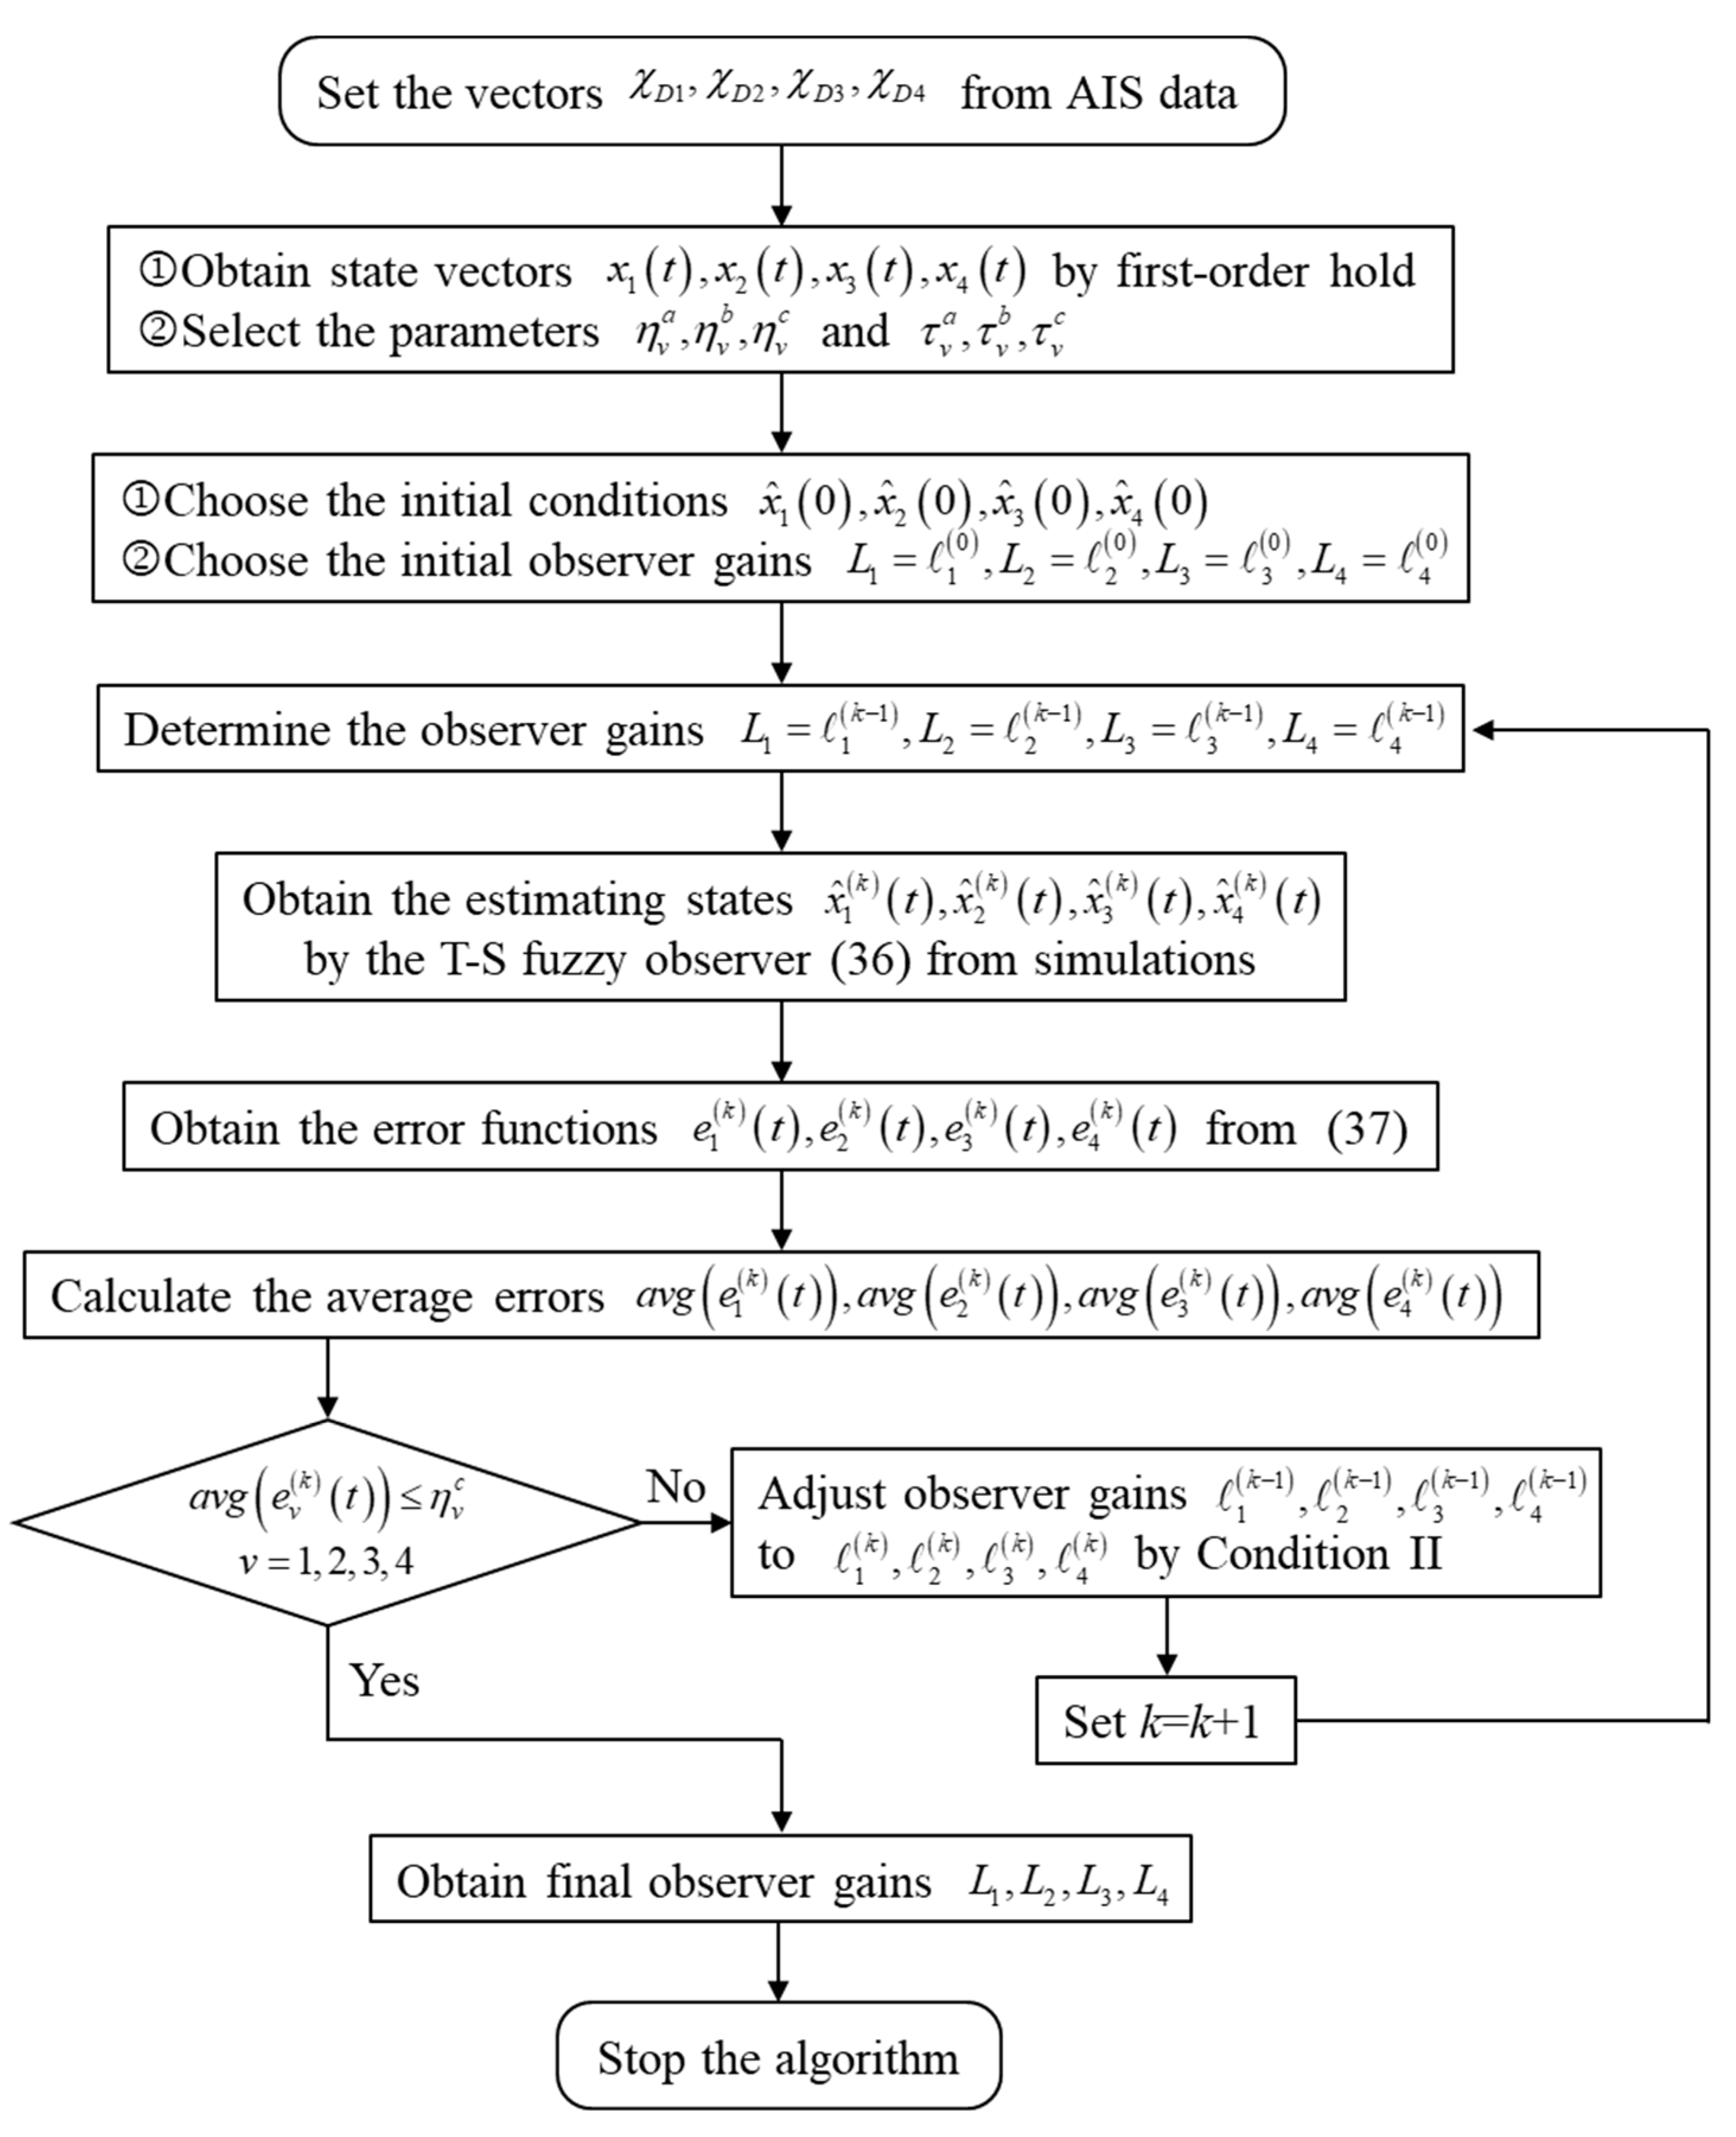
<T-S Fuzzy Observer Gain Design Algorithm>
Step 1.
Set the vector
,
,
and
by the objective AIS data, and obtain the state function
,
,
,
by the first-order hold method [
30]. Define index
as the
-th simulation, and select the constant values
,
,
with the relationship
, for the judgment range of the estimation error. Choose the constant values
,
,
, which have the relationship
, to determine the multiples of growth of the observer gain.
Step 2.
Let and choose the initial values for observer states , , , for the simulation. Select the observer gains for the first simulation as , , and .
Step 3.
Set , , and for the observer gain matrix.
Step 4.
Substitute , , , obtained in Step 1 and the observer gain obtained in Step 3 into the T-S fuzzy observer (36) for the kth estimating simulation. After the simulation, , , , are obtained to track the AIS data function , , , .
Step 5.
Subtracting the AIS data function
,
,
,
from the estimated function
,
,
,
the error function of each state can be obtained as follows.
Step 6.
Compute the average value of each error function , , , as , , , , where denotes the mean of the continuous function , i.e., , denotes the terminal time and denotes the initial time of the simulation for function .
Step 7.
Based on the average of error functions obtained in Step 6, the following condition is applied to determine whether the observer gain needs to be further adjusted or not.
Condition I:
where
denotes the index number of states.
Step 8.
The following process is given to adjust the observer gain .
Step 9.
Set and return to Step 3.
Step 10.
The algorithm is finished, and the observer gain matrix is constructed by , , and .
To make the process of observer design algorithm clearer, a flow chart of the algorithm is presented in
Figure 2.
The advantage of the proposed T-S observer gain design algorithm is that the considered range for the average error, , and can be selected by the designer flexibly. Moreover, the values by which the subsequent observer gain needs to be multiplied, , and can also be designed by the user. Because of these advantages, the proposed algorithm can be applied to track various AIS data by appropriately selecting these parameters. Then, the designers can adjust the observer gain systematically and obtain better tracking responses according to the proposed algorithm. Some simulations and discussions are presented in the next section to verify the proposed T-S fuzzy observer design method and the observer gain design algorithm.
4. Simulation Results
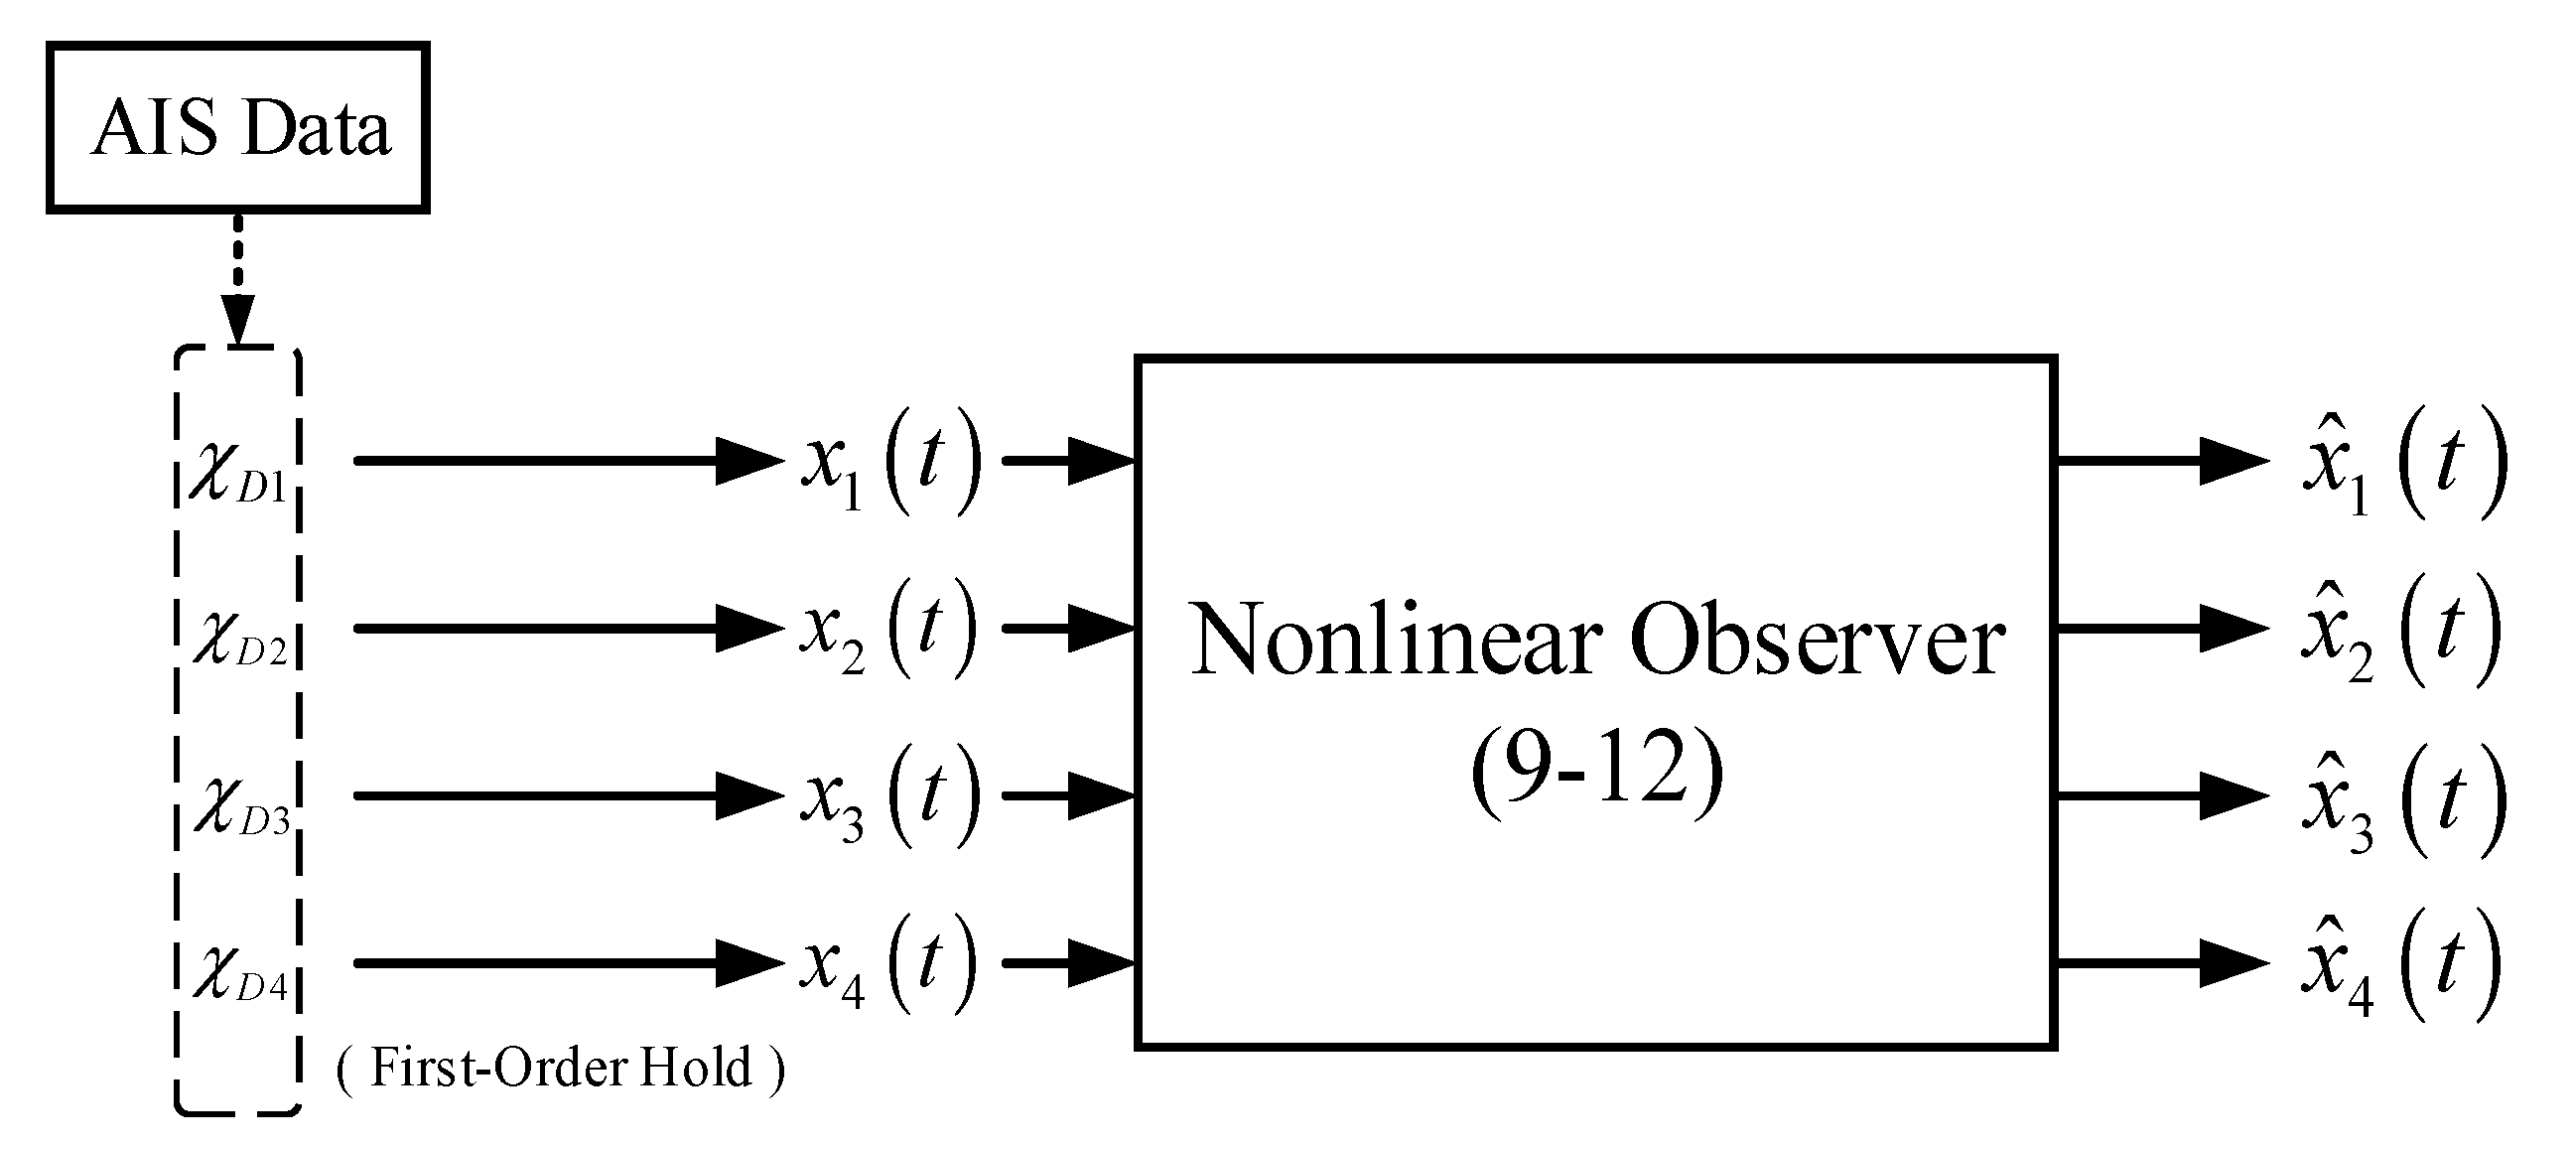
The T-S fuzzy observer design method was presented in the previous section to estimate ship motion. Based on a group of AIS data, the simulation results are presented in this section to verify the efficiency of the proposed T-S fuzzy observer design method. The observer gain can be appropriately adjusted to estimate the AIS data by applying the proposed algorithm. Before the simulation begins, the estimating processes of the nonlinear observer and the T-S fuzzy observer are introduced as follows, respectively. Considering the nonlinear observer (9)–(12) developed in [
26], the process of the design method is given in
Figure 3.
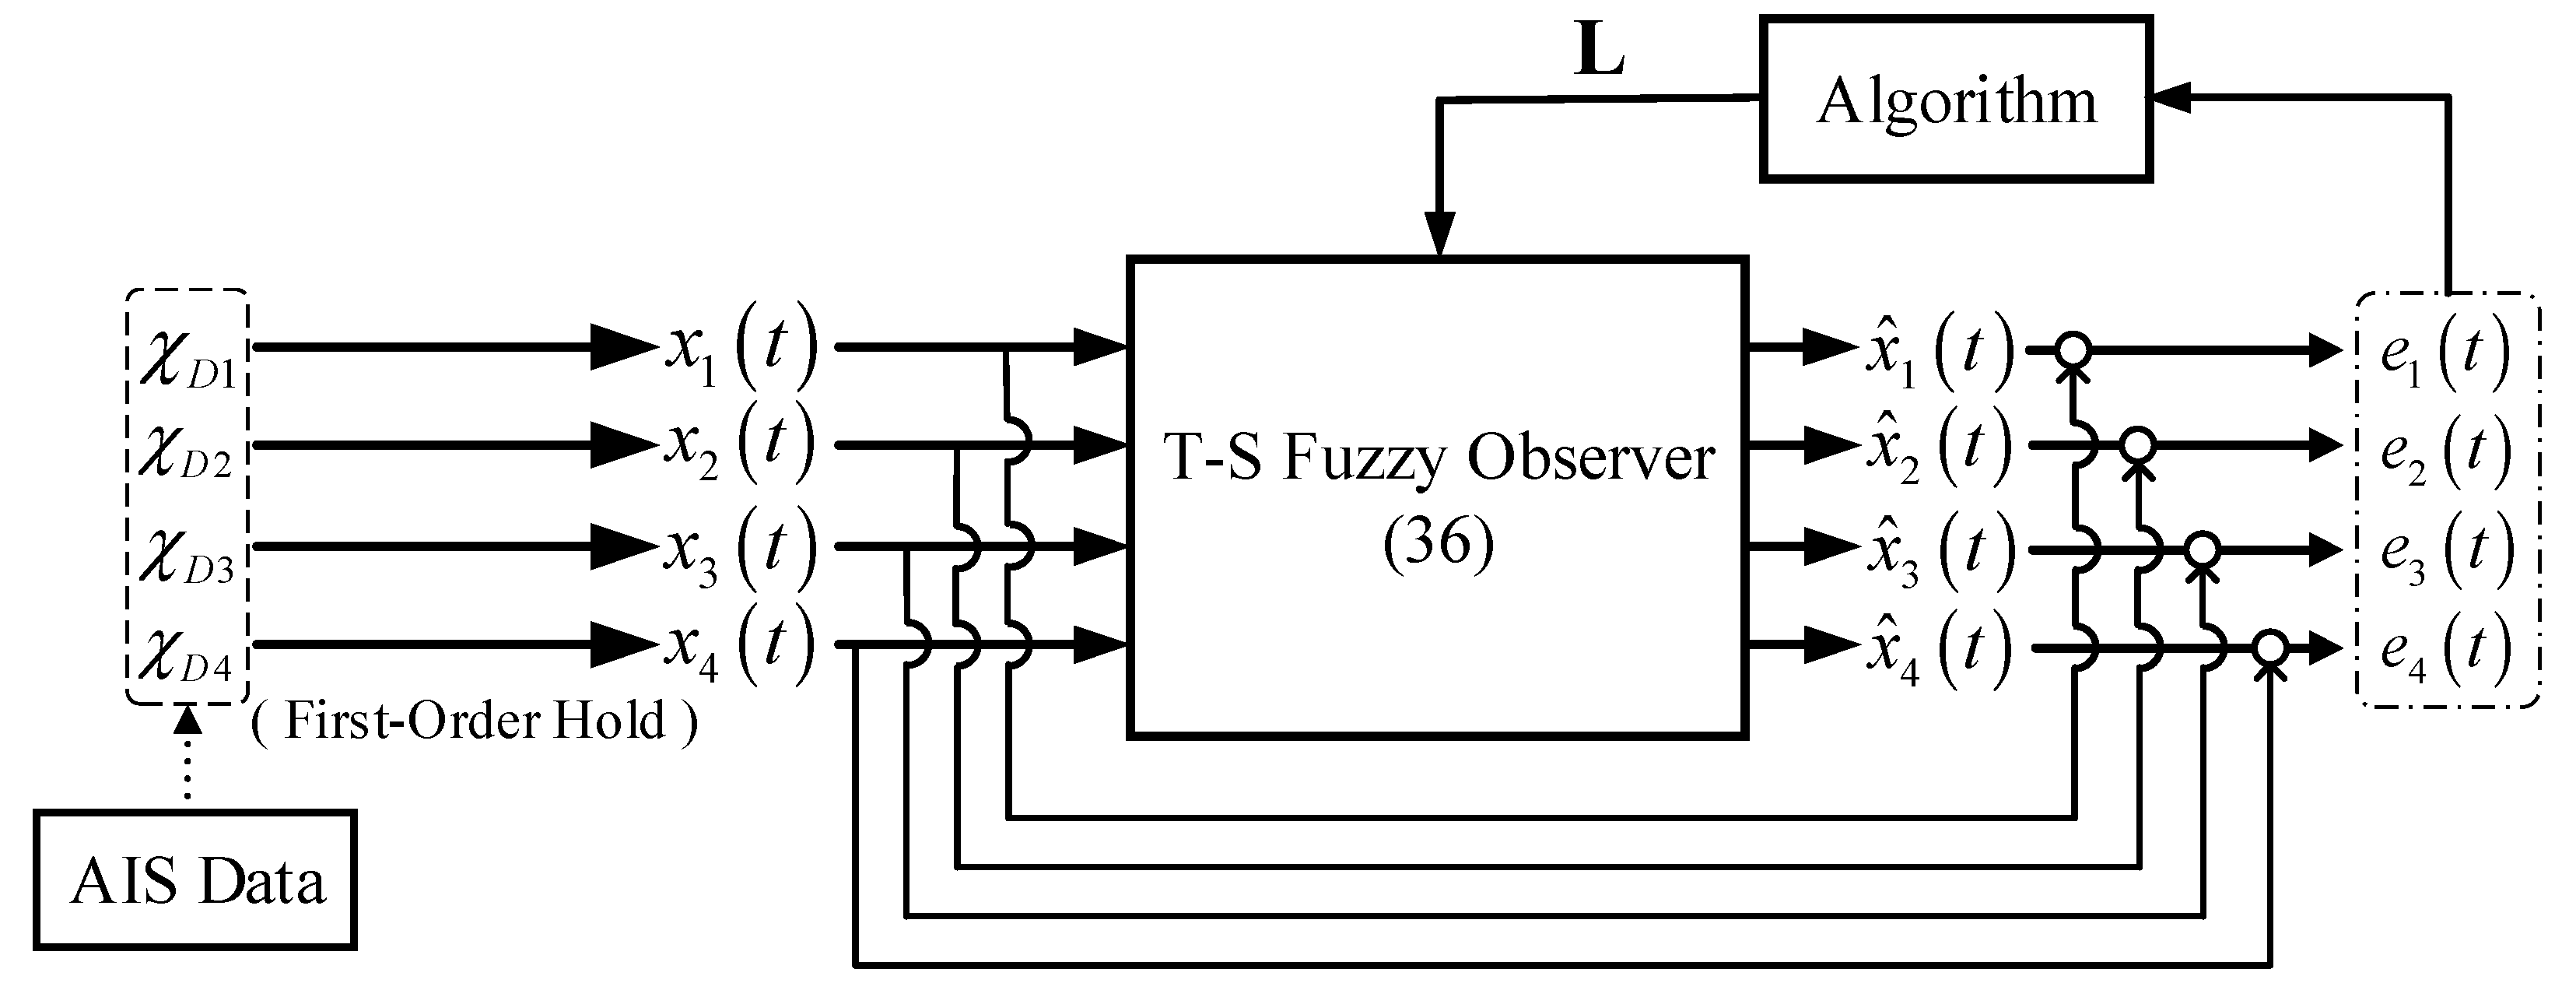
An algorithm is developed for the proposed fuzzy observer design method to systematically adjust the observer gain. Therefore, the estimating framework with the proposed T-S fuzzy observer design method is given in
Figure 4.
In
Figure 4, the symbol “o” denotes the subtraction of two signals. Via the framework, the observer gain
can be updated for the T-S fuzzy observer (36) based on the observed error until the objective is achieved. For both the nonlinear observer design method [
26] and the proposed T-S fuzzy observer design method, the AIS data is realized by
,
,
, and
by using the first-order hold method [
30].
To begin with the simulation, the AIS data is selected similarly to Figure 9 in [
26], which is presented in
Table 1.
Table 1.
Objective AIS data.
Table 1.
Objective AIS data.
| System States | AIS Data |
|---|
Received
Time (T) | 0 | 7 | 19 | 25 | 35 | 68 | 70 | 83 | 100 |
|---|
| 3.0217 | 2.9826 | 2.9261 | 2.8609 | 2.8348 | 2.8087 | 2.7957 | 2.7565 | 2.7130 |
| −16.93 | −16.77 | −16.45 | −16.05 | −15.87 | −15.67 | −15.53 | −15.29 | −15 |
| 5.7 | 5.9 | 6.7 | 7.2 | 7.6 | 8 | 7.9 | 7.7 | 7.6 |
| 70.6 | 70.2 | 70.7 | 71 | 70.3 | 71.3 | 73.4 | 77.7 | 79.4 |
The simulation in this paper is divided into two parts. In the first part, the comparison of the results of applying the nonlinear observer [
26] and the proposed T-S fuzzy observer to the AIS data of
Table 1 are presented in Case 1. In Case 2, extending the results of Case 1, the T-S fuzzy observer with the observer gains obtained in Case 1 is applied to various trajectories to verify the practicality of the proposed design method.
<Case 1>
In this case, the nonlinear observer design method [
26] is considered to compare with the proposed T-S fuzzy observer design method. To carry on with the simulations, the time constant
,
are selected for the input (5) and (6) of both observer design methods, and the initial condition of the observer state is considered as
.
To develop the T-S fuzzy observer with the observer gain design algorithm, the initial observer gains
,
,
and
are first selected for the simulation. For simplification of the application, the constant values are chosen as
, and
,
are also chosen in the same case for
. In these simulations, let us choose
,
,
, where
, for the decision range of the average error. Note that the value of
can be seen as the maximum tolerance of the average error which is considered for the observation of the AIS data in
Table 1. The constant values
are also set, and
,
are also appointed in the same case for
. In the simulations, the values
,
and
are selected for the proposed T-S fuzzy observer gain design algorithm. Applying the algorithm with the AIS data in
Table 1 and the T-S fuzzy observer (36), the final observer gains
,
,
and
can be obtained to construct the observer gain matrix
.
The nonlinear observer design method of [
26] cannot determine what observer gain is better or more suitable for the AIS data in
Table 1. That is, how to choose the observer gain for the nonlinear observer design method is also an open issue. For the observation of AIS data, a certain accuracy must be satisfied for collision avoidance between ships. Via combining the algorithm with the proposed T-S fuzzy observer, the condition is also set for the observer design such that the objective of the observer can be achieved. In order to preserve the authenticity of the design method proposed in [
26], the AIS data is considered with the same trajectory as Figure 9 in [
26]. Moreover, the observer gains
,
,
and
are also selected to be the same as in [
26] for the nonlinear observer (9)–(12). Then, the simulation results of the comparison between the nonlinear observer [
26] and the T-S fuzzy observer are presented.
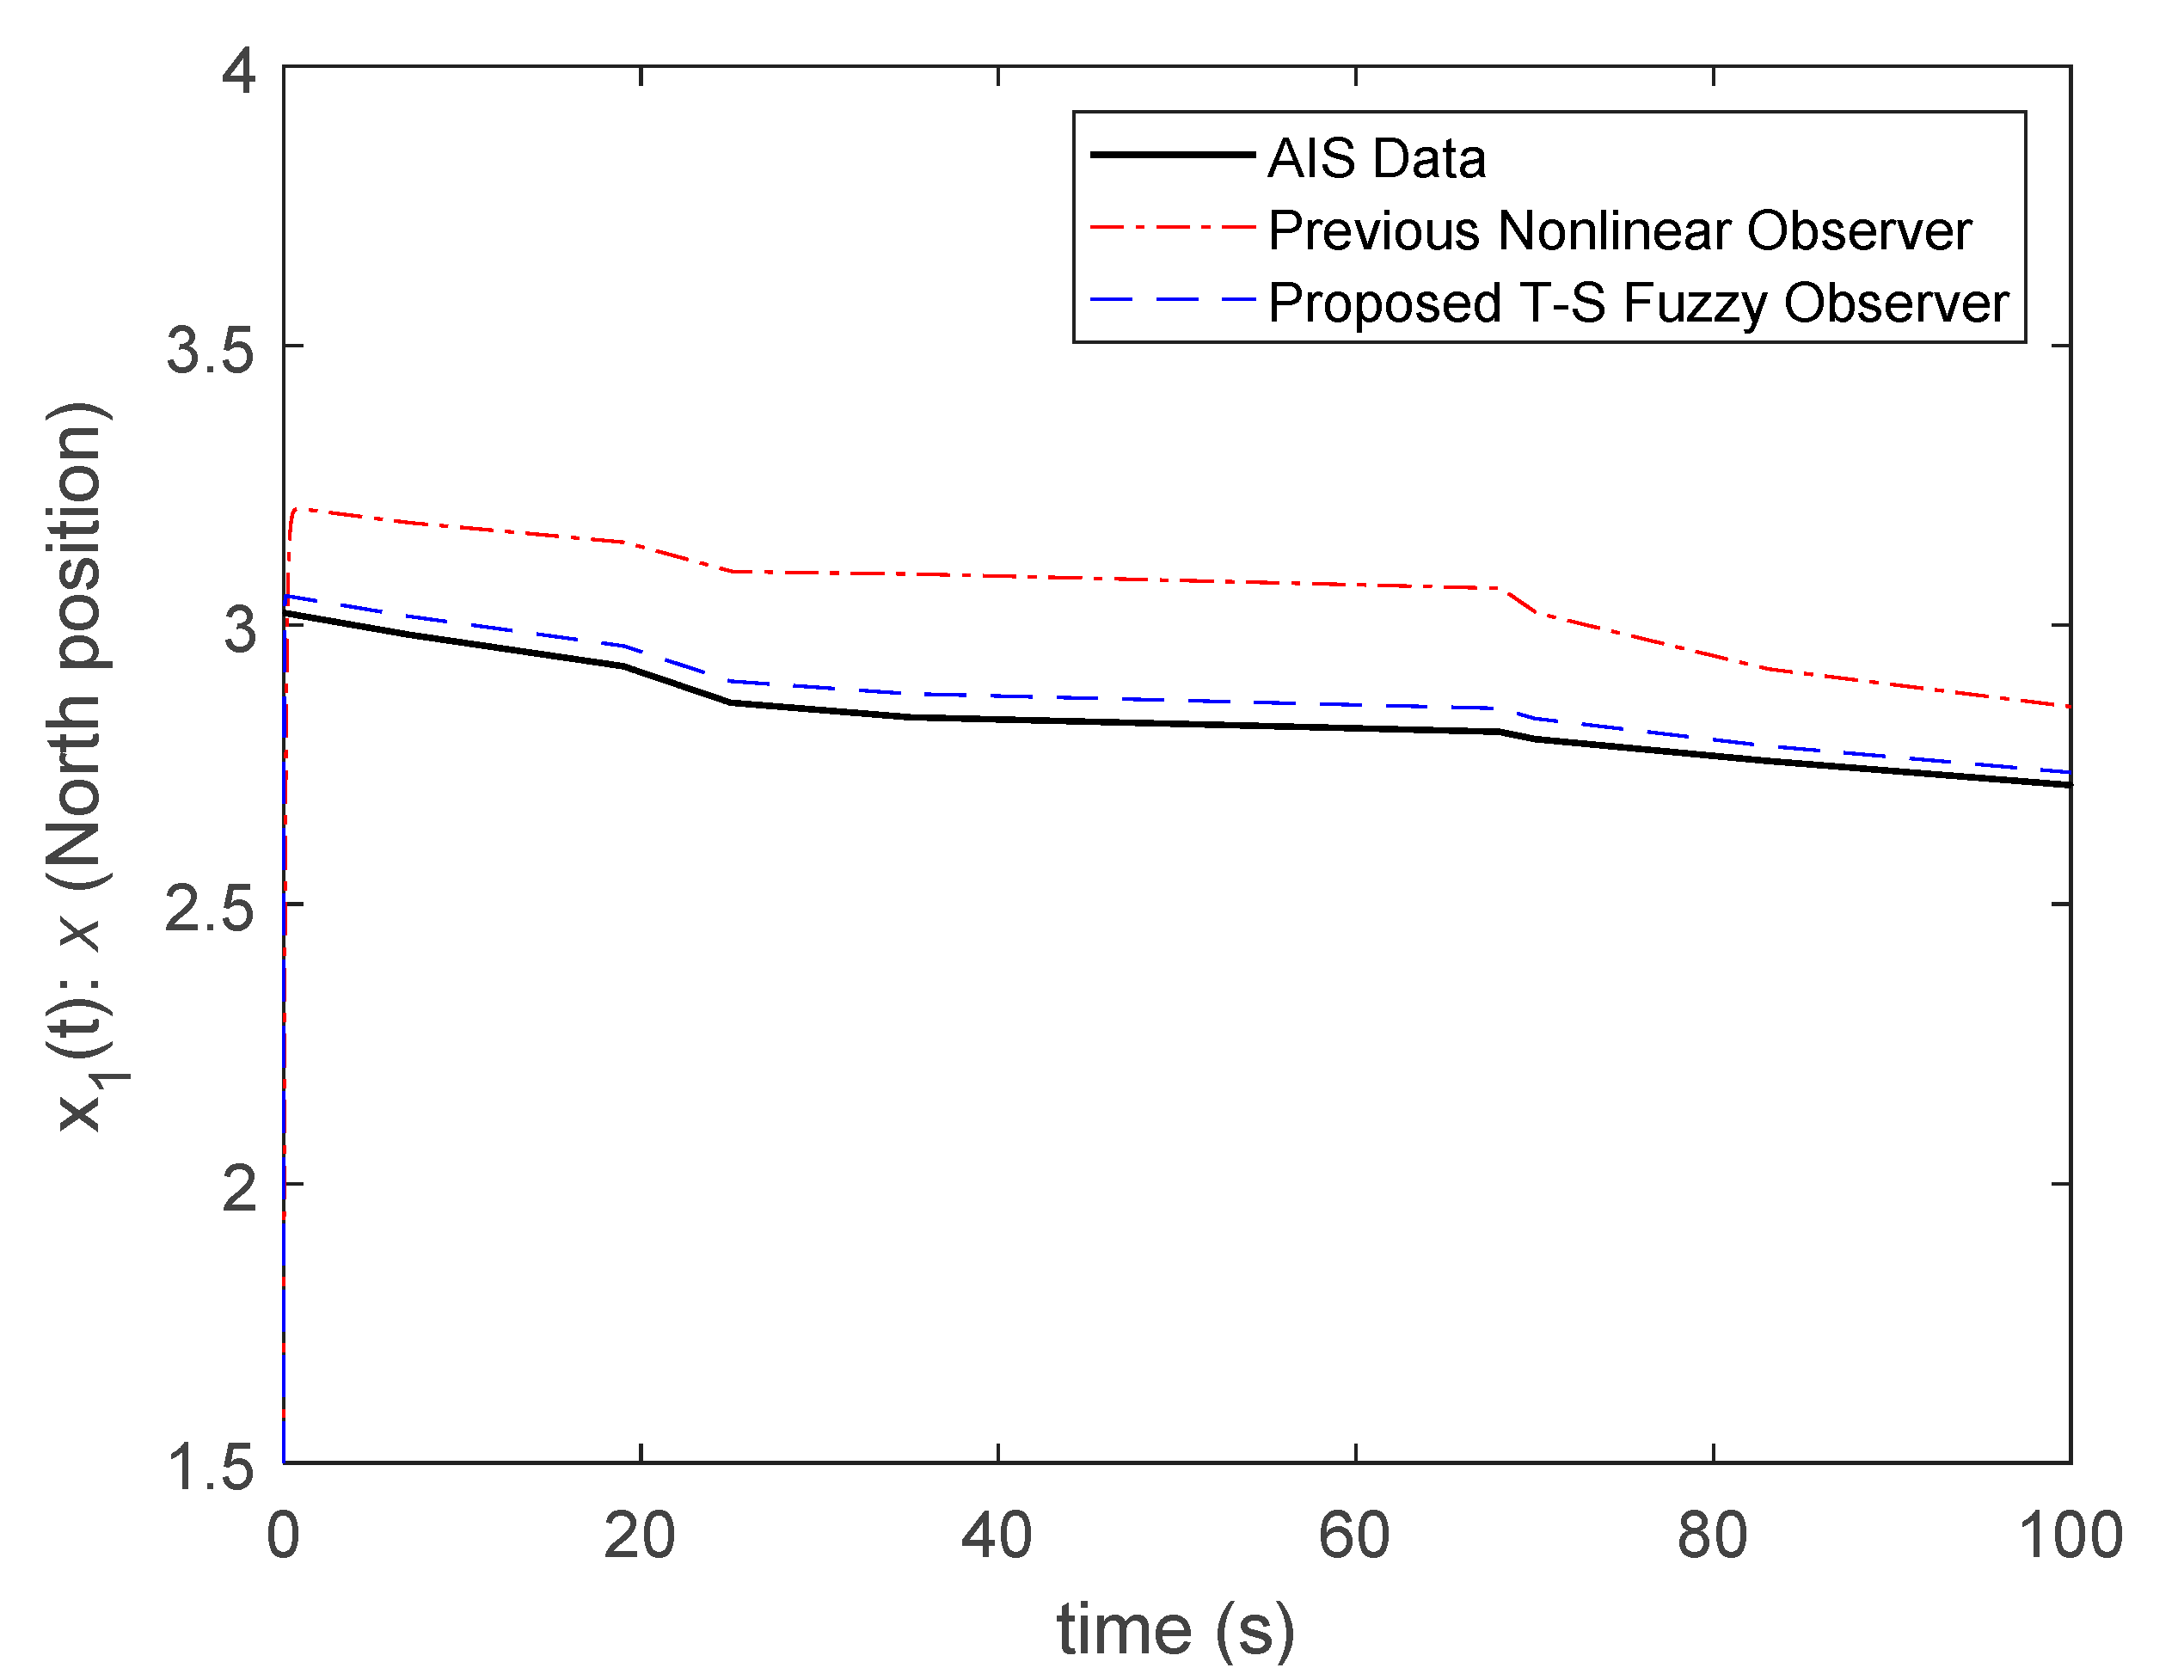
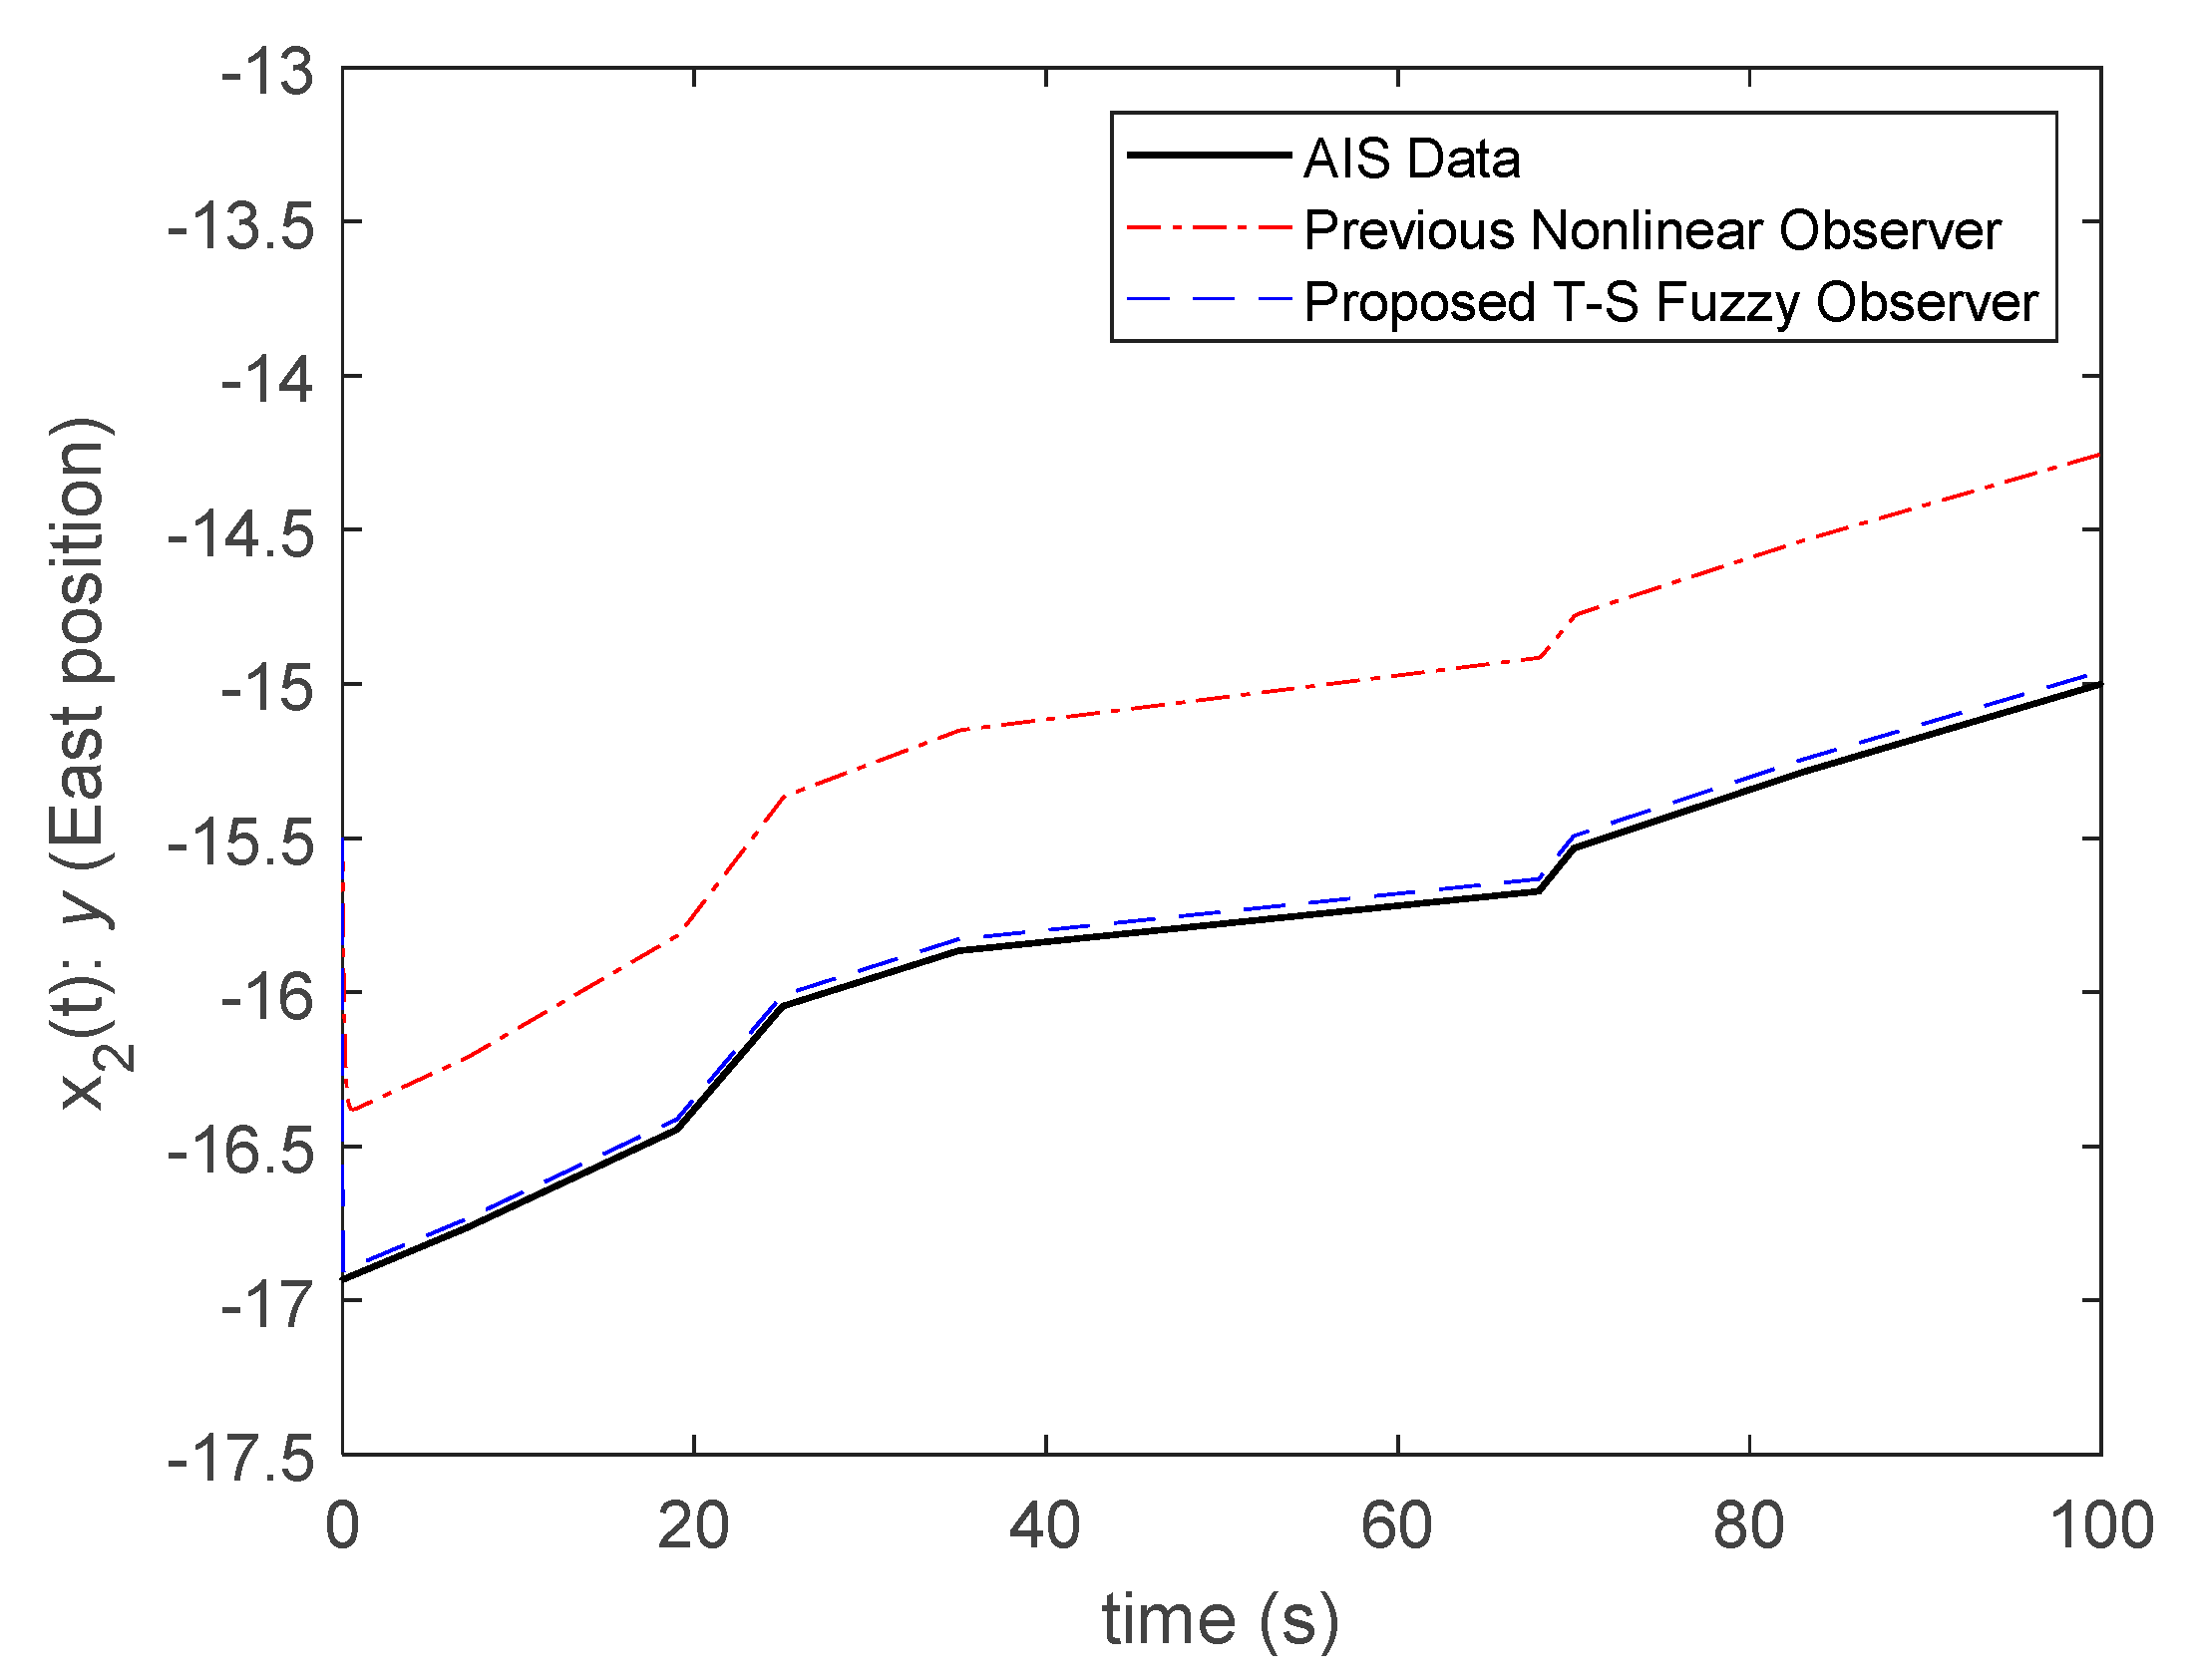
From the simulation results of
Figure 5 and
Figure 6, it can be seen that better-observed results can be obtained by the proposed T-S fuzzy observer design method because the objective of the minimum average error
is satisfied by the proposed algorithm. Despite the bigger observer gain obtained for the T-S fuzzy observer, the expected performance of the observation of AIS data in
Table 1 is guaranteed. Note that the state
and
are related to the trajectory of the ship directly, so they must be observed more accurately. In
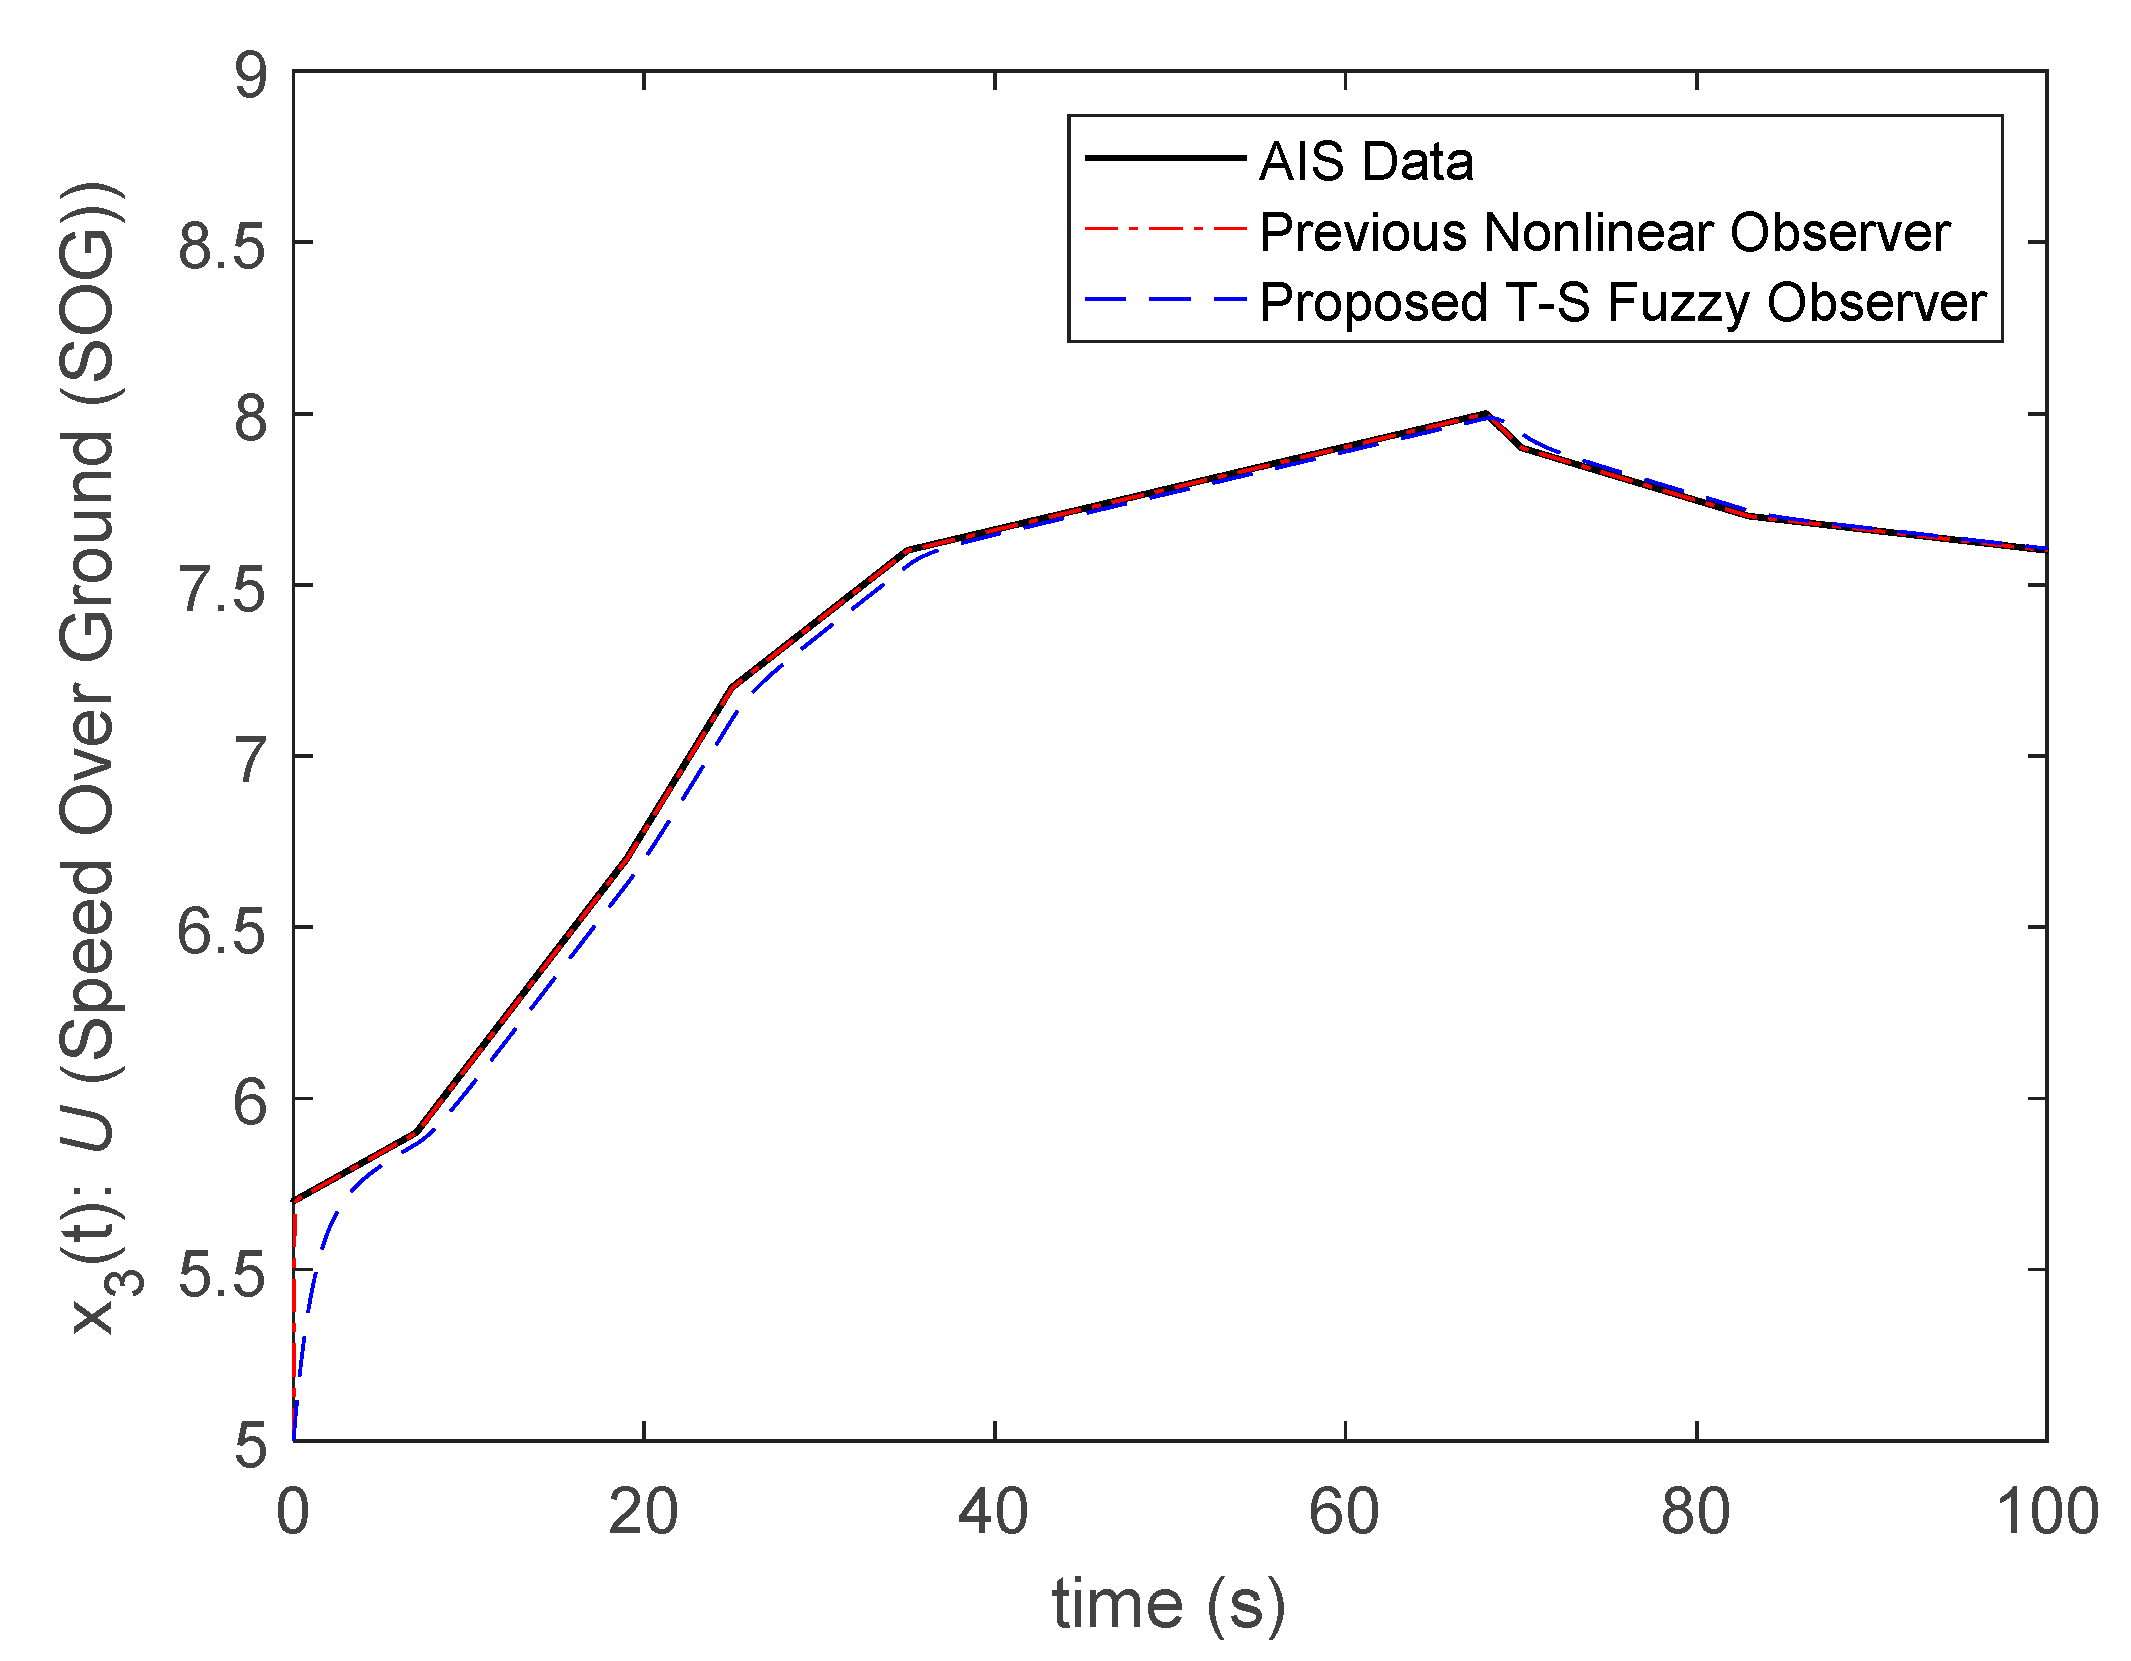
Figure 7 and
Figure 8, the observed results of the proposed T-S fuzzy observer also approach the results of the nonlinear observer [
26]. Moreover, the observer gains of the proposed fuzzy observer are smaller than the nonlinear observer. For the safety problem of a ship on the ocean, the trajectory must be observed such that precautions against the ship’s collisions can be executed more precisely. The proposed T-S fuzzy observer design method can monitor the state
and
correctly and also observe state
and
well. Thus, the proposed T-S fuzzy observer can provide a more suitable tool for estimating ship trajectories.
In Case 1, the simulation results of the comparisons between the nonlinear observer [
26] and the proposed T-S fuzzy observer are presented. Applying the proposed fuzzy observer design algorithm, the observer gains can be adjusted to more suitable values for the AIS data. From the results of
Figure 5 and
Figure 6, it is obvious that the observer gains are adjusted to a bigger value to satisfy the better performance of the observation of states
and
, which is essential to a ship. Besides, from
Figure 7 and
Figure 8, the values of observer gains of the T-S fuzzy observer are much smaller; however, the observed results are also close to the nonlinear observer. From the results it can be concluded that the observer gains for
and
do not need to be too big to satisfy the expected observation performance. Based on Case 1, the T-S fuzzy observer with the obtained observer gains, is applied to the various trajectories of AIS data in Case 2.
<Case 2>
In this case, the T-S fuzzy observer (36) is applied to different kinds of ship trajectories with the observer gains
,
,
and
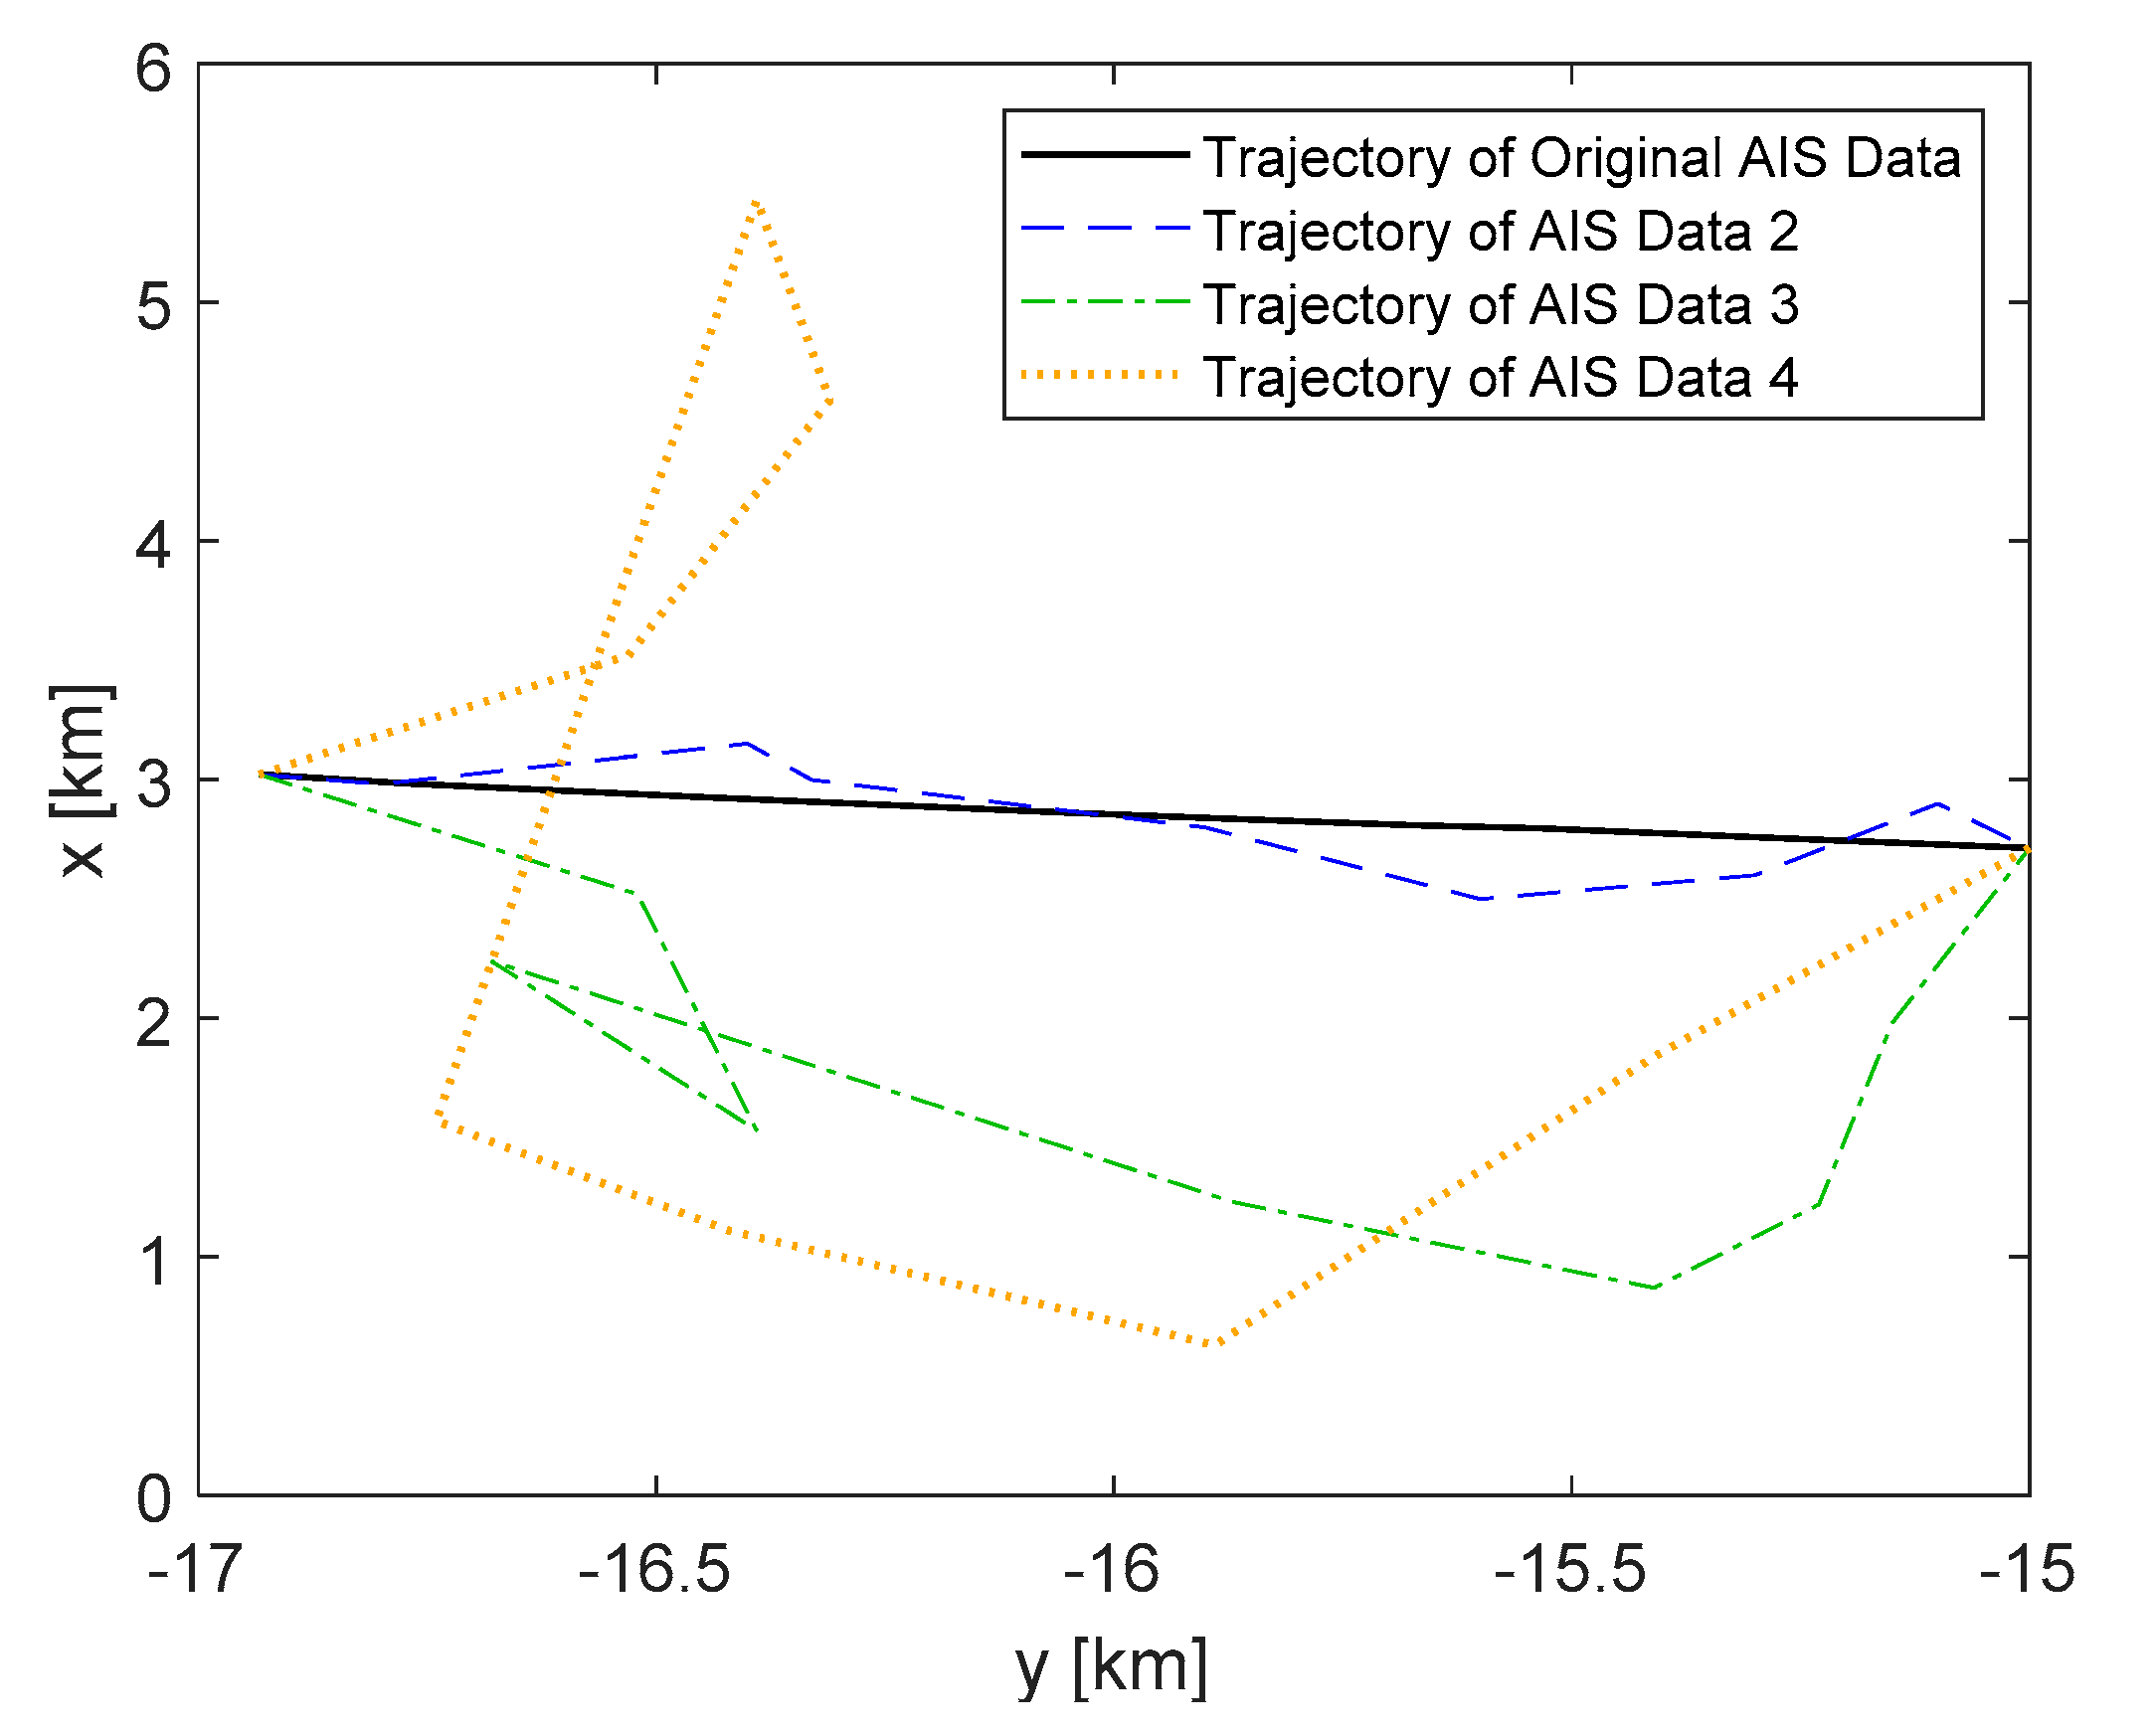
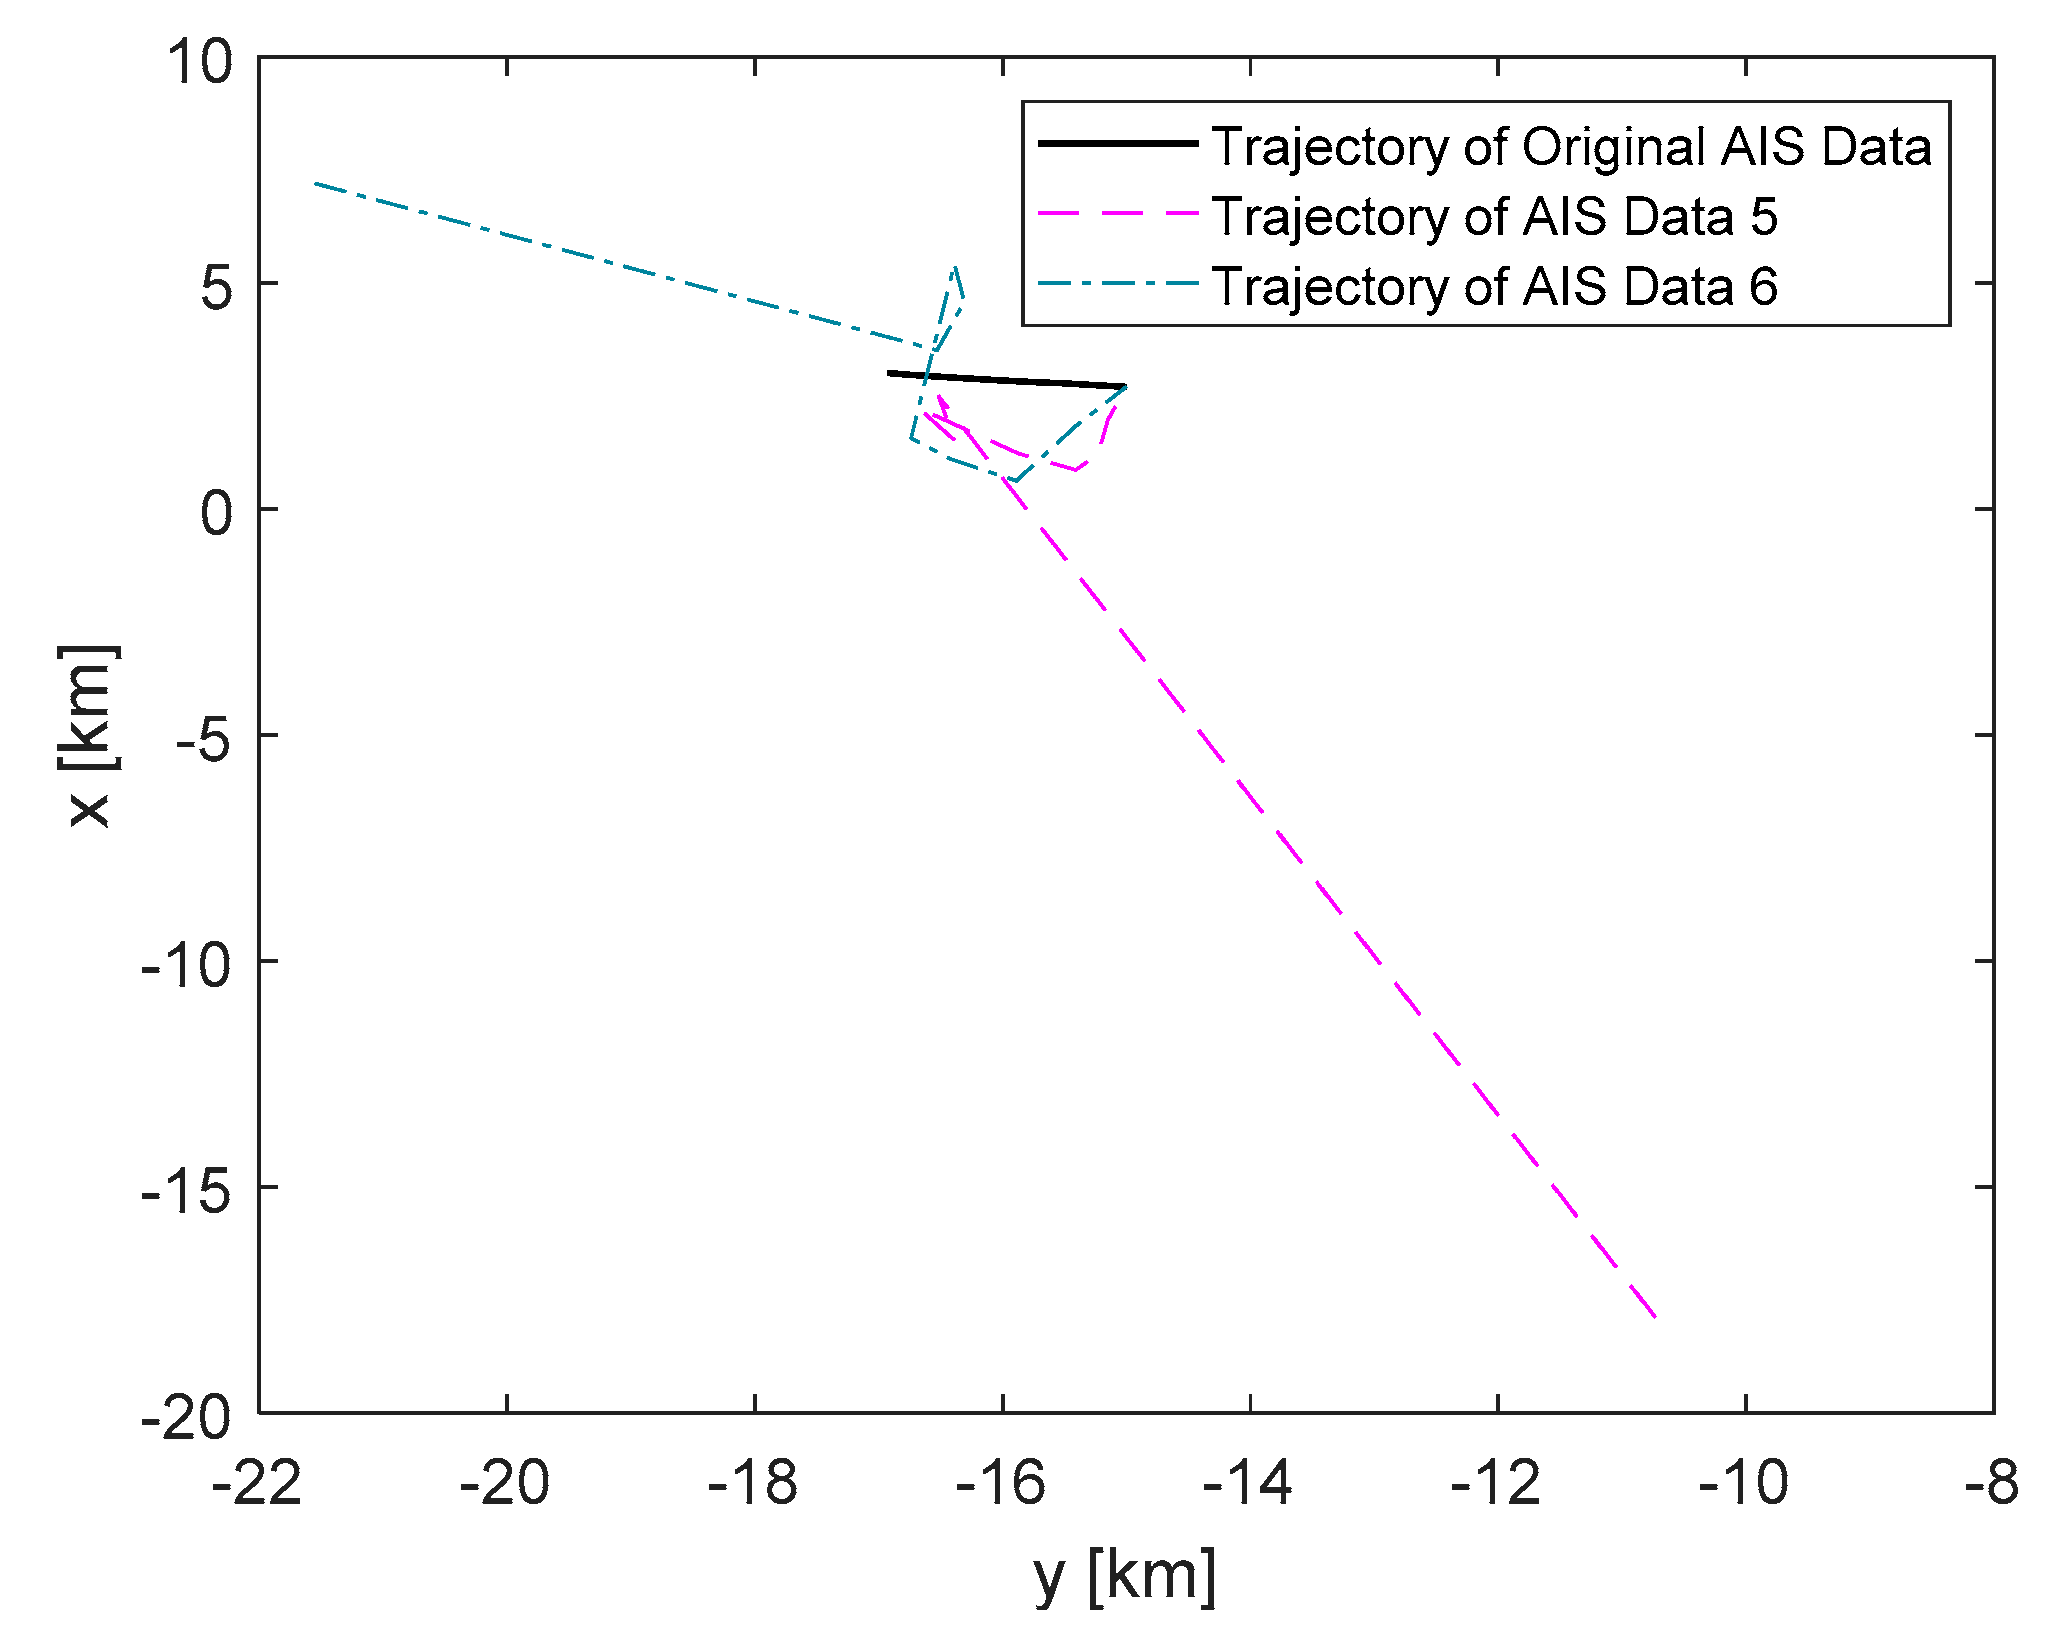
. Firstly, the trajectories are considered as in
Figure 9 and
Figure 10 for the simulations in Case 2. In
Figure 8, the different AIS data are considered with the same starting point and same destination. However, the trajectories are more complex than the trajectory considered in Case 1, which is presented as the original AIS data in
Figure 9. In
Figure 10, two disparate AIS data are considered for the same destination, but the starting points are far from the original data.
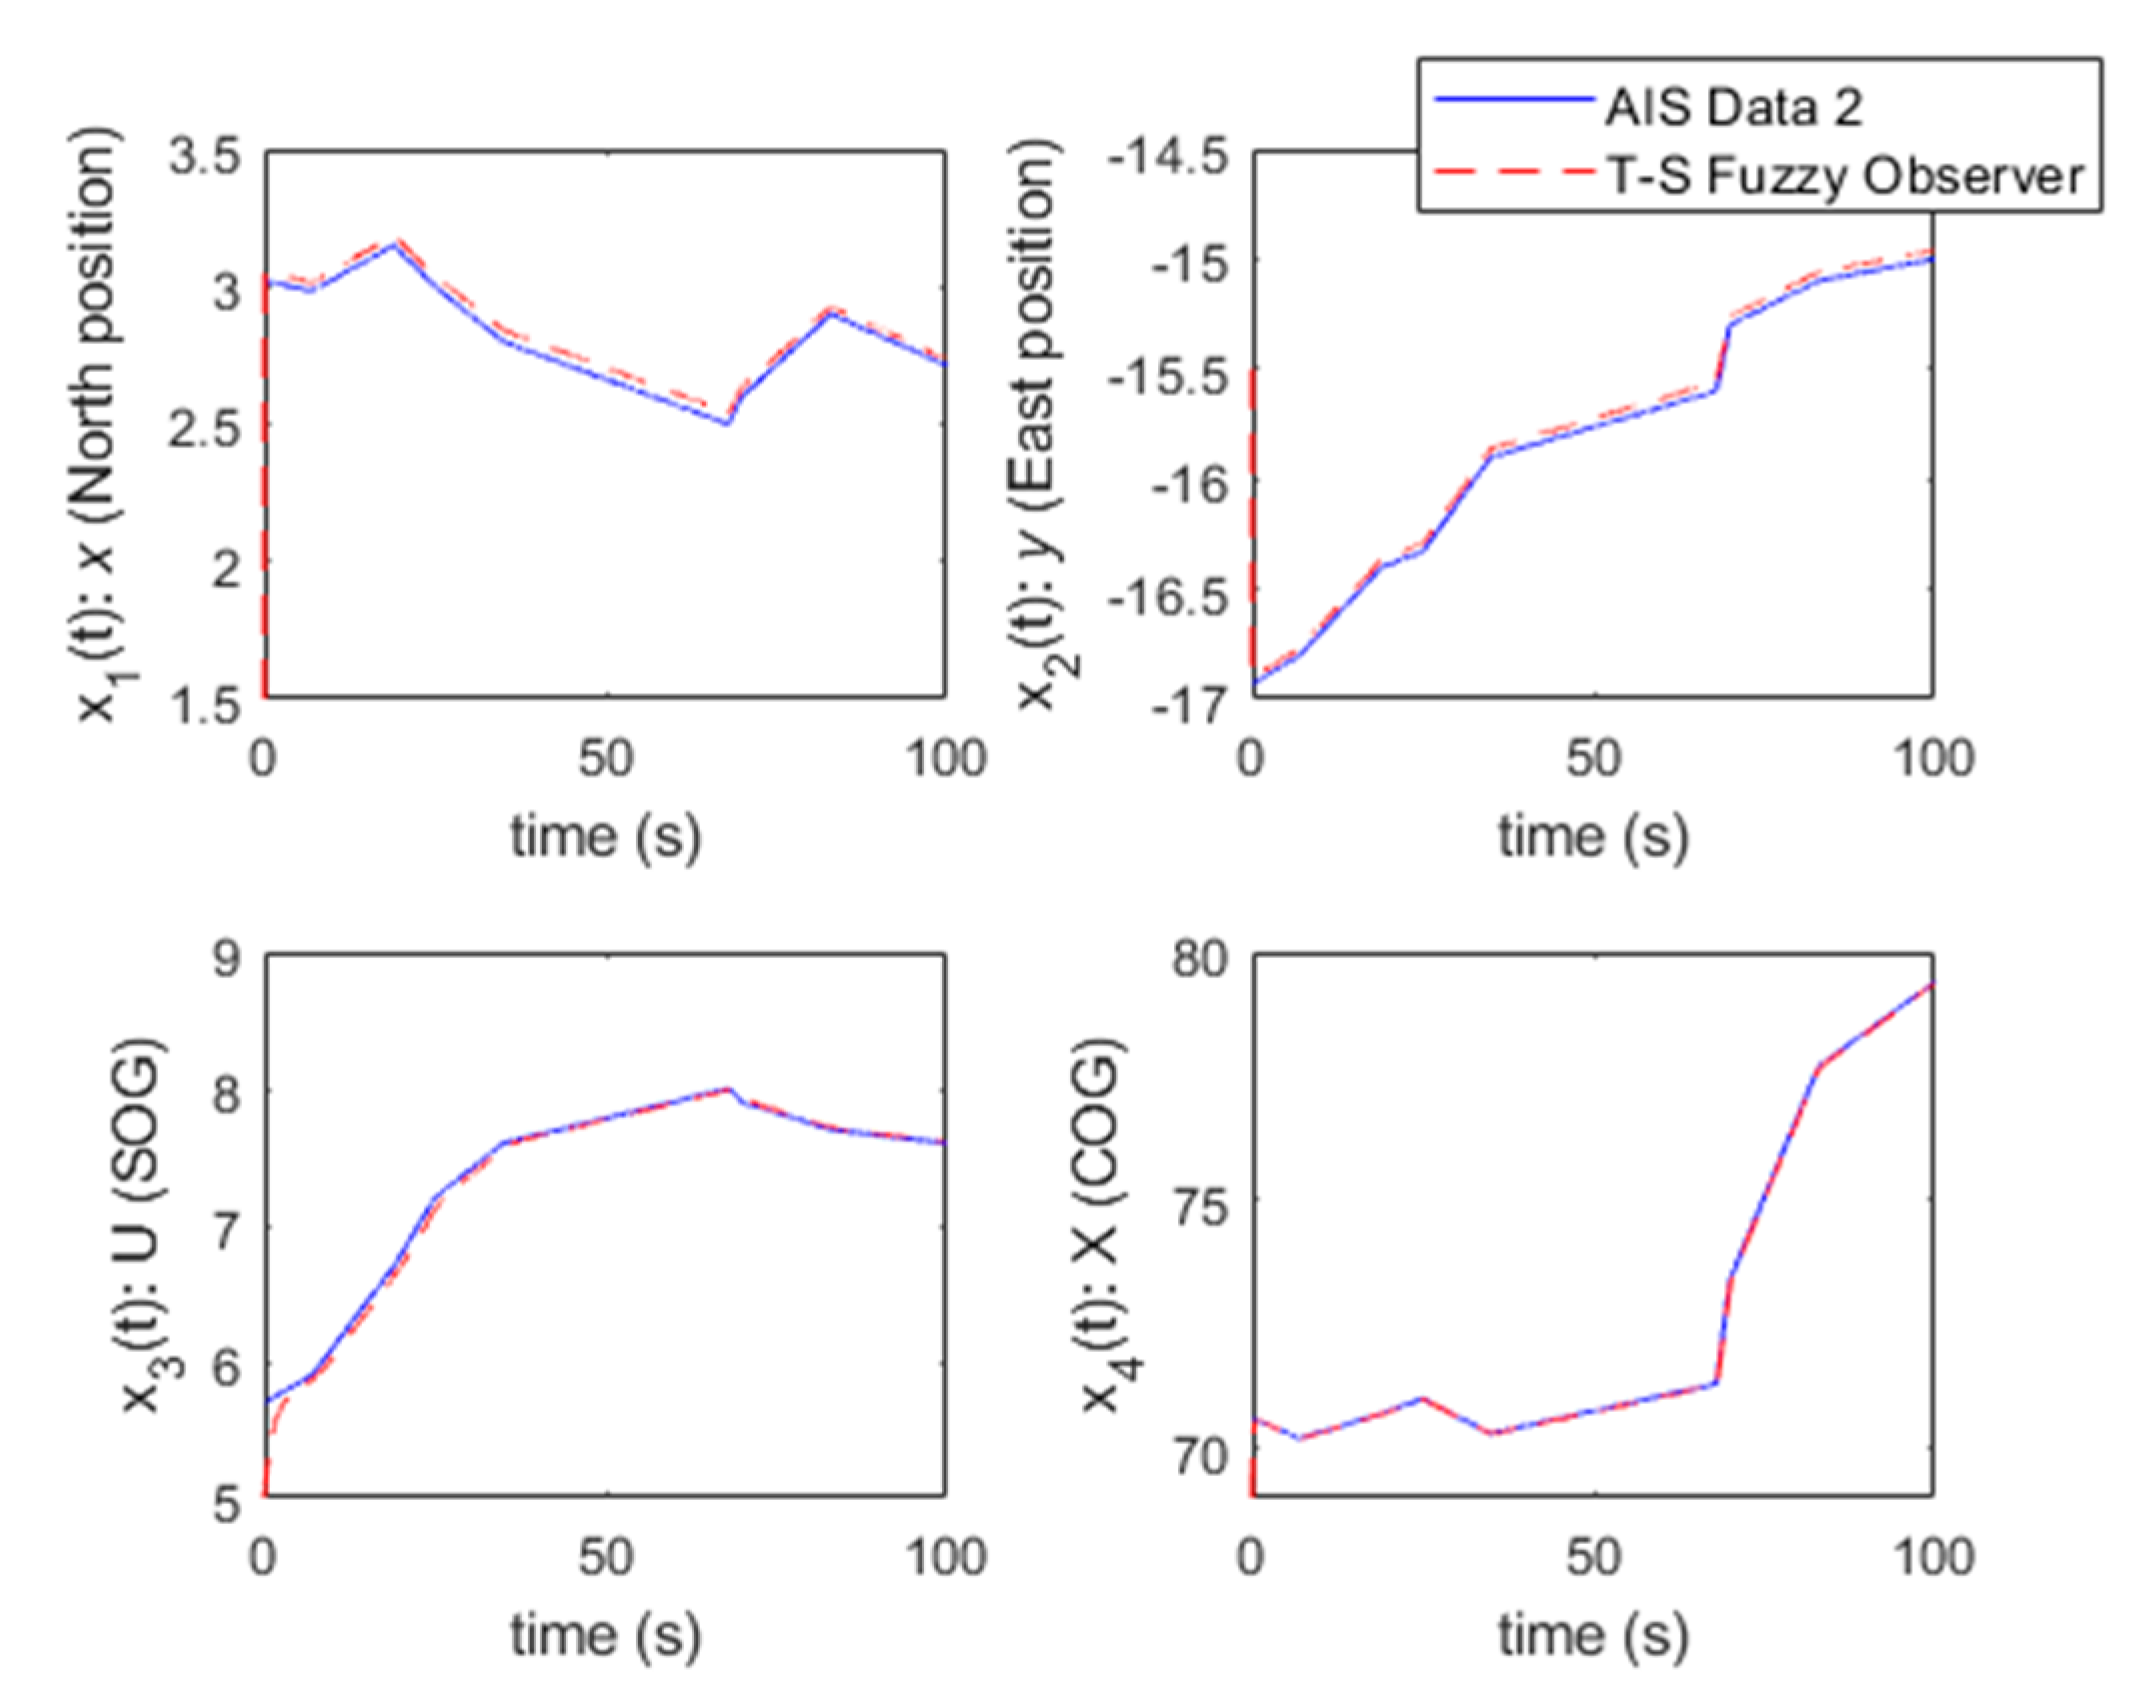
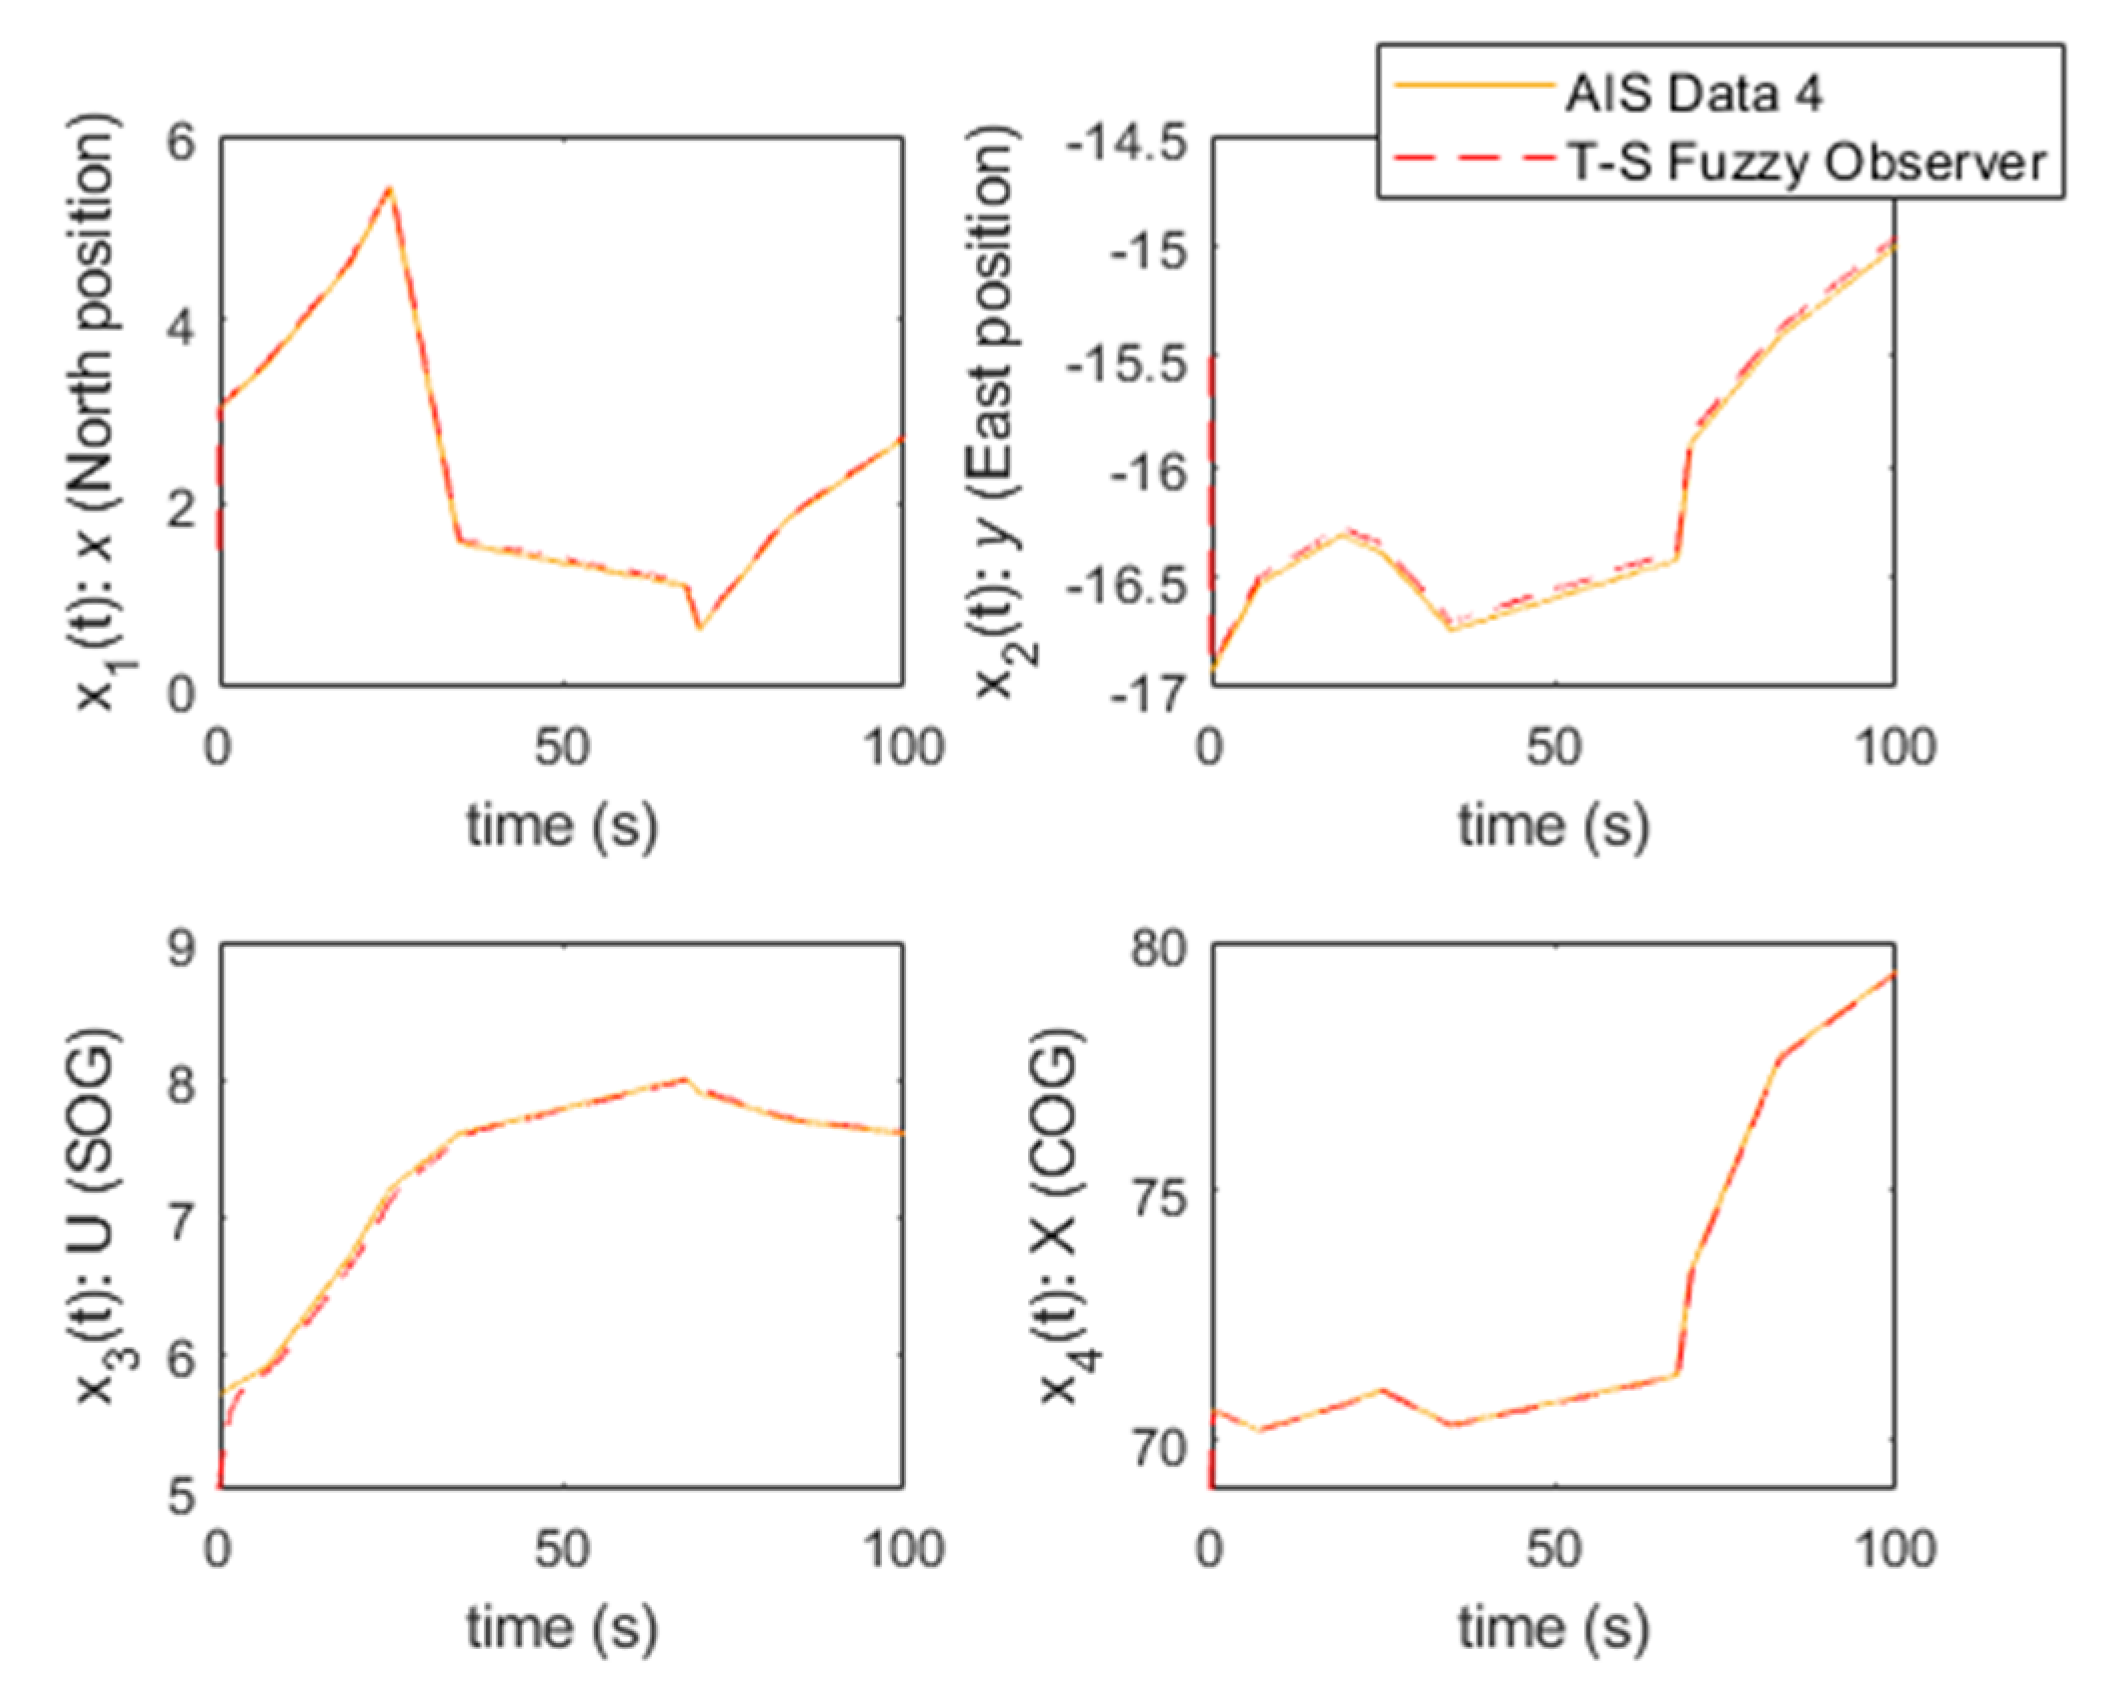
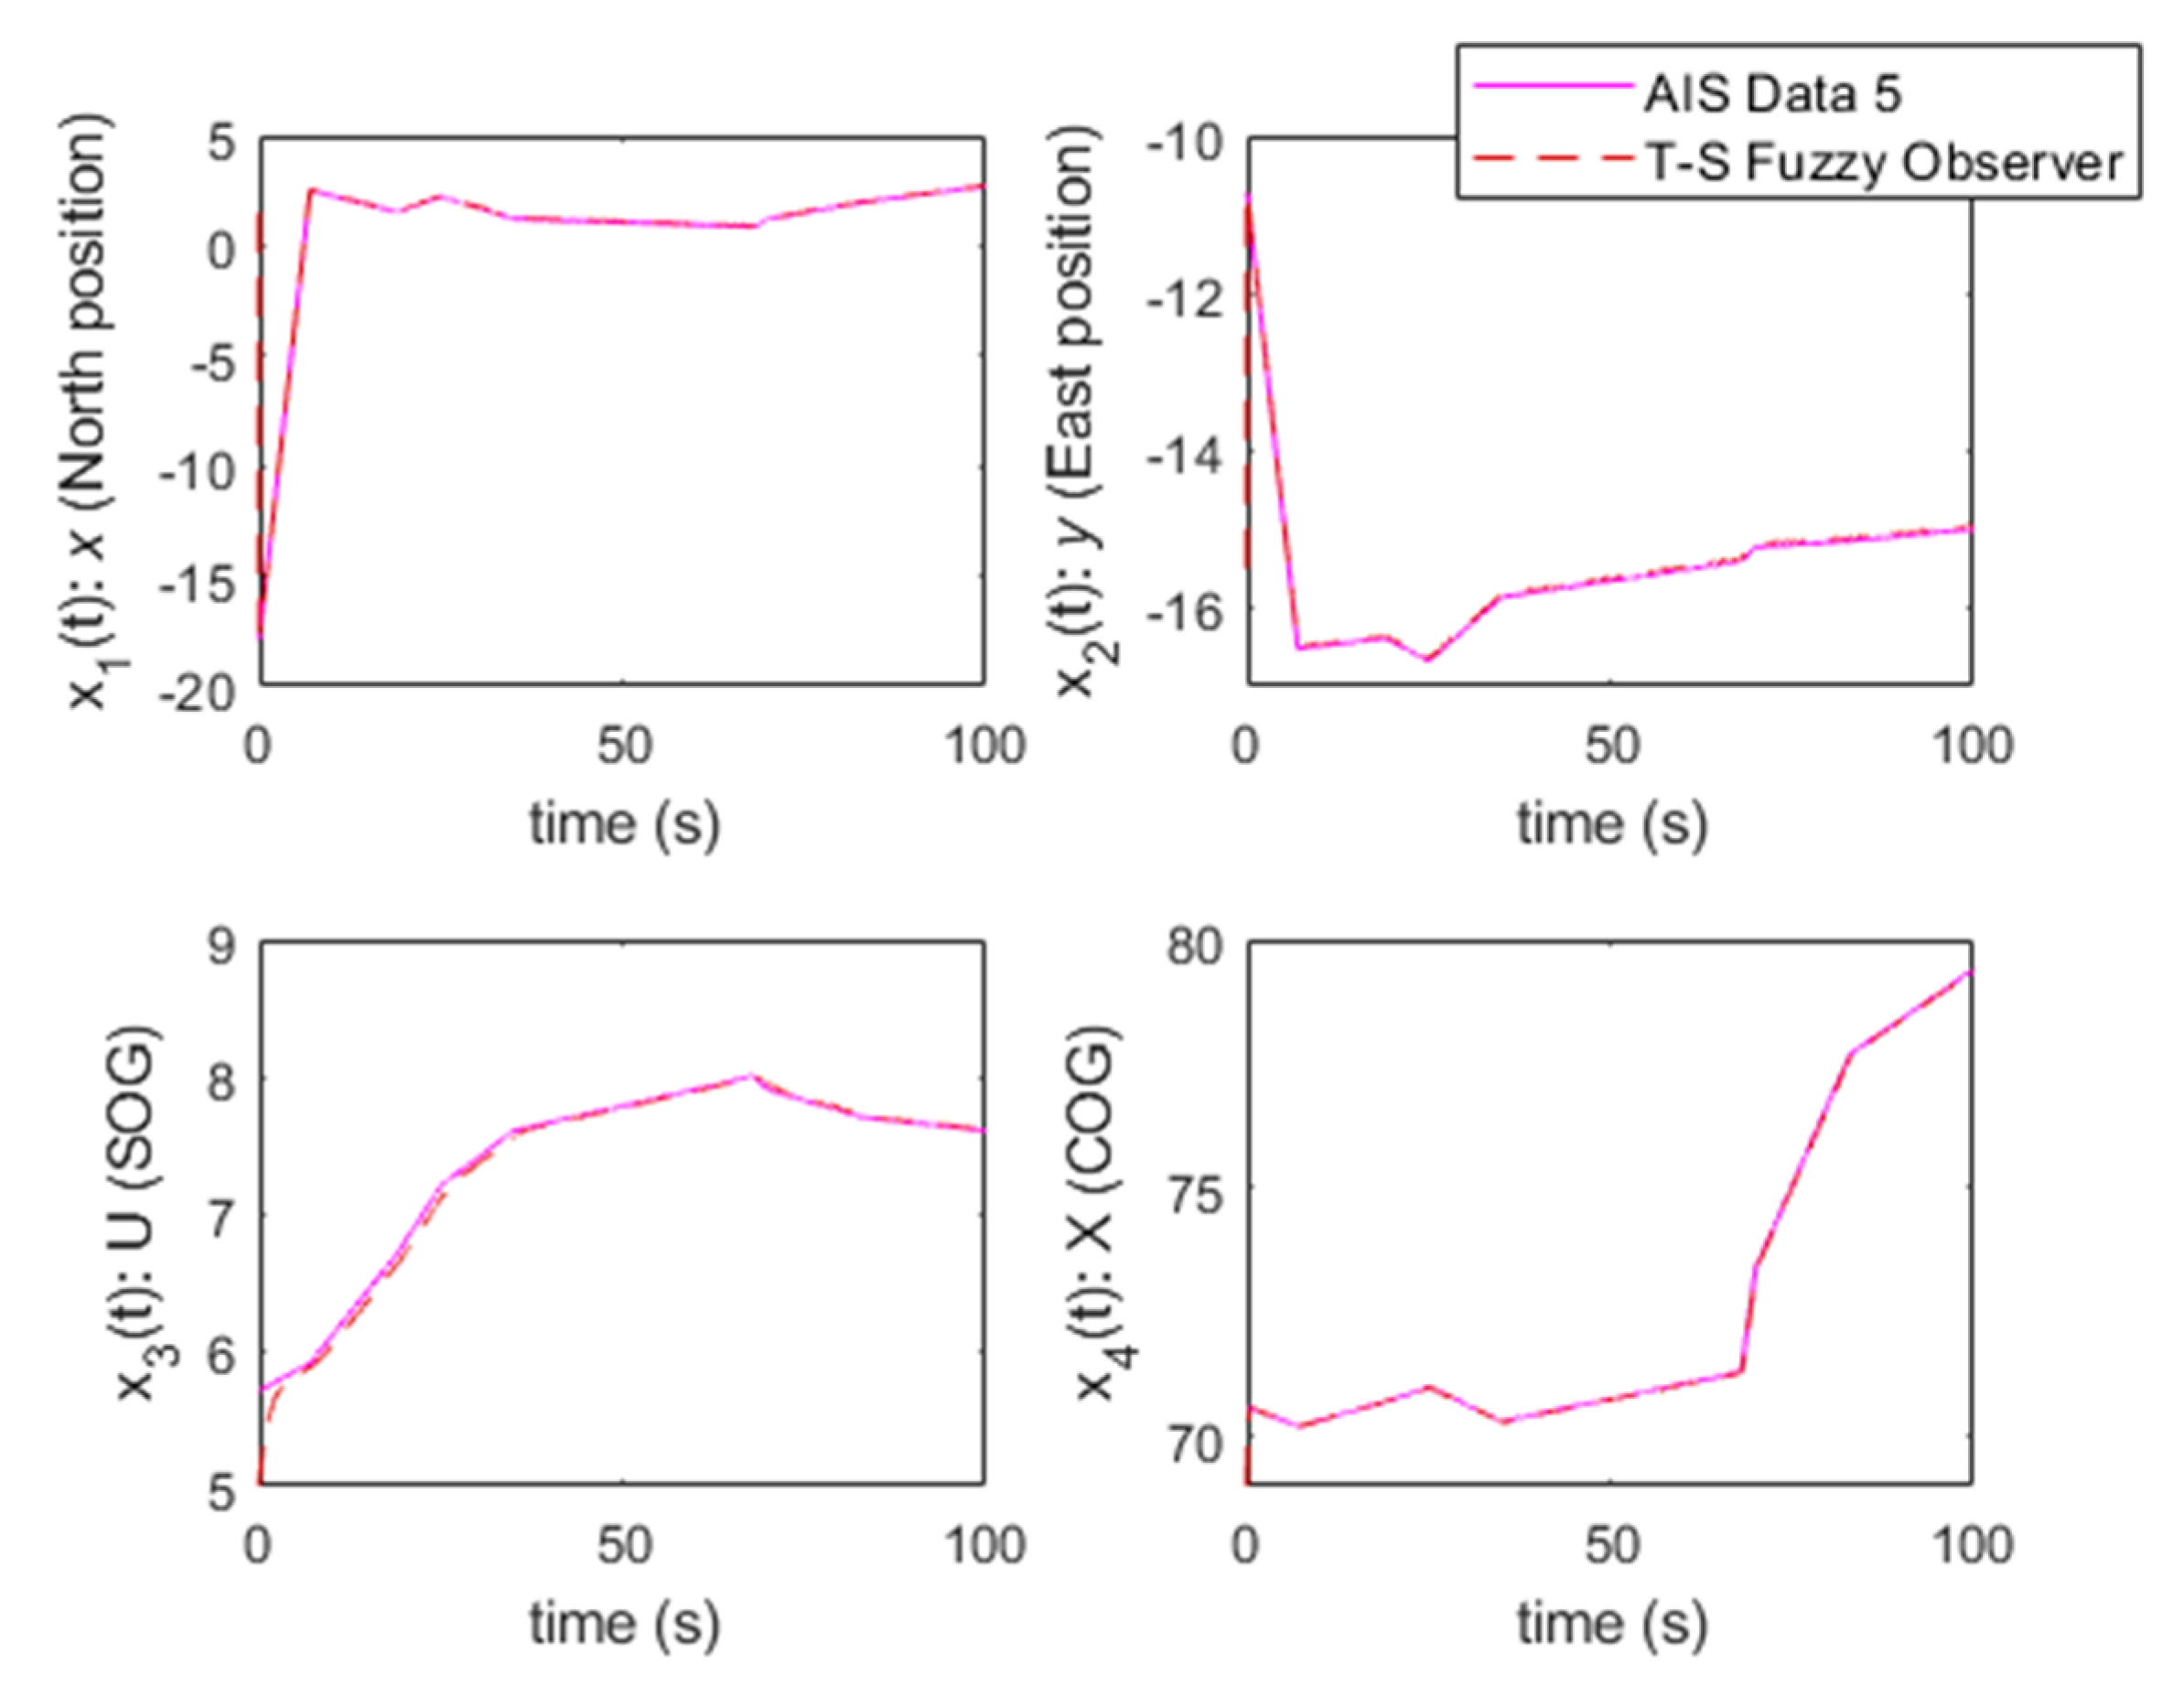
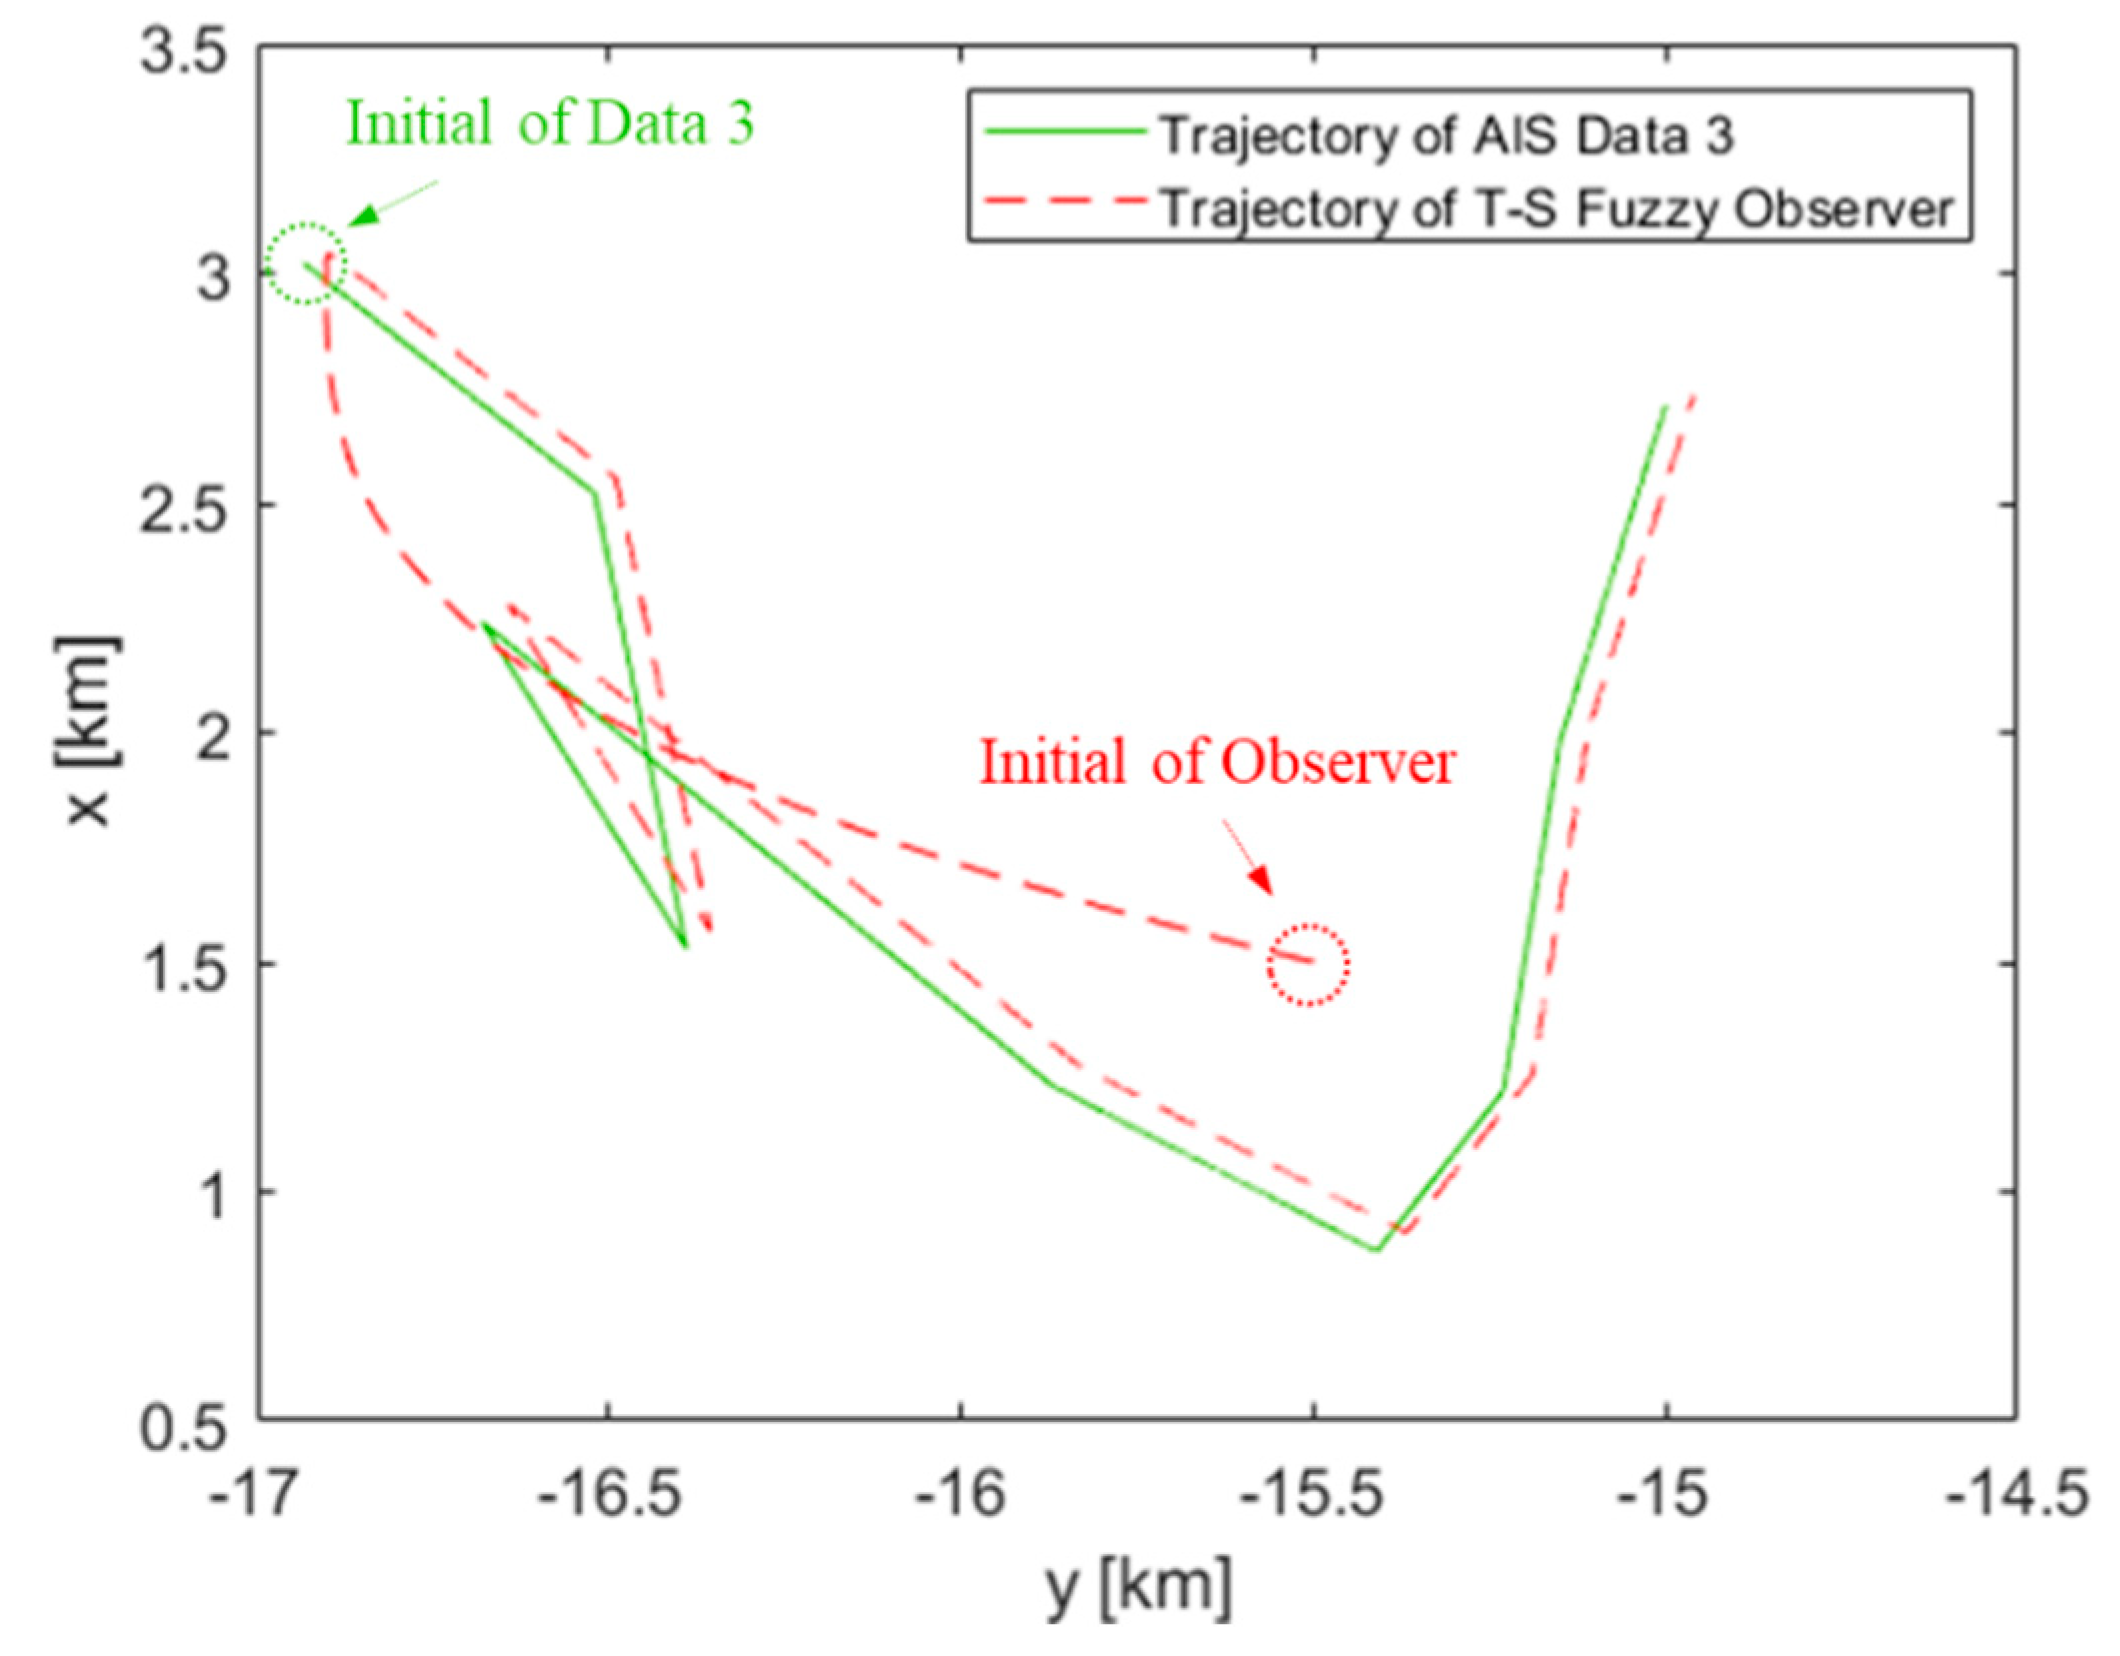
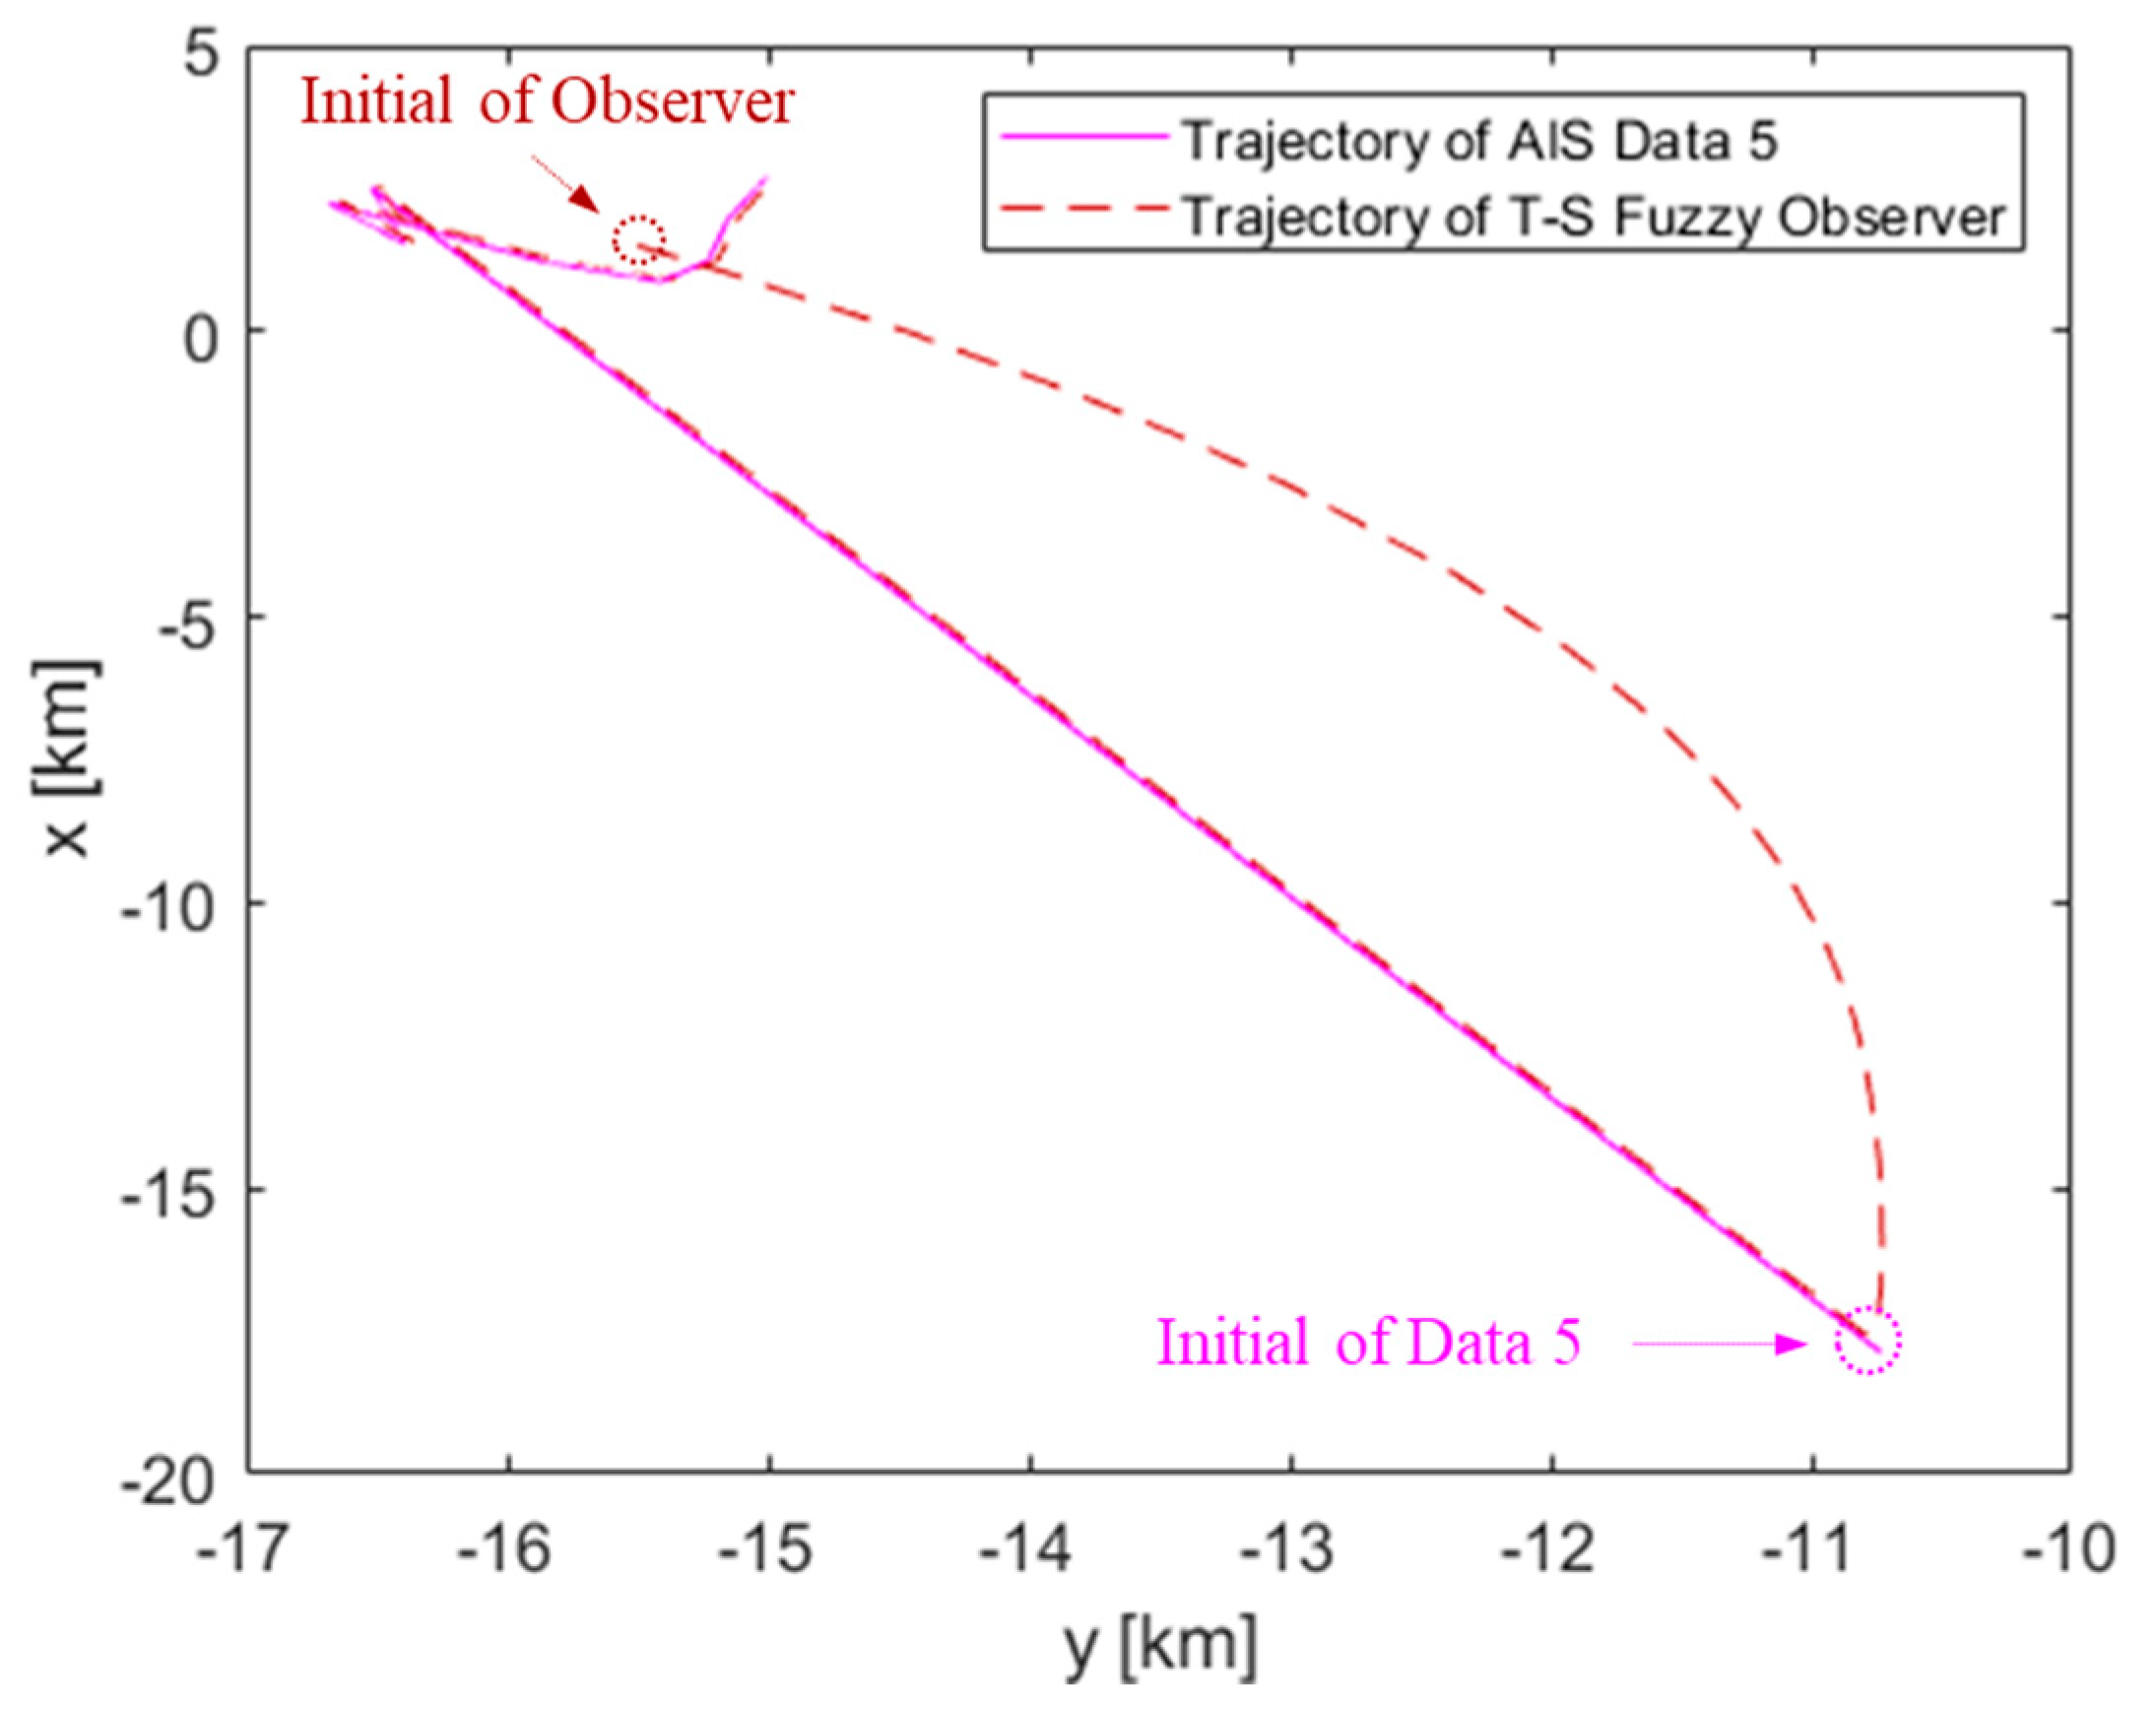
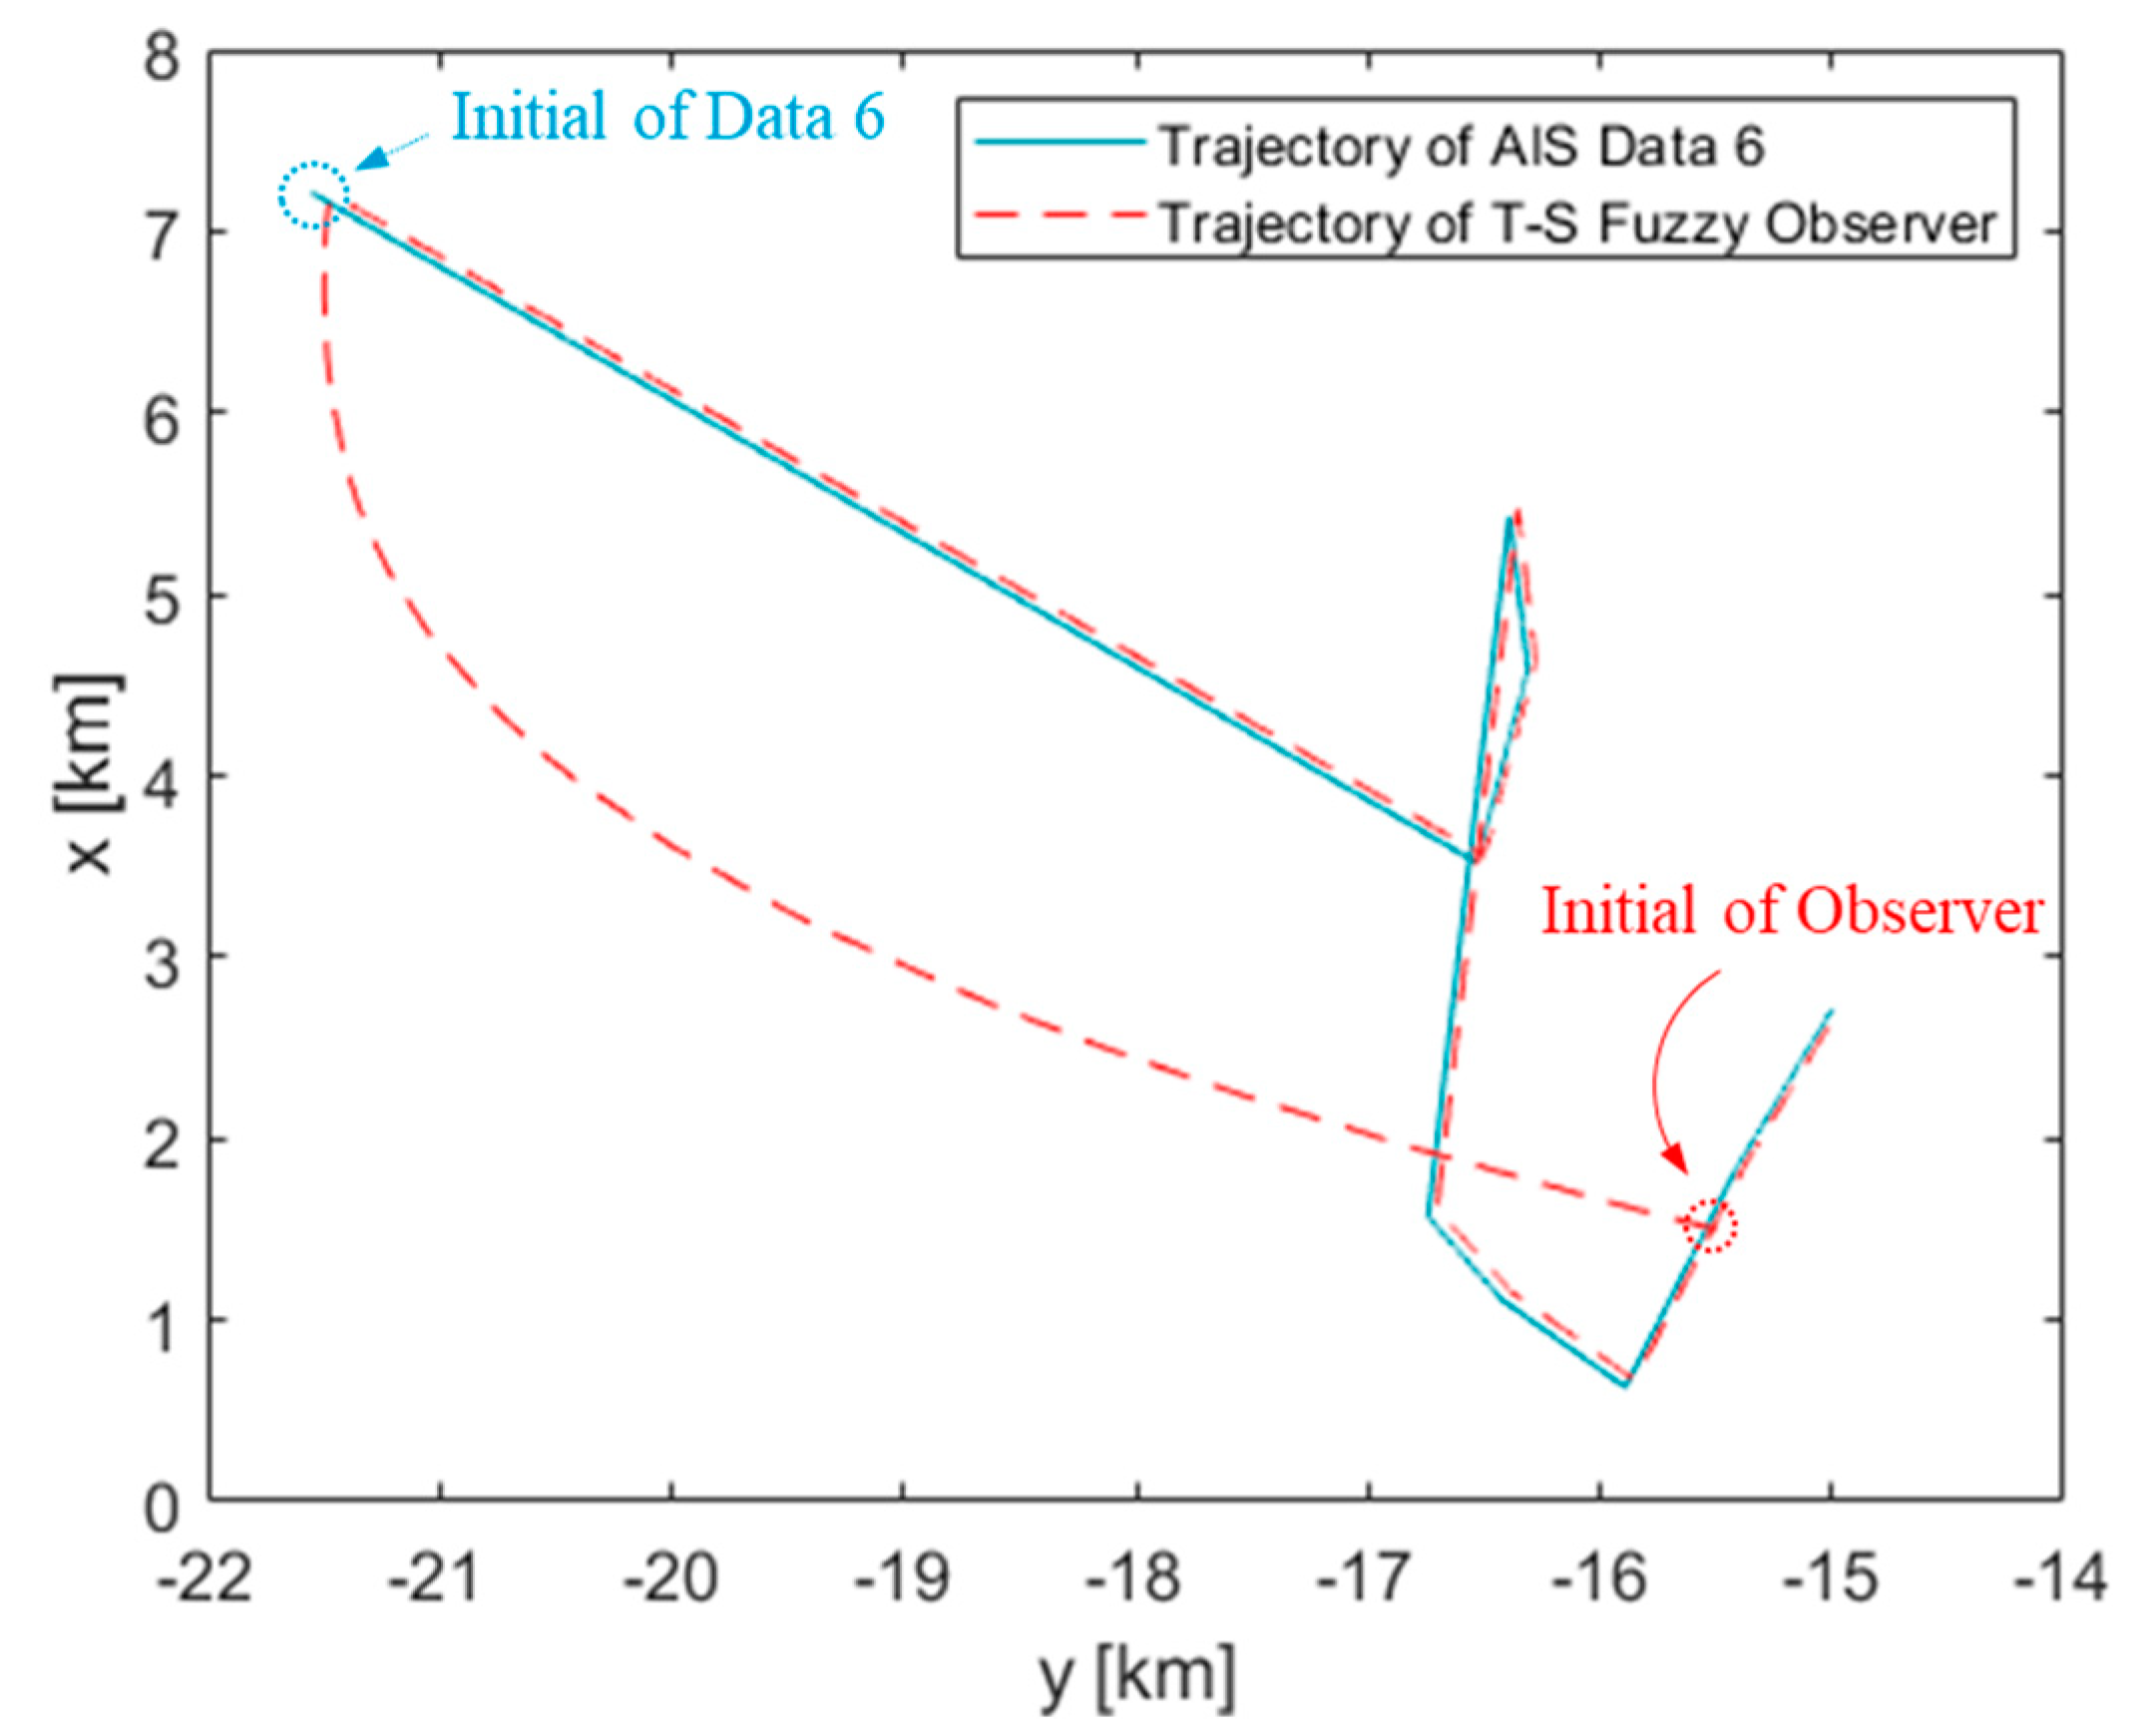
In the practical situation, from when ships enter a port until they are berthed, they may not come from the same position. Instead, they will come from various directions. Thus, it is essential to design an efficient observer to estimate all these possible ship trajectories. To demonstrate the applicability of the T-S fuzzy observer designed in Case 1, the simulation results are presented based on AIS data 2 to AIS data 6 in
Figure 8 and
Figure 9.
From the results of
Figure 11,
Figure 12,
Figure 13,
Figure 14 and
Figure 15, one can find that the T-S fuzzy observer with the gains
,
,
and
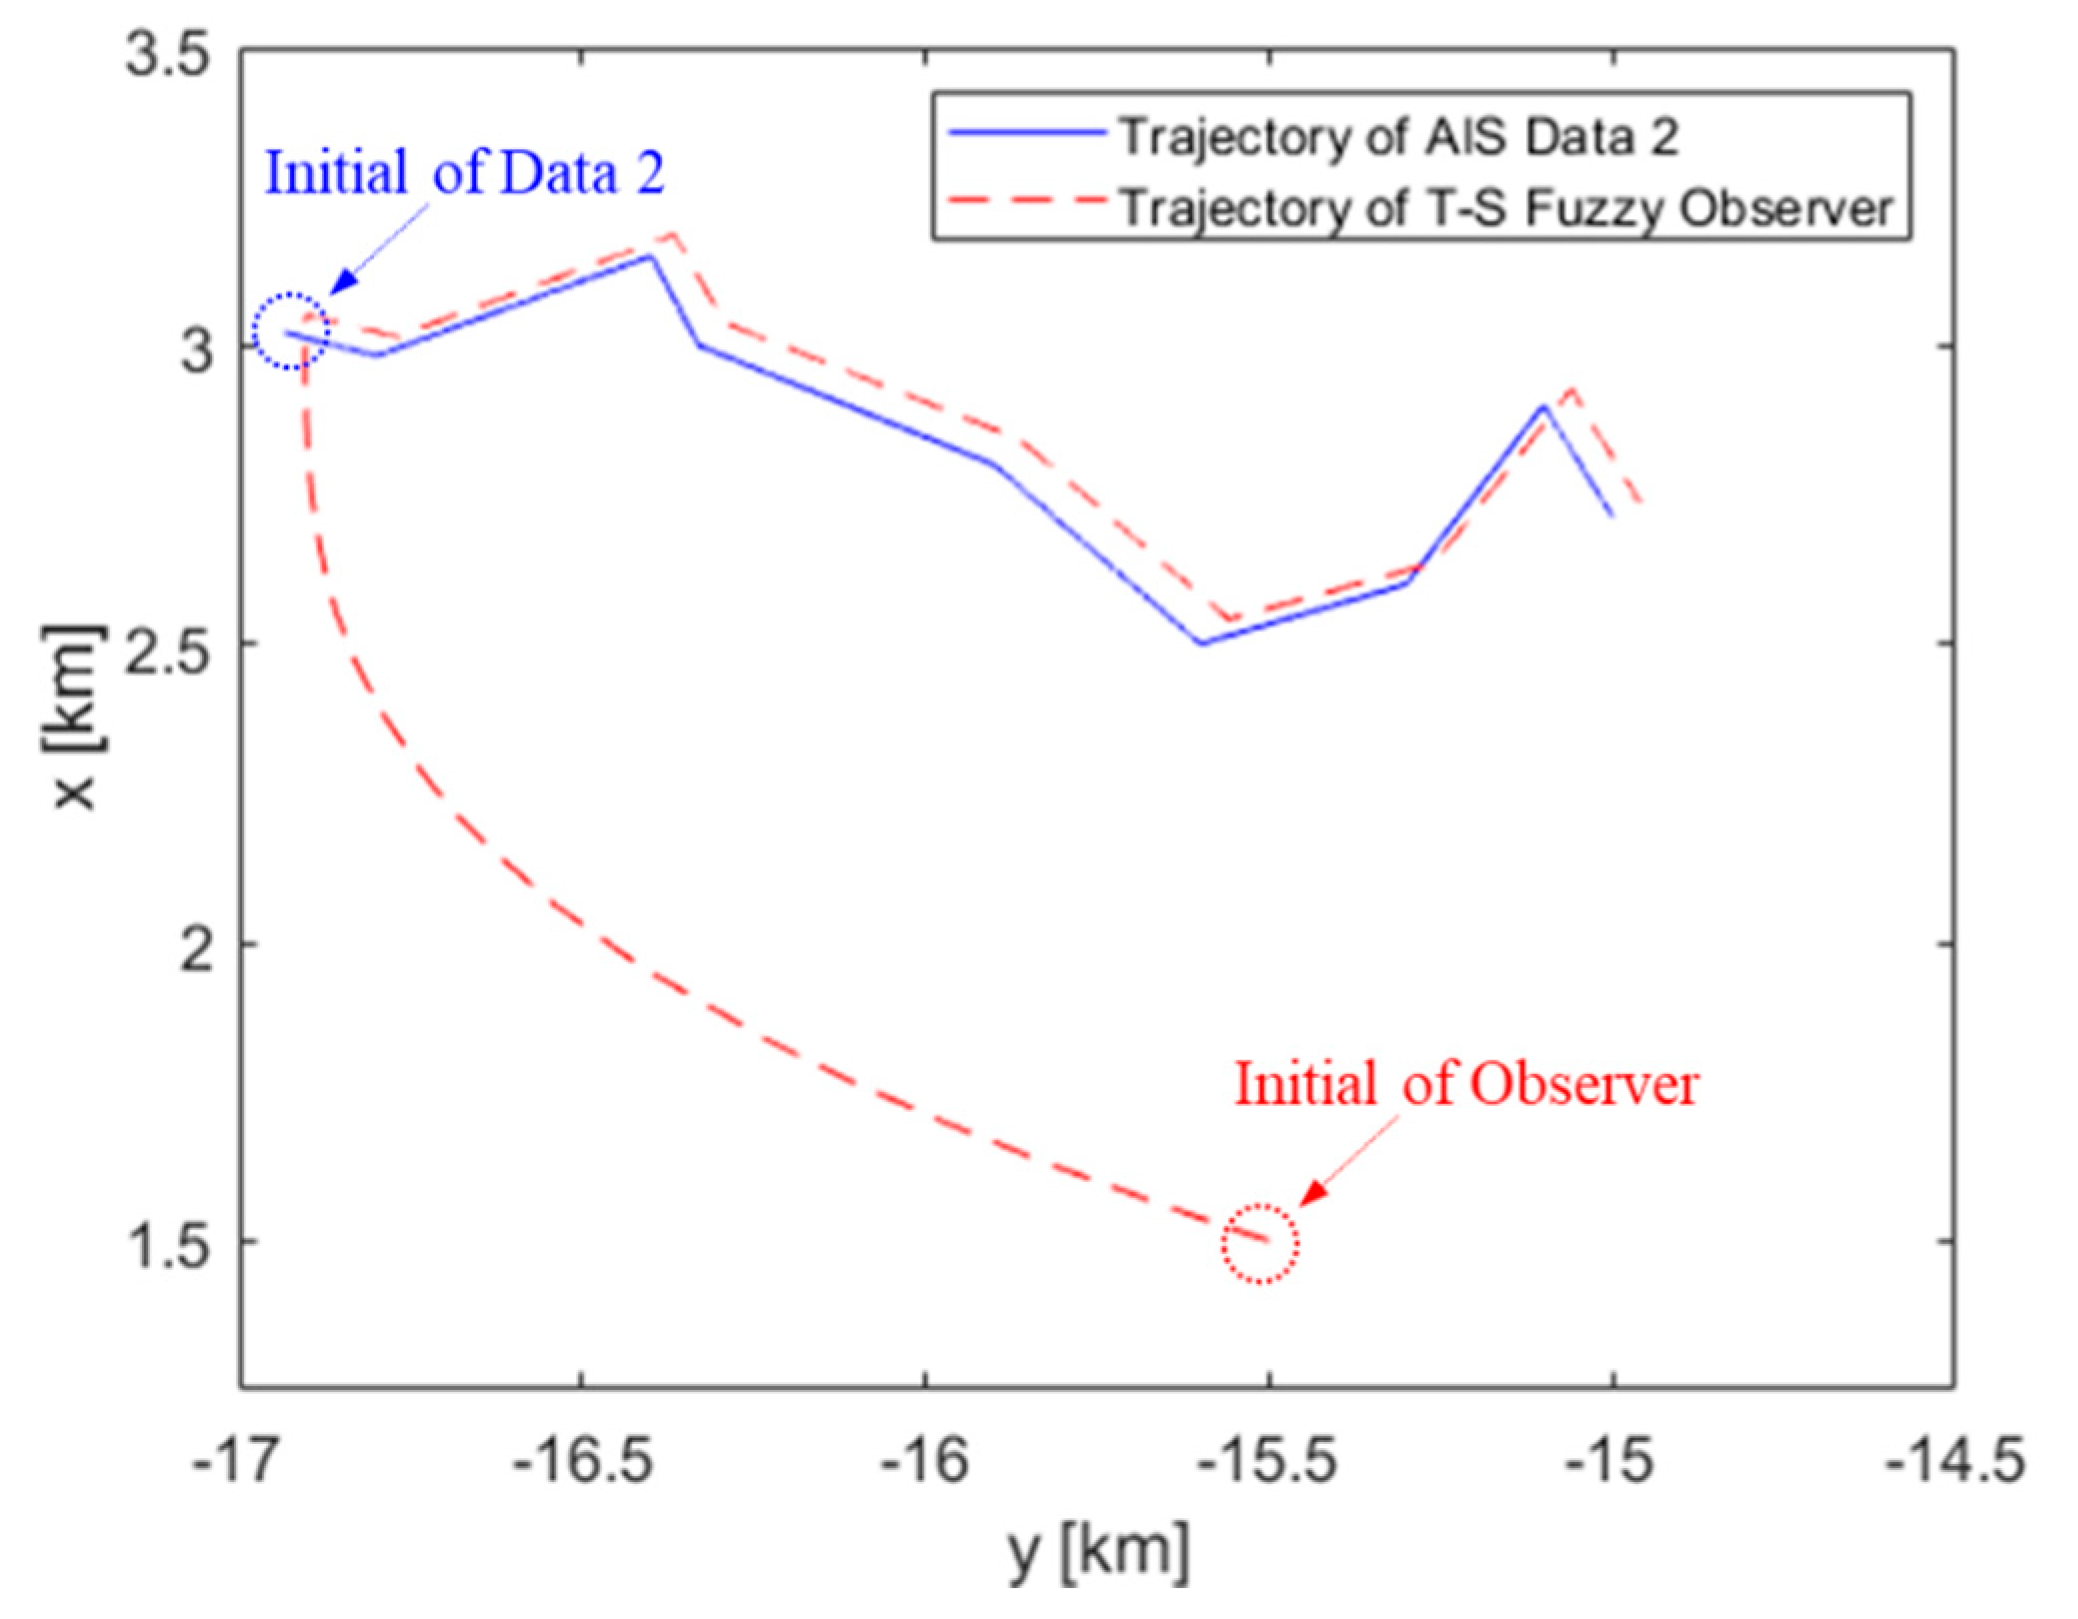
is able to estimate various AIS data reasonably. Although the AIS data 5 and 6 are much more different from the original AIS data, the observation results can also perform accurately. Thus, for estimating the ship’s trajectory based on AIS data, the applicability of the proposed T-S fuzzy observer design method is verified. Moreover, the feasibility and efficiency of the algorithm proposed in this paper are also demonstrated. To present the observations of AIS data 2 to AIS data 6 more clearly, the trajectories obtained from AIS data and the T-S fuzzy observer are shown in
Figure 16,
Figure 17,
Figure 18,
Figure 19 and
Figure 20, respectively.
In Case 1, the simulation results of the comparisons between the nonlinear observer [
26] and the proposed T-S fuzzy observer are presented. The proposed T-S fuzzy observer gain design algorithm provided a suitable process to adjust the observer gains for the T-S fuzzy observer (36) systematically. Extending the results of Case 1, the T-S fuzzy observer with the designed observer gains was applied to five different trajectories of AIS data, including the same and disparate starting points from the original data in Case 1. The simulation results also demonstrate the efficiency and applicability of the proposed T-S fuzzy observer design method.
There are some advantages that can be pointed out for the design method of this paper. Firstly, the proposed observer gain design algorithm can combine with other observer design methods. The application is not only limited to the T-S fuzzy observer. Because of the convenience and intuition of the proposed algorithm, it can easily be combined with other observer design methods. Secondly, the proposed T-S fuzzy observer design method can also be applied to different kinds of AIS data, even from foreign ports. It is beneficial because the algorithm’s constant value can be modified based on the objective AIS data. Moreover, with the T-S fuzzy modeling method, many efficient linear observer design methods can be applied to nonlinear systems of ship motion. Because of these advantages, feasibility and practicality are demonstrated for the proposed T-S fuzzy observer design method. With the simulation results, some conclusions and future works are given for the proposed T-S fuzzy observer design method in the next section.


