Article

Explicit-pH Coarse-Grained Molecular Dynamics Simulations Enable Insights into Restructuring of Intestinal Colloidal Aggregates with Permeation Enhancers

Department of Pharmacy and The Swedish Drug Delivery Center (SweDeliver), Uppsala University, Husargatan 3, 751 23 Uppsala, Sweden
*
Author to whom correspondence should be addressed.
Processes 2022, 10(1), 29; https://doi.org/10.3390/pr10010029
Submission received: 1 December 2021 / Revised: 15 December 2021 / Accepted: 22 December 2021 / Published: 24 December 2021
(This article belongs to the Special Issue Molecular Dynamics Modeling and Simulation)

Abstract

:
Permeation enhancers (PEs) can increase the bioavailability of drugs. The mechanisms of action of these PEs are complex, but, typically, when used for oral administration, they can transiently induce the alteration of trans- and paracellular pathways, including increased solubilization and membrane fluidity, or the opening of the tight junctions. To elucidate these mechanistic details, it is important to understand the aggregation behavior of not only the PEs themselves but also other molecules already present in the intestine. Aggregation processes depend critically on, among other factors, the charge state of ionizable chemical groups, which is affected by the pH of the system. In this study, we used explicit-pH coarse-grained molecular dynamics simulations to investigate the aggregation behavior and pH dependence of two commonly used PEs—caprate and SNAC—together with other components of fasted- and fed-state simulated intestinal fluids. We also present and validate a coarse-grained molecular topology for the bile salt taurocholate suitable for the Martini3 force-field. Our results indicate an increase in the number of free molecules as a function of the system pH and for each combination of FaSSIF/FeSSIF and PEs. In addition, there are differences between caprate and SNAC, which are rationalized based on their different molecular structures and critical micelle concentrations.

1. Introduction

Peptide drugs constitute an increasing part of the discovery portfolio in the pharmaceutical industry. They are required in the quest for treatment of many important diseases, including cancer, diabetes and irritable bowel syndrome [1]. This class of drugs has the potential to interact with targets containing shallow and/or extended binding pockets that are not usually accessible to small-molecular drugs. Such targets include intracellular protein–protein interactions, which are key signal pathways in many human diseases. From a patient perspective, oral administration is often the preferred route for the administration of medicines. Unfortunately, the large size and hydrophilicity of peptide molecules makes it difficult for them to cross the intestinal epithelium, resulting in unacceptably low permeability and, hence, oral bioavailability. One viable method to increase bioavailability is the co-release of transient “permeability enhancer” (PE) molecules concurrent with the peptides within the intestinal lumen [2]. These are primarily small medium-chain fatty acid (MCFA)-based molecules that work by transiently decreasing epithelial barrier resistance, either by interacting with the epithelial cell membrane (a transcellular mode of action) or by affecting paracellular pathways [3]. Examples of such MCFAs include sodium laurate (C12), sodium caprate (C10), sodium octanoate (C8) and the C8 derivative SNAC (sodium N-(8-[2-hydroxybenzo]amino caprylate) [2,4,5,6]. In addition to these MCFA-based permeation enhancers, a number of formulation approaches based on transient permeability enhancers have been designed, with some having reached clinical trials [4,7,8,9]. For example, a dosage form containing antisense olgonucleotides and caprate achieved an oral bioavailability of 9.5% in a trial with 15 male volunteers compared to the subcutaneous injection (SC) [10]. Assessment of oral octreotide (used to treat, e.g., acromegaly) with caprylate in a trial with monkeys and oral insulin with caprate in phase 2 human trials also showed that permeation enhancer technology can lead to bioavailability of 1–3% compared to a subcutaneous injection [9,11]. Using SNAC in a formulation together with the therapeutic peptide semaglutide resulted in oral bioavailability of 1.2% in preclinical dog studies [12]. Unfortunately, although a promising approach and also, in comparison to other more elaborate formulation strategies, quite simple and economical, most PE-based dosage forms have yet to progress into clinical trials and beyond.
The most important region for the drug absorption of orally administered medicines is the small intestine, due to its large surface area and the reasonably long transit time of 4–6 h through this compartment. A major reason for the failure of PE-based dosage forms, and, in general, the poor knowledge around drug performance and behavior in the intestine, is the lack of understanding of the dynamics of solubilizing lipoidal nanostructures (micelles, vesicles, oil droplets) present in the intestinal fluid. There is also a lack of knowledge around how these structures are different in the fasted and fed state, or in response to the oral intake of lipid-based medications. As a response to dilution upon water intake, digestion and/or absorption, restructuring of these solubilizing nanoaggregates will occur. Further adding to the complications is the secretion of bile, which also forms self-aggregated colloidal structures that can then interact and merge with other types of aggregates. In the past, the absorption of different drug molecules administered with different PE molecules in a rat model was found to be lower in the presence of fed-state-simulated intestinal fluid (FeSSIF) compared to the fasted state (FaSSIF) [13]. Similar results were also observed for the permeation of FD4 through Caco-2 cells [14]. In FeSSIF, the presence of phospholipids and bile salts is almost 5–6 times higher compared to FaSSIF [15]. It was suggested that a higher amount of phospholipids and bile components can reduce the number of free PE molecules, which can in turn reduce the absorption of drug molecules [13]. In addition, upon transition from the stomach and into the small intestine, the peptide API, as well as the permeation enhancer molecules, will experience environments that also differ wildly in pH, which will have additional consequences for the aggregation behavior.
There exist a number of experimental techniques that have been used to study interactions between surfactants and, e.g., cell membranes [16,17,18,19]. However, obtaining a detailed understanding at the molecular level of such interactions is difficult at best. Nevertheless, such an understanding is important, as exemplified by the case of SNAC and o-SNAC (an ortho isomer of SNAC) presented by Buckley et al. [12]. Despite a difference in only the position of one oxygen atom between these two structures, o-SNAC was much less effective at eliciting increased bioavailability for semaglutide. Recent years have seen great advances in the quantitative accuracy with which molecular simulation (MD) can predict experimental observables, and the tractability of the necessary calculations for systems of pharmaceutical interest, in principle offering a complement or alternative to in vitro experiments. In a standard vanilla MD simulation, however, the protonation states of ionizable groups in the molecules in the simulation box would need to be set at the beginning of the simulation. For systems and molecules that contain ionizable groups with a pKa value close to that of the pH that is sought, this decision is often not straight-forward. Examples of this include the presence of histidine residues in protein and peptide molecules. Another situation where this presents challenges is in the study of processes that depend critically on how aggregation is influenced and affected at different pH levels. Recognizing these limitations, several efforts have been made to enable pH to be entered as an explicit variable in the simulations, allowing the protonation state of an ionizable group to change during the simulation according to the local electrostatic environment and the actual pH of the solution. Examples include the empirical-valence-bond approach [20,21] as well as stochastic Monte Carlo approaches [22,23]. Another approach that has seen some developments is based on modeling the change in protonation state through a so-called λ-particle, or virtual particle [24,25]. In this approach, the pKa values of the ionizable groups essentially are obtained by analyzing the distribution of the value of λ (between 0 and 1, corresponding to the two extremes). Grünewald et al. [26] recently developed a simulation model that allows for titratable beads together with the Martini3 coarse-grained force-field [27]. In this model, in addition to the standard interaction centers, or beads, specific titratable beads have the ability to accept and donate “proton” beads, allowing for “protons” to be exchanged between a molecule and the surrounding solvent. Being coarse-grained, the Martini force-field enables simulations to be performed for larger systems and longer time-scales compared to corresponding atomistic simulations. This is very valuable in the context of the exploration of rearrangements occurring both over time and between the different molecular constituents that are found in the small intestine, since it enables, e.g., solubilization and permeability to be studied at the actual physiological concentration of bile salts and lipids as well as permeation enhancers. In this manuscript, we therefore present first a parameterized and validated topology for the bile salt taurocholate, which is compatible with the Grünewald et al. constant pH model. We then go on to use this model, together with two different permeation enhancers, sodium caprate and SNAC, as well as other components of both fasted- and fed-state simulated intestinal fluids (FaSSIF and FeSSIF), to explicitly study how changes in pH are manifested for aggregation phenomena.

2. Materials and Methods

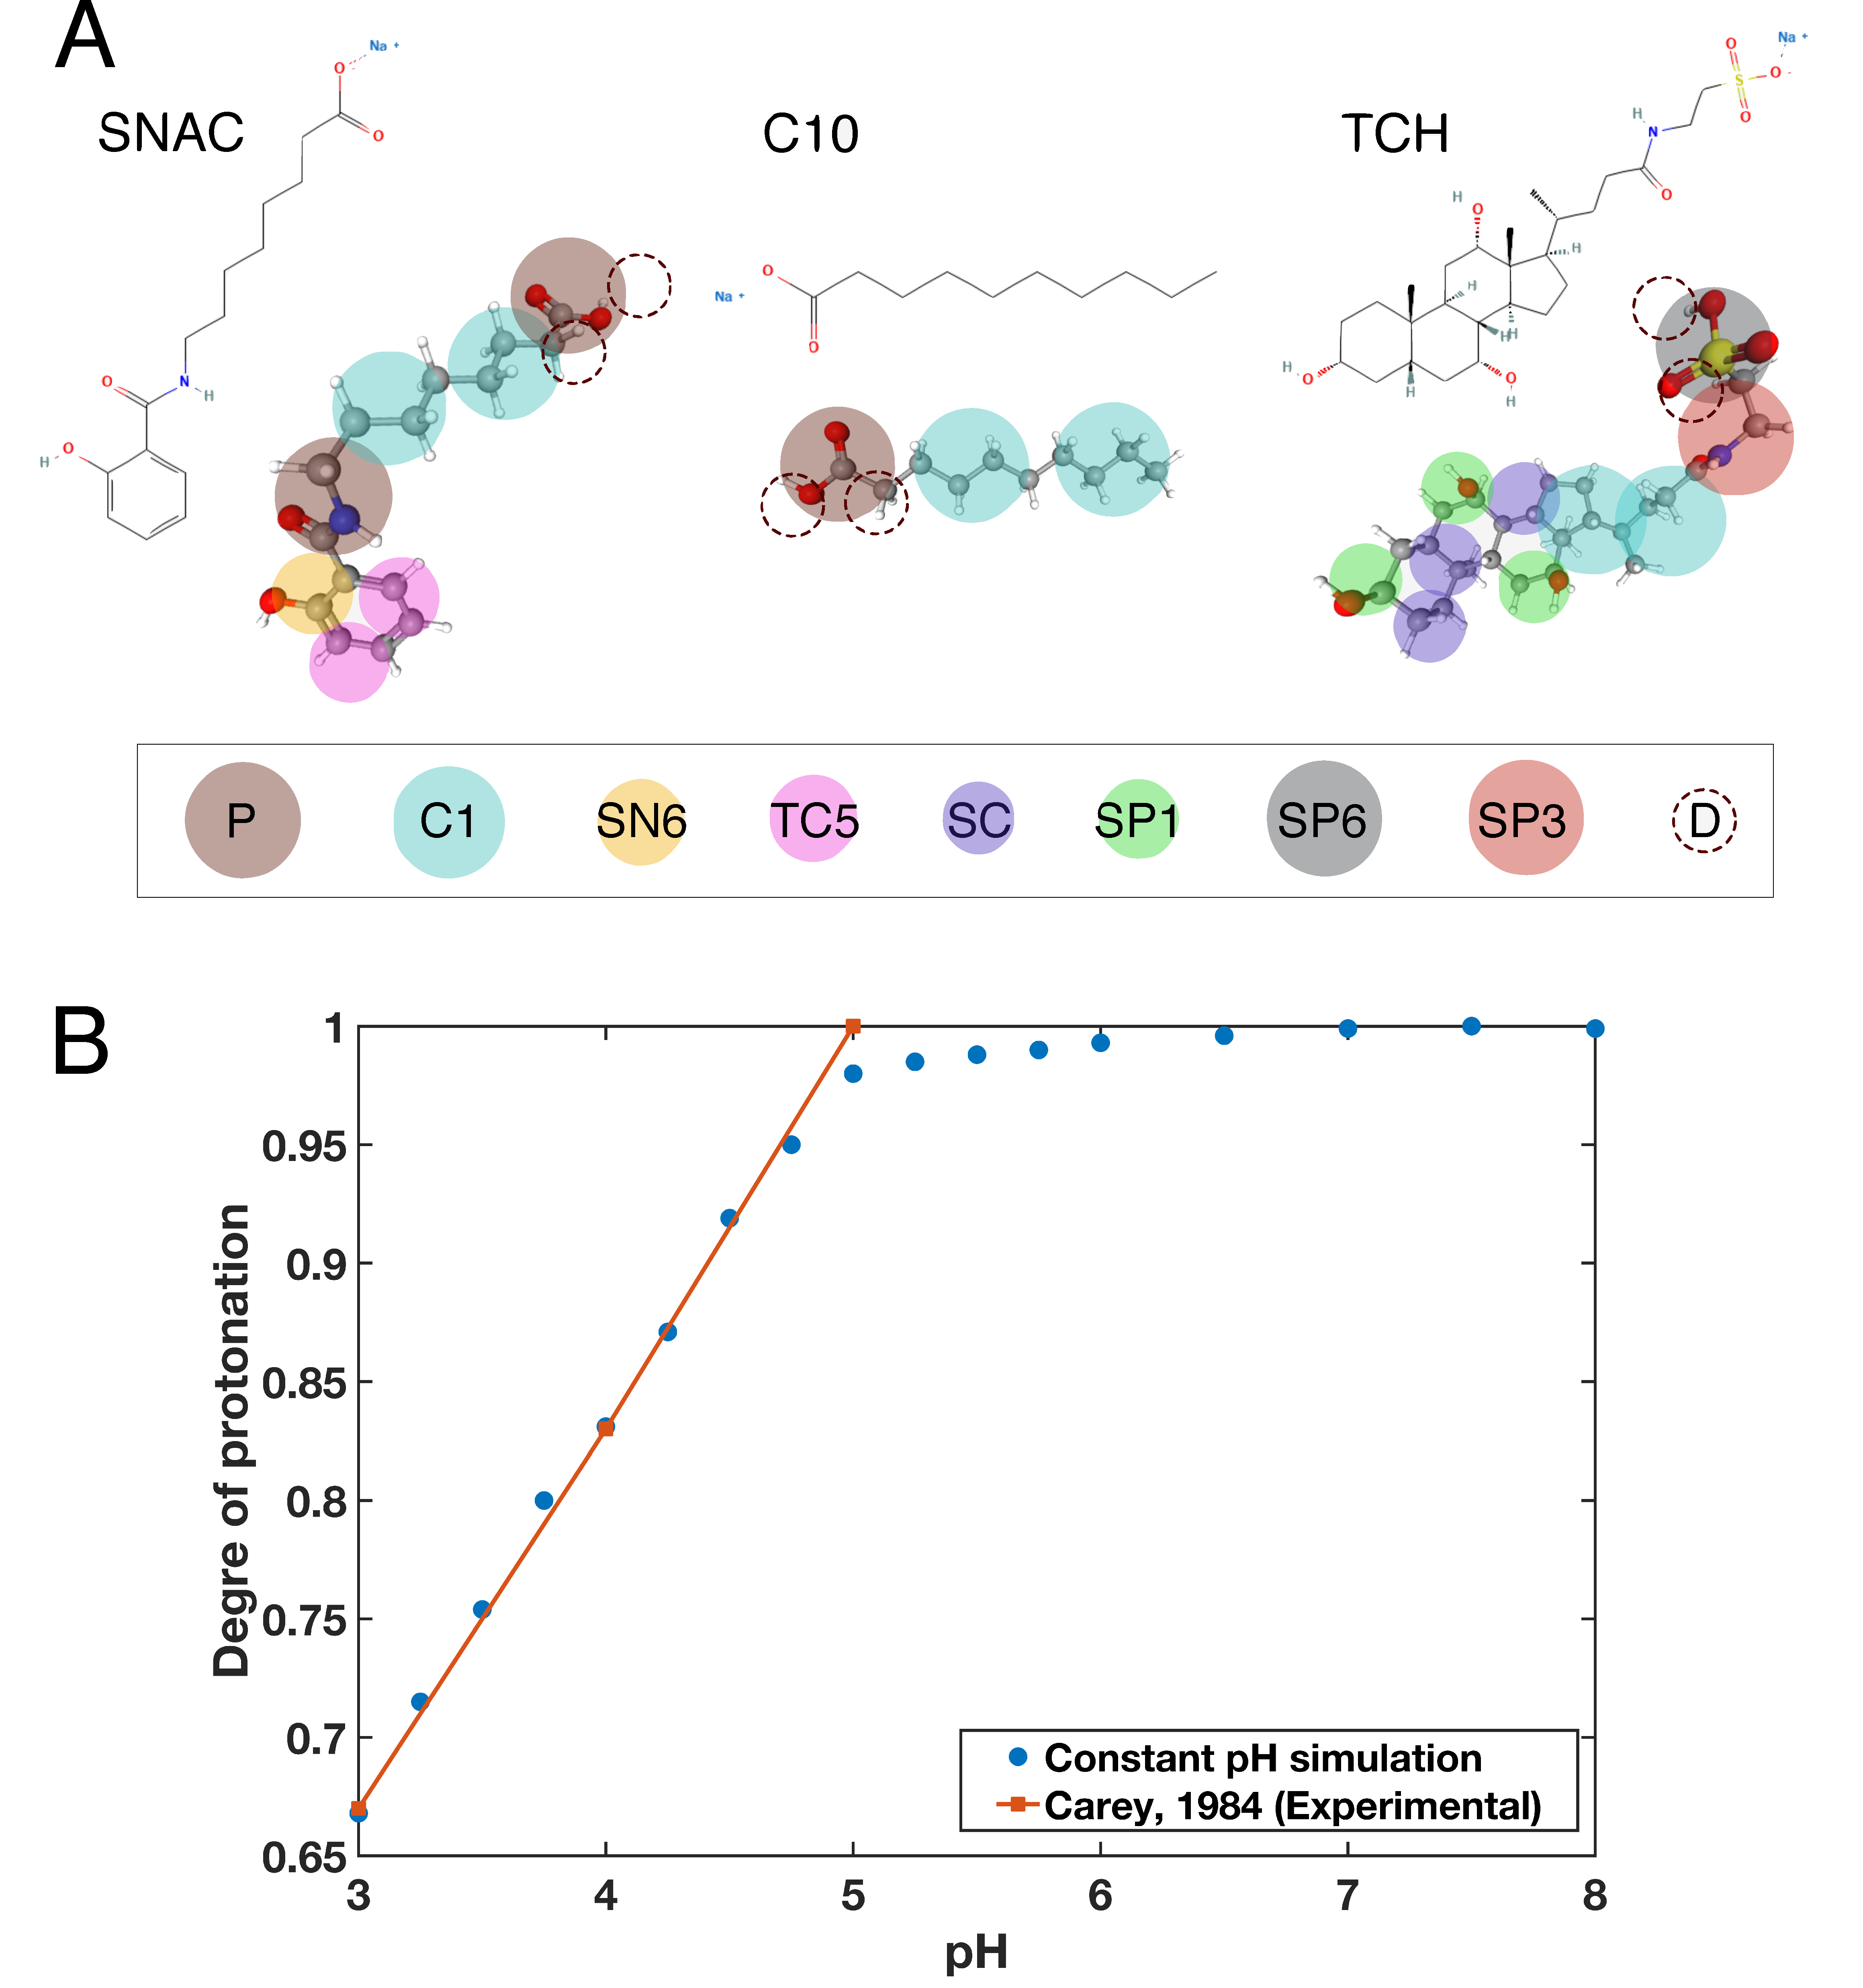
2.1. Parameterization of Taurocholate

The parameterization of taurocholate was done according to the recommended workflow on the Martini force-field website (cgmartini.nl). Starting from existing analogous molecules (deoxycholate in Martini v2, available from cgmartini.nl, as well as the bead assignment for obeticholic acid by de Souza et al. [27]), an all-atom to coarse-grained mapping between the atomistic molecular structure of taurocholate and Martini3 bead types was defined, as shown in Figure 1A. Following the bead assignment, the bonds, angles and dihedrals that did not already exist for the analogous molecules were optimized in an iterative fashion to match as closely as possible corresponding distributions from a simulation of a single atomistic taurocholate molecule. For this purpose, a single atomistic taurocholate molecule [28] was solvated in a cubic box with 1670 TIP3p water molecules. Following 5000 steps of steepest descent energy minimization and 500 ps temperature and pressure equilibration, a production run was carried out for 1 ns with Gromacs version 2020 using the Verlet cutoff scheme and a short-range electrostatic and van der Waal’s cutoff of 1.2 nm. From this simulation, a “CG-mapped” trajectory was obtained, which was used to find optimized values for all missing force constants and equilibrium lengths. This topology, along with all other input coordinate systems, is available upon request from the authors. A matching coarse-grained system was also constructed, with a single taurocholate molecule solvated in a cubic box with 1298 Martini3 water beads. Again, steepest descent energy minimization was done for 5000 steps, followed by 500 ps temperature and pressure equilibration, and then a series of 75 ns production runs, with values for coarse-grained bond, angle and dihedral force constants and equilibrium lengths being updated in an iterative fashion. After 6 iterations, a very good overlap was obtained between the distributions of the bond, angle and dihedral values in the atomistic and coarse-grained simulations (Figure S1).
In order to verify the accuracy of this CG model, the solvation free energy of the CG-taurocholate molecules was then calculated in both water and 1-octanol using thermodynamic integration (TI), and it was used to determine the partition coefficient, log P, of taurocholate. Two systems were created, with 1281 water beads and 428 1-octanol molecules, respectively. To obtain the solvation free energy, a series of calculations was performed in each case with the TI-coupling parameter lambda going from 0 to 1 in steps of 0.1. The partition coefficient was then calculated using Equation (1):
l o g P o c t / w = Δ G O Δ G W 2.303 R T  
where Δ G O and Δ G W correspond to the solvation free energies in 1-octanol and water, respectively. The logP value that we obtained in this way was −0.66, close to the experimental value of −0.5 (for the ionized form of taurocholate) [30].
To further verify the accuracy of the parameterization, we also computed the solvent accessible surface area of taurocholate for both the atomistic and the coarse-grained topologies, using the gromacs gmx sasa module (Figure S2).

2.2. Titratable Martini Model

The explicit pH simulations were performed using the titratable Martini model developed by Grünewald et al. [26], which is an extension of the recently published Martini 3.0 model [27]. To be able to explicitly take pH into account, in this version of the Martini model, a new class of beads, titratable beads, have been introduced. The key feature of these titratable beads is their ability to reversibly bind to a positively charged proton particle/bead [26]. The detailed methodology of this model and the parameterization procedure of the various titratable beads, as well as Martini water beads, within this framework was described in the article by Grünewald et al. [26]. One of the major advantages of this approach to perform constant pH simulation is that the titratable beads are parameterized and their interaction parameters based on reproducing appropriate titration curves. Therefore, in this approach, parameterization of molecules with various pKa values is possible and relatively easily performed, without changing the whole force-fields. The method was shown to be capable of reproducing titration curves, pH-dependent free energies of transfer and membrane interactions as a function of pH for a number of acids and bases [26].

2.3. Parameterization of the Permeation Enhancers and Taurocholate Titratable Beads

Grünewald et al. parameterized a number of titratable beads for different acids and bases with pKa ranging from 4.8 to 10.8 [26]. In the present study, two different permeation enhancer molecules were studied—caprate and the caprylate derivative sodium N-(8-[2-hydroxybenzo]amino) caprylate (Salcaprozate sodium/SNAC). The pKA of both caprate and SNAC molecules is close to 4.8 in water for single molecules. Therefore, the titratable bead (P2_4.8) available from Grünewald et al.’s study was utilized for both caprate and SNAC. Other parameterization work of caprate and SNAC molecules to adapt them to Martini3 was based on previous studies using the Martini 2.2 model [16], but with modifications done for SNAC according to the new Martini 3.0 model [27]. Detailed CG representations of caprate and SNAC molecules are shown in Figure 1A. The fasted (FaSSIF) and fed (FeSSIF)-state simulation intestinal fluids used in our study contained taurocholate and soy lecithin, represented by 1,2-dilinoleoyl-sn-glycero-3-phosphatidylcholine (DLiPC). The CG topologies of DLiPC for Martini 3.0 are available at the Martini website [27,31]. Taurocholate has a pKa of around 2.0 [29] and there was no titratable bead available that could replicate the titration curve of taurocholate in Grünewald et al.’s study. Therefore, a new titratable bead was parameterized for this purpose. The resulting simulated titration curve for taurocholate was in good agreement with the experimental results obtained from Carey (1984) [29], as shown in Figure 1B. The detailed interaction parameters for the taurocholate titratable beads, which are defined as SP6_2.0, are provided in Tables S1–S3 from Supplementary Material.

2.4. Simulation Setups

We performed simulations with different combinations of biorelevant media and PEs at various concentrations as well as pH conditions, as described in Table 1. We studied two different PE concentrations—20 mM and 100 mM. The concentration value of 100 mM selected in this study was based on the PE concentration that is typically used in formulations in preclinical animal model studies [32]. However, although it is possible to reach such a high local concentration in the intestine, the concentration might also become lower due to dilution. To better reflect such local dilutions in vivo, a PE concentration of 20 mM was also used in this study. We chose to investigate three different pH levels (3, 5 and 7). The average pH value in the intestine is in the range of 5–7 [33]. However, human intestinal fluid (HIF) components from the duodenum of 20 healthy volunteers were characterized in the fasted and fed states by Riethorst et al., and it was observed that pH values were highly variable in also the fasted state (ranging from 3.4 to 8.3) [34]. Choices for the pH values were also related to the pKa values of the permeation enhancer molecules. Since the pKa of the PEs investigated in this study was around 4.5, their aggregation behavior was not expected to change significantly above a pH value of 7 [35]. In total, 24 systems were simulated in the study. A detailed list of all the simulated systems and the number of all the molecules inserted into the simulation box is presented in Table S4 from Supplementary Material. All simulations were carried out with the GROMACS software (version 2018, 2019 and 2020.4) using a time step of 8–10 fs [36]. The temperature was set at 310 K with a v-rescale thermostat [37] and the pressure was maintained at 1 bar using isotropic Parinello–Rahman pressure coupling [38] (with a time constant of 12.0 ps and compressibility of 4.5 × 10⁻⁵ bar−1). For long-range electrostatic potential, Particle Mesh Ewald (PME) summation was applied with a dielectric constant of 6 according to the suggestion for the titratable Martini model [26]. A cubic box with side lengths of 20 nm was used for all systems with periodic boundary conditions applied in all directions. The molecules were initially randomly distributed in the simulation box. Energy minimization was then performed using the steepest descent algorithm for 10,000 steps, followed by 4 short (50,000 steps) equilibration runs while increasing the time step from 1 to 10 fs. Then, for each system, the final production run was performed for 1 µs with a 10 fs time step for most systems. An 8 fs time step was needed for the simulations at pH = 8 to avoid instabilities during the simulations.

2.5. Analysis

The simulated trajectories were analyzed to determine the number of aggregates and free taurocholate and PE monomers, using an in-house python code. Here, two molecules were considered to be in the same aggregate if any of their constituent beads were within a cutoff distance of 0.5 nm from each other. An aggregate was said to be formed when it contained a minimum of 5 molecules. This cutoff was determined from the aggregate size distribution of medium-chain fatty acids, and has proven reasonable in past studies of aggregation behavior or medium-chain fatty acids [39], striking a balance between actual aggregation and random contacts between pairs of molecules as a consequence of diffusion [39].
As a characteristic for the description of the shape of the colloids, we chose eccentricity. It was calculated as
e = 1 I m i n I a v g
where I m i n and I a v g are the minimal and average values of the principal moment of inertia components I x , I y and I z . The components were calculated with the “gmx gyrate” tool of the GROMACS software package, separately for each aggregate fulfilling the above aggregation criteria (n > 5). The lower the value of e , the closer the shape of the aggregate to a perfect sphere, and vice versa.
Density plots of molecule disposition relative to the aggregate core were calculated with a python script based on the Pytim package [40]. The number of different molecule-specific beads as a function of radial distance was calculated every 0.5 nm, from 0 up to 7 nm from the aggregate core. Percentages of beads at specific distances were then calculated by dividing the number of beads for each specific molecule type at one distance with the total number of beads in all molecules at the same distance.

3. Results and Discussion

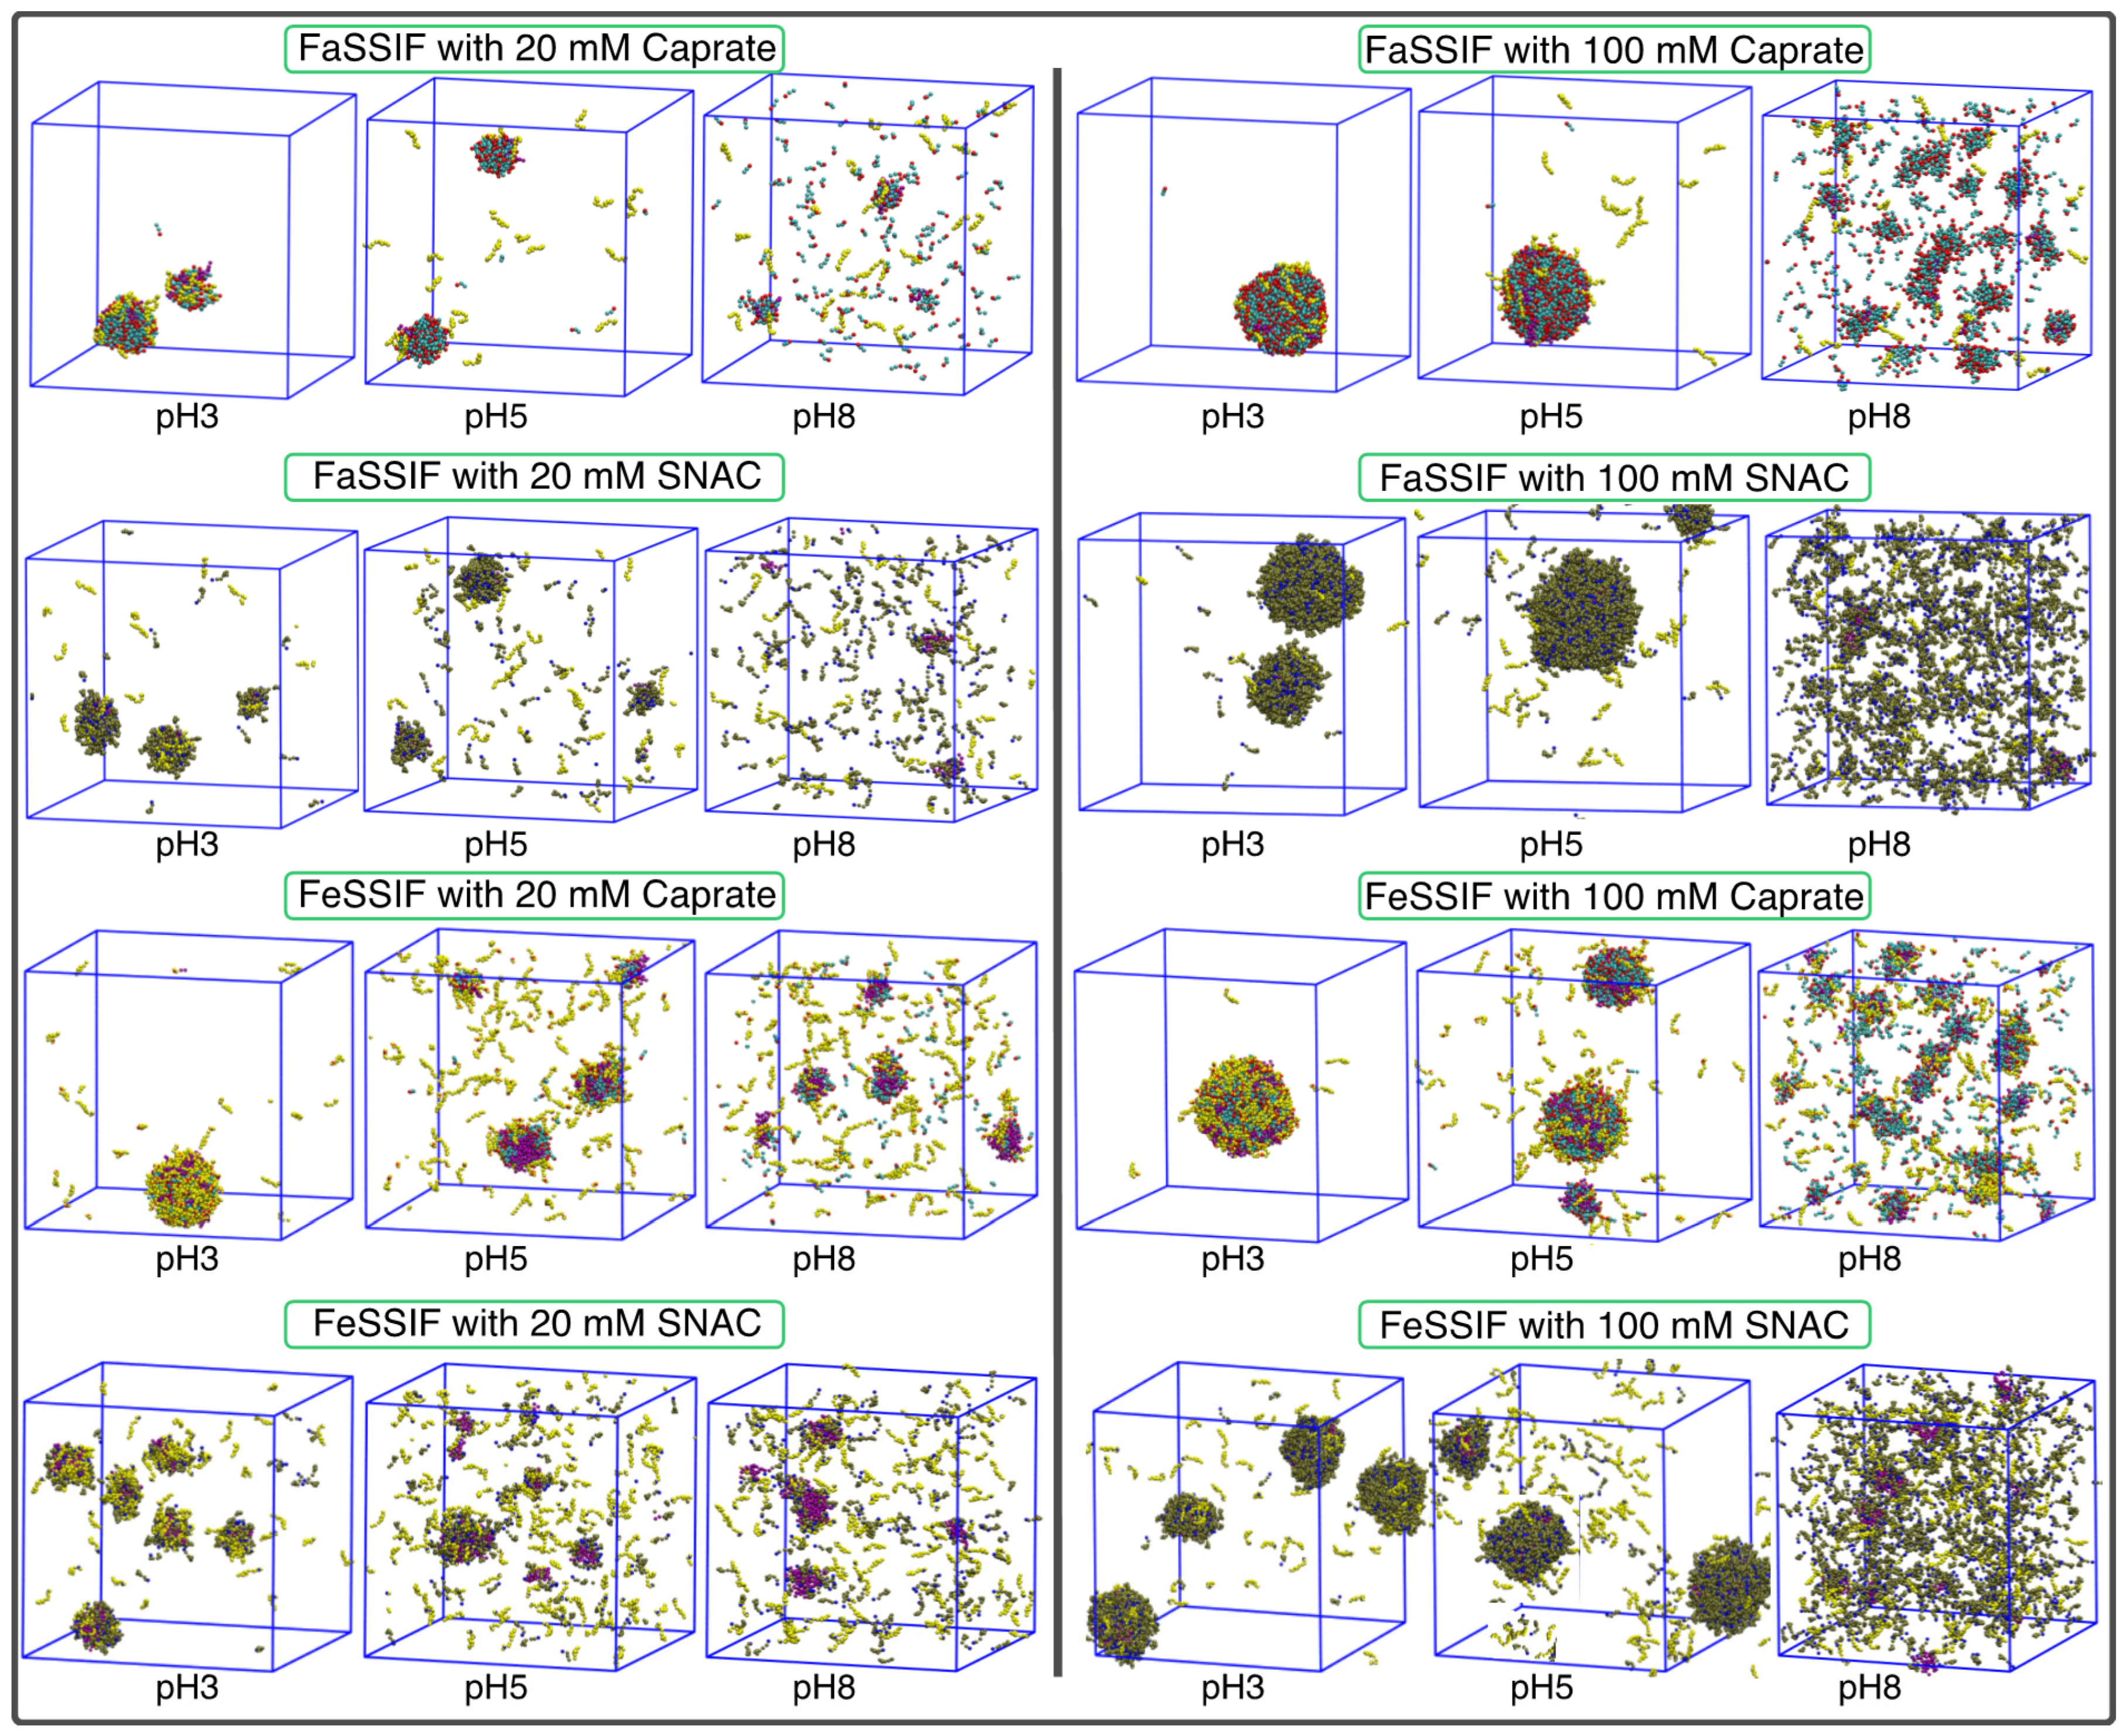
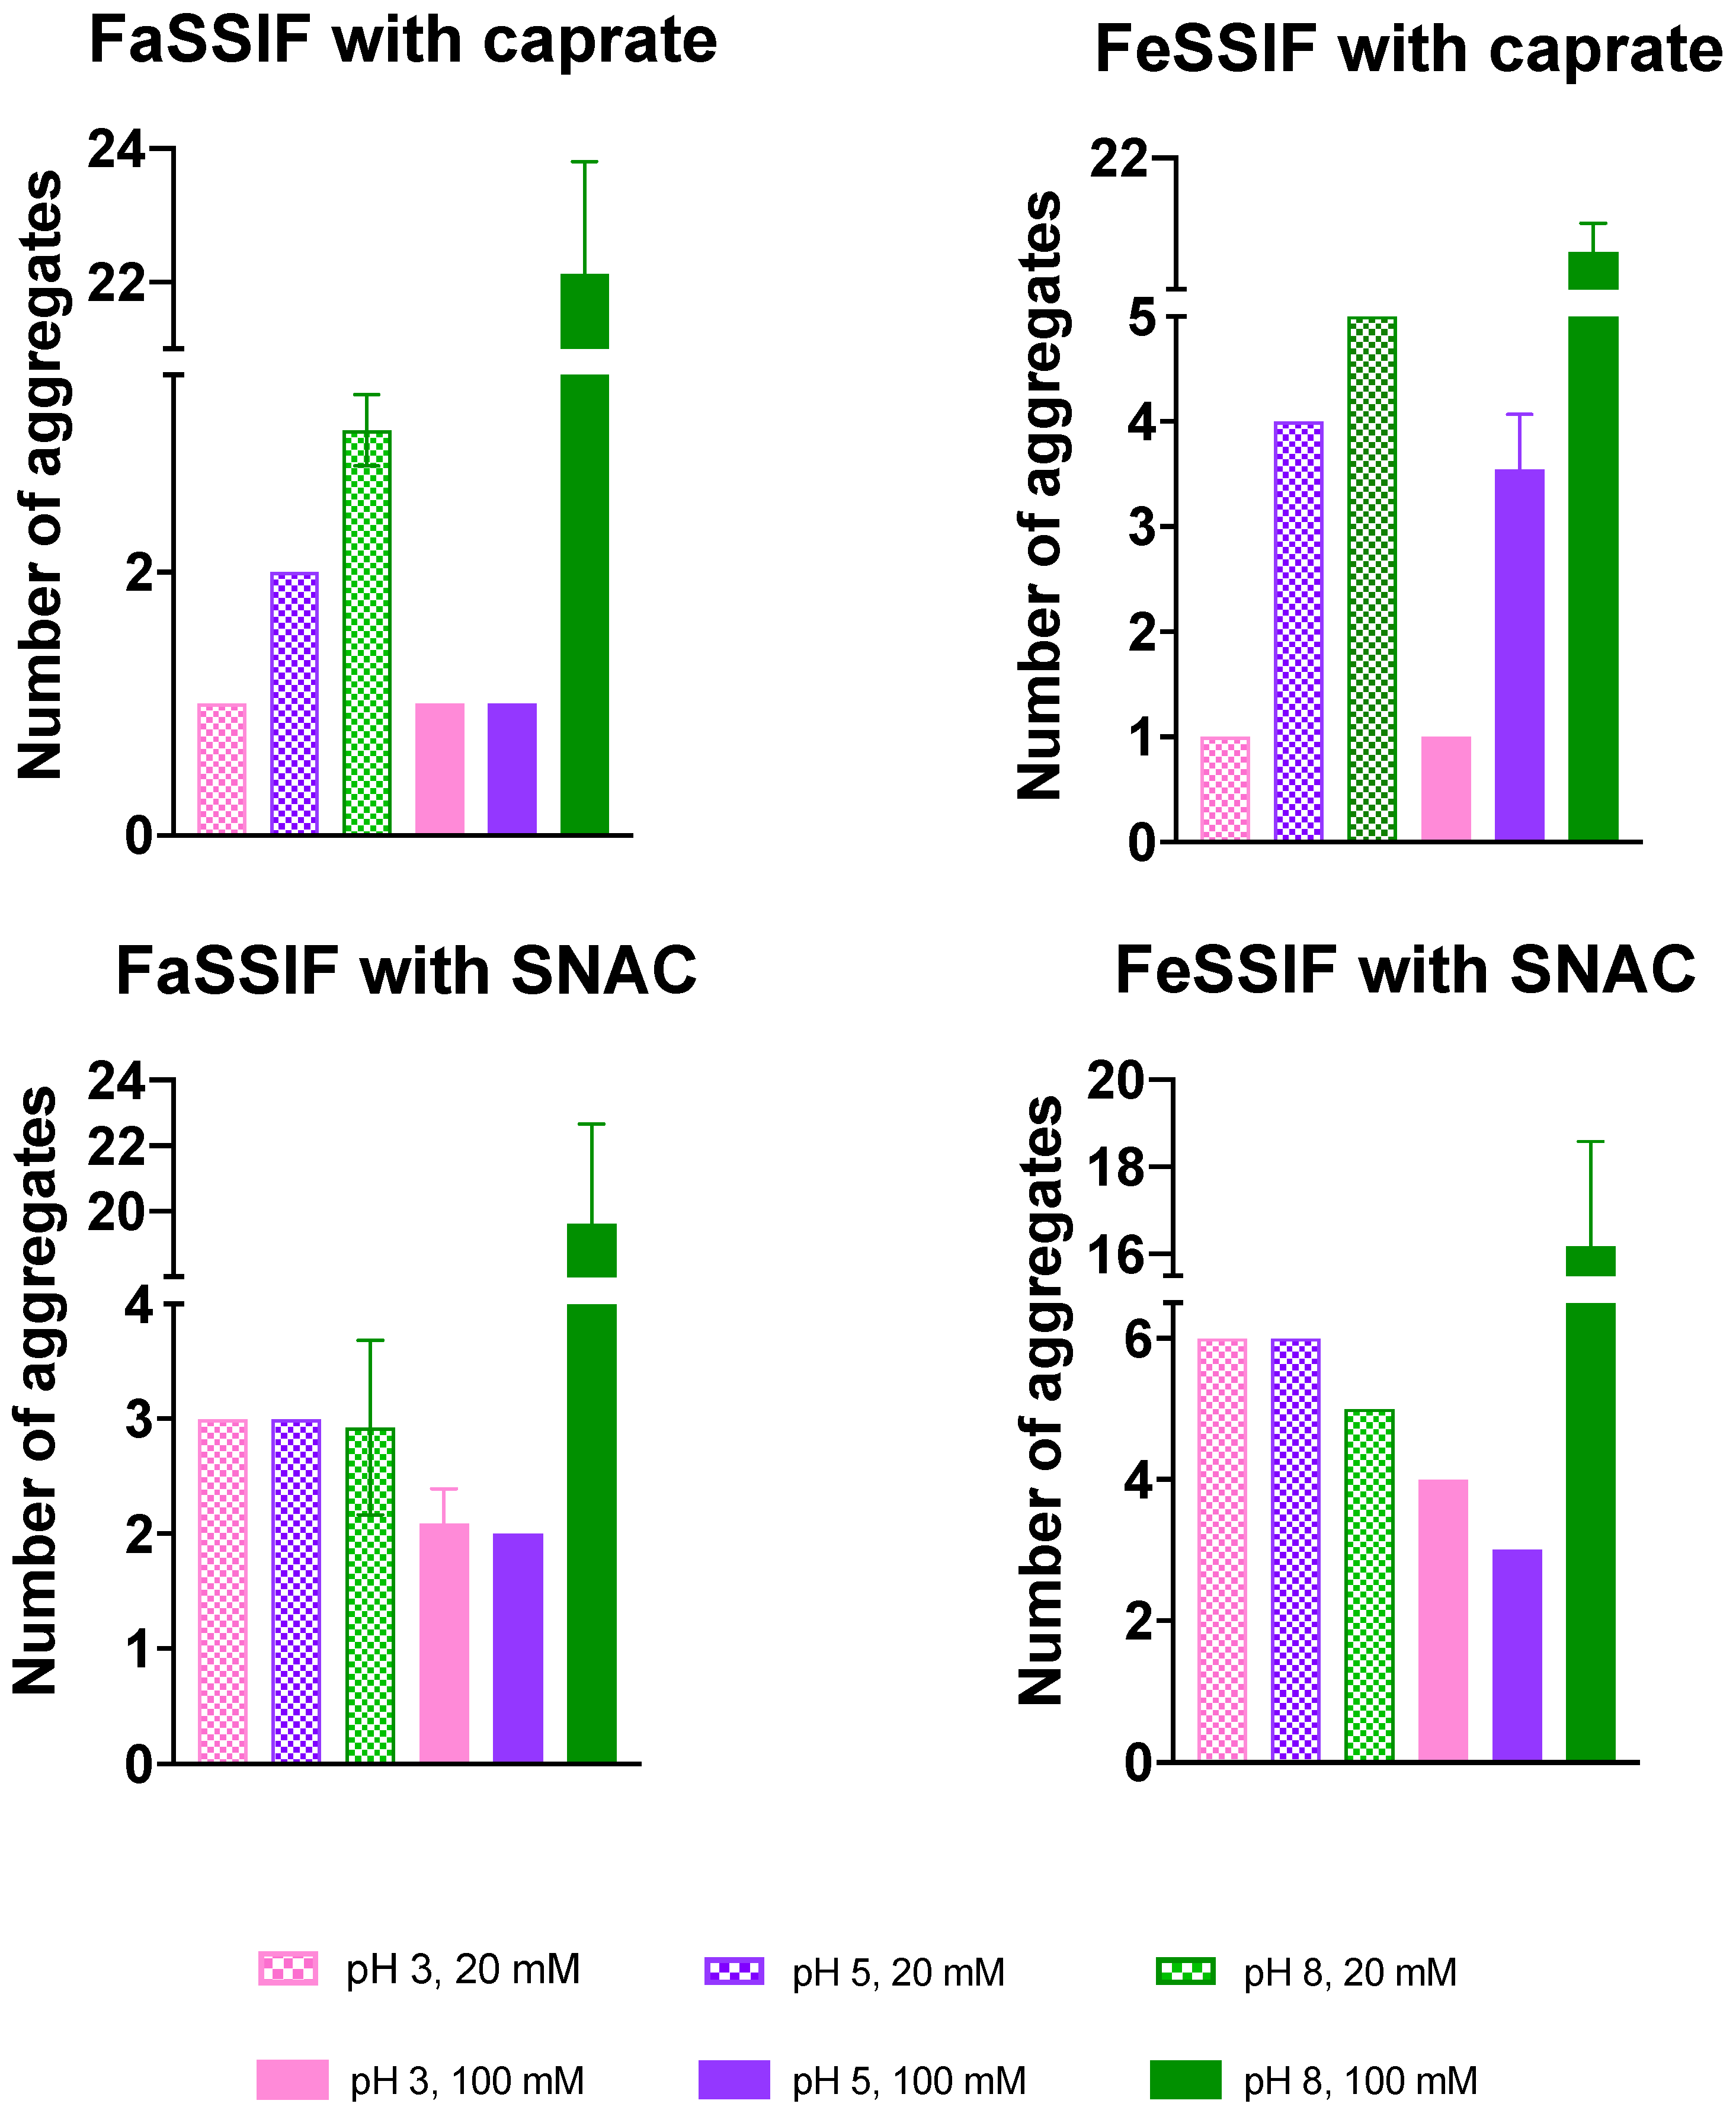
3.1. pH-Dependent Aggregation Dynamics

From a pharmaceutical as well as a clinical point of view, the ability of PEs to increase in bioavailability will depend, to a large degree, upon their aggregation propensity, with the fraction of free vs. aggregated molecules changing the relative effectiveness of the PEs. The formation of different kinds of colloidal structures will also lead to changes in the amount of the active pharmaceutical ingredient (the drug) that is available for immediate absorption. In our simulations, each system containing either FaSSIF or FeSSIF in the presence of permeation enhancers (PEs) at different concentration levels exhibited the formation of a number of mixed aggregates with various sizes and shapes. Figure 2 shows snapshots at 1 µs for each simulated system. From these snapshots, an increase in the number of free molecules as a function of the system pH was clearly observed for each combination of FaSSIF/FeSSIF and PE, consistent with an increasing fraction of deprotonated molecules. For each pH (3, 5 or 8), higher numbers of free molecules were observed as the concentration of PE increased from 20 to 100 mM. Moreover, the systems with FaSSIF showed relatively higher numbers of free molecules compared to those with FeSSIF. A comparison between two different PEs, caprate (C10) and SNAC, indicated that, at the same concentration and pH, there was a larger fraction of SNAC molecules present as free molecules compared to the systems of caprate.
We further quantified the number of free molecules for each system, including the number of free PE monomers, as presented in Figure 3. For the systems with both caprate and SNAC, at low pH values (both pH 3 and 5), we observed similar numbers of free PE molecules irrespective of their increase in concentration from 20 to 100 mM. For caprate, this was mainly due to micellization. For example, a previous CG-MD study showed that the critical micelle aggregation (CMC) of caprate near its pKa is approximately 15 mM [39]. In addition, the pKa of caprate will increase when the molecules are incorporated into micelles to approximately 7 [35]. Both pH 3 and 5 are below the relevant pKa value and the concentrations (20 and 100 mM) used in the study were higher than the CMC value. According to the definition of CMC, the concentrations added to a system above the CMC typically become incorporated into the micelle fraction of the system. Therefore, no significant differences were observed for caprate in the systems with lower pH values. For SNAC, the CMC is approximately 56 mM at pH 8 [41]. Therefore, we also expected a lower CMC value for SNAC at lower pH values (pH 3 and 5). At pH 8, approximately 2–3 times more free caprate molecules were observed as the caprate concentration increased from 20 to 100 mM, potentially indicating a non-equilibrium state for the simulation even after 1 microsecond. The systems with FeSSIF showed a relatively lower number of free caprate molecules compared to the FaSSIF systems at pH 8. This was mainly because FeSSIF contains more lipid molecules, which allows the formation of relatively larger aggregates. For SNAC, the increase in the number of free SNAC molecules was approximately 4–5 times higher as the SNAC concentrations increased from 20 to 100 mM. Moreover, approximately three times more SNAC molecules were available in the free form compared to caprate molecules for systems with 100 mM of PEs and pH 8. This correlates well with their CMC values as SNAC has higher CMC values compared to caprate.
We then similarly calculated the number of free taurocholate molecules in each system and present them in Figure 4. Significantly higher numbers of free taurocholate molecules (approximately 4–5 times) were observed for the systems with FeSSIF compared to those with FaSSIF. Note that the concentration of taurocholate in FaSSIF and FeSSIF is 0.75 and 3.75 mM, respectively, which would contribute to explaining this difference. The number of free taurocholate molecules was lower in the presence of caprate compared to SNAC, which indicates that caprate has a better ability to solubilize taurocholate molecules into mixed micelles compared to SNAC molecules. Consistent with a relatively non-specific CMC value for taurocholate [42], no clear trend was observed in the availability of the free taurocholate molecules at a specific pH with the increase in PE concentration. However, simulations at pH 3 (which is closest to the taurocholate pKa of around 2) exhibited the lowest number of free taurocholate molecules for each combination of FaSSIF/FeSSIF and PE. At pH 5 and 8, no significant difference was observed for the combination of FaSSIF/FeSSIF with SNAC. On the other hand, in the presence of caprate, as the pH increased from 5 to 8, approximately 1.5–2 times more taurocholate molecules were observed to be available in the free form in the systems with both FaSSIF and FeSSIF.
Similar to the number of free molecules, we also calculated the number of aggregates or mixed micelles formed during the simulation. The numbers of aggregates averaged over the last 200 ns of the simulated systems are presented in Figure 5. In general, we observed an increased number of aggregates as the pH value increased. At low pH 3, only one large aggregate was observed to be formed in the presence of both 20 and 100 mM of caprate in both systems with FaSSIF and FeSSIF. In comparison to caprate, SNAC formed a higher number of aggregates at lower pH values (pH 3 and 5).
Overall, our simulation results here suggest that various mixed micelles form during the simulation in combination with the components of FaSSIF, FeSSIF and different PEs. The pH of the system can significantly impact the overall aggregation dynamics—specifically, the availability of the free monomers in the system. However, the impact of pH will vary depending on the pKa and CMC of the PEs added in the system. Although both the SNAC and caprate molecules studied here have similar pKa values, SNAC has a much higher CMC value compared to caprate, and the number of free SNAC monomers available in different systems is higher compared to that of the caprate monomers. The availability of the free taurocholate monomers was mainly impacted due to the variation in the presence of biorelevant media. The pH of the system—more specifically, the lowest pH used in our simulation—also reduced the availability of free taurocholate compared to the higher pH values (pH 5 and 8). The available numbers of free taurocholate monomers were also higher in the presence of SNAC compared to caprate.

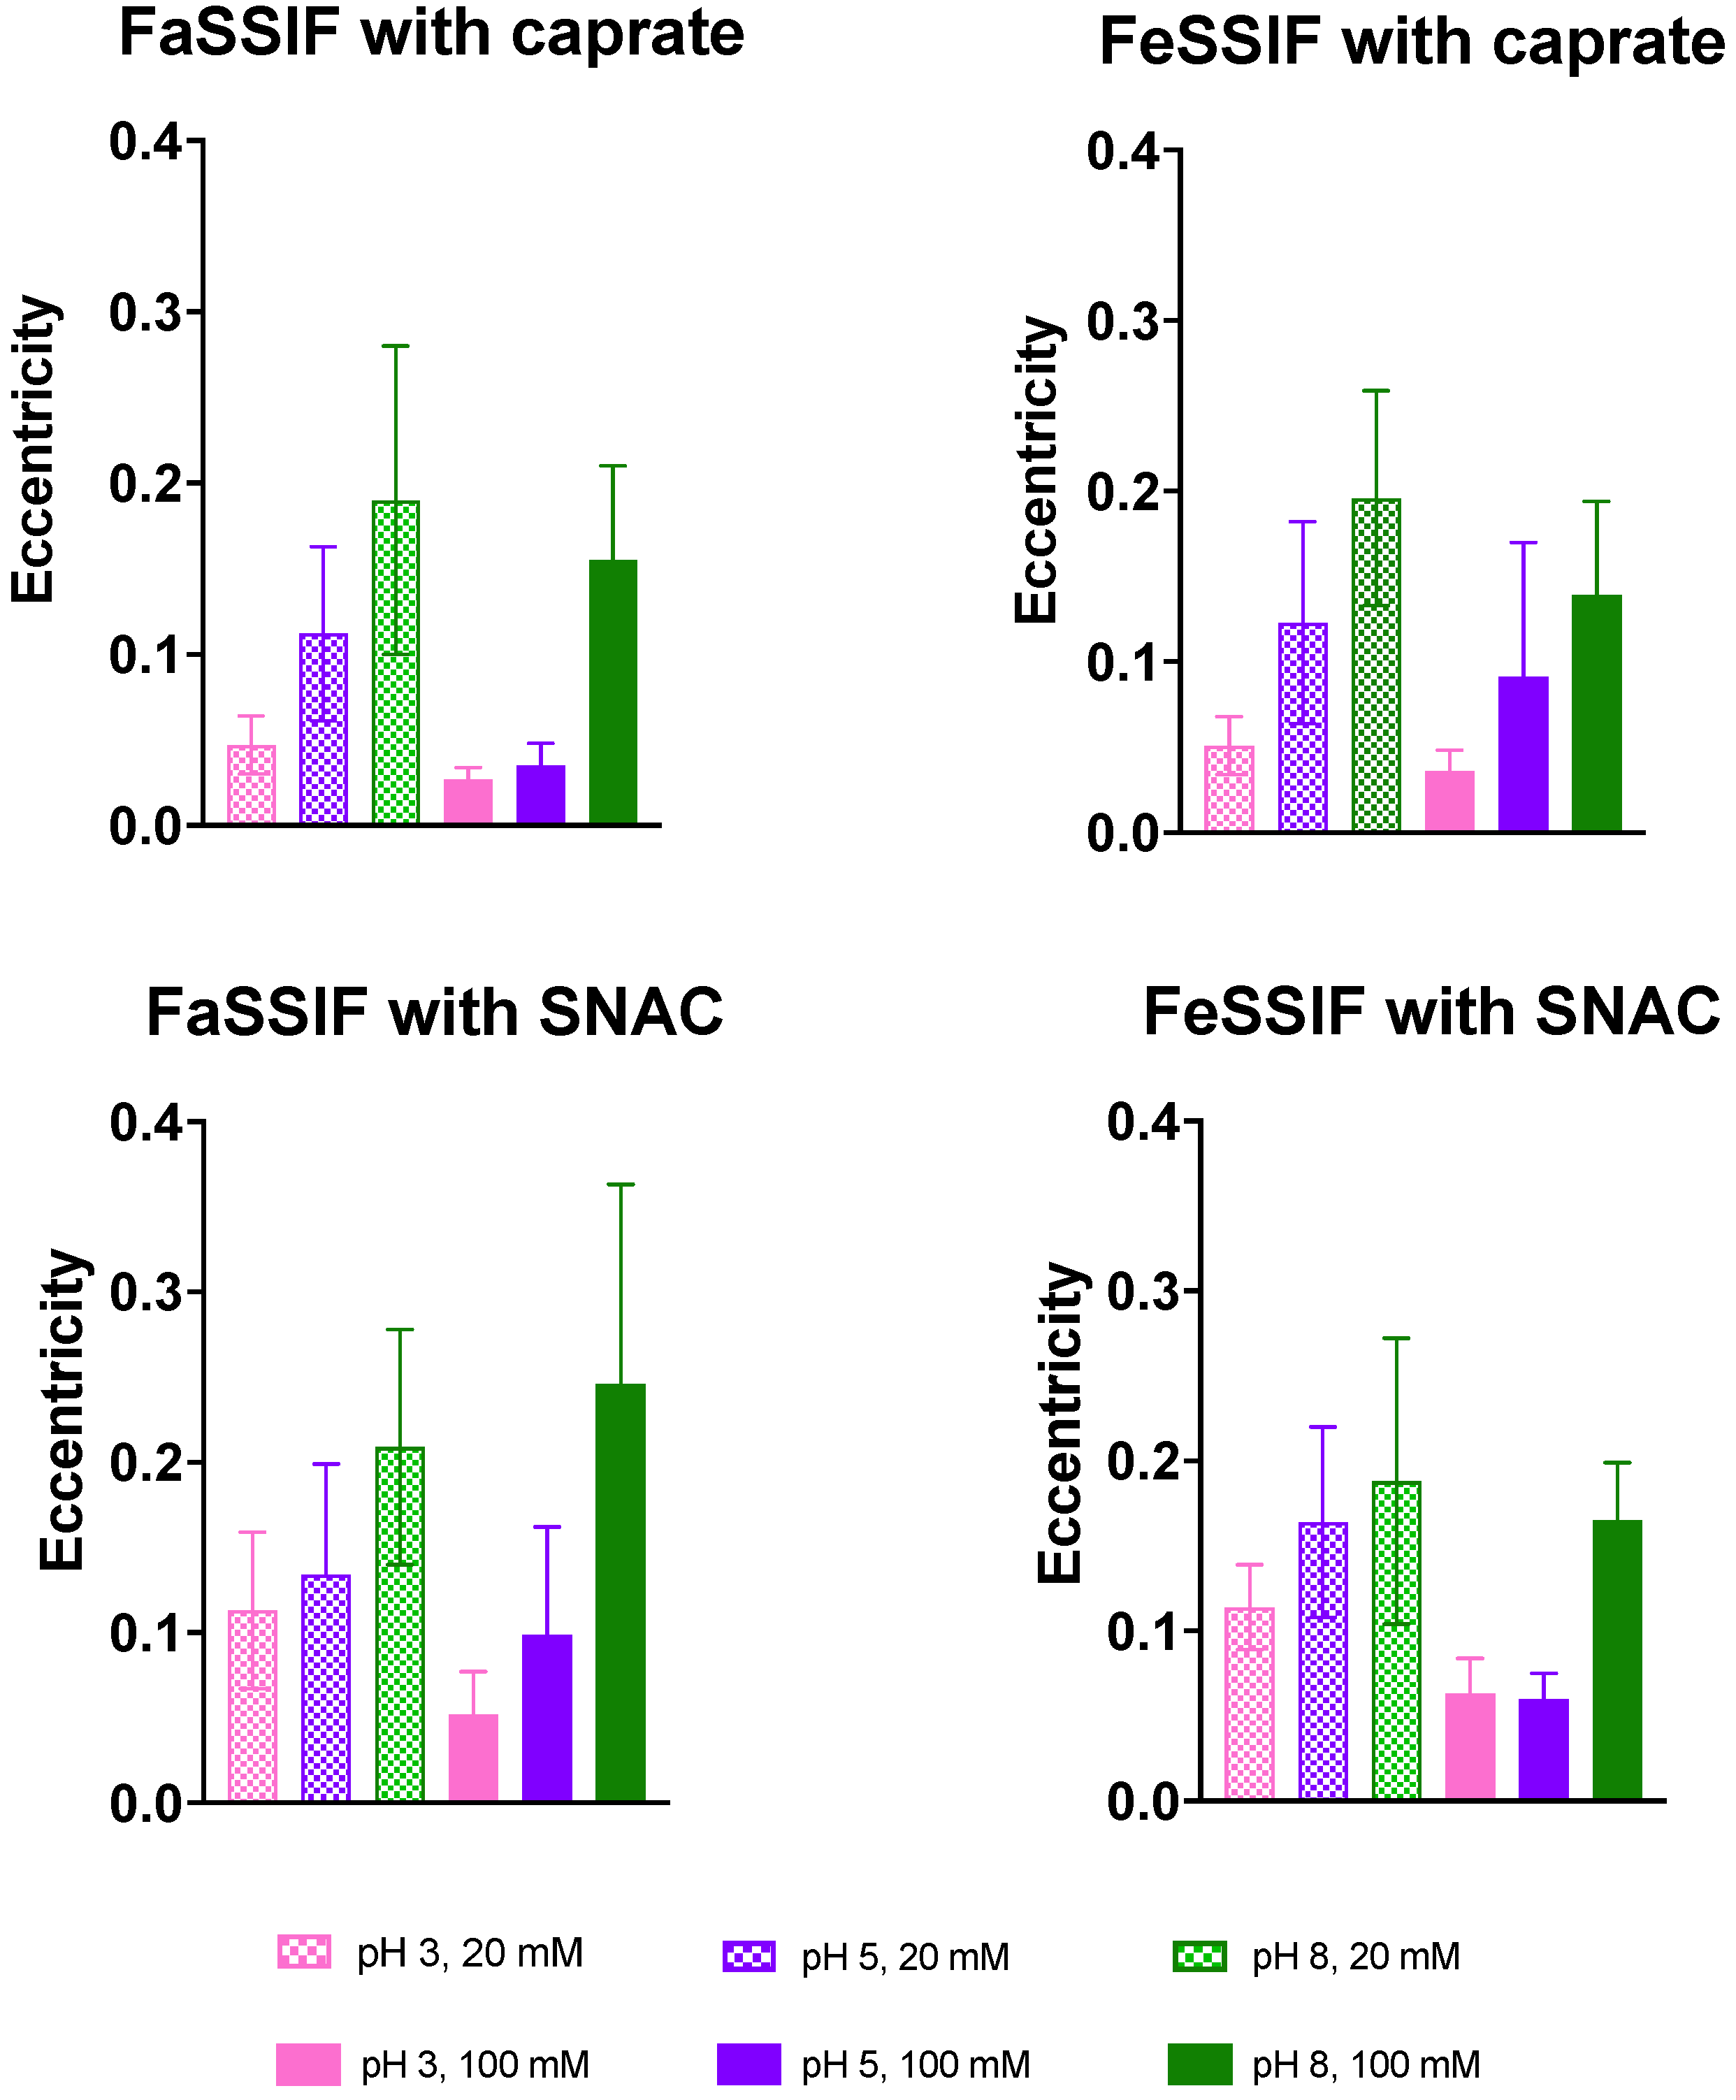
3.2. Impact of pH on Aggregate Shapes

There were three clear trends found from the analyzed eccentricity values. Firstly, in the studied systems with 100 mM of permeation enhancers, the eccentricity was generally lower than in those with 20 mM of PE. While the aggregate is increasing in size, the distribution of the molecules within becomes more uniform and the eccentricity declines (see Figure 6). Secondly, in the simulations with C10 molecules, the aggregates on average had lower values of eccentricity. This might be explained by the more lipophilic nature of the C10 molecules as compared to the more complex SNAC molecules (Figure 1). Lastly, the clearest trend was observed while comparing the systems with different pH values. The systems with a pH of 3 had the lowest eccentricity and the most spherical shapes, whereas, at pH = 8, the aggregates had higher eccentricity for the corresponding systems. This, again, might be highly affected by the average size of the colloids formed.
The eccentricity values obtained in our study compared well with previously published results. For example, the average eccentricity value was around 0.15 for the systems with FaSSIF and 100 mM caprate at pH 8. The average aggregation number for this system was 30.04 (Table 2). Lebecque et al. obtained an eccentricity value of 0.14 for sodium dodecyl sulfate (SDS) surfactants at a similar aggregation number using MD simulations, which compares well with our results [43]. Note that SDS and caprate molecules are almost similar in size, and, in the system of FaSSIF and 100 mM caprate, the overall aggregation dynamics are mostly dominated by the caprate. Moreover, our results of decreasing eccentricity as a function of pH decrease compare well with Yoshii et al.’s simulation study with SDS molecules [44]. Yoshii et al. calculated a similar parameter, asperity, and observed that its value decreased with increasing aggregation number up to the aggregate size of 120. Note that a clear relationship with pH and aggregation number was observed in our study, which shows the increase in aggregation number with decreasing pH values (Table 2). Overall, the shapes of the aggregates in our simulation compare well with other surfactant molecule simulation data.

3.3. Impact of pH on Aggregates’ Structural Characteristics

The disposition of molecules relative to the aggregate core was described with density plots for each system (Figure 7). In general, for all aggregates, taurocholate molecules were positioned further away from the core compared to the phospholipids. Taurocholate was also slightly further away from the core than caprate in most systems. For SNAC, this was not the case; however, the beads at the edge of the aggregate consisted mainly of SNAC beads. Different pH did not seem to impact the surface composition; however, there was a trend of phospholipids being shifted more to the center of the aggregates at pH 8. This could be due to the higher number of charged bile salt, caprate and SNAC molecules interacting with water beads more favorably. Systems with caprate were more often forming one single aggregate at pH 3 and multiple aggregates at pH 5 and 8. This trend was not seen for systems with SNAC, which mainly formed multiple aggregates throughout the pH range simulated. The high polydispersity in many systems resulted in high variability in the density plots, which could be seen especially for molecules at the surface. For most systems, general trends of molecular disposition were still clear.

4. Conclusions

Processes that are relevant to the behavior and availability of molecules introduced into the intestine as part of an orally administered dosage form, such as aggregation, depend critically on the pH of the surrounding medium. In this manuscript, we show that molecular dynamics simulations can be used to simulate the explicit dependence of pH on molecular aggregation, as long as the necessary topologies are available, thus mitigating many of the decisions about molecular charge state. As such, explicit-pH simulations are critical for establishing this methodology as part of the computational pharmaceutics toolbox.

Supplementary Materials

The following are available online at https://www.mdpi.com/article/10.3390/pr10010029/s1, Figure S1: Histograms of AA and CG bond lengths and angles for (a) bond 8–9, (b) bond 9–10, (c) angle 7-8-9 and (d) angle 8-9-10 for different CG optimization runs (1, 3 and 6). Figure S2: Time evolution of solvent accessible surface area for the reference all-atom and coarse-grained versions of taurocholate. Table S1: Different Non-Bonded Interaction Parameters with Neutral Beads for the taurocholate titratable beads which is defined as SP6_2.0. Table S2. pH dependent interaction parameters with water for the taurocholate titratable bead SP6_2.0. Table S3. Other interaction parameters for the taurocholate titratable bead SP6_2.0 Table S4: List of the simulated systems and the number of the all the molecules inserted into the simulation box.

Author Contributions

Conceptualization, P.L., S.H. and A.K.; methodology, S.H., A.K. and A.P.; software, S.H., A.P., A.K., R.C.K., Y.L. and P.L.; validation, S.H., A.P., A.K., R.C.K., Y.L. and P.L.; formal analysis, S.H., A.P., A.K., R.C.K., Y.L. and P.L.; investigation, S.H., A.P., A.K., R.C.K., Y.L. and P.L.; resources, P.L.; data curation, S.H.; writing—original draft preparation, S.H., A.P., A.K., R.C.K., Y.L. and P.L.; writing—review and editing, S.H., A.P., A.K., R.C.K., Y.L. and P.L.; visualization, S.H., A.P., A.K., R.C.K., Y.L. and P.L.; funding acquisition, P.L. All authors have read and agreed to the published version of the manuscript.

Funding

Financial support from VINNOVA (2019-00048) is gratefully acknowledged.

Institutional Review Board Statement

Not applicable.

Informed Consent Statement

Not applicable.

Data Availability Statement

All molecular topologies and input coordinate files and topologies, as well as simulation trajectories to replicate the study, are available from the authors upon request.

Acknowledgments

The computation/data handling was enabled by resources provided by the Swedish National Infrastructure for Computing (SNIC) at the Uppsala Multidisciplinary Center for Advanced Computational Science (UPPMAX), the Center for High Performance Computing (PDC) and the High-Performance Computing Center North (HPC2N), partially funded by the Swedish Research Council (grant agreement no. 2018-05973). Funding: Financial support from VINNOVA (2019-00048) is gratefully acknowledged.

Conflicts of Interest

The authors declare no conflict of interest.

References

  1. Morrow, T.; Felcone, L.H. Defining the difference: What makes biologics unique. Biotechnol. Healthc. 2004, 1, 24. [Google Scholar] [PubMed]
  2. Maher, S.; Mrsny, R.J.; Brayden, D.J. Intestinal permeation enhancers for oral peptide delivery. Adv. Drug Deliv. Rev. 2016, 106, 277–319. [Google Scholar] [CrossRef]
  3. Danielsen, E.M. Intestinal permeation enhancers: Lessons learned from studies using an organ culture model. Biochim. Biophys. Acta 2021, 1863, 183474. [Google Scholar] [CrossRef] [PubMed]
  4. Leonard, T.W.; Lynch, J.; McKenna, M.J.; Brayden, D.J. Promoting absorption of drugs in humans using medium-chain fatty acid-based solid dosage forms: GIPETTM. Expert Opin. Drug Deliv. 2006, 3, 685–692. [Google Scholar] [CrossRef]
  5. Karsdal, M.A.; Henriksen, K.; Bay-Jensen, A.C.; Molloy, B.; Arnold, M.; John, M.R.; Byrjalsen, I.; Azria, M.; Riis, B.J.; Qvist, P.; et al. Lessons learned from the development of oral calcitonin: The first tablet formulation of a protein in phase III clinical trials. J. Clin. Pharmacol. 2011, 51, 460–471. [Google Scholar] [CrossRef]
  6. McCartney, F.; Gleeson, J.P.; Brayden, D.J. Safety concerns over the use of intestinal permeation enhancers: A mini-review. Tissue Barriers 2016, 4, e1176822. [Google Scholar] [CrossRef] [PubMed] [Green Version]
  7. Walsh, E.G.; Adamczyk, B.E.; Chalasani, K.B.; Maher, S.; O’Toole, E.B.; Fox, J.S.; Leonard, T.W.; Brayden, D.J. Oral delivery of macromolecules: Rationale underpinning Gastrointestinal Permeation Enhancement Technology (GIPET®). Ther. Deliv. 2011, 2, 1595–1610. [Google Scholar] [CrossRef]
  8. Aungst, B.J. Absorption Enhancers: Applications and Advances. AAPS J. 2012, 14, 10–18. [Google Scholar] [CrossRef] [PubMed] [Green Version]
  9. Halberg, I.B.; Lyby, K.; Wassermann, K.; Heise, T.; Zijlstra, E.; Plum-Mörschel, L. Efficacy and safety of oral basal insulin versus subcutaneous insulin glargine in type 2 diabetes: A randomised, double-blind, phase 2 trial. Lancet Diabetes Endocrinol. 2019, 7, 179–188. [Google Scholar] [CrossRef]
  10. Tillman, L.G.; Geary, R.S.; Hardee, G.E. Oral delivery of antisense oligonucleotides in man. J. Pharm. Sci. 2008, 97, 225–236. [Google Scholar] [CrossRef]
  11. Tuvia, S.; Pelled, D.; Marom, K.; Salama, P.; Levin-Arama, M.; Karmeli, I.; Idelson, G.H.; Landau, I.; Mamluk, R. A novel suspension formulation enhances intestinal absorption of macromolecules via transient and reversible transport mechanisms. Pharm. Res. 2014, 31, 2010–2021. [Google Scholar] [CrossRef] [Green Version]
  12. Buckley, S.T.; Bækdal, T.A.; Vegge, A.; Maarbjerg, S.J.; Pyke, C.; Ahnfelt-Rønne, J.; Madsen, K.G.; Schéele, S.G.; Alanentalo, T.; Kirk, R.K.; et al. Transcellular stomach absorption of a derivatized glucagon-like peptide-1 receptor agonist. Sci. Transl. Med. 2021, 32, 115942. [Google Scholar] [CrossRef]
  13. Roos, C.; Dahlgren, D.; Sjögren, E.; Sjöblom, M.; Hedeland, M.; Lennernäs, H. Effects of absorption-modifying excipients on jejunal drug absorption in simulated fasted and fed luminal conditions. Eur. J. Pharm. Biopharm. 2019, 142, 387–395. [Google Scholar] [CrossRef]
  14. Gradauer, K.; Nishiumi, A.; Unrinin, K.; Higashino, H.; Kataoka, M.; Pedersen, B.L.; Buckley, S.T.; Yamashita, S. Interaction with Mixed Micelles in the Intestine Attenuates the Permeation Enhancing Potential of Alkyl-Maltosides. Mol. Pharm. 2015, 12, 2245–2253. [Google Scholar] [CrossRef] [PubMed]
  15. Clulow, A.J.; Parrow, A.; Hawley, A.; Khan, J.; Pham, A.C.; Larsson, P.; Bergström, C.A.S.; Boyd, B.J. Characterization of Solubilizing Nanoaggregates Present in Different Versions of Simulated Intestinal Fluid. J. Phys. Chem. B 2017, 121, 10869–10881. [Google Scholar] [CrossRef] [PubMed]
  16. Hossain, S.; Joyce, P.; Parrow, A.; Jõemetsa, S.; Höök, F.; Larsson, P.; Bergström, C.A.S. Influence of bile composition on membrane incorporation of transient permeability enhancers. Mol. Pharm. 2020, 17, 4226–4240. [Google Scholar] [CrossRef]
  17. Yoon, B.K.; Jackman, J.A.; Kim, M.C.; Cho, N.J. Spectrum of Membrane Morphological Responses to Antibacterial Fatty Acids and Related Surfactants. Langmuir 2015, 31, 10223–10232. [Google Scholar] [CrossRef]
  18. Flynn, K.R.; Martin, L.L.; Ackland, M.L.; Torriero, A.A.J. Real-Time Quartz Crystal Microbalance Monitoring of Free Docosahexaenoic Acid Interactions with Supported Lipid Bilayers. Langmuir 2016, 32, 11717–11727. [Google Scholar] [CrossRef] [PubMed]
  19. Joyce, P.; Jõemetsa, S.; Isaksson, S.; Hossain, S.; Larsson, P.; Bergström, C.; Höök, F. Investigating drug permeation across a lipid membrane supported on mesoporous silica. Angew. Chemie 2020, 133, 2097–2101. [Google Scholar] [CrossRef]
  20. Voth, G.A. The computer simulation of proton transport in biomolecular systems. Front Biosci. 2003, 8, 1384–1397. [Google Scholar] [CrossRef] [Green Version]
  21. Tepper, H.L.; Voth, G.A. Protons may leak through pure lipid bilayers via a concerted mechanism. Biophys. J. 2005, 88, 3095–3108. [Google Scholar] [CrossRef] [Green Version]
  22. Baptista, A.M.; Teixeira, V.H.; Soares, C.M. Constant-p H molecular dynamics using stochastic titration. J. Chem. Phys. 2002, 117, 4184–4200. [Google Scholar] [CrossRef]
  23. Mongan, J.; Case, D.A.; McCammon, J.A. Constant pH molecular dynamics in generalized Born implicit solvent. J. Comput. Chem. 2004, 25, 2038–2048. [Google Scholar] [CrossRef]
  24. Lee, M.S.; Salsbury, F.R., Jr.; Brooks, C.L., III. Constant-pH molecular dynamics using continuous titration coordinates. Proteins Struct. Funct. Bioinforma. 2004, 56, 738–752. [Google Scholar] [CrossRef] [PubMed]
  25. Donnini, S.; Tegeler, F.; Groenhof, G.; Grubmüller, H. Constant pH molecular dynamics in explicit solvent with λ-dynamics. J. Chem. Theory Comput. 2011, 7, 1962–1978. [Google Scholar] [CrossRef]
  26. Grünewald, F.; Souza, P.C.T.; Abdizadeh, H.; Barnoud, J.; De Vries, A.H.; Marrink, S.J. Titratable Martini model for constant pH simulations. J. Chem. Phys. 2020, 153, 024118. [Google Scholar] [CrossRef]
  27. Souza, P.C.T.; Alessandri, R.; Barnoud, J.; Thallmair, S.; Faustino, I.; Grünewald, F.; Patmanidis, I.; Abdizadeh, H.; Bruininks, B.M.H.; Wassenaar, T.A.; et al. Martini 3: A general purpose force field for coarse-grained molecular dynamics. Nat. Methods 2021, 18, 382–388. [Google Scholar] [CrossRef] [PubMed]
  28. Holmboe, M.; Larsson, P.; Anwar, J.; Bergström, C.A.S. Partitioning into Colloidal Structures of Fasted State Intestinal Fluid Studied by Molecular Dynamics Simulations. Langmuir 2016, 32, 12732–12740. [Google Scholar] [CrossRef]
  29. Carey, M.C. Bile Acids and Bile Salts: Ionization and Solubility Properties. Hepatology 1984, 4, 66S–71S. [Google Scholar] [CrossRef]
  30. Roda, A.; Grigolo, B.; Minutello, A.; Pellicciari, R.; Natalini, B. Physicochemical and biological properties of natural and synthetic C-22 and C-23 hydroxylated bile acids. J. Lipid Res. 1990, 31, 289–298. [Google Scholar] [CrossRef]
  31. Martini 3.0. Available online: http://cgmartini.nl/index.php/martini-3-0 (accessed on 23 November 2021).
  32. Maher, S.; Leonard, T.W.; Jacobsen, J.; Brayden, D.J. Safety and efficacy of sodium caprate in promoting oral drug absorption: From in vitro to the clinic. Adv. Drug Deliv. Rev. 2009, 61, 1427–1449. [Google Scholar] [CrossRef]
  33. Deng, L.; Dong, H.; Dong, A.; Zhang, J. A strategy for oral chemotherapy via dual pH-sensitive polyelectrolyte complex nanoparticles to achieve gastric survivability, intestinal permeability, hemodynamic stability and intracellular activity. Eur. J. Pharm. Biopharm. 2015, 97, 107–117. [Google Scholar] [CrossRef]
  34. Riethorst, D.; Mols, R.; Duchateau, G.; Tack, J.; Brouwers, J.; Augustijns, P. Characterization of Human Duodenal Fluids in Fasted and Fed State Conditions. J. Pharm. Sci. 2016, 105, 673–681. [Google Scholar] [CrossRef] [Green Version]
  35. Kanicky, J.R.; Shah, D.O. Effect of premicellar aggregation on the pKa of fatty acid soap solutions. Langmuir 2003, 19, 2034–2038. [Google Scholar] [CrossRef]
  36. Abraham, M.J.; Murtola, T.; Schulz, R.; Páll, S.; Smith, J.C.; Hess, B.; Lindah, E. Gromacs: High performance molecular simulations through multi-level parallelism from laptops to supercomputers. SoftwareX 2015, 1, 19–25. [Google Scholar] [CrossRef] [Green Version]
  37. Bussi, G.; Donadio, D.; Parrinello, M. Canonical sampling through velocity rescaling. J. Chem. Phys. 2007, 126, 014101. [Google Scholar] [CrossRef] [Green Version]
  38. Parrinello, M.; Rahman, A. Polymorphic transitions in single crystals: A new molecular dynamics method. J. Appl. Phys. 1981, 52, 7182–7190. [Google Scholar] [CrossRef]
  39. Hossain, M.S.; Berg, S.; Bergström, C.A.S.; Larsson, P. Aggregation Behavior of Medium Chain Fatty Acids Studied by Coarse-Grained Molecular Dynamics Simulation. AAPS PharmSciTech 2019, 20, 61. [Google Scholar] [CrossRef]
  40. Sega, M.; Hantal, G.; Fábián, B.; Jedlovszky, P. Pytim: A python package for the interfacial analysis of molecular simulations. J. Comput. Chem. 2018, 39, 2118–2125. [Google Scholar] [CrossRef]
  41. Twarog, C.; Fattah, S.; Heade, J.; Maher, S.; Fattal, E.; Brayden, D.J. Intestinal Permeation Enhancers for Oral Delivery of Macromolecules: A Comparison between Salcaprozate Sodium (SNAC) and Sodium Caprate (C 10). Pharmaceutics 2019, 11, 78. [Google Scholar] [CrossRef] [PubMed] [Green Version]
  42. Spivak, W.; Morrison, C.; Devinuto, D.; Yuey, W. Spectrophotometric determination of the critical micellar concentration of bile salts using bilirubin monoglucuronide as a micellar probe. Utility of derivative spectroscopy. Biochem. J. 1988, 252, 275–281. [Google Scholar] [CrossRef] [PubMed] [Green Version]
  43. Lebecque, S.; Crowet, J.M.; Nasir, M.N.; Deleu, M.; Lins, L. Molecular dynamics study of micelles properties according to their size. J. Mol. Graph. Model. 2017, 72, 6–15. [Google Scholar] [CrossRef] [PubMed]
  44. Yoshii, N.; Okazaki, S. A molecular dynamics study of structural stability of spherical SDS micelle as a function of its size. Chem. Phys. Lett. 2006, 425, 58–61. [Google Scholar] [CrossRef]
Figure 1. (A) Mapping of the beads on the all-atomistic representation of SNAC, sodium caprate (C10) and taurocholate (TCH). D-beads are virtual particles introduced specifically for titratable molecules. (B) Titration curve for taurocholate calculated from constant-pH MD simulations (blue dots) and compared to experimentally observed values by Carey et al. [29].
Processes 10 00029 g001
Figure 2. Snapshot of each simulation system at 1 µs. Taurocholate and DLiPC molecules are represented by yellow and purple beads, respectively. Caprate molecules are represented by cyan and red beads, representing the fatty acid tail and headgroup, respectively. Similarly, SNAC molecules are represented by tan and blue beads, representing the tail and headgroups, respectively.
Processes 10 00029 g002
Figure 3. Number of free permeation enhancers, caprate (C10) and SNAC molecules, for all studied systems, presented as an average value and standard deviation calculated using the last 200 ns of the simulation trajectory.
Processes 10 00029 g003
Figure 4. Number of free taurocholate (TCH) molecules for all studied systems, presented as an average value and standard deviation calculated using the last 200 ns of the simulation trajectory.
Processes 10 00029 g004
Figure 5. Number of aggregates for all studied systems, presented as an average value and standard deviation calculated using the last 200 ns of the simulation trajectory. A number of systems contained a constant number of aggregates during the last 200 ns of the simulation and hence no error bars were available for those systems.
Processes 10 00029 g005
Figure 6. Eccentricity values for all studied systems, presented as an average value and standard deviation. Lower values indicate more spherical shapes. High values of the deviations reflect the effect of the fluctuations in the shape of the aggregates.
Processes 10 00029 g006
Figure 7. Density of molecule-specific beads at distances from aggregate core. Error bars display the standard deviation in systems with multiple aggregates. Abbreviations: caprate (C10), phospholipids (PL), taurocholate (TCH), sodium N-(8-[2-hydroxybenzo]amino caprylate (SNAC)).
Processes 10 00029 g007
Table 1. Simulations performed with different combinations of biorelevant media and their composition, permeation enhancers and pH of the systems.
MediumsPermeation EnhancersConcentration of Permeation EnhancerspH
FaSSIF: Sodium taurocholate (3.0 mM) and soy lecithin (0.75 mM) [15];
FeSSIF: Sodium taurocholate (15.0 mM) and soy lecithin (3.75 mM) [15]
Caprate and SNAC20 and 100 mM3, 5 and 8
Table 2. Aggregation numbers for all studied systems, presented as an average value and standard error 1 calculated using the last 200 ns of the simulation trajectory.
Aggregation Number, N
(Average ± Std. Error)
Aggregation Number, N
(Average ± Std. Error)
SystemspH 3pH 5pH 8SystemspH 3pH 5pH 8
FaSSIF with 20 mM caprate220 ± 0100 ± 221 ± 1FaSSIF with 20 mM SNAC66 ± 442 ± 210 ± 0
FaSSIF with 100 mM caprate972 ± 0956 ± 130 ± 0FaSSIF with 100 mM SNAC382 ± 36459 ± 5210 ± 0
FeSSIF with 20 mM caprate346 ± 066 ± 533 ± 2FeSSIF with 20 mM SNAC53 ± 129 ± 321 ± 1
FeSSIF with 100 mM caprate1111 ± 0277 ± 1739 ± 1FeSSIF with 100 mM SNAC269 ± 10311 ± 2318 ± 1
1 The average and standard error values are rounded off to the nearest integers.
Publisher’s Note: MDPI stays neutral with regard to jurisdictional claims in published maps and institutional affiliations.

