
Predicting Future Promising Technologies Using LSTM

Abstract
:1. Introduction
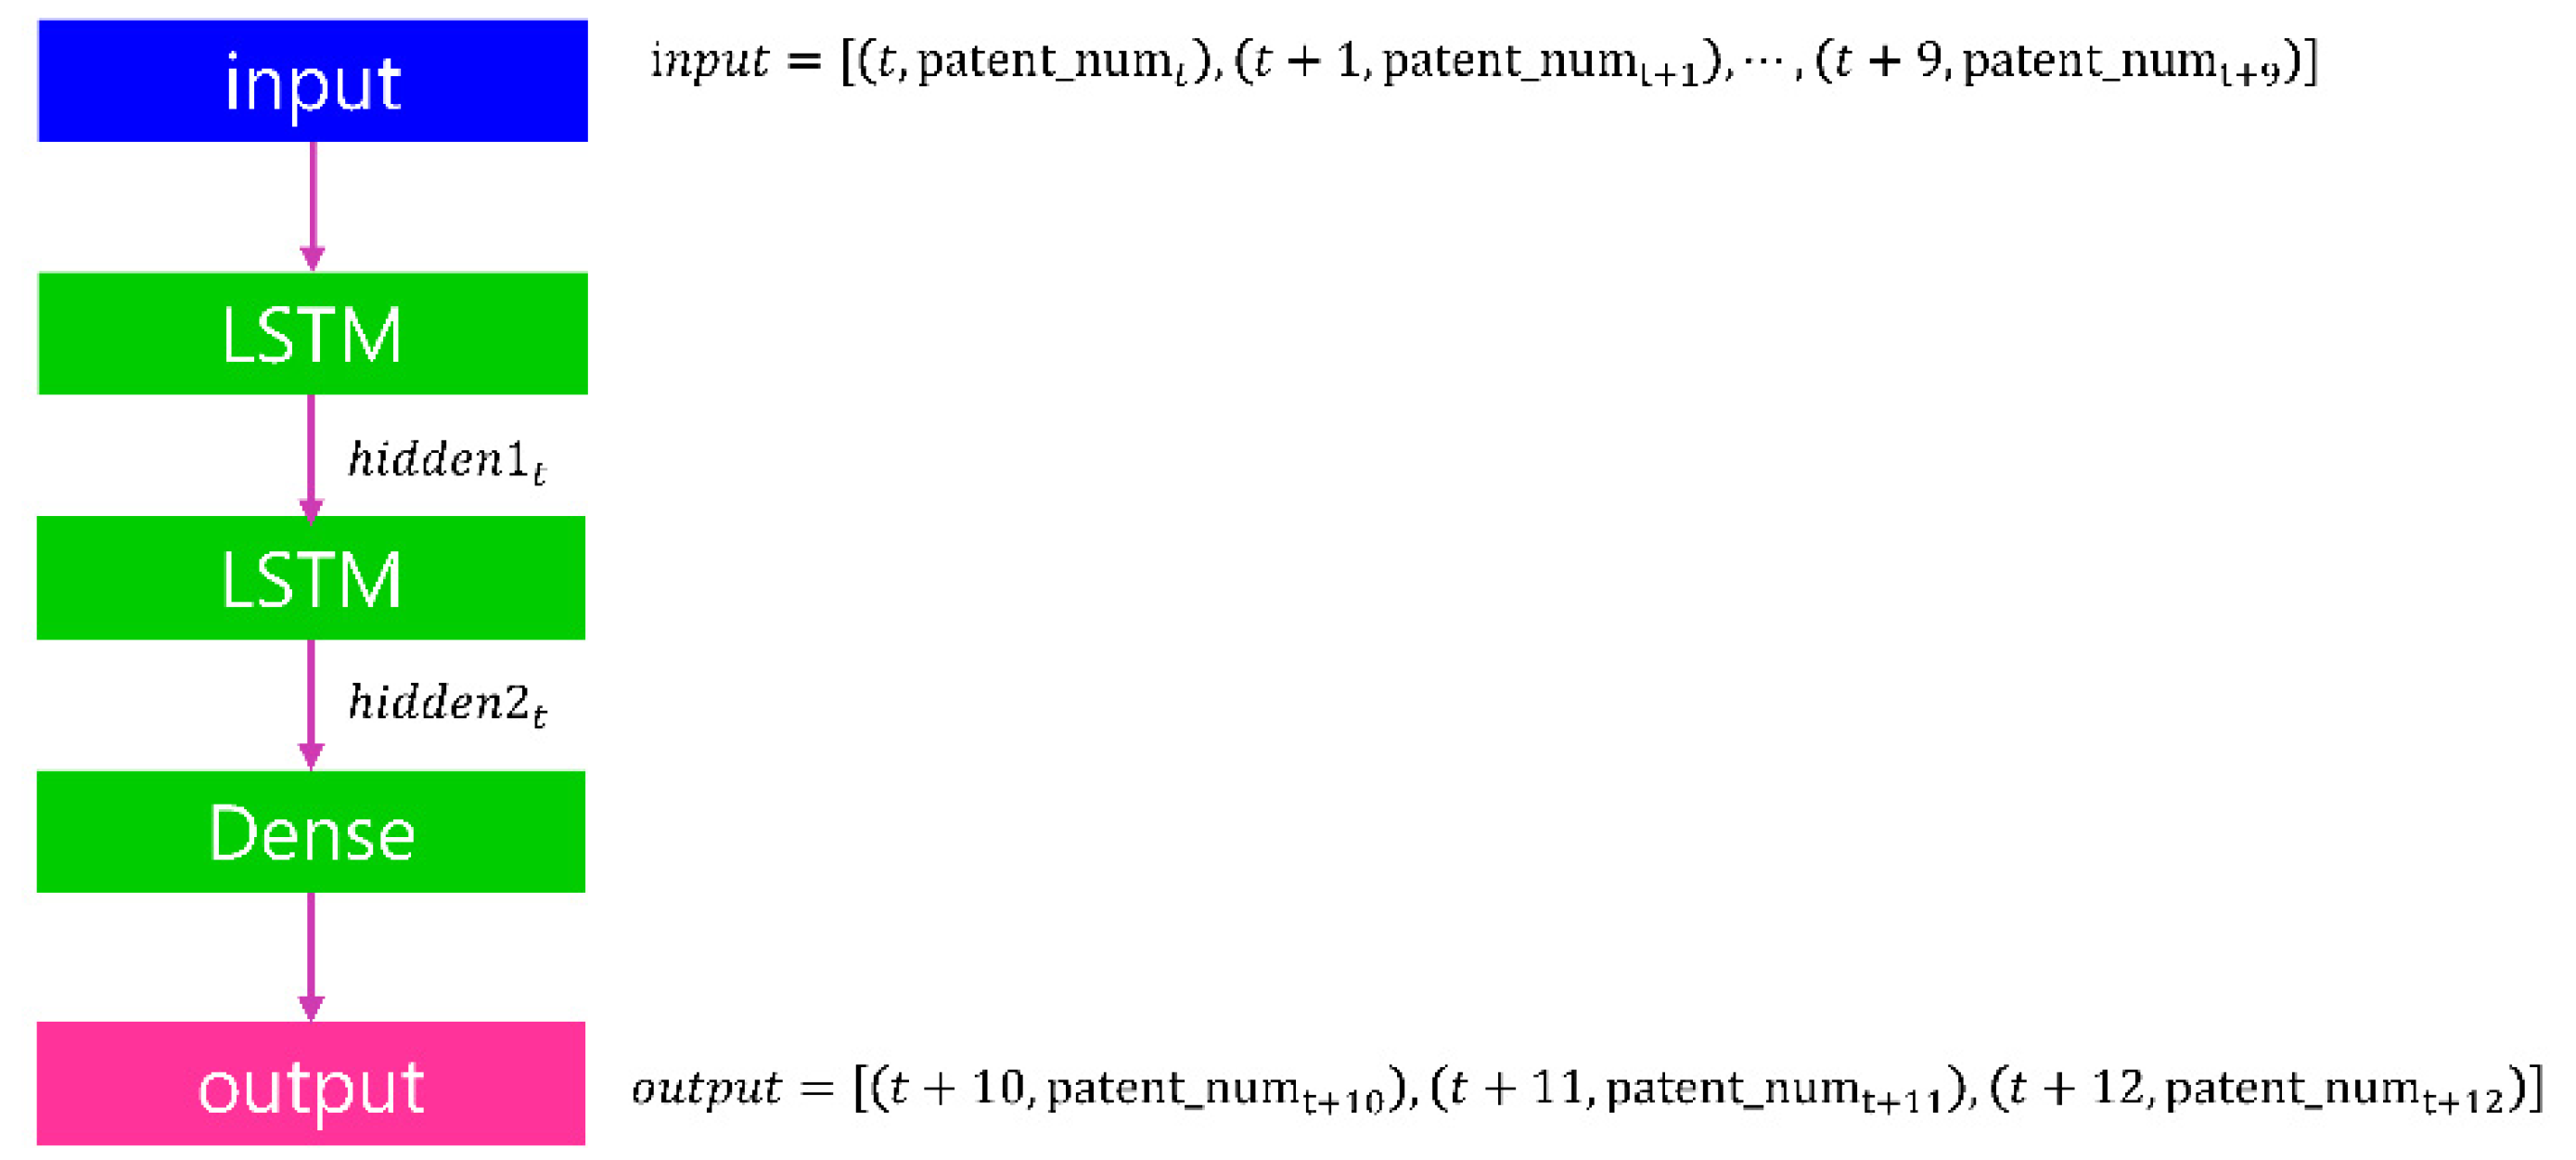
2. Data and Methods
2.1. Data
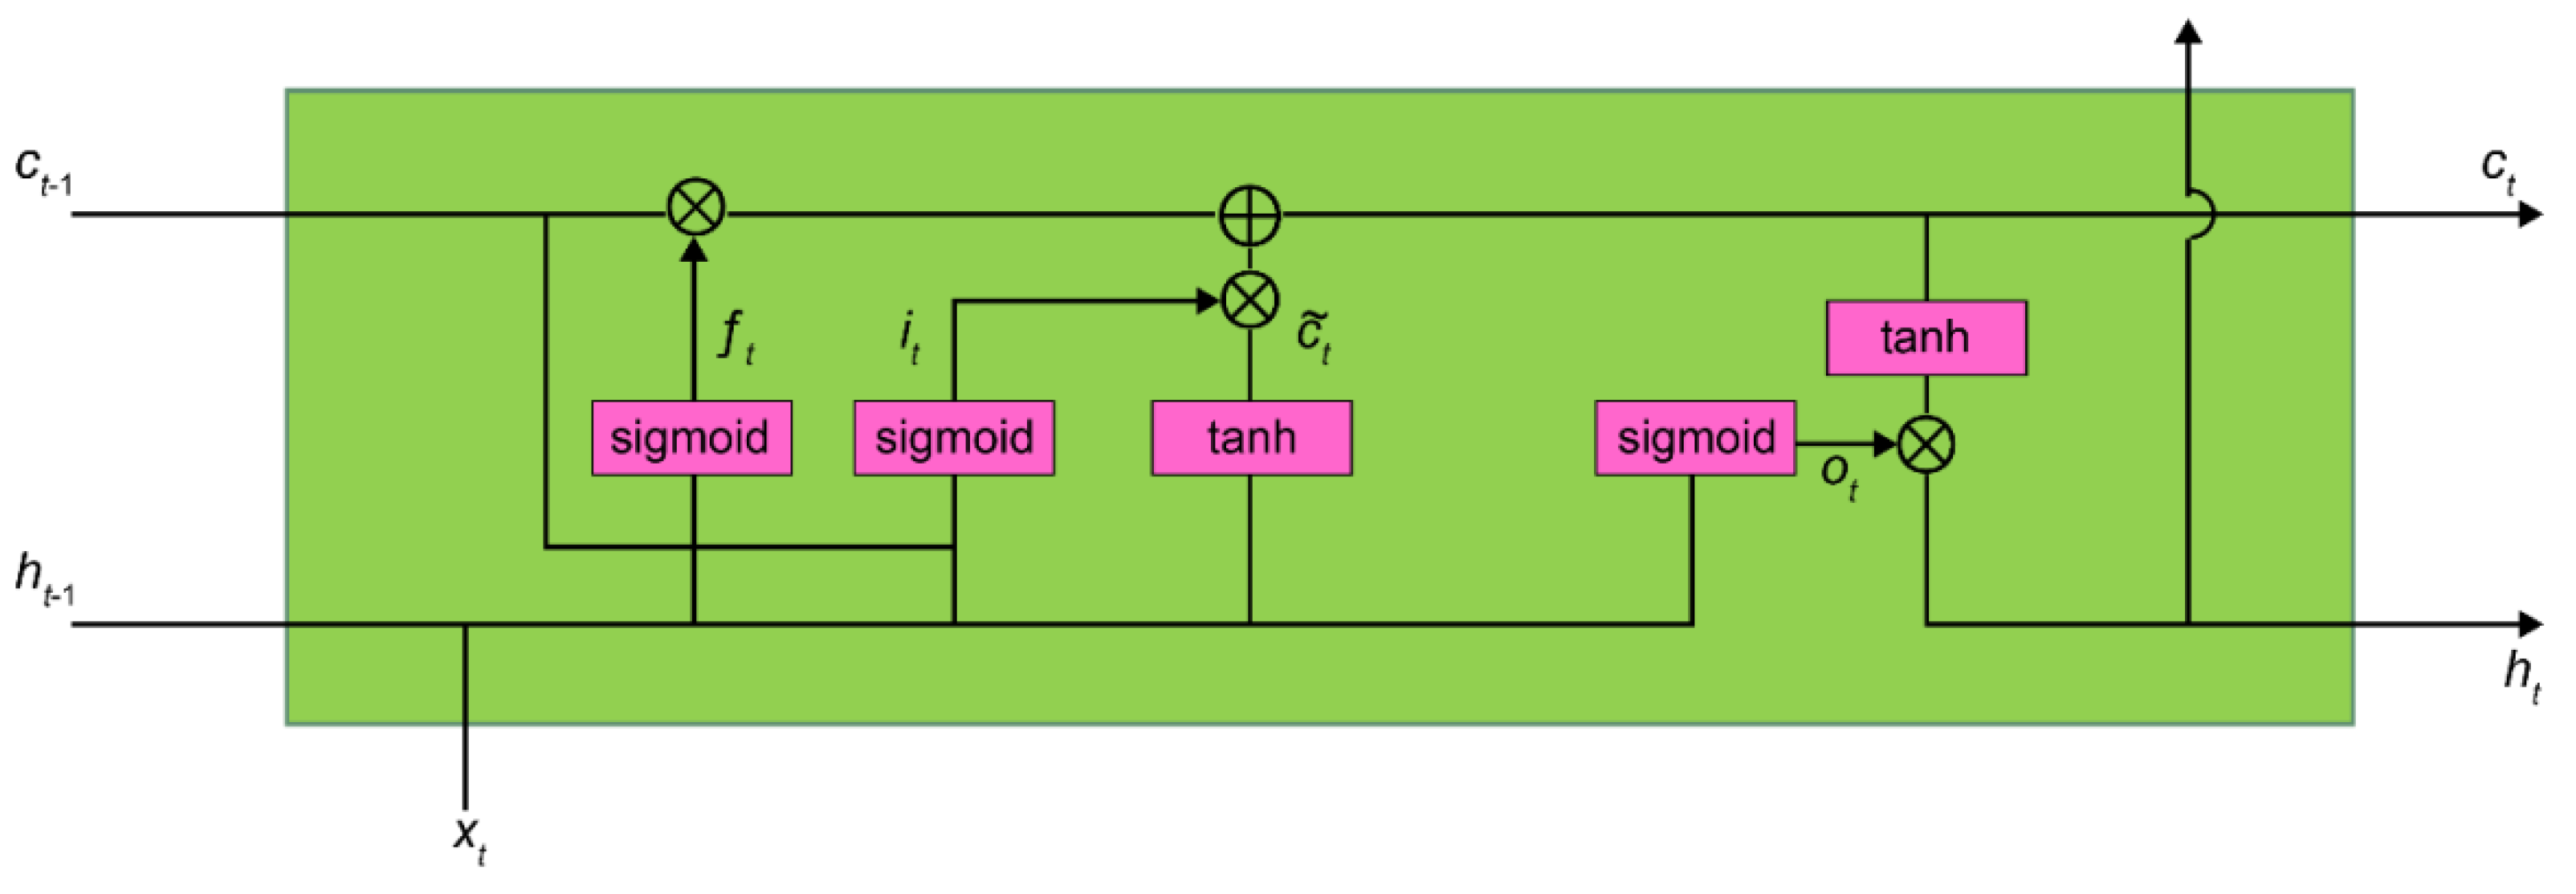
2.2. Model
| Output | ||
| Output gate | ||
| Memory cell | ||
| New memory content | (1) | |
| Forget gate | ||
| Input gate |
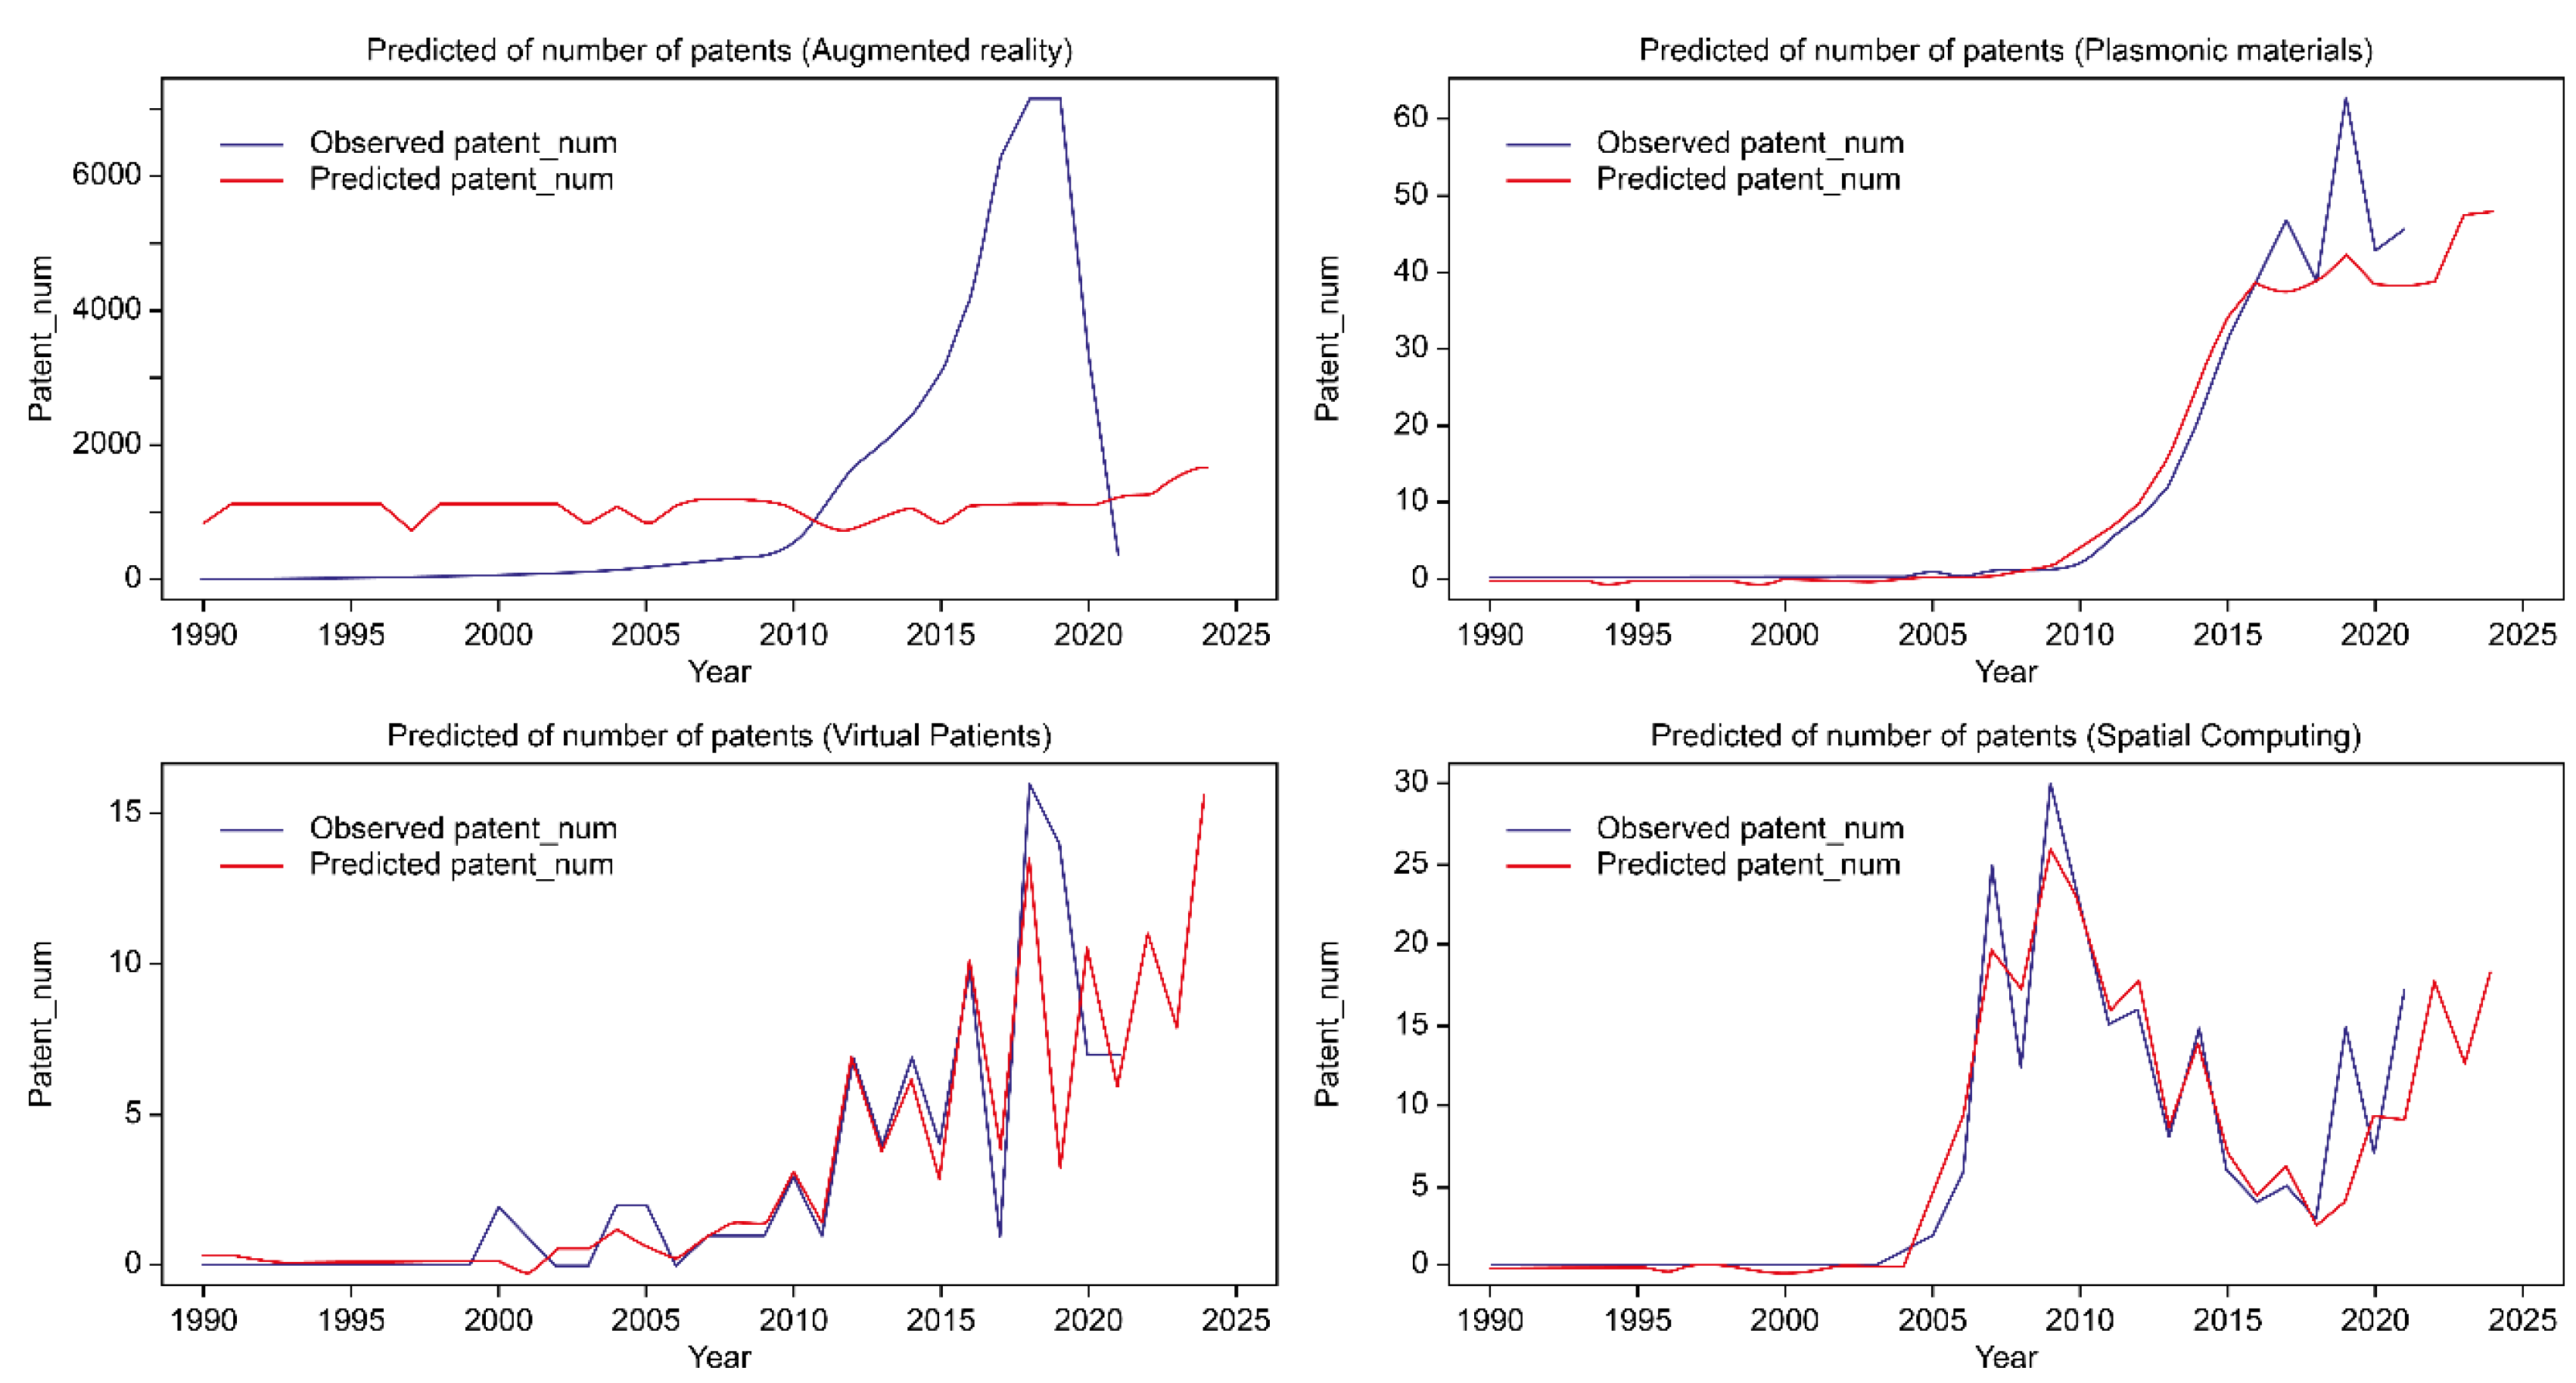
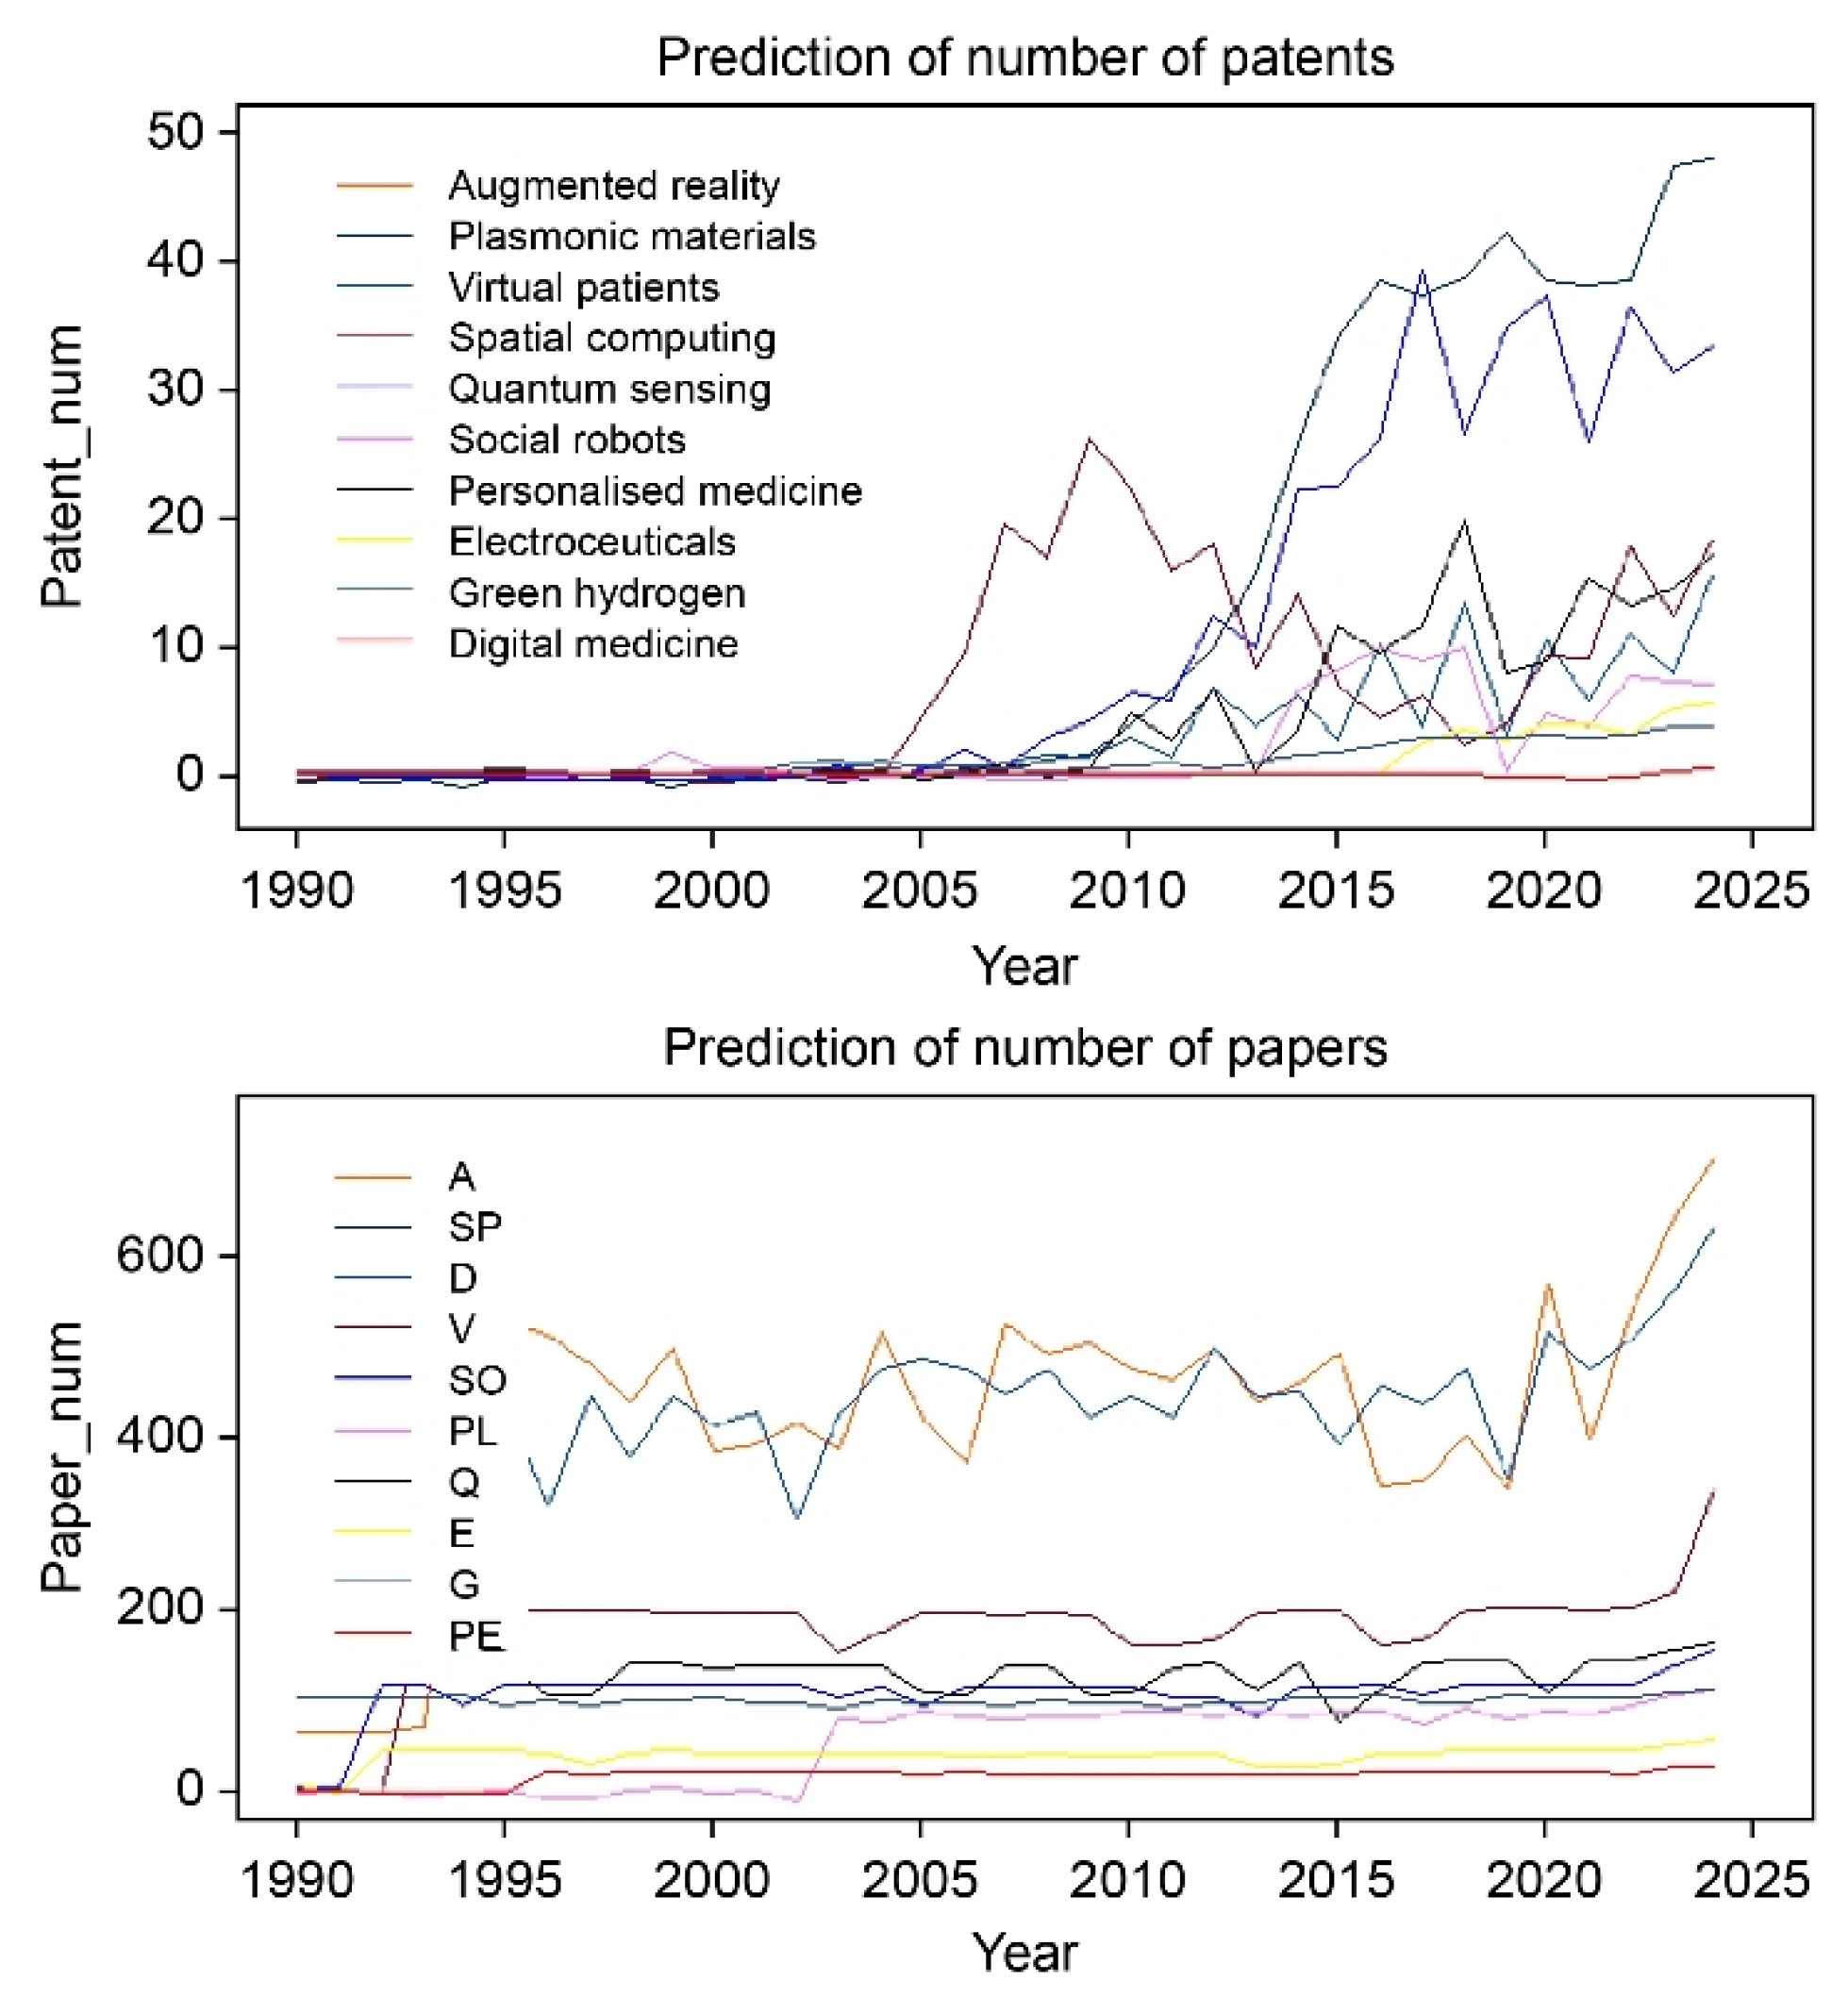
2.3. Patent Analysis Results
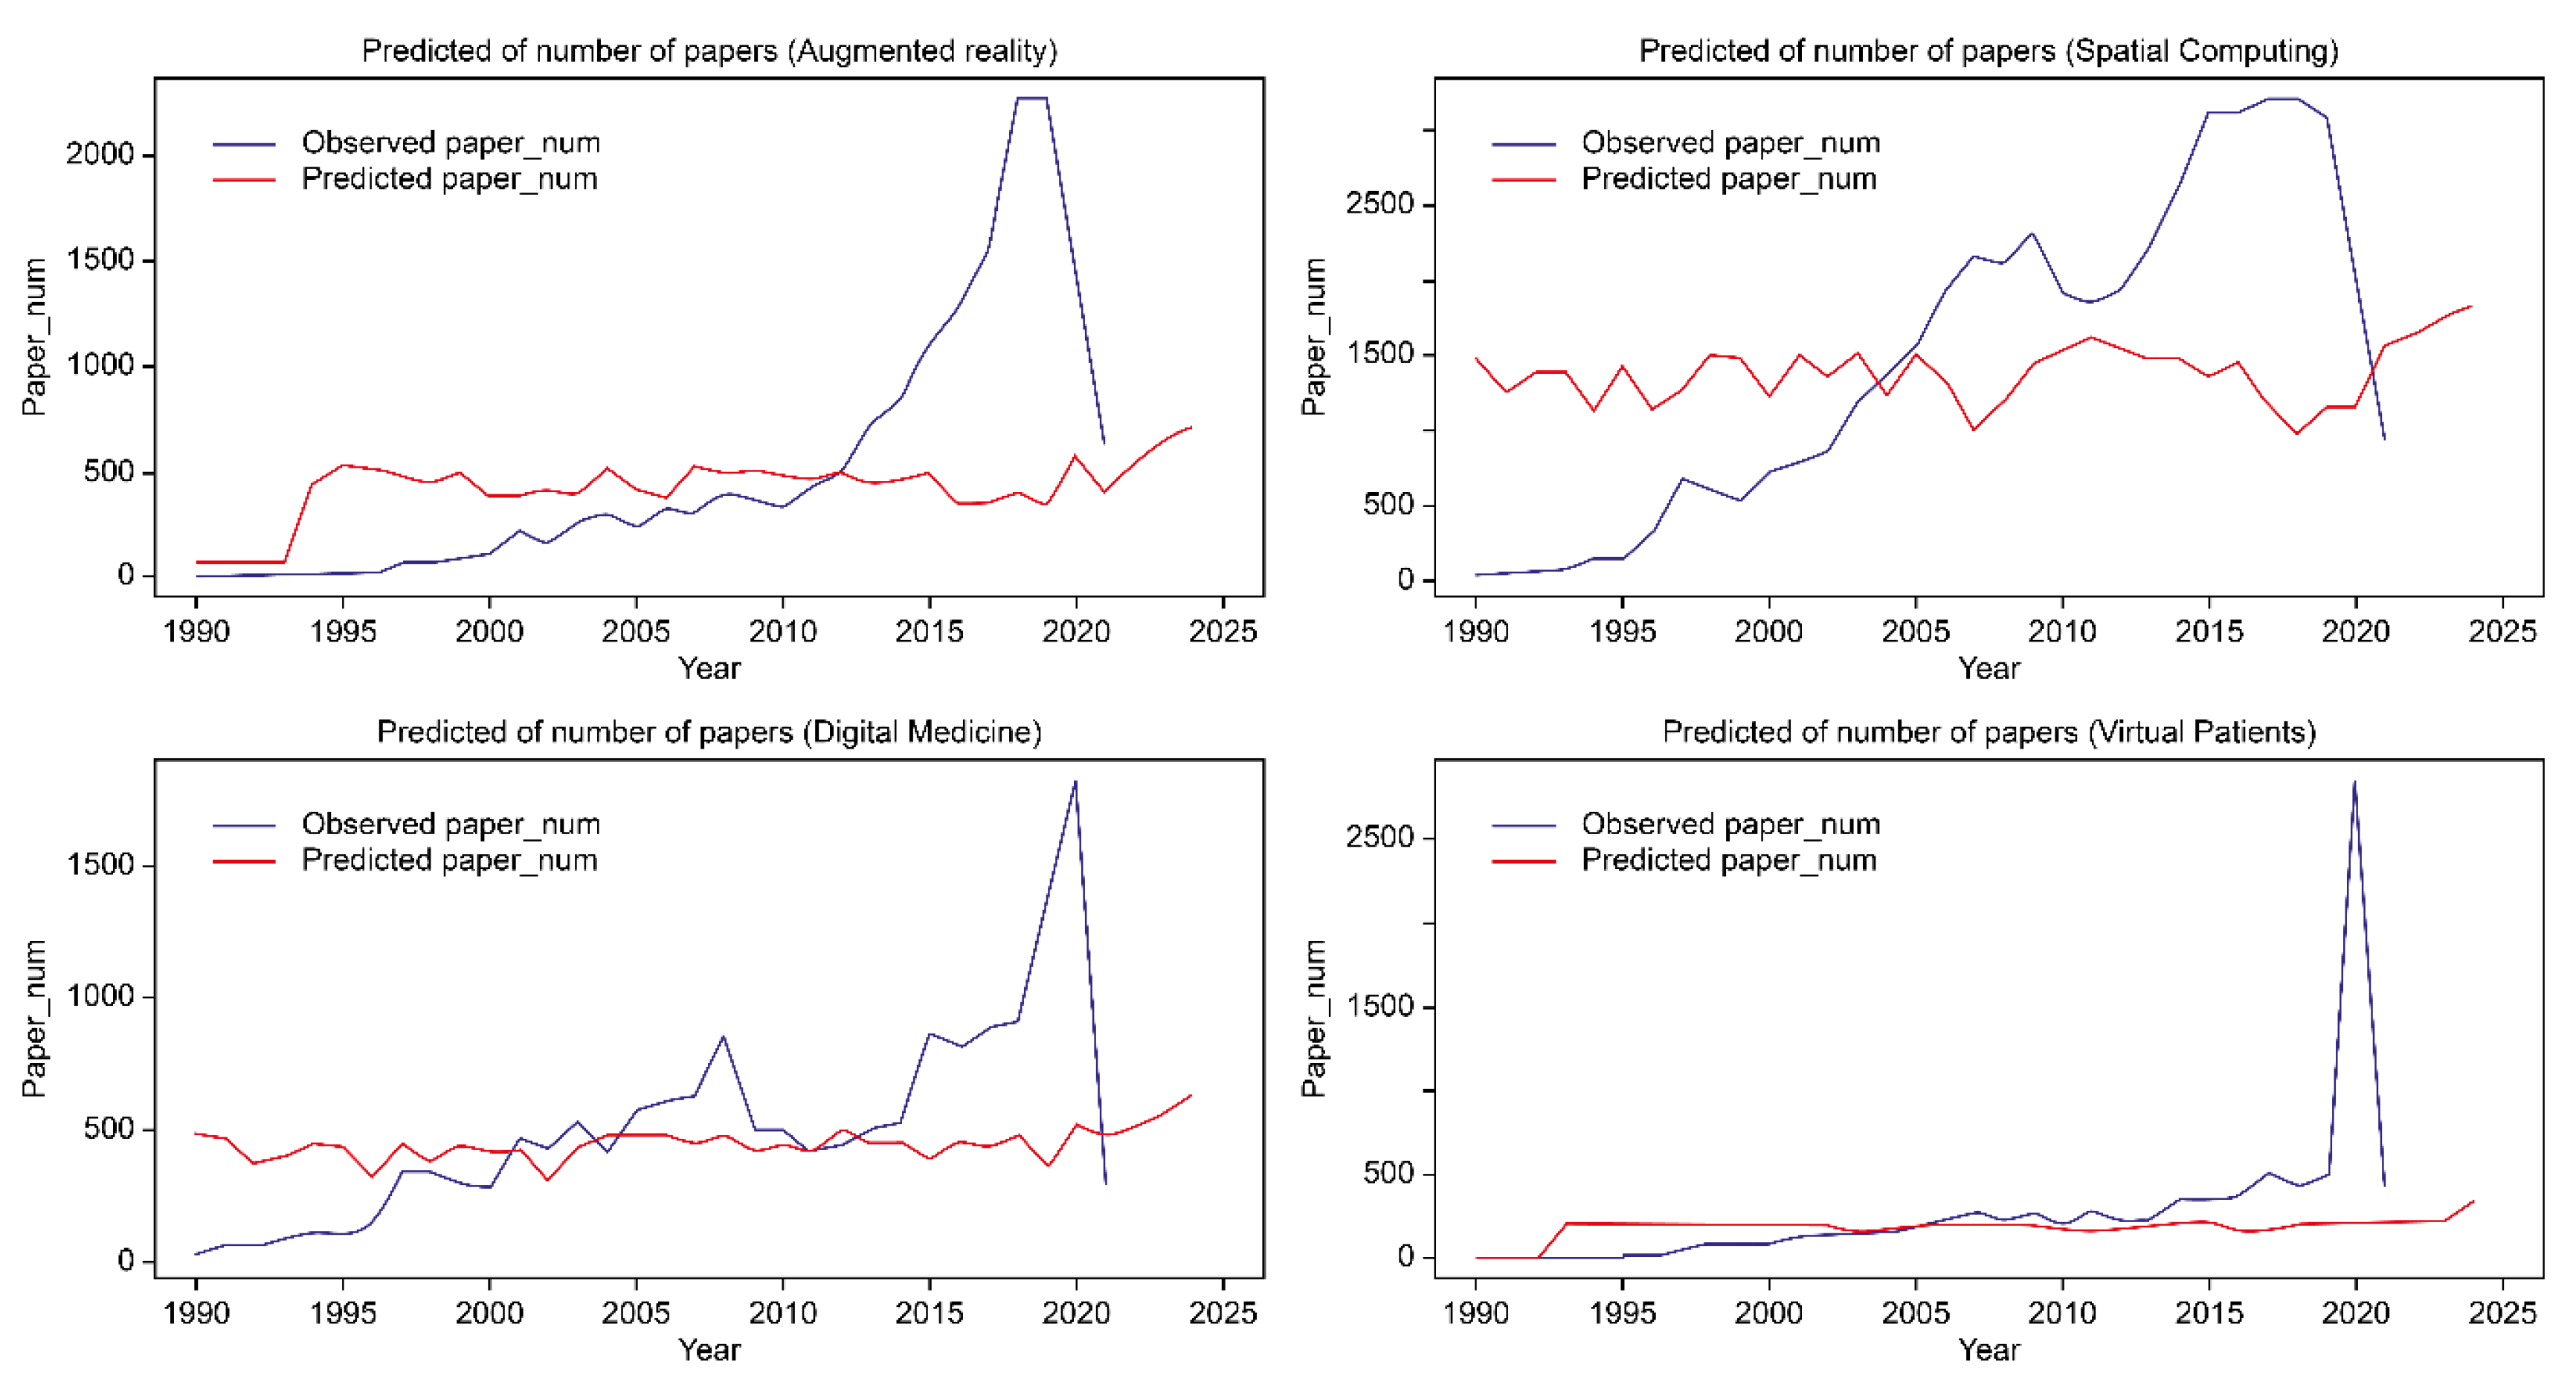
2.4. Results of SCI Paper Analysis
3. Conclusions
Supplementary Materials
Funding
Institutional Review Board Statement
Informed Consent Statement
Data Availability Statement
Conflicts of Interest
References
- Miles, I. The development of technology foresight: A review. Technol. Forecast. Soc. Chang. 2010, 77, 1448–1456. [Google Scholar] [CrossRef]
- Firat, A.K.; Woon, W.L.; Madnick, S. Technological Forecasting—A Review; Composite Information Systems Laboratory (Confederazione Italiana Sindacati Lavoratori); Massachusetts Institute of Technology: Cambridge, MA, USA, 2008. [Google Scholar]
- Grupp, H.; Linstone, H.A. National technology foresight activities around the globe. Technol. Forecast. Soc. Chang. 1999, 60, 85–94. [Google Scholar] [CrossRef]
- Pietrobelli, C.; Puppato, F. Technology foresight and industrial strategy. Technol. Forecast. Soc. Chang. 2016, 110, 117–125. [Google Scholar] [CrossRef]
- Cho, Y.; Yoon, S.-P.; Kim, K.-S. An industrial technology roadmap for supporting public R&D planning. Technol. Forecast. Soc. Chang. 2016, 107, 1–12. [Google Scholar] [CrossRef]
- Barnes, S.J.; Mattsson, J. Understanding current and future issues in collaborative consumption: A four-stage Delphi study. Technol. Forecast. Soc. Chang. 2016, 104, 200–211. [Google Scholar] [CrossRef]
- Yoon, J.; Kim, K. Identifying rapidly evolving technological trends for R&D planning using SAO-based semantic patent networks. Scientometrics 2011, 88, 213–228. [Google Scholar] [CrossRef]
- Yeo, W.; Kim, S.; Park, H.; Kang, J. A bibliometric method for measuring the degree of technological innovation. Technol. Forecast. Soc. Chang. 2015, 95, 152–162. [Google Scholar] [CrossRef]
- Jun, S. A forecasting model for technological trend using unsupervised learning. In Communications in Computer and Information Science; Springer: Berlin, Germany, 2011; pp. 51–60. [Google Scholar] [CrossRef]
- Furukawa, T.; Mori, K.; Arino, K.; Hayashi, K.; Shirakawa, N. Identifying the evolutionary process of emerging technologies: A chronological network analysis of World Wide Web conference sessions. Technol. Forecast. Soc. Chang. 2015, 91, 280–294. [Google Scholar] [CrossRef]
- Chen, Y.; Luh, P.B.; Guan, C.; Zhao, Y.; Michel, L.D.; Coolbeth, M.A.; Friedland, P.B.; Rourke, S.J. Short-term load forecasting: Similar day-based wavelet neural networks. IEEE Trans. Power Syst. 2010, 25, 322–330. [Google Scholar] [CrossRef]
- Zhou, M.; Wang, B.; Guo, S.; Watada, J. Multi-objective prediction intervals for wind power forecast based on deep neural networks. Inf. Sci. 2021, 550, 207–220. [Google Scholar] [CrossRef]
- Mudassir, M.; Bennbaia, S.; Unal, D.; Hammoudeh, M. Time-series forecasting of bitcoin prices using high-dimensional features: A machine learning approach. Neural Comput. Appl. 2020, 1–15. [Google Scholar] [CrossRef]
- Cai, H.; Wu, Z.; Huang, C.; Huang, D. Wind power forecasting based on ensemble empirical mode decomposition with generalized regression neural network based on cross-validated method. J. Electr. Eng. Technol. 2019, 14, 1823–1829. [Google Scholar] [CrossRef]
- Gui, M.; Xu, X. Technology forecasting using deep learning neural network: Taking the case of robotics. IEEE Access 2021, 9, 53306–53316. [Google Scholar] [CrossRef]
- Zhou, Y.; Dong, F.; Liu, Y.; Li, Z.; Du, J.F.; Zhang, L. Forecasting emerging technologies using data augmentation and deep learning. Scientometrics 2020, 123, 1–29. [Google Scholar] [CrossRef]
- Lee, J.Y.; Ahn, S.; Kim, D. Deep learning-based prediction of future growth potential of technologies. PLoS ONE 2021, 16, e0252753. [Google Scholar] [CrossRef]
- Tran, Q.K.; Song, S. Water level forecasting based on deep learning: A use case of Trinity River-Texas-The United States. J. KIISE 2020, 44, 607–612. [Google Scholar] [CrossRef]
- Cho, W.; Kang, D. Estimation method of river water level using LSTM. In Proceedings of the Korea Conference on Software Engineering, Busan, Korea, 20–22 December 2017; pp. 439–441. [Google Scholar]
- Kim, H.; Tak, H.; Cho, H. Design of photovoltaic power generation prediction model with recurrent neural network. J. KIISE 2019, 46, 506–514. [Google Scholar] [CrossRef]
- Son, H.; Kim, S.; Jang, Y. LSTM-based 24-h solar power forecasting model using weather forecast data. KIISE Trans. Comput. Pract. 2020, 26, 435–441. [Google Scholar] [CrossRef]
- Yi, H.; Bui, K.N.; Seon, C.N. A deep learning LSTM framework for urban traffic flow and fine dust prediction. J. KIISE 2020, 47, 292–297. [Google Scholar] [CrossRef]
- Jo, S.; Jeong, M.; Lee, J.; Oh, I.; Han, Y. Analysis of Correlation of Wind Direction/Speed and Particulate Matter (PM10) and Prediction of Particulate Matter Using LSTM. In Proceedings of the Korea Computer Congress, Busan, Korea, 2–4 July 2020; pp. 1649–1651. [Google Scholar]
- Munir, M.S.; Abedin, S.F.; Alam, G.R.; Kim, D.H.; Hong, C.S. RNN based energy demand prediction for smart-home in smart-grid framework. In Proceedings of the Korea Conference on Software Engineering, Busan, Korea, 20–22 December 2017; pp. 437–439. [Google Scholar]
- Kwon, D.; Kwon, S.; Byun, J.; Kim, M. Forecasting KOSPI Index with LSTM deep learning model using COVID-19 data. In Proceedings of the Korea Conference on Software Engineering, Seoul, Korea, 5–11 October 2020; Volume 270, pp. 1367–1369. [Google Scholar]
- Fischer, T.; Krauss, C. Deep learning with long short-term memory networks for financial market predictions. Eur. J. Oper. Res. 2018, 270, 654–669. [Google Scholar] [CrossRef]
- Noh, S.-H. Analysis of gradient vanishing of RNNs and performance comparison. Information 2021, 12, 442. [Google Scholar] [CrossRef]
- Wu, H.; Salton, G. A comparison of search term weighting: Term relevance vs. inverse document frequency. ACM SIGIR Forum 1981, 16, 30–39. [Google Scholar] [CrossRef]


| No. | 2018 | 2019 | 2020 | 2021 |
|---|---|---|---|---|
| 1 | Augmented reality | Bioplastics for a circular economy | Microneedles for painless injections and tests | Decarbonization rises |
| 2 | Personalized medicine | Social robots | Sun-powered chemistry | Crops that self-fertilize |
| 3 | AI-led molecular design | Lenses for miniature devices | Virtual patients | Breath sensors diagnose disease |
| 4 | More capable digital helpers | Disordered proteins as drug targets | Spatial computing | On-demand drug manufacturing |
| 5 | Implantable drug-making cells | Smarter fertilizers can reduce environmental contamination | Digital medicine | Energy from wireless signals |
| 6 | Gene drive | Collaborative telepresence | Electric aviation | Engineering better ageing |
| 7 | Algorithm for quantum computers | Advanced food tracking and packing | Lower-carbon cement | Green ammonia |
| 8 | Plasmonic materials | Safer nuclear reactors | Quantum sensing | Biomarker devices go wireless |
| 9 | Lab-grown meat | DNA data for storage | Green hydrogen | Houses printed with local materials |
| 10 | Electroceuticals | Utility-scale storage of renewable energy | Whole-genome synthesis | Space connects the globe |
| No. | 2018 | 2019 | 2020 | 2021 | Sum |
|---|---|---|---|---|---|
| 1 | 41,088/16,204 | 0/234 | 0/5 | 0/25 | |
| 2 | 134/745 | 91/4267 | 0/1 | 0/3 | |
| 3 | 0/14 | 0/31 | 91/8923 | 0/16 | |
| 4 | 0/51 | 0/11 | 209/46,898 | 0/13 | |
| 5 | 0/5 | 0/124 | 49/16,237 | 0/0 | |
| 6 | 152/737 | 6/154 | 7/1594 | 0/0 | |
| 7 | 2/7 | 0/6 | 0/32 | 12/455 | |
| 8 | 360/1735 | 1/980 | 279/4732 | 0/0 | |
| 9 | 0/0 | 18/128 | 40/3314 | 0/0 | |
| 10 | 27/14 | 0/36 | 5/27 | 0/0 | |
| Sum | 41,763/19,512 | 116/5971 | 680/81,763 | 12/512 | 42,571/107,758 |
| No. | Technology | Rate of Increase | Accuracy (%) |
|---|---|---|---|
| 1 | Augmented reality | 106.8433 | 78.62 |
| 2 | Collaborative telepresence | 0.049675 | 73.44 |
| 3 | Digital medicine | 0.2259 | 94.50 |
| 4 | DNA data storage | 0.00825 | 96.85 |
| 5 | Electric aviation | 0.037975 | 82.18 |
| 6 | Electroceuticals | 0.40255 | 93.50 |
| 7 | Gene drive | 0.092075 | 94.76 |
| 8 | Green ammonia | −0.00878 | 79.60 |
| 9 | Green hydrogen | 0.22745 | 90.70 |
| 10 | Personalized medicine | 0.447675 | 94.41 |
| 11 | Plasmonic materials | 2.45425 | 95.53 |
| 12 | Quantum sensing | 1.8588 | 97.55 |
| 13 | Social robots | 0.82 | 92.17 |
| 14 | Spatial computing | 2.295025 | 94.50 |
| 15 | Virtual patients | 2.4056 | 92.62 |
| 16 | Whole-genome synthesis | 0.0077 | 89.36 |
| (a) Keywords of Plasmonic Materials | |||
| Word | TF | DF | TF_IDF |
| Layer | 355 | 103 | 442.77 |
| Material | 353 | 124 | 375.36 |
| Surface | 326 | 130 | 331.36 |
| Structure | 158 | 49 | 312.78 |
| Peg | 133 | 36 | 303.34 |
| Light | 194 | 78 | 295.31 |
| Optical | 158 | 59 | 283.97 |
| Region | 108 | 26 | 280.35 |
| Waveguide | 126 | 50 | 246.94 |
| Plasmonic | 206 | 111 | 241.67 |
| Metal | 105 | 39 | 231.29 |
| Devices | 166 | 91 | 227.40 |
| Transducer | 186 | 106 | 226.70 |
| Least | 179 | 102 | 224.99 |
| Positioned | 109 | 46 | 222.52 |
| Magnetic | 105 | 43 | 221.28 |
| Portion | 114 | 51 | 221.21 |
| Substrate | 150 | 84 | 217.35 |
| Nft | 109 | 50 | 213.62 |
| Dielectric | 102 | 44 | 212.67 |
| Nearfield | 100 | 48 | 199.98 |
| Oxide | 69 | 21 | 193.24 |
| Configured | 105 | 59 | 188.72 |
| Device | 115 | 74 | 181.03 |
| Field | 131 | 90 | 180.88 |
| Film | 70 | 29 | 174.33 |
| Thereof | 73 | 33 | 172.67 |
| Conductive | 70 | 30 | 172.04 |
| Electromagnetic | 66 | 26 | 171.32 |
| (b) Keywords of Quantum Sensing | |||
| Word | TF | DF | TF_IDF |
| Layer | 203 | 45 | 369.53 |
| Material | 285 | 93 | 315.12 |
| Light | 181 | 54 | 297.14 |
| Quantum | 152 | 42 | 286.94 |
| Diamond | 150 | 41 | 286.70 |
| Optical | 180 | 59 | 279.83 |
| Magnetic | 171 | 67 | 244.44 |
| Spin | 80 | 13 | 240.79 |
| Field | 122 | 47 | 216.89 |
| Excitation | 97 | 32 | 208.79 |
| Device | 183 | 90 | 208.27 |
| Semiconductor | 132 | 58 | 207.43 |
| Nanometers | 48 | 4 | 193.90 |
| Configured | 124 | 59 | 192.77 |
| Signal | 102 | 42 | 192.55 |
| Region | 72 | 20 | 187.52 |
| Substrate | 105 | 49 | 182.38 |
| Source | 98 | 44 | 180.55 |
| Surface | 90 | 41 | 172.02 |
| Frequency | 83 | 39 | 162.69 |
| Defect | 61 | 19 | 161.85 |
| Diode | 55 | 14 | 161.75 |
| Detector | 97 | 56 | 155.77 |
| System | 87 | 53 | 144.42 |
| Sensor | 61 | 26 | 143.54 |
| Magnetooptical | 46 | 12 | 141.87 |
| Unit | 41 | 8 | 141.52 |
| Micro | 44 | 11 | 139.22 |
| Array | 57 | 25 | 136.28 |
| No. | Technology | Rate of Increase | Accuracy (%) |
|---|---|---|---|
| 1 | Advanced food tracking and packaging | 0.039575 | 84.32 |
| 2 | AI-led molecular design | 0.022825 | 91.39 |
| 3 | Algorithms for quantum computers | 0.013575 | 82.32 |
| 4 | Augmented reality | 78.9371 | 81.91 |
| 5 | Bioplastics for a circular economy | 2.066675 | 94.70 |
| 6 | Breath sensors diagnose disease | 0.015575 | 74.27 |
| 7 | Collaborative telepresence | −0.23878 | 92.32 |
| 8 | Decarbonization rises | −0.04815 | 88.86 |
| 9 | Digital medicine | 39.60455 | 85.55 |
| 10 | Disordered proteins as drug targets | 0.003725 | 76.20 |
| 11 | DNA data for storage | −0.31628 | 91.49 |
| 12 | Electric aviation | 3.43585 | 76.81 |
| 13 | Electroceuticals | 0.094375 | 90.43 |
| 14 | Gene drive | 0.116 | 81.29 |
| 15 | Green ammonia | 1.25715 | 94.31 |
| 16 | Green hydrogen | 2.0026 | 92.00 |
| 17 | Implantable drug-making cells | 0.0007 | 73.12 |
| 18 | Lower-carbon cement | 0.158525 | 84.36 |
| 19 | Microneedles for painless injections and tests | 0.0023 | 73.42 |
| 20 | More capable digital helpers | 0.33175 | 89.39 |
| 21 | On-demand drug manufacturing | 0.0144 | 88.04 |
| 22 | Personalized medicine | 1.216357 | 88.90 |
| 23 | Plasmonic materials | 6.9311 | 84.02 |
| 24 | Quantum sensing | 5.735575 | 71.52 |
| 25 | Safer nuclear reactors | −0.0415 | 84.85 |
| 26 | Smarter fertilizers can reduce environmental contamination | −0.16527 | 95.13 |
| 27 | Social robots | 9.46255 | 76.76 |
| 28 | Spatial computing | 71.04438 | 70.20 |
| 29 | Tiny lenses for miniature devices | 0.097625 | 75.01 |
| 30 | Utility-scale storage of renewable energy | −0.29128 | 93.85 |
| 31 | Virtual patients | 34.59743 | 93.26 |
| 32 | Whole-genome synthesis | 0.053025 | 87.81 |
| Technology | Rate of Increase (SCI Papers) | Rate of Increase (Patents) |
|---|---|---|
| Augmented reality | 78.9371 | 106.8433 |
| Spatial computing | 71.04438 | 2.295025 |
| Digital medicine | 39.60455 | 0.2259 |
| Virtual patients | 34.59743 | 2.4056 |
| Social robots | 9.46255 | 0.82 |
| Plasmonic materials | 6.9311 | 2.45425 |
| Quantum sensing | 5.735575 | 1.8588 |
| Electric aviation | 3.43585 | 0.037975 |
| Green hydrogen | 2.0026 | 0.22745 |
| Personalized medicine | 1.216357 | 0.447675 |
| Gene drive | 0.116 | 0.092075 |
| Electroceuticals | 0.094375 | 0.40255 |
| Whole-genome synthesis | 0.053025 | 0.0077 |
Publisher’s Note: MDPI stays neutral with regard to jurisdictional claims in published maps and institutional affiliations. |
© 2022 by the author. Licensee MDPI, Basel, Switzerland. This article is an open access article distributed under the terms and conditions of the Creative Commons Attribution (CC BY) license (https://creativecommons.org/licenses/by/4.0/).
Share and Cite
Noh, S.-H. Predicting Future Promising Technologies Using LSTM. Informatics 2022, 9, 77. https://doi.org/10.3390/informatics9040077
Noh S-H. Predicting Future Promising Technologies Using LSTM. Informatics. 2022; 9(4):77. https://doi.org/10.3390/informatics9040077
Chicago/Turabian StyleNoh, Seol-Hyun. 2022. "Predicting Future Promising Technologies Using LSTM" Informatics 9, no. 4: 77. https://doi.org/10.3390/informatics9040077
APA StyleNoh, S.-H. (2022). Predicting Future Promising Technologies Using LSTM. Informatics, 9(4), 77. https://doi.org/10.3390/informatics9040077