Article

Self-Reinforcement Mechanisms of Sustainability and Continuous System Use: A Self-Service Analytics Environment Perspective

1
Informatics Department, Linnaeus University, 35195 Vaxjo, Sweden
2
Independent Researcher, 8737 Angeline Ct., Lincoln, NE 68526, USA
*
Author to whom correspondence should be addressed.
Informatics 2021, 8(3), 45; https://doi.org/10.3390/informatics8030045
Submission received: 11 June 2021 / Revised: 3 July 2021 / Accepted: 12 July 2021 / Published: 15 July 2021
(This article belongs to the Section Machine Learning)

Abstract

:
The capabilities of the people, processes, and technology are important factors to consider when exploring continuous use to create value. Multiple perceptions and attitudes towards self-service systems lead to various usage levels and outcomes. With complex analytical structures, organizations need a better understanding of IS value and users’ satisfaction. Incompatibility reduces the purpose of self-service analytics, decreasing its value and making it obsolete. In a qualitative, single case study, 20 interviews in a major digital Scandinavian marketplace were explored using the expectation–confirmation theory of continuous use to explore the mechanisms influencing the sustainability of self-service value. Two main mechanisms were identified: the personal capability reinforcement mechanism and the environment value reinforcement mechanism. This study contributes to the post-implementation and continuous use literature and self-service analytics literature and provides some practice implications to the related industry.

1. Introduction

IS becomes a valuable resource with social capital and trust from users by an integrated process towards sustainability outcomes [1]. Value creation is influenced by the interdependency of economic conditions, different resources, and processes [2,3,4]. In sustainable business models, sufficiency encourages value creation that generates environmental and social benefits [5]. Machine learning, deep learning, network analytics, real-time analytics, and visualization help bridge the gap between the complex data sets and computing systems and user needs [6]. However, these underlining systems can have different effects on reuse intentions, perceived usefulness, and cognitive load for novices’ behavior and preferences versus more experienced decision-makers when decisions require knowledge from outside of the system’s capabilities [7]. Given the dynamic surroundings, data and information quality-related problems, lack of training, and loss of power can reduce the users’ motivation towards the post-adoption of an IS [8].
Recent research has shown that technology cannot exist separated from the social systems for sustainability, but it is a technological cluster consisting of different scientific, political, economic, and cultural characteristics in a particular social environment [9]. In technology, Business Analytics (BA) is “a broad category of applications, technologies and processes for gathering, storing, accessing and analyzing data to make better decisions” [10]. The BA system and the analytical environment are valued for assisting users with decision-making through insight discovery [11,12,13]. In processing data, BA cleans, integrates, validates, and organizes information until a more comprehensible and value-embedded visualization is presented to decision-makers, who in turn develop insights to make informed decisions and take competitive actions. Self-Service Analytics (SSA) has recently emerged as a new approach to BA, allowing various employees at different organizational levels to independently build custom reports and explore previous ones without relying on the IT/BA department [14]. As a result, and with the support of the analytical environment, the user’s role shifts from a consumer to more of a consumer-producer and expands the involvement of business users, allowing them not only to consume information but also to author information [15,16,17]. The shift in user role has made data analytics more personal and its value subjective to the user’s needs, which highlights the need to maintain a certain level of value and hence support continuous use.
Perceived value (PEVA) exerts a significant positive effect on continuous usage intentions toward m-banking services [18,19,20]. The perceived proposed value aims to explain the extent to which the system meets the user’s requirements in terms of perceived usability and perceived enjoyment [21,22,23]. When value fades out, the IS becomes an obsolete artifact and an economic burden on organizations. Based on the innovation diffusion theory, technology adopters reevaluate their initial decision during a final confirmation stage to use innovation, then decide whether to continue or discontinue [24]. With various levels of concrete or abstract knowledge, each individual has different expectations of the system outcome. Certain features may benefit specific users while other users may perceive little or no benefit from the system’s functionality, reducing the IS use and value.
Many researchers have addressed topics related to the adoption [25,26], diffusion [27], and acceptance [28,29] of information systems [1,2,3]. The initial acceptance of IS is an important first step toward realizing IS success; however, the long-term viability depends on its continued use [30,31]. Several factors have the potential to affect the continuous use of a system. For example, training can inform users to improve their ability to use the system, creating an expectation of potential efficiencies in performance and increasing satisfaction [30]. Behavior and emotion can also influence the confirmation of value, whereas expectation fulfillment relates to the post-adoption expectations at an individual level influencing the perceived usefulness and satisfaction [30,32]. Adoption suggests the user perceives value from the technology benefits to improve performance and reduce effort [33].
Our motivation for this paper is based on two related dimensions. First, SSA aims at empowering business users by enabling them to independently explore data and generate insights using personal capabilities. Such a structure increases the subjectivity of data analytics, hence making PEVA even more subjective. Second, continuous use is tightly associated with the individual re-evaluation of the benefit of the system and therefore motivates continuous adoption. Such evaluation not only depends on the capabilities of the individual but also on how the analytical environment supports and enables value generation. Previous research on continuous use is abundant and addresses different topics; however, very little has been conducted in respect to the self-service environment where users share responsibility in analyzing data and drawing conclusions for better decision-making [4]. This paper is built upon the assumption that the self-service environment differs from other analytical environments due to the nature of co-creation it demands. Both technical employees who enable such an environment and business users who use such an environment to create value in the form of insights collaborate and co-create to enable business user independence and autonomy [5,6].
To be able to explore the tension between the two dimensions, this paper builds on the expectation–confirmation model of continuous uses in disruptive technologies that empower users [34] to explore such tension and develop a sound empirical understanding of how to sustain a continuous use of SSA, hence the environment as a whole. Based on the previous argument, the purpose of the paper is to address the following research question: Which mechanisms potentially cause the sustainability of an analytics environment?
To answer our research question, we adopt a qualitative perspective using 20 qualitative interviews in a major digital Scandinavian marketplace. Our empirical data describe two main mechanisms contributing to the sustainability of an analytical environment. These results contribute to the expectation–confirmation framework of continuous use [30] and sustainability literature [35,36,37].

2. Literature Review

2.1. Sustainability of a System

IS continuity focuses on reinforcing IS value in mature BI systems by combining cloud, cognitive, and mobile technology to improve performance [38]. Increasing business value requires flexibility and reconfigurability regardless of the disruption, integrations, and emergence of technology [39,40]. As technology continues to change work routines, resources and capacities are susceptible to evolution, and supporting their potential creates business value and competitive advantage [41]. Users expect certain information content and system design to meet their requirements [42]. It also involves individuals capable of accomplishing tasks independently with satisfaction to continue system use [34].
Bhattacherjee [30] proposed the expectation–confirmation model (ECM) of IS continuance use to evaluate a comparison between the individual’s attitudes and beliefs at the initial acceptance and continuous intention to use based on the expectation–confirmation theory (ECT) [31] and the technology acceptance model (TAM) [43]. The ECM describes the user’s perceptions and emotions of acceptance and post-adoption satisfaction with the IS, the expectation discrepancies, and product performances [31] using perceived usefulness to explain the intent to use [29,43]. The individual’s expectations toward using the IS in the post-adoption stage could be different from the initial expectations before using it as they gain more experiences [30,44,45].
Previous research has shown evidence that TAM and Task Technology Fit [46] overlap, suggesting attitudes develop into beliefs, then knowledge; therefore, knowledge comes from the rational evaluation of tool functionality and task characteristics [25,28]. Further research has suggested information content and system characteristics influence satisfaction [41], and the satisfaction of the perceived value often reflects adoption [18]. In an analytical environment, the proposed perceived value relates the users’ perceived benefit from the information and system features through customization, flexibility, high quality, content richness, and added services, counterbalancing the perceived sacrifices of time, cost, effort, changing routines, and discomfort [33]. Using analytical environments, interactions influence the employees’ decision-making processes, the internal motivation of psychological empowerment and their ability to accomplish tasks [34]. The perceived capability is based on the fit between the user’s expectations of the useful analytical functions to make decisions and their structural empowerment [34].
In the study, adoption, innovation, and scaling are self-reinforcing mechanisms of roles and interrelationships within a socio-technological configuration of various contextual conditions and actualization or lack of realization that lead to an outcome [35]. Self-reinforcement exists through resource-based compatibility when the incentive is significant enough to generate perceived social benefit for collaboration and increase the adoption and diffusion of IS use [27]. In the socio-technology environment, path-dependent processes are formed to guide actions that lead to a critical moment in time when a dominant action plan occurs, and the self-reinforcing process begins with effective learning, collaboration, resource integration, and willingness to adopt the technology [36,37].
In fact, sustainability occurs with self-reinforcing relationships among the environment, people, and technology to capture innovation [47]. Within the system, incremental changes to radical differences of the system can mitigate the risks and produce innovation that influences the techno-social levels, generating economic sustainability [48]. The dynamic capabilities create a balanced system to drive organizations in loop-like interactions of feedback mechanisms, modifying routines to create innovation and business value [49,50]. Using self-reinforcing logic, organizations co-evolve their dynamic processes to integrate, adjust, gain and release products and services by adapting to economy reconfiguration, expanding to market reconfiguration, and transforming leadership capabilities [51].
To conclude, the sustainability and continuous use of a system is a complex phenomenon to study. The different interrelated parts conceptualized as socio-technical interactions define the current and future interaction with the system. It is not the intention to investigate how adoption or use is achieved considering all constructs and complex relations. However, once a system is adopted and use is established, the previous theoretical framework provides the grounds to understand how continuous use is sustained.

2.2. Self-Service Analytics Environment

Self-Service Analytics (SSA) is an approach to Business Intelligence that enables employees to perform custom analytics for decision-making with limited assistance from the experts [52]. Employees respond quickly to given tasks with SSA, empowering them to make decisions independently, unlike conventional Business Analytics [53]. What characterizes SSA and its environment is the fact that it emphasizes the role of business users in data analytics and transforms data into information and then insights. Business users will engage in several steps that were previously handled by technical people, which creates more responsibility for them [5,7]. As such, SSA becomes more subjective and mostly relies on the individual perception of its value and usefulness.
There are many attempts from both industry and academic researchers to define SSA. Imhoff and White [17] refer to SSA as a facility within the Business Intelligence and Analytics (BI&A) environment. Gartner IT Glossary [53] and Weber [54] describe it as a BI&A system, and Schuff et al. [55] label SSA as an ability. There is no clear definition of SSA. So, what exactly is SSA? Is it a capability within the BI&A environment, does it represent a new system or is it a new approach to BI/BA? Is SSA viewed from a technological lens or does the user play a more important role in defining SSA? We can clearly notice that confusion still dominates and the way SSA is perceived is still vague.
To have a more precise understanding of what the definition of SSA is, it is important to first see what constitutes it. It is obviously clear that it is comprised of two terms: Self-Service (SS) and Analytics (A). The first part, SS, is more related to the individual behavior and preference to be independent, in control, save time and cost and to be efficient [16,56]. It denotes an attitude or ideology toward approaching a certain activity or task. In technology, many studies have investigated the preference of a customer in using a self-service channel over a service encounter [57,58,59,60,61,62]. It is also present in data analytics for decision-making where users tend to be more engaged in self-service activities to solve an analytical task without relying on IT experts [15,16,17,63,64,65]. The self-service phenomenon is not only present in technology, but in our daily lives. For example, some people prefer to service their own cars such as changing the engine oil (if they have the expertise) instead of going to the service center, and some others prefer to self-study and home study instead of going to an educational institution. This phenomenon is gaining much attention because of its increase in our societies, especially when many services are shifting from a service encounter (human to human interaction) to digitalized self-services (human to technology interaction) such as in banking, airlines, supermarkets, hotels, etc. [57,58,59,62]. The second part is A, denoted as a collection of technologies and processes that are available for data analysis and decision-making rather than a single information system.
SSA can be seen first as an approach to business analytics rather than the adoption of a certain technology [52]. In other words, it is the technology readiness within the organizational environment and the willingness of a user to engage in self-service activities using the resources available for the ultimate aim of solving an analytical task independently. Second, the SSA approach is enabled by an environment that provides services to support the independence of users. Those services, such as tools and technology, access clean and meaningful data and technical and business support when needed, and are provided and managed by an IT/BI department. In other words, the IT/BI department provides specific services to enable SSA and, in turn, the users engage in data analytics independently using those resources. Once the IT/BI department enables such a service environment, they can focus on more advanced tasks rather than answering individual ad hoc requests. As such, this paper depicts the SSA environment as a service environment within the organization aiming at facilitating the self-service approach to business analytics.

3. Method

The nature of case study research and the range of its research alternatives make it highly convenient for researchers in general and IS researchers in particular. Yin [66] (p. 16) defines a case study as “an empirical inquiry that investigates a contemporary phenomenon in depth and within its real-world context, especially when the boundaries between phenomenon and context may not be clearly evident”. The definition of Yin [66] highlights three major components of a case study: contemporary phenomenon, real-world context, and vague boundaries between the phenomenon and its context.
In connection to this study, the self-service analytics environment is a relatively new phenomenon being promoted by the industry expecting to create value to organizations in their specific context. As such, a qualitative case study allows the exploration of the research topic and subject in a detailed view so as to obtain a deeper understanding of the phenomenon [67], which is in line with the aim of this study.
Generally, qualitative research and especially case studies equip researchers with a set of tools for conducting research when other approaches would be difficult or would simply neglect important factors.

3.1. Case Company

The empirical data were collected at a major Scandinavian digital marketplace. The company was founded in 1996, focusing on classified advertisements but with a great vision. Today, the company has grown from being a digital marketplace into a data service provider providing statistics about real estate, monetary statistics on vacation rentals, statistics about population clusters and concentration in specific areas and including different parties such as governments, newspapers, students, and research labs. It has become a central data repository to where agencies (private and governmental) constantly send requests regarding various statistical analyses and ad hoc reports. In addition, high profile sellers request reports from marketing and sales departments with regard to their advertisement reach and investment values. Due to the increase in the number of stakeholders and growing digitalization, in 2010 the management decided to build a more agile and data-driven environment where employees could easily access any organizational data and use them to perform their daily tasks more independently and with more agility. For that purpose, a self-service approach to data analytics has been adopted with the aim to empower employees and augment their capability and agility in answering requests from external customers together with fulfilling their own needs in terms of report creation and problem and opportunities investigation, making such an organization an ideal subject for our investigation.

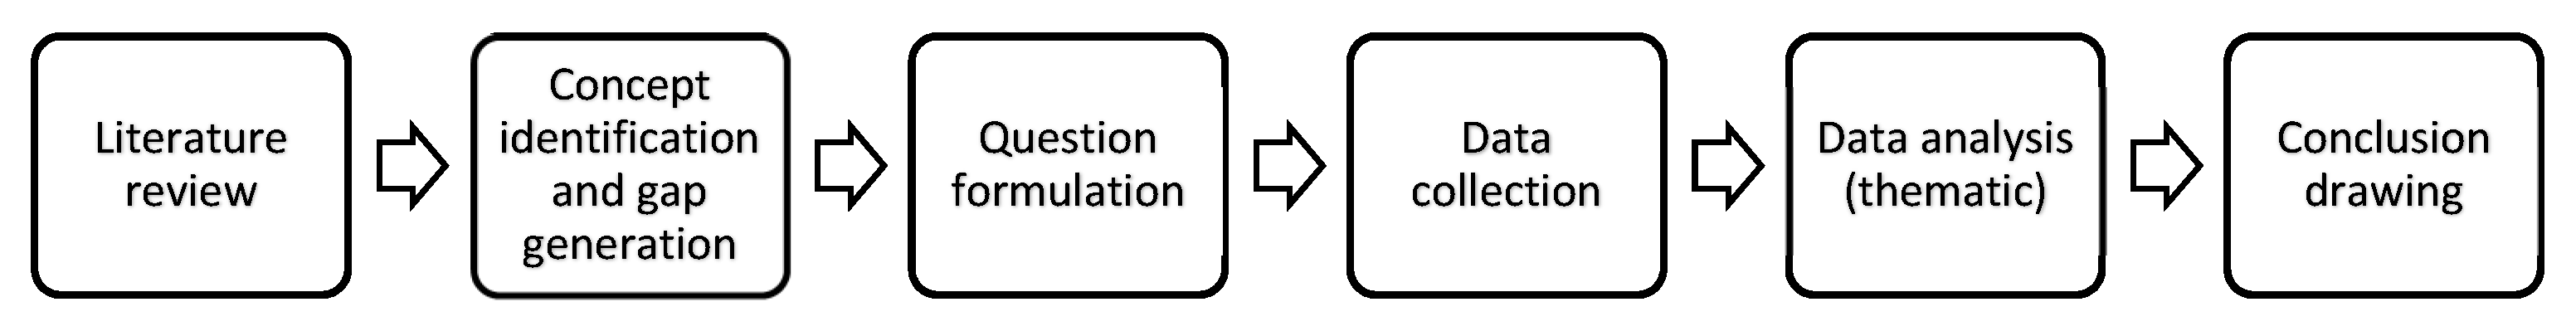
3.2. Data Collection and Analysis

In this qualitative single case study, 20 participants were interviewed. It was considered an appropriate count for the study when the final analysis provided no new themes and there was no need to gather nuanced data [68]. The data collection and analysis followed a structured process agreed upon by both researchers (see Figure 1).
For example, themes were about the organizational environment or users’ beliefs and feelings about data analytics. To gain a holistic picture, participants in different positions from different departments were selected. The selection was based on a snowball sampling strategy [69] in an effort to capitalize the expert experience within the organization and provide a starting point for the interviews. Each participant pointed out other potential participants explicitly or implicitly through drawing “mock-ups” explaining the role of data in communicating with different employees (see Figure 2).
A total of 20 interviews were conducted with employees at different positions in the organization. The interviews lasted between 30 min and 3 h depending on the position, responsibilities, and involvement with data analysis. Confidentiality was maintained by not disclosing the name, age, gender and detailed position in the organization. To minimize the bias and influence of the interviewer in collecting data, interviews were recorded (with the consent of the participant) and transcribed verbatim and sent later to the participant together with the notes taken during the interviews for validation [70].
The data analysis started during the interviews. It was important to take notes in relation to the discussion with the interviewee. These notes were cross validated with the interview transcriptions, which resulted in a preliminary scanning of the interview contents. During this review, we noticed initial themes (see Table 1). Further data analysis and coding processes occurred with “Nvivo10”, a qualitative data analysis software. Using the tool, we created a concept map based on the literature, code nodes helping the organization of ideas and enabling a structured data analysis. This study employed two levels of coding schema, etic and emic, introduced by Miles and Huberman [71].
The first level of coding (etic) was built upon our conceptual basis. These codes were more general in nature as they reflected general concepts such as “user capabilities” and “environment quality”. The second level of coding (emic) was more iterative in nature and nested inside each general code. In the second level of coding, each author developed codes separately and then cross-validated it with the other. The iterations further decomposed the general codes targeting a more specific role, as will be discussed in the next chapter.

4. Findings

The thematic analytic analysis revealed three categories and eight themes of factors explaining why mechanisms potentially cause the sustainability of an analytics environment. During the analysis, previous research was reviewed for each category to investigate the relationship and its influence on continuous use. Quotations from the empirical material will be used to describe the context of the categories to explain why the mechanism potentially causes the sustainability of an analytics environment and why it occurs.

4.1. Environment Value

4.1.1. Fit for Purpose and Performance on Value

The concept of fit corresponds to the empirical evidence and previous research [25,72], as it is associated with the abilities of the users and the task requirement. Adoption decisions based on the evaluation of the benefits and risks reflect a cost–benefit paradigm to determine the perceived value [18,33,73]. Balancing cost and benefit outcomes fit for purpose focuses on the decision-making performance of identification access and data interpretation between the task, system, and individual’s characteristics to use or not to use a system [46]. User perceived usefulness and decision quality affect the intentions to continue use [23,74]. The users describe how they make decisions, “my goal is to build better and well performing products and do the right decisions”, “When we make like yeah business decisions and it’s based upon the data that we have available”,it’s more about taking decisions based on data”. The outcome is based on the performance of the technology and the user’s ability to read and interpret the results, “can read outperformance and compare the performance of each solution”, and, “It’s like you test one version of the user interface against another and you measure what performs best.” Often, performance is based on the interpretation of results or prioritization of tasks and problems. As one respondent remarked, “You probably already know our organization focus on being data driven so every decision or our strategy and product priority should be based on data and also how we develop and design our services should be based on what the data tells you and our product development process is based on data in every step.”

4.1.2. Information and System Quality on Utilization

User perception of information quality and system quality on the ease of use and usefulness influencing utilization is common in previous research [25,26,28]. DeLone and McLean [73] described information and system quality as the desired characteristics that measure user satisfaction impacting the use of the system. It can improve individual productivity, enhance decision-making effectiveness, and strengthen problem identification capabilities [72]. With complex environments, users interact with the system to gain an understanding of internal and external changes, solve problems, answer questions, monitor activities, and coordinate tasks, “using the tools and understanding the data ourselves”, “we have sort of all the data just to try to see what I can get out”, “I sit and play with data and looking for some answers to solve questions”. One of the respondents responded, “It is very important to have the right inputs all the time in the CRM system then we get better data in data warehouse”. Value-added services can increase users’ perceived benefit to adding value when interacting with a product to provide new services [33]. In SSA environments, users look for data to meet their needs (e.g., “definitely the data quality”, “I sit and play with data and looking for some answers to solve questions”, “recommendations based on the quality of the data or the traffic data”). Data management is important because of big data, so as one respondent replied, “configuration for sale in the last 10 years that is going to help us understand which part of the product to stay focused on so to some extent I would say definitely the data quality and how we treat is going to be a key of how we treat data”. With data quality, utilization occurs for reasons “to make better products, use it as your final answer, do a KPI report, and to monitor and forecast”.

4.1.3. Value-Added Services on Continuous Use

Users perceived extrinsic and intrinsic benefits from task accomplishments and enjoyment that increase the system’s value [18,33,73]. Value-added services can increase users’ perceived benefit to adding value when interacting with a product to provide new services [33]. As users interact with a system, they gather data and share knowledge about the information with other teams and users. Business users find benefit because the system provides the users with “aggregated data”, “slice or drill into this data”, “data capacity”, “help extracting or to manipulate the data”, and “work more cross-functional”. Users find these benefits are approaches for using the system to exploit and explore data.

4.2. Personal Capabilities

4.2.1. Trust and Confirmation on Satisfaction

Trust and confirmation have been shown to influence behavior and attitudes, while trust is highly impacted by changing environments [75]. Expectation–confirmation demonstrates a positive effect on users’ benefits and their beliefs and attitudes. It entails meeting the users’ requirements to fulfill their expectations and ensure their trust concerning verifying data accuracy, understanding the problem’s results, delivering timely information, combining data, supporting decisions, and gaining confidence: “we can trust and use as a guidance”, “it was so slow we didn’t trust it, so we created our own way”, “if you don’t know this background information…it’s sort of hard to trust…,so I’ve been working with this classifieds a lot so I am pretty confident with it.”, “Yes, it’s all about trust.”, “if you get to trust X you can use them less, and it proves to be more efficient”, and “that’s a trust issue”. Many of the users gain trust by gaining an understanding of the data. As users confirmed their trust in the data, they became more confident and satisfied with the results. One respondent reported, “we have used [the data] for testing so they [UX team] have a load of competence on… also one thing is the analytics and the statistic department, but also how to do experiments and statistical.”

4.2.2. Expectation on Usefulness

Users expect visual attractiveness, user-friendliness, and convenience in receiving services from systems to meet their continuous and changing needs [21]. Personalization creates an environment where users are able to customize an analytical report based on their own preferences [33]. As mentioned earlier, users employ various strategies to accomplish tasks, building interactive preferences of the self-service system and other users. The comments related to the system regarded the data process to solve a problem, tool preference to analyze data, data extraction, data metrics, and tool familiarity. One respondent commented, “Excel, Adobe, Tableau and then I sometimes use different tools to scrape website [data] in order to get data structures of competitors… I use Google Analytics as well.” After users gather information, they expect others to review reports, data, or presentations and help support the environment to create a data-driven culture. Many users want a feedback loop or communication to benefit from the SSA (e.g., “we do and we get feedback from the customer center when our users have problems…”)

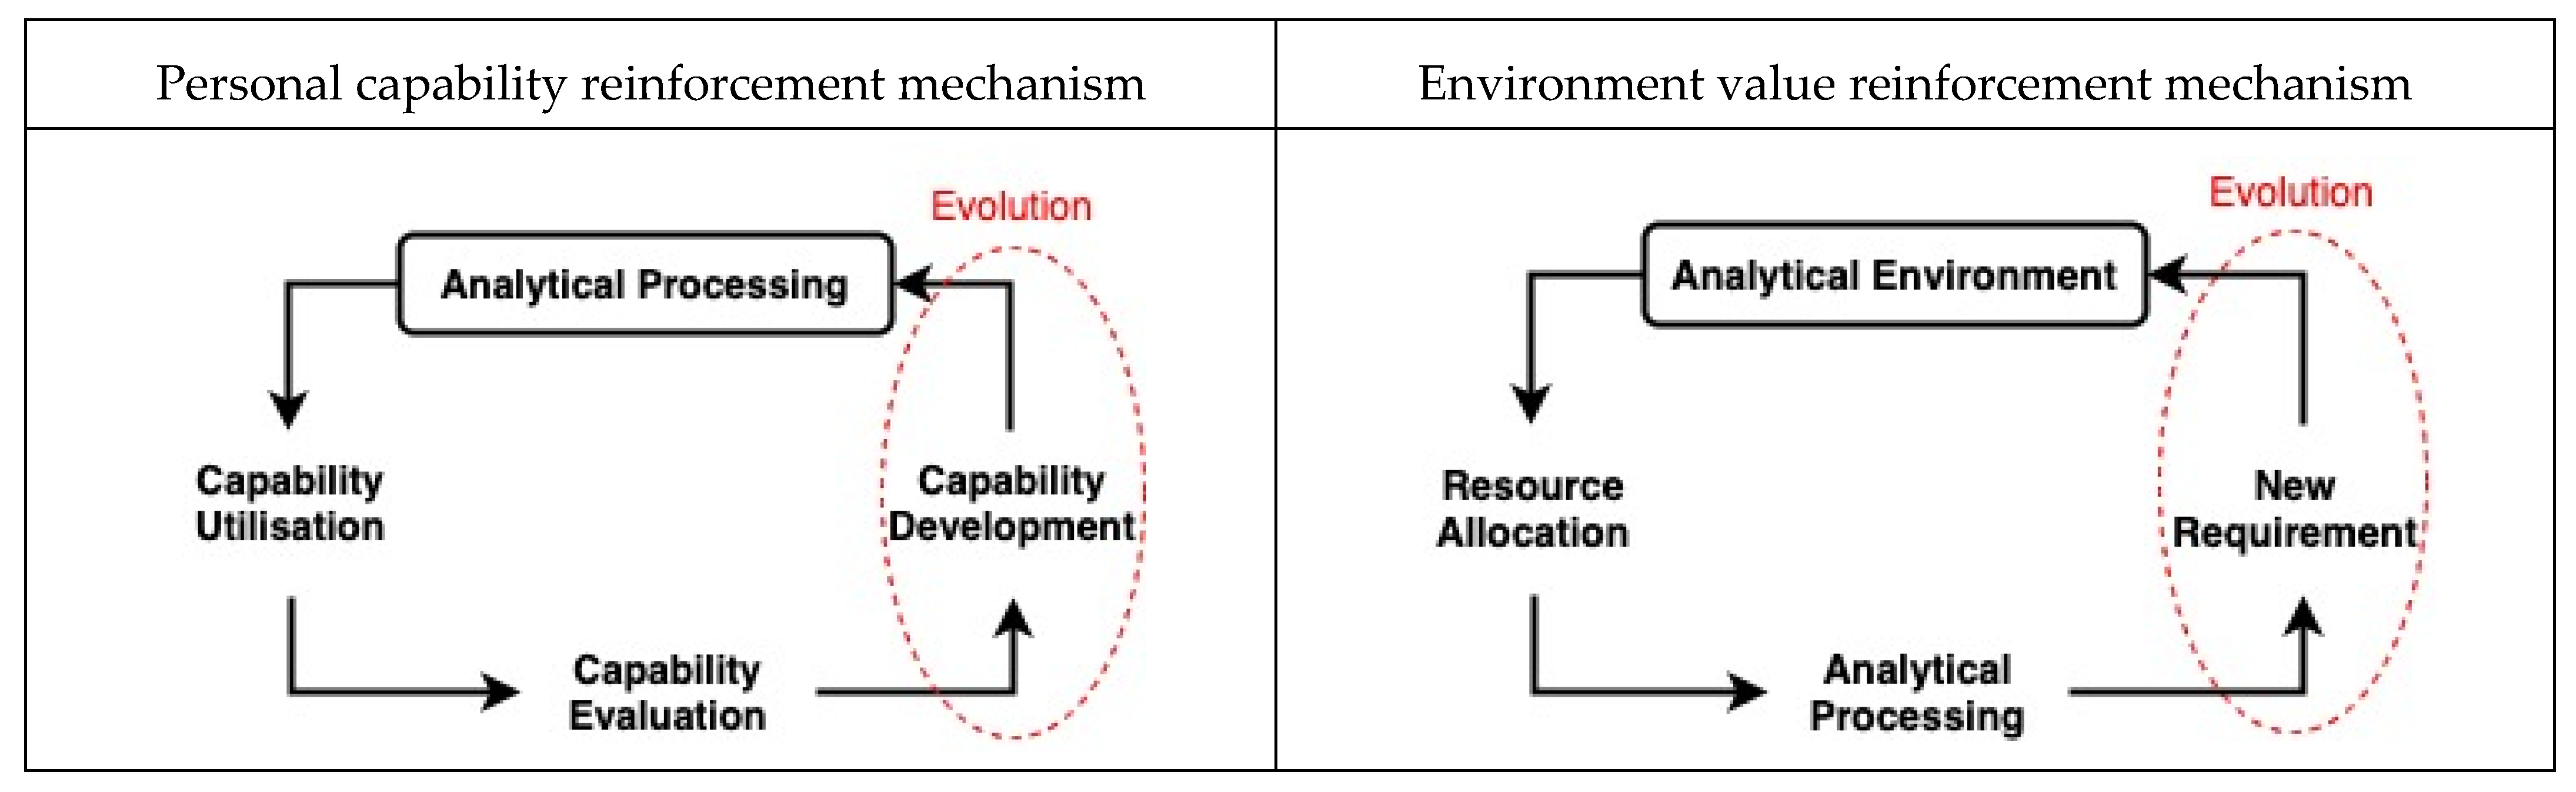
4.3. Self-Reinforcement Property

4.3.1. Collaboration on the Environment Services

Users perceive the self-service system as a dynamic resource capable of improving their decision-making skills. Their continuous use creates a cycle for system and data enhancements based on user requirements and needs. Henfridsson and Bygstad [35] suggested that these self-reinforcing processes generate a collaborative environment. When practices are interconnected, they promote creativity and innovation to improve productivity [36]. Often, the environment is evaluated by IT staff to ensure business users gather the appropriate data (e.g., “this Friday actually I sat down with one of the guys at Insight and we discovered that the data we have is unusable”). In the environment, IT staff and business users work together to solve complex problems, e.g., “…just getting help extracting or manipulating the data or just getting the tie to do it. Let’s say I have this problem; I think the solution is like this and they kind of develop or prove the content and we can work together on that.” Users described certain needs from the system to perform their job to add value to the company. Sometimes, users do not complete their tasks because the environment lacks specific data, features or functionality. Requests are submitted from business users to IT staff. With limited resources, one respondent commented, “If people have requests for additional information, they want into the data model, we try to provide it based on priorities. This process is rather complicated unless it’s something that is already in the staging process and I mean in the data warehouse. So, if it is not, then we take over the report development and we provide the answers directly.” Users can also collaborate with the IT staff to make changes to the data structure (e.g., “…the first step in, for instance, in getting a new field into the self-service tool that would be to have a change ticket with the data warehousing team right. So, the data warehousing team would then transfer data from any source system and then amend it to a table depending on if it’s a dimensional or fact that would fit into all pre-built model. So as soon as they’ve made that field available within the data warehouse either me or X can go in and update our self-service data model”. As the SSA matures, the system requires user interfaces and data integration that involves the IT team. As one respondent commented, “In the self-service environment what we do is basically divided into two general activities. It is focused around maintaining and developing the data models… and of course managing the self-service platform… So, the data warehousing team would transfer data from any source system and then amend it to a table depending on if it’s a dimensional table or fact table that would fit into a pre-built model. So as soon as they’ve made that field available within the data warehouse either me or Employee X can go in and update the data model”. The business user and IT staff work together to adjust the system, an effect of co-creation.

4.3.2. Collaboration on the Self-Assessment

Self-assessment is based on adaptive expectation effects from their perceptions of capabilities, desired outcomes, and plans to interact with other users [37]. It is a key component in evaluating one’s ability to analyze data and interact with the system. Without reflection, users cannot realize alternative outcomes, reducing their efficiencies and becoming unwilling to change [37]. It creates an incentive to enhance social networks and innovation by creating feedback loops [27]. From the empirical evidence, business users request support from IT staff (e.g., “After I build the report I need, I realize that I have some doubts, then I ask the insight people is this correct? And then they say yes or no and tell me how to do it. So, I get some guidance on how to develop the report and analyze it.”). IT staff assist with business users’ needs to ensure the appropriate use of data (e.g., “…They come to us more to verify that they have built a valid representation of the data. So, they want to know if they used the right fields, if they have added the right filters”). Users learn about their abilities working with the data and developing supportive relationships with IT staff. With IT support, users share knowledge about the business processes and needs. Other users reach out to the IT staff when they believe they have overextended their capabilities. One respondent replied, “if I do more complex analysis; I try to go back and ask them what’s wrong with what I have done so that they could pinpoint or try to look at my stuff and see if I have done anything that doesn’t make sense”.

4.3.3. Collaboration on Self-Capabilities

Capabilities are the skills and intrinsic motivations to accomplish analytical tasks efficiently with opportunities to learn, gain knowledge, and gather feedback from management [34]. Users learn skills by performing continuous tasks or operations [37]. As users perform tasks, they adopt the system and increase its usefulness by investing more of their time and effort [35]. Users have beliefs and feelings about their analytical capabilities (e.g., “I kind of trust my abilities, skills you know and abilities, you have cognitive abilities”). Business users described their experiences with internal motivations (e.g., “there’s a drive for sort of, key to driving adoption) or cognitive incentives (e.g., kind of curious about, curious about understanding, they get like curious, or to be data driven to be curious”). Learning and self-development help support their ability to work with the data. Another participant commented, “All the training we had in both X and Y has been really helpful, so I kind of trust my abilities to find the right data”. On-the-job training was reported by several participants, “I think the user interface is you can learn a user interface; it’s not that hard.”, and, “I like learning, I like to teach other people.”

5. Discussion

The self-service environment is a complex environment that consists of several elements acting and interacting together to generate the desired value. Within the environment, users generate value using the resources by collaborating with others and completing tasks independently. Value is denoted by the insights generated from data used in making decisions about a business problem or a potential opportunity for a competitive advantage and improves performance [76]. With digitalization, information is transferred among experts and experienced and novice system users to make tacit knowledge explicit and maintain a usable environment [77]. The basic argument is that satisfaction is tightly related to the user’s perception of the value proposed in the analytical environment to complete a task and the user’s capabilities to subjectify the value [51], hence affecting continuous use [30]. IT also goes in line with the fact that SSA is very subjective and dependent on users’ perception of its value [5,7]. As users interact with systems, trust and perceived confirmation build expectations of a level of quality for certain outcomes and belief for satisfaction [74]. When the analytical environment fails to provide its intended value, users become dependent on the technical staff for tasks, and the self-service environment collapses. To sustain the value of such an environment, several aspects need to be considered. Most importantly, data models need to be constantly updated with new data, technical resources need to be optimized, and user’s capabilities need to be developed to accommodate different analytical needs. Once those three main dimensions become routinized in an organization, a self-reinforcement characteristic becomes evident, and sustainability is reached.
Basically, in relation to perceived personal capability and perceived proposed value, our findings suggest that there exist two main mechanisms responsible for the emergence of a self-reinforcement characteristic controlling those two constructs: the personal reinforcement mechanism and the environment reinforcement mechanism (see Figure 3).
Personal capability reinforcement mechanism: While users engage with different analytical resources within the environment, personal skills play an important role in enacting different features of analytical tools to process data [52]. As such, capability utilization denotes the first cognitive process that connects what the user wants (the need) with what the environment provides (the available). This step encompasses intensive cognitive processing, the utilization of past experience and innovation to reach the desired goal. This step is followed by a capability evaluation where the user evaluates personal cognitive abilities and skills, where a self-assessment results in either a positive or negative experience. This step triggers the demand for capability development in order to be in balance with what the analytical resources require. Such a mechanism has a cyclic nature, repeating over and over during every analytical task within the self-service environment. Every cycle enhances the user’s ability to process data and adjust to what the business situation requires. Sydow, Schreyögg and Koch [37] and Schreyögg and Sydow [36] argued that in a socio-technical environment, there exists a critical point where a reinforcement process is triggered. Usage behaviors and IS quality influence IS value based on routine use and innovative use, impacting organizational performance, knowledge creation, and business value [49]. Capability utilization, capability evaluation, and capability development collectively lead to such a critical point where self-reinforcement occurs. This mechanism is tightly connected to the user’s perception of personal capabilities, causing a continuous development of users’ skills and maintaining a desired level of the user’s analytical capabilities.
Environment value reinforcement mechanism: The self-service environment consists of a collection of resources aiming at lowering the operational complexity of data analytics [78,79]. As such, resources such as clean data models, easy-to-use analytical tools, routinized support, constant training, and workshops need to be available to the user. Sharing knowledge and information among stakeholders plays an essential role in digital transformation and sustainable ecosystems to empower users and inspire innovation [80]. They also constitute the value that the self-service environment proposes to users. Our argument is that once such value decreases, the operational complexity of data analytics increases, affecting user satisfaction and hence continuous use. As such, it is important to understand that maintaining a constant level of proposed value is essential to sustainability. Sustainable business models help organizations explore new ways to create and deliver value to introduce innovation and reduce risk, providing social and environmental benefits [5]. Our findings suggest that in a self-service environment, a certain level of value is maintained through a mechanism denoted as an environment value reinforcement mechanism. When a user scans the environment for resources and allocates resources in accordance with the analytical task, an initial assessment is carried out regarding the value of the available resources against what is needed to accomplish the task and the overall operational complexity to technical tools. Once information is gathered and aligned with the task, the analytical processing step starts. If such a step is unsatisfactory to the user and the outcome does not support the needs, the user either re-evaluates personal capabilities, which triggers the personal capability reinforcement mechanism, or re-evaluates the value of the resources within the environment, resulting in a new requirement to be included. This cyclic mechanism reinforces the environment value. This mechanism constitutes a feedback loop for enhancing the environment’s proposed value, directly affecting user satisfaction.
When both mechanisms become institutionalized and their emergent properties become evident, an important by-product emerges and becomes noticeable. Such a by-product is the evolution of the system as a whole. Evolution in such a system comes from two different yet connected dimensions: user capability evolution and analytical environment evolution. The evolution of the user’s capability is a natural desired outcome resulting from the accumulated experience and exposure to analytical tasks. Such accumulation becomes an important part of self-satisfaction, and when the user perceives the value from being self-reliant in the SSA environment, capability evolution occurs. However, with analytical environment evolution, it is necessary to maintain a certain level of value and an expected outcome when reinforcement is present. The constant need to include new analytical resources (such as data models, data sources, analytical tools) and update previous ones in an effort to maintain competitiveness among organizations makes this mechanism crucial to both users’ engagement and business value.
To conclude, in a self-service environment, resources need to constantly change, adapt and improve to accommodate the user’s analytical needs [80]. This is performed through a constant iterations mechanism where environment resources propose a value, and the users realize this value using their capabilities and provide a feedback loop to technical employees that optimizes the analytical environment. The interconnection between the two mechanisms is a critical aspect that needs to be considered by organizations. The dyadic relationship between both mechanisms over many iterations contributes to the evolution of both the environment and users’ capabilities, affecting how business problems and potential opportunities are addressed. The aim is the routinization of those mechanisms into organizational institutions.

6. Conclusions

Building on previous literature on IS continuous use and sustainability, this paper has investigated the mechanisms causing the continuity of user engagement in a self-service environment. Two main mechanisms have emerged from our empirical findings, suggesting that there exist two main dimensions interacting together through co-evolution to maintain the sustainability of the SSA environment. This supports the “cross-catalytic feedback” between the business and technical teams. Within this environment, business users and IT staff collaborate to solve problems, verify data, and meet personal and organizational goals. The organization’s practice allows users to explore information, and users gain value from the SSA with their continued use. As they gather more information, they obtain more skills to analyze the data. Users find the system more useful and want to enhance the features to improve their performance, making the SSA more valuable. This paper’s contribution is twofold. From a theoretical perspective, this paper contributes to post-adoption and continuous use literature by identifying the inner workings occurring in a self-service environment with a focus on user capabilities and environment resources. It also contributes to the Business Analytics literature by investigating one of the fast-growing trends and attractive topics for organizations. From a practical perspective, organizations can better understand how the SSA environment is sustained and can develop strategies, policies and routines accordingly. Further research should look at value co-creation through a sustainability business model approach among the users’ perspectives, resource integration, processes, and culture.
As with all research, the results presented in this research are neither the absolute truth nor without flaws. As such, the contribution of this research needs to be considered in view of the method adopted. Since this study adopts a single case study, it inherits a limitation in relation to replication. Additionally, the data collected were from a single organization. Even though we believe that the data are rich and valuable, a comparative study might potentially enrich our findings and provide hidden dimensions that could not be seen.

Author Contributions

Conceptualization, I.B.-H. and E.S.; methodology, I.B.-H.; software, I.B.-H.; validation, I.B.-H. and E.S.; formal analysis, I.B.-H. and E.S.; investigation, I.B.-H.; resources, I.B.-H.; data curation, I.B.-H.; writing—original draft preparation, I.B.-H. and E.S.; writing—review and editing, I.B.-H. and E.S. All authors have read and agreed to the published version of the manuscript.

Funding

This research received no external funding.

Institutional Review Board Statement

Not applicable.

Informed Consent Statement

Informed consent was obtained from all subjects involved in the study.

Conflicts of Interest

The authors declare no conflict of interest.

Abbreviations

The following abbreviations and acronyms were used with the text of this study.
BABusiness Analytics
BIBusiness Intelligence
BI&ABusiness Intelligence and Analytics
SSASelf-Service Analytics
ISInformation System
PEVAPerceived Value
ECMExpectation–Confirmation Model
ECTExpectation–Confirmation Theory
TAMTechnology Acceptance Model
ITInformation Technology
SSSelf-Service

References

  1. Brozović, D.; D’Auria, A.; Tregua, M. Value Creation and Sustainability: Lessons from Leading Sustainability Firms. Sustainability 2020, 12, 4450. [Google Scholar] [CrossRef]
  2. Popovič, A.; Turk, T.; Jaklič, J. Conceptual model of business value of business intelligence system. Manag. J. Contemp. Manag. Issues 2010, 15, 5–30. [Google Scholar]
  3. Yang, M.; Evans, S.; Vladimirova, D.; Rana, P. Value uncaptured perspective for sustainable business model innovation. J. Clean. Prod. 2017, 140, 1794–1804. [Google Scholar] [CrossRef] [Green Version]
  4. Yang, M.; Rana, P.; Evans, S. Product service system (PSS) life cycle value analysis for sustainability. In Proceedings of the 6th International Conference on Design and Manufacture for Sustainable Development (ICDMSD2013), Hangzhou, China, 15–17 April 2013. [Google Scholar]
  5. Bocken, N.M.P.; Short, S.W.; Rana, P.; Evans, S. A literature and practice review to develop sustainable business model archetypes. J. Clean. Prod. 2014, 65, 42–56. [Google Scholar] [CrossRef] [Green Version]
  6. Gupta, A.; Deokar, A.; Iyer, L.; Sharda, R.; Schrader, D. Big Data & Analytics for Societal Impact: Recent Research and Trends. Inf. Syst. Front. 2018, 20, 185–194. [Google Scholar] [CrossRef] [Green Version]
  7. Mălăescu, I.; Sutton, S.G. The effects of decision aid structural restrictiveness on cognitive load, perceived usefulness, and reuse intentions. Int. J. Account. Inf. Syst. 2015, 17, 16–36. [Google Scholar] [CrossRef]
  8. Jaklič, J.; Grublješič, T.; Popovič, A. The role of compatibility in predicting business intelligence and analytics use intentions. Int. J. Inf. Manag. 2018, 43, 305–318. [Google Scholar] [CrossRef]
  9. Zhang, Y. The map is not the territory: Coevolution of technology and institution for a sustainable future. Curr. Opin. Environ. Sustain. 2020, 45, 56–68. [Google Scholar] [CrossRef]
  10. Watson, H.J. Tutorial: Business intelligence-Past, present, and future. Commun. Assoc. Inf. Syst. 2009, 25, 39. [Google Scholar] [CrossRef]
  11. Shanks, G.; Sharma, R. Creating Value from Business Analytics Systems: The Impact of Strategy. In Proceedings of the 15th Pacific Asia Conference on Information Systems, Quality Research in Pacific, PACIS 2011, Brisbane, Australia, 7–11 July 2011; pp. 1–12. [Google Scholar]
  12. Someh, I.A.; Shanks, G. The Role of Synergy in Achieving Value from Business Analytics Systems. Available online: https://citeseerx.ist.psu.edu/viewdoc/download?doi=10.1.1.967.8954&rep=rep1&type=pdf (accessed on 11 June 2021).
  13. Wixom, B.H.; Yen, B.; Relich, M. Maximizing Value from Business Analytics. MIS Q. Exec. 2013, 12, 111–123. [Google Scholar]
  14. Abbasi, A.; Sarker, S.; Chiang, R.H. Big Data Research in Information Systems: Toward an Inclusive Research Agenda. J. Assoc. Inf. Syst. 2016, 17, 3. [Google Scholar] [CrossRef] [Green Version]
  15. Bani Hani, I.; Deniz, S.; Carlsson, S. Enabling Organizational Agility through Self-Service Business Intelligence: The case of a digital marketplace. In Proceedings of the Pacific Asia Conference on Information Systems (PACIS) 2017, Langkawi, Malaysia, 16–20 July 2017. [Google Scholar]
  16. Bani Hani, I.; Tona, O.; Carlsson, S.A. From an Information Consumer to an In-formation Author: The Role of Self-Service Business Intelligence. In Proceedings of the American Conference on Information Systems (AMCIS) 2017, Boston, MA, USA, 10–12 August 2017. [Google Scholar]
  17. Imhoff, C.; White, C. Self-Service Business Intelligence. Empowering Users to Generate Insights, TDWI Best Practices Report; TWDI: Renton, WA, USA, 2011. [Google Scholar]
  18. Kim, H.-W.; Chan, H.C.; Gupta, S. Value-based Adoption of Mobile Internet: An empirical investigation. Decis. Support Syst. 2007, 43, 111–126. [Google Scholar] [CrossRef]
  19. Kim, S.; Bae, J.; Jeon, H. Continuous intention on accommodation apps: Integrated value-based adoption and expectation–confirmation model analysis. Sustainability 2019, 11, 1578. [Google Scholar] [CrossRef] [Green Version]
  20. Shaikh, A.A.; Karjaluoto, H. Mobile banking services continuous usage—Case study of finland. In Proceedings of the 2016 49th Hawaii International Conference on System Sciences (HICSS), Koloa, HI, USA, 5–8 January 2016; pp. 1497–1506. [Google Scholar]
  21. Islam, A.K.M.N.; Mäntymäki, M.; Bhattacherjee, A. Towards a Decomposed Expectation-Confirmation Model of IT Continuance: The Role of Usability. Commun. Assoc. Inf. Syst. 2017, 40, 502–523. [Google Scholar] [CrossRef]
  22. Mamun, M.R.A.; Senn, W.D.; Peak, D.A.; Prybutok, V.R.; Torres, R.A. Emotional Satisfaction and IS Continuance Behavior: Reshaping the Expectation-Confirmation Model. Int. J. Hum. Comput. Interact. 2020, 36, 1437–1446. [Google Scholar] [CrossRef]
  23. Thong, J.Y.L.; Hong, S.-J.; Tam, K.Y. The effects of post-adoption beliefs on the expectation-confirmation model for information technology continuance. Int. J. Hum. Comput. Stud. 2006, 64, 799–810. [Google Scholar] [CrossRef]
  24. Rogers, E.M. Diffusion of Innovations: Modifications of a model for telecommunications. In Die Diffusion von Innovationen in der Telekommunikation; Springer: Berlin, Germany, 1995; pp. 25–38. [Google Scholar]
  25. Dishaw, M.T.; Strong, D.M. Assessing software maintenance tool utilization using task–technology fit and fitness-for-use models. J. Softw. Maint Res. Pract. 1998, 10, 151–179. [Google Scholar] [CrossRef]
  26. Dishaw, M.T.; Strong, D.M. Extending the technology acceptance model with task–technology fit constructs. Inf. Manag. 1999, 36, 9–21. [Google Scholar] [CrossRef]
  27. Katz, M.L.; Shapiro, C. On the licensing of innovations. RAND J. Econ. 1985, 16, 504. [Google Scholar] [CrossRef]
  28. Davis, F.D. Perceived usefulness, perceived ease of use, and user acceptance of information technology. MIS Q. 1989, 13, 319–340. [Google Scholar] [CrossRef] [Green Version]
  29. Venkatesh, V.; Davis, F.D. A Theoretical Extension of the Technology Acceptance Model: Four Longitudinal Field Studies. Manag. Sci. 2000, 46, 186–204. [Google Scholar] [CrossRef] [Green Version]
  30. Bhattacherjee, A. Understanding information systems continuance: An expectation-confirmation model. MIS Q. 2001, 25, 351–370. [Google Scholar] [CrossRef]
  31. Oliver, R.L. A cognitive model of the antecedents and consequences of satisfaction decisions. J. Mark. Res. 1980, 17, 460–469. [Google Scholar] [CrossRef]
  32. Budner, P.; Fischer, M.; Rosenkranz, C.; Basten, D.; Terlecki, L. Information system continuance intention in the context of network effects and freemium business models: A replication study of cloud services in Germany. AIS TRR 2017, 3, 1–13. [Google Scholar] [CrossRef] [Green Version]
  33. Lin, T.-C.; Wu, S.; Hsu, J.S.-C.; Chou, Y.-C. The integration of value-based adoption and expectation–confirmation models: An example of IPTV continuance intention. Decis. Support Syst. 2012, 54, 63–75. [Google Scholar] [CrossRef]
  34. Han, Y.-M.; Shen, C.-S.; Farn, C.-K. Determinants of continued usage of pervasive business intelligence systems. Inf. Dev. 2016, 32, 424–439. [Google Scholar] [CrossRef]
  35. Henfridsson, O.; Bygstad, B. The generative mechanisms of digital infastructure evolution. MIS Q. 2013, 37, 907–931. [Google Scholar] [CrossRef]
  36. Sydow, J.; Schreyögg, G.; Koch, J. Organizational path dependency: Opening the black box. Acad. Manag. Rev. 2009, 34, 689–709. [Google Scholar] [CrossRef] [Green Version]
  37. Schreyögg, G.; Sydow, J. Organizational Path Dependence: A Process View. Organ. Stud. 2011, 32, 321–335. [Google Scholar] [CrossRef] [Green Version]
  38. Berman, S.J.; Davidson, S.; Ikeda, K.; Korsten, P.J.; Marshall, A. How successful firms guide innovation: Insights and strategies of leading CEOs. Strategy Leadersh. 2016, 44, 21–28. [Google Scholar] [CrossRef]
  39. Dey, S.; Sharma, R.R.K. Strategic alignment of information systems flexibility with organization’s operational and manufacturing philosophy: Developing a theoretical framework. In Proceedings of the IEOM Society International 2018, Paris, France, 26–27 July 2018; pp. 381–391. [Google Scholar]
  40. Lucić, D. Business intelligence and business continuity: Empirical analysis of Croatian companies. Ann. Disaster Risk Sci. ADRS 2019, 2, 1–10. [Google Scholar]
  41. Moreno, V.; da Silva, F.E.L.V.; Ferreira, R.; Filardi, F. Complementarity as a driver of value in business intelligence and analytics adoption processes. Rev. Ibero Am. Estratégia 2019, 18, 57–70. [Google Scholar] [CrossRef] [Green Version]
  42. McKinney, V.; Yoon, K.; Zahedi, F.M. The Measurement of Web-Customer Satisfaction: An Expectation and Disconfirmation Approach. Inf. Syst. Res. 2002, 13, 296–315. [Google Scholar] [CrossRef]
  43. Davis, G.B. Caution: User-Developed Systems Can Be Dangerous to Your Organization; John Wiley & Sons, Inc.: Hoboken, NJ, USA, 1989. [Google Scholar]
  44. Edwards, A.; Edwards, C.; Westerman, D.; Spence, P.R. Initial expectations, interactions, and beyond with social robots. Comput. Hum. Behav. 2019, 90, 308–314. [Google Scholar] [CrossRef]
  45. Helson, H. Adaptation-level theory: An experimental and systematic approach to behavior; Harper and Row: New York, 1964. [Google Scholar]
  46. Goodhue, D.L.; Thompson, R.L. Task-technology fit and individual performance. MIS Q. 1995, 213–236. [Google Scholar] [CrossRef]
  47. Carrillo-Hermosilla, J.; del Río, P.; Könnölä, T. Diversity of eco-innovations: Reflections from selected case studies. J. Clean. Prod. 2010, 18, 1073–1083. [Google Scholar] [CrossRef]
  48. Ben-Eli, M.U. Sustainability: Definition and five core principles, a systems perspective. Sustain. Sci. 2018, 13, 1337–1343. [Google Scholar] [CrossRef]
  49. Inigo, E.A.; Albareda, L. Sustainability oriented innovation dynamics: Levels of dynamic capabilities and their path-dependent and self-reinforcing logics. Technol. Forecast. Soc. Chang. 2019, 139, 334–351. [Google Scholar] [CrossRef]
  50. Popovič, A.; Puklavec, B.; Oliveira, T. Justifying business intelligence systems adoption in SMEs: Impact of systems use on firm performance. Ind. Manag. Data Syst. 2019, 119, 210–228. [Google Scholar] [CrossRef]
  51. Bani-Hani, I.; Tona, O.; Carlsson, S. Patterns of Resource Integration in the Self-Service Approach to Business Analytics. In Proceedings of the 53rd Hawaii International Conference on System Sciences, Kauai, HI, USA, 7–10 January 2020. [Google Scholar]
  52. Alpar, P.; Schultz, M. Self-Service Business Intelligence. Bus. Inf. Syst. Eng. 2016, 58, 151–155. [Google Scholar] [CrossRef]
  53. Gartner IT Glossary, n.d. Available online: http://www.gartner.com/it-glossary/self-service-analytics/ (accessed on 11 June 2021).
  54. Weber, M. Keys to sustainable self-service business intelligence. Bus. Intell. J. 2013, 18, 18. [Google Scholar]
  55. Schuff, D.; Corral, K.; Louis, R.D.S.; Schymik, G. Enabling self-service BI: A methodology and a case study for a model management warehouse. Inf. Syst. Front. 2016, 20, 275–288. [Google Scholar] [CrossRef]
  56. Curran, J.M.; Meuter, M.L. Self-service technology adoption: Comparing three technologies. J. Serv. Mark. 2005, 19, 103–113. [Google Scholar] [CrossRef]
  57. Dabholkar, P.A. Consumer evaluations of new technology-based self-service options: An investigation of alternative models of service quality. Int. J. Res. Mark. 1996, 13, 29–51. [Google Scholar] [CrossRef]
  58. Dabholkar, P.A.; Bagozzi, R.P. An attitudinal model of technology-based self-service: Moderating effects of consumer traits and situational factors. J. Acad. Mark. Sci. 2002, 30, 184–201. [Google Scholar] [CrossRef]
  59. Schuster, L.; Drennan, J.; Lings, I.N. Consumer acceptance of m-wellbeing services: A social marketing perspective. Eur. J. Mark. 2013, 47, 1439–1457. [Google Scholar] [CrossRef] [Green Version]
  60. López-Bonilla, J.M.; López-Bonilla, L.M. Self-service technology versus traditional service: Examining cognitive factors in the purchase of the airline ticket. J. Travel Tour. Mark. 2013, 30, 497–508. [Google Scholar] [CrossRef]
  61. Meuter, M.L.; Ostrom, A.L.; Roundtree, R.I.; Bitner, M.J. Self-Service Technologies: Understanding Customer Satisfaction with Technology-Based Service Encounters. J. Mark. 2000, 64, 50–64. [Google Scholar] [CrossRef] [Green Version]
  62. Scherer, A.; Wünderlich, N.; von Wangenheim, F. The Value of Self-Service: Long-Term Effects of Technology-Based Self-Service Usage on Customer Retention. Mis Q. 2015, 39, 177–200. [Google Scholar] [CrossRef]
  63. Barc. Self-Service Business Intelligence Users Are Now in the Majority; TDWI: Renton, WA, USA, 2014. [Google Scholar]
  64. Biernacki, P.; Waldorf, D. Snowball sampling: Problems and techniques of chain referral sampling. Sociol. Methods Res. 1981, 10, 141–163. [Google Scholar] [CrossRef]
  65. Schultze, U.; Avital, M. Designing interviews to generate rich data for information systems research. Inf. Organ. 2011, 21, 1–16. [Google Scholar] [CrossRef]
  66. Yin, R.K. Case Study Research: Design and Methods; Sage Publications: Addison, TX, USA, 2013. [Google Scholar]
  67. Creswell, J.W.; Hanson, W.E.; Clark Plano, V.L.; Morales, A. Qualitative research designs: Selection and implementation. Couns. Psychol. 2007, 35, 236–264. [Google Scholar] [CrossRef]
  68. Silverman, D. Qualitative Research; Sage: Addison, TX, USA, 2016. [Google Scholar]
  69. Miles, M.B.; Huberman, A.M. Qualitative Data Analysis: An Expanded Sourcebook; Sage: Addison, TX, USA, 1994. [Google Scholar]
  70. Hou, C.K. Examining users’ intention to continue using business intelligence systems from the perspectives of end-user computing satisfaction and individual performance. IJBCRM 2018, 8, 49. [Google Scholar] [CrossRef]
  71. Hsu, C.-L.; Lin, J.C.-C. What drives purchase intention for paid mobile apps?—An expectation confirmation model with perceived value. Electron. Commer. Res. Appl. 2015, 14, 46–57. [Google Scholar] [CrossRef]
  72. Ashraf, M.; Ahmad, J.; Hamyon, A.A.; Sheikh, M.R.; Sharif, W. Effects of post-adoption beliefs on customers’ online product recommendation continuous usage: An extended expectation-confirmation model. Cogent Bus. Manag. 2020, 7, 1735693. [Google Scholar] [CrossRef]
  73. DeLone, W.H.; McLean, E.R. Information systems success: The quest for the dependent variable. Inf. Syst. Res. 1992, 3, 60–95. [Google Scholar] [CrossRef] [Green Version]
  74. Ashraf, M.; Jaafar, N.I.; Sulaiman, A. The mediation effect of trusting beliefs on the relationship between expectation-confirmation and satisfaction with the usage of online product recommendatioun. South East Asian J. Manag. 2016, 10. [Google Scholar] [CrossRef]
  75. Haka, E.; Haliti, R. The Effects of Self Service Business Intelligence in the Gap between Business Users and IT. Master’s Thesis, Lund University, Lund, Sweden, June 2018. [Google Scholar]
  76. Bani-Hani, I.; Pareigis, J.; Tona, O.; Carlsson, S. A holistic view of value generation process in a SSBI environment: A service dominant logic perspective. J. Decis. Syst. 2018, 27, 46–55. [Google Scholar] [CrossRef]
  77. Belkin, N.J. Cognitive models and information transfer. Soc. Sci. Inf. Stud. 1984, 4, 111–129. [Google Scholar] [CrossRef]
  78. Arnott, D.; Pervan, G. A Critical Analysis of Decision Support Systems Research Revisited: The Rise of Design Science. J. Inf. Technol. 2014, 29, 269–293. [Google Scholar] [CrossRef]
  79. Pappas, I.O.; Mikalef, P.; Giannakos, M.N.; Krogstie, J.; Lekakos, G. Big Data and Business Analytics Ecosystems: Paving the Way towards Digital Transformation and Sustainable Societies. Inf. Syst. e-Bus. Manag. 2018, 16, 479–491. [Google Scholar]
  80. Hanseth, O.; Lyytinen, K. Design theory for dynamic complexity in information infrastructures: The case of building internet. In Enacting Research Methods in Information Systems; Springer: Berlin, Germany, 2016; pp. 104–142. [Google Scholar]
Figure 1. Research process.
Informatics 08 00045 g001
Figure 2. Mock-up example.
Informatics 08 00045 g002
Figure 3. Reinforcement mechanisms in SSA environment.
Informatics 08 00045 g003
Table 1. Data analysis example.
Interview QuoteTheoretical Concept (Etic)Second Level Code (Emic)
Author 1Author 2Final
“…just getting help extracting or manipulating the data or just getting the tie to do it. Let’s say I have this problem; I think the solution is like this and they kind of develop or prove the content and we can work together on that.”Collaboration on the environment servicesCollaboration in relation to support from technical peopleCollaboration in relation to environment optimizationEnvironment value and reinforcement
Publisher’s Note: MDPI stays neutral with regard to jurisdictional claims in published maps and institutional affiliations.

