Abstract
The accurate segmentation and identification of vertebrae presents the foundations for spine analysis including fractures, malfunctions and other visual insights. The large-scale vertebrae segmentation challenge (VerSe), organized as a competition at the Medical Image Computing and Computer Assisted Intervention (MICCAI), is aimed at vertebrae segmentation and labeling. In this paper, we propose a framework that addresses the tasks of vertebrae segmentation and identification by exploiting both deep learning and classical machine learning methodologies. The proposed solution comprises two phases: a binary fully automated segmentation of the whole spine, which exploits a 3D convolutional neural network, and a semi-automated procedure that allows locating vertebrae centroids using traditional machine learning algorithms. Unlike other approaches, the proposed method comes with the added advantage of no requirement for single vertebrae-level annotations to be trained. A dataset of 214 CT scans has been extracted from VerSe’20 challenge data, for training, validating and testing the proposed approach. In addition, to evaluate the robustness of the segmentation and labeling algorithms, 12 CT scans from subjects affected by severe, moderate and mild scoliosis have been collected from a local medical clinic. On the designated test set from Verse’20 data, the binary spine segmentation stage allowed to obtain a binary Dice coefficient of 89.17%, whilst the vertebrae identification one reached an average multi-class Dice coefficient of 90.09%. In order to ensure the reproducibility of the algorithms hereby developed, the code has been made publicly available.
1. Introduction
The spine plays a primary role in sustaining and supporting the human body and shielding organ structures while allowing the full body mobility. It also shields the spinal cord from injuries and mechanical shocks due to impacts [1]. The anatomic complexity of the spine, which consists of 33 vertebrae, 23 intervertebral disks, the spinal cord and connecting ribs, often leads to an under-diagnosis of spinal pathologies [2]. The spinal surgeon is faced with the need of robust algorithms to segment and create a spine model, leading to the development of Computer-Assisted Surgery (CAS) systems [3]. The knowledge of the shape of single vertebrae can aid early diagnosis of degenerative disorders, spinal deformities or trauma and support surgical planning [4]. Computed tomography (CT) is the most spatially accurate imaging modality to assess the three-dimensional morphology of the vertebra [5].
The most significant challenges in the context of vertebrae segmentation and identification, including large-scale vertebrae segmentation challenges (VerSe’19 and VerSe’20), have been organized during the Medical Image Computing and Computer Assisted Intervention (MICCAI) international conferences [6,7]. The data of Verse’19 are composed of 160 CT scans, whereas that of Verse’20 comprise 300 CT scans. Previously available datasets from other challenges in the spine imaging domain are much smaller. Examples include the Computational Spine Imaging 2014 Workshop, targeted at the segmentation of the thoraco-lumbar spine, which consists of 20 images [5,8], and the online challenge xVertSeg, targeted at the segmentation of the lumbar spine, composed of 25 samples [4].
When elaborating spine imaging data, vertebrae classification and vertebrae segmentation are two pivotal tasks. Applications span from diagnosis (detecting and grading of vertebral fractures, spinal curve estimation, identification of spinal deformities), to biomechanical modeling and surgical planning for metal insertions. As a radiological imaging technique, CT scans are the gold standard for assessing the ‘bone’ part of the spine, since they guarantee high bone-to-soft-tissue contrast [1]. Several methods have been proposed in the literature for vertebrae segmentation and labeling. Traditionally, spine segmentation has been approached predominantly as a model-fitting problem; however, more recent spine segmentation techniques focused on deep learning (DL)-based methods [9]. This work aims to propose a novel algorithm for vertebrae identification, which is simpler than more sophisticated methods already proposed in the literature. In addition, the advantage of the proposed approach is that it does not require single vertebrae-level annotations to be trained. We also propose a method for binary spine segmentation based on 3D fully convolutional networks (FCNs). Finally, we developed a visualization tool to assess the results of the considered methodologies qualitatively.
Due to the huge spine CT images dataset and for yielding a state-of-the-art benchmark for present and upcoming spine analysis techniques, we incorporated not only DL but also traditional machine learning to best match the required output and gain accuracy at higher competence. The proposed two-fold approach first exploits a 3D convolutional neural network (CNN) that automatically segments the whole spine; nevertheless, traditional machine learning algorithms take the responsibility to locate centroids in the final stage. The k-means algorithm with morphological operators and shape descriptors analysis, which starts from the binary segmentation results, enables recovering the masks of the individual vertebrae. This method allows achieving respectable results without needing any single vertebrae-level annotations for training.
One of the limitations of the proposed methodology is its semi-automaticity. However, it offers potential benefits over simple 3D component analysis of the segmented region, as it may result in the spine being considered a unique connected component. In addition, the unavailability of a dataset large enough is always a considerable problem; thus, the proposed methodology can be useful also when there is little or no annotated data. A tabular comparison of the proposed approach with existing research methods is listed in Table 1. Further comparison information can be found in later sections.

Table 1.
Comparison between the proposed method and related works. Results are reported in terms of Dice coefficient (). CT stands for computed tomography, CNN stands for convolutional neural network, PaDBN stands for patch-based deep belief networks, PCNN stands for pulse coupled neural network, APCNN stands for adaptive pulse coupled neural network, MLPNN stands for multi-layer perceptron neural network and MLPNN1f means MLPNN considering only the intensity level of each voxel as a feature.
The remainder of the paper is structured as follows: in Section 2, we present related works. In Section 3, we introduce the publicly available data collections for the problem of segmenting and identifying vertebrae from CT scans, plus a dataset that we acquired from a local medical clinic. In Section 4, we present the proposed approach. We divide this section in two sub-sections: Section 4.1, which covers the details of the 3D CNN methodology exploited for obtaining reliable binary segmentation of the spine; Section 4.2, which provides details about the machine learning methodology used for performing vertebrae labeling in an unsupervised fashion. Afterwards, explanations of the measures adopted for quantitatively assessing the proposed methodology (Section 5.1), together with the obtained experimental results (Section 5.2), are inscribed in Section 5. Lastly, Section 6 reports conclusions and future works.
2. Related Work
Kim et al. developed a web-based tool for spine imaging data segmentation from CT scans [10], exploiting deep learning-based methodologies, especially the U-Net architecture [13]. The tool was implemented in Python with the Keras library for the data processing side, whereas a Flask server framework was developed for providing accessibility over the web. The U-Net was trained on 310 images from CT scans, validated on 20 images and tested on only 14 images. This approach allowed the authors to obtain a Dice coefficient of 90.40% for the binary spine segmentation task.
Vania et al. proposed a method for the automatic spine segmentation from CT scans using CNN via the generation of redundant class labels [3]. The implemented architecture consisted of two convolutional layers and three fully connected ones. The redundant classes were generated by dilating the spine mask. The authors considered class “1” as background, class “4” as the spine and class “3” and class “2” as the first and second redundant classes, respectively. This approach allowed the authors to obtain a Dice coefficient of 94% for the binary spine segmentation task.
Qadri et al. developed an automatic approach, named patch-based deep belief networks (PaDBNs), for vertebrae segmentation in CT images [11]. Deep belief networks (DBNs) are DL models composed of stacked Restricted Boltzmann Machines (RBMs) [14]. Their proposed model allowed them to automatically select the features from image patches and measure the difference between classes. Unsupervised learning was exploited for weight initialization, whereas supervised fine-tuning was used to update weights. One strength this methodology offers is the considerable reduction in the computational cost while retaining good performances.
Zareie et al. [12] proposed two methods for vertebrae segmentation in 3D CT images. The first is based on a multi-layer perceptron neural network (MLPNN), which used seven gray-level statistical features to classify each voxel as vertebrae or background. The second method implemented an adaptive pulse coupled neural network (APCNN) to segment vertebrae and used a median filter to refine the results. This network was a modified version of the one proposed by Chang et al. [15], in which the parameters were adjusted adaptively according to the input image. The performances of both systems were calculated in terms of (definition is provided in Section 5.1) on 17 3D vertebrae CT images of the thoracic and lumbar spine of both normal and abnormal cases. The results compared four different models: the PCNN developed by Chang et al. [15], the APCNN, the MLPNN with all seven features and the MLPNN using only the intensity level of each voxel as a feature (MLPNN1f). In addition, the robustness of APCNN and MLPNN was evaluated by adding salt-and-pepper noise to the images. It was shown that the APCNN performed better than the other methods with a of 95.0%, being less sensitive to noise than the MLPNN and more adjustable to each image than a classic PCNN.
All the works considered so far did not address the recognition of the different vertebrae, which is a considerably more complicated task than the binary spine segmentation. Slightly more sophisticated approaches can allow vertebrae identification as a post-processing step after the spine segmentation stage, using simple and not-learnable techniques, which do not require apposite dataset preparation. Bae et al. proposed a fully automated approach for 3D segmentation and separation of multiple cervical vertebrae in CT images exploiting a 2D CNN [16]. The authors trained a 2D U-Net model for performing the spine segmentation, considering two classes, i.e., “1” for the superior part of the vertebra and “2” for the inferior part, obtaining accuracies comparable with the inter- and intra-observer variability of the manual segmentation performed by human experts. In order to separate the vertebrae, the authors proposed a post-processing stage. In the first part, each class region continuity is assessed by using the connected component analysis to correct mis-labeling errors. Then, a technique for detecting separation points across the class “1” region and class “2” was implemented. After having identified these points, class “1” and class “2” voxels of the same vertebrae were merged, leading to a final segmentation with separated vertebrae.
In the realm of the methods proposed for the VerSe challenges, it is worth considering the top three works from the VerSe’19 challenge [1,7,9,17] for their accurate results. All the methods that have been proposed for these challenges also considered the vertebrae identification problem. Sekuboyina et al. [7] proposed a pipeline to localize and identify the vertebrae on multidetector CT scans employing an improved version of the Btrfly Net [18]. The Btrfly fully convolutional neural network works on sagittal and coronal 2D projections and incorporates the spine localization and anatomic prior information using the adversarial discriminators. The approach was tested on both a public dataset of 302 CT scans and two in-house datasets with a total of 238 CT scans. On the public dataset, the network achieved a vertebrae identification rate of 88.5%. On the in-house datasets, instead, with a higher interscan data variability, an identification rate of 85.1% was obtained. One of the principal limitations of the study was that it only considered 24 labels for C1-L5 and did not account for segmentation anomalies, such as L6, or transitional vertebrae, such as a lumbarized S1 vertebra. Lessman et al. proposed iterative FCNs. The idea was that an instance memory keeps information about previously segmented vertebrae. This memory was then combined with an FCN. This network iteratively analyzed image patches, searched for the first not yet segmented vertebra, which was recognized as completely or partially visible, so that partially visible vertebrae were excluded from further analysis [9]. Payer et al. proposed a cascaded approach which involves three stages. In the first step, a U-Net [13] variation was exploited to regress a heatmap of the spine centerline, which was generated by combining Gaussian heatmaps of all the individual landmarks; this allowed to locate the approximate position of the spine. In the second phase, SpatialConfiguration-Net was employed to localize centers of the vertebrae bodies. It effectively combines local aspect of reference points with their spatial configuration. In the last stage, a U-Net trained with cross-entropy was exploited for the binary segmentation of single separated vertebrae [17]. A more detailed list of approaches considered for the VerSe challenges is presented in [1].
3. Materials
The main publicly available datasets concerning spine segmentation are: VerSe’19 and VerSe’20 [1,6,7], CSI-Label 2014 [19,20], CSI-Seg 2014 [5,8] and xVertSeg [4]. The latter three are listed by SpineWeb (http://spineweb.digitalimaginggroup.ca/, last accessed: 6 June 2021), an important online archive for multi-modal spine imaging data. A summary of the available datasets is presented in Table 2. xVertSeg is a collection of 25 lumbar-only CT scans with voxel-level annotations that include fractured vertebrae. CSI-Seg 2014 and CSI-Label 2014 have become available during the MICCAI 2014. While the former includes segmentation masks, the latter is provided with centroid annotations.

Table 2.
Spine segmentation datasets. In the annotations column, C stands for centroids’ labels, M for masks and S for scoliosis severity. Medica Sud s.r.l. (https://www.medicasud.it/, last accessed: 6 June 2021) is a local medical clinic which provided 12 CT scans. Please note that this dataset is not publicly available.
The VerSe’19 and VerSe’20 challenges enabled the adoption and benchmarking of deep learning-based techniques for spine segmentation, since they have an adequate sample size with a variety of conditions, field of view and labeled vertebrae. For instance, the VerSe’19 data include a variety of field of views (e.g., cervico-thoraco-lumbar and thoraco-lumbar scans), a compound of isotropic and sagittal reformations and subjects with metallic implants or vertebral fractures. The Verse’20 dataset includes atypical anatomies such as transitional vertebrae and other vertebrae, i.e., L6, sacralization of L5 and C7 with cervical ribs. For running the experiments, a dataset of 214 spine multi-detector CT scans has been extracted from VerSe’20 challenges data. The images can be downloaded from OSF repository (https://osf.io/t98fz/, last accessed: 6 June 2021) and are available in Neuroimaging Informatics Technology Initiative (NIfTI) format. The dataset is split as follows: 148 CT scans for training, 16 CT scans for validation and 50 CT scans as final test set. We also considered 12 CT scans collected from Medica Sud s.r.l., in order to assess the performance of the vertebrae labeling algorithm on patients with scoliosis, ranging from mild to severe cases.
4. Methods
DL methodologies are emerging in the medical imaging community for tasks such as segmentation and classification. DL refers to the adoption of computational models with hierarchical levels of abstraction capable to jointly extract feature and process them to predict an outcome. DL methodologies excel in tasks where it is hard to design handcrafted algorithms, such as computer vision ones [21]. Convolutional neural networks are a powerful methodology for addressing image segmentation problems, especially with fully convolutional neural networks [22] and encoder-decoder architectures such as U-Net [13], U-Net 3D [23] and V-Net [24]. For major details, surveys about U-shaped architectures and semantic segmentation approaches can be considered [25,26]. Applications of DL and semantic segmentation in the medical imaging include glomeruli segmentation from kidney biopsies [27,28], autosomal dominant polycystic kidney disease segmentation from magnetic resonance images [29], liver and vessels segmentation from CT scans [30] among others. In order to ensure the reproducibility of the algorithms introduced in Section 4.1 and Section 4.2, and the visualization tool presented in Section 4.3, the code has been made publicly available on GitHub (https://github.com/Nicolik/Segm_Ident_Vertebrae_CNN_kmeans_knn, last accessed: 6 June 2021).
4.1. Spine Segmentation
The images have been pre-processed according to the method proposed by Payer et al. [17], that consists of reorienting, smoothing and clamping. We performed the clamping in the range [−150, 1000], instead of [−1024, 8192], since high atomic number structures such as bone have Hounsfield Units (HU) in the range [250, 1000] [31]. We also cut the images and the related masks with the smallest bounding box containing the spine. Images have been resampled to an isotropic resolution of 1 mm, as in the work from Payer et al. [17]. The workflow followed for the spine segmentation is depicted in Figure 1. The binary segmentation stage is performed by exploiting the V-Net architecture proposed by Milletari et al. [24]. The Dice loss function formulation adopted is the same considered in the work of Altini et al. [30]. V-Net is an encoder–decoder architecture. The first part of the network is devoted to the feature extraction; the second reconstructs high resolutions masks, exploiting also skip connections across the encoder–decoder paths. Compared to U-Net, it is worth noting that V-Net exploits down-convolutions, with stride and kernel-size , instead of a fixed downsampling realized by max-pooling, adding learnable parameters also in this stage. As differences between original V-Net architecture and that implemented for this paper, there is the adoption of ReLU non-linearities instead of PReLU ones [32] and the adding of a Batch-Normalization (BN) layer after each convolutional layer, as also done in Altini et al. [30] and Shen et al. [33]. The network has been trained for 500 epochs with data augmentation (random noise with ). Every 100 epochs, we saved the trained model in order to check for overfitting issues. In order to implement the patch-based pipeline and the augmentation operation, the TorchIO library has been employed [34]. The parameters for the patch sampler were: uniform sampling, 8 patches per each volume and patch size of . The original V-Net architecture processed input volumes of , but we decided to limit the dimension for allowing larger batches in order to benefit from BN layers.
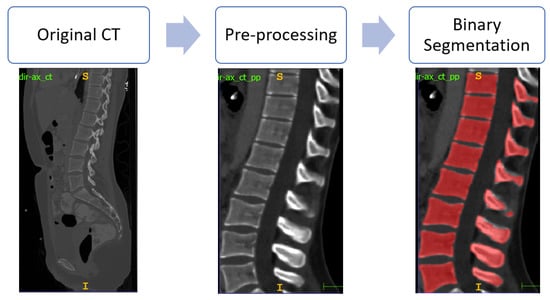
Figure 1.
Vertebrae segmentation workflow.
4.2. Vertebrae Identification
In order to perform vertebrae identification, it is required to find vertebrae centroids, which can therefore be exploited to recover single vertebrae masks. This task has to be carried out after the binary segmentation of the spine. A 3D connected component analysis of the segmented region will not solve the problem of vertebrae labeling, since the spine will likely form a unique connected component. For this reason, the chosen approach is a semi-automated workflow that consists of different steps, two of which require an input from the user. The workflow followed for vertebrae identification is depicted in Figure 2. The sequence of the involved operations is listed below:
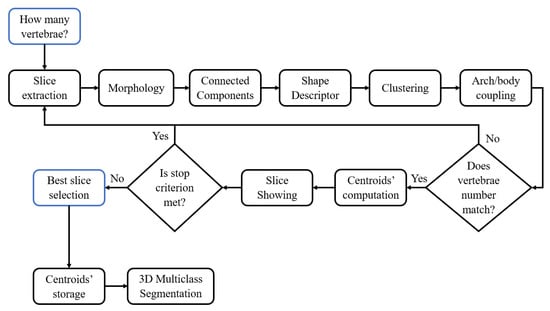
Figure 2.
Vertebrae identification workflow. Steps which require a user interaction have blue borders.
- Vertebrae Number Selection. This step requires an input by the user, which has to insert the number of the vertebrae given the binary segmentation. The user has to provide the name of the first vertebra (from the top to the bottom) in order to perform the correct labeling according to the legends provided by VerSe.
- Slice Extraction. The algorithm extracts a 2D sagittal slice from the binary segmentation, starting from the middle of the image, since it has a higher probability of showing well-clustered vertebrae. Kindly note that, in some cases, e.g., patients affected by severe scoliosis, this consideration may not hold, resulting in lower segmentation performances. Inside the selected slice, the following sub-steps have been carried out:
- –
- Morphological and Connected Components Analysis. The morphological analysis aims at removing small points which can be wrongly considered as standalone components, whereas the purpose of the connected components analysis is labeling each component with a different value.
- –
- Shape Descriptor and Clustering for Arches and Bodies. It is worth noting that every single component is either a vertebral body or a vertebral arch, so it is important to correctly assign each component to the appropriate category. This stage carries out the above process by considering proper shape descriptors of the individual components.
- –
- Arch/Body Coupling. This step connects each vertebral arch to the nearest vertebral body, by assigning the same label to both.
- –
- Centroids’ Computation and Slice Showing. If the output vertebrae number matches with the input number from the first step, the algorithm goes further with the computation of centroids’ positions for each vertebra; otherwise, the process has to be repeated from another slice.
- Best Slice Selection and Centroids’ Storage. The algorithm repeats the workflow until it reaches a slice without connected components. Then, the user chooses the best slice among the showed ones, and the algorithm stores the centroids’ position.
- 3D Multi-class Segmentation. Centroids are used in a k-nearest neighbors (k-NN) classifier to produce a 3D segmentation map in which each vertebra has its own label.
In the next paragraphs, the non-trivial steps of this process are described.
4.2.1. Morphological and Connected Components Analysis
As mentioned in Section 4.2, the morphological analysis aims at removing outliers, i.e., small points that are not connected to vertebral arches or bodies. In order to carry out this process, we exploited the ErodeObjectMorphologyImageFilter and the DilateObjectMorphologyImageFilter, which are provided by the SimpleITK (https://simpleitk.org/, last accessed: 6 June 2021) library. The former filter erases every component contour, whereas the latter extends the component contours. It means that if a component is relatively small, erosion will completely remove it; the combination of both removes these small components without affecting the bigger ones. The morphological analysis has been performed with a kernel radius of 2 for both the erosion and the dilatation. Figure 3 shows the effects of the morphological analysis.
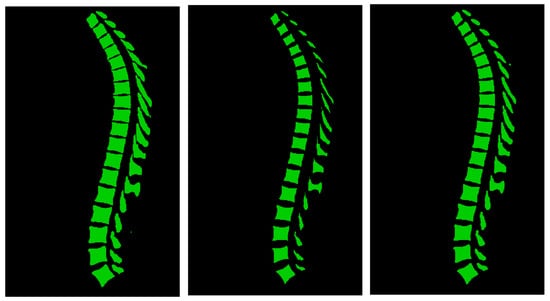
Figure 3.
Workflow of the morphological analysis. Note that small components are removed in the erosion phase, and they do not appear in the final output.
The connected components analysis substage employs the SimpleITK library too, which offers the ConnectedComponentImageFilter that labels each component with a different intensity value. Figure 4 shows the output of this filter.
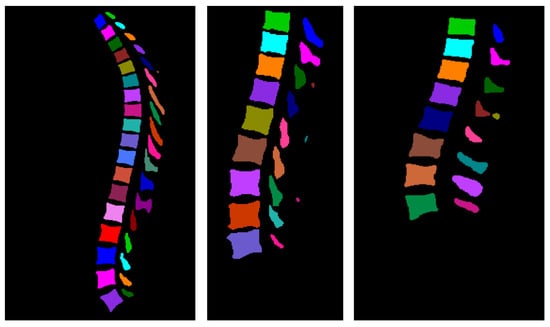
Figure 4.
Sample ConnectedComponentImageFilter output.
4.2.2. Shape Descriptor and Clustering
This step creates a shape descriptor for each component, so that arches and bodies can be clustered in different subsets.
The shape descriptor sub-stage exploits the Scikit-image library (https://scikit-image.org/, last accessed: 6 June 2021) that provides the regionprops and the regionprops_table methods which automatically compute several descriptors for each component. Some of these descriptors are used to set up a Pandas (https://pandas.pydata.org/, last accessed: 6 June 2021) DataFrame which is used to group all similar components in two clusters, i.e., arches and bodies. The chosen feature set is composed of the following descriptors (definitions in italics are taken from the Scikit-image documentation):
- Area: The number of pixels of the region.
- Centroid: The centroid’s position of the region.
- Extent: Ratio of pixels in the region to pixels in the total bounding box of the region.
- Perimeter: Approximation of the perimeter of the region.
- Eccentricity: Ratio of the focal distance (distance between focal points) over the major axis length.
- Solidity: Ratio of pixels in the region to pixels of the convex hull image (the smallest convex polygon that encloses the region).
These features have been selected with a heuristic process, choosing the subset which better discriminates bodies and arches. We also note that, for scoliosis patients, adding Inertia Tensor (Inertia tensor of the region for the rotation around its mass) to this feature set leads to an improvement in the results.
We decided to exploit the k-means clustering algorithm for performing the clustering of vertebral arches and bodies. The drawback is that it is sensible to outliers; however, after the morphological analysis, the probability of retaining outliers is largely reduced. The k-means clustering is a popular algorithm for cluster analysis which finds commonalities in data and groups them without the need of a ground truth. Cluster analysis, in fact, belongs to the unsupervised learning branch of machine learning. At the start of the algorithm, k centroids are initialized (randomly, from k data points or from other prior knowledge) in the feature hyperspace. Then, every sample is assigned to the nearest centroid according to some distance metric. Centroids for the next iteration are computed as the average of the coordinates of the points of each cluster. The process is repeated until convergence [35]. The Scikit-learn library (https://scikit-learn.org/, last accessed: 6 June 2021) provides its own implementation of the k-means clustering model. The only parameter to tune is the number of clusters, which is set to two. Before fitting the model, it is important to normalize the DataFrame using the Z-score normalization. The main hyper-parameter to tune for k-means clustering is the number of clusters. Since our purpose is to distinguish between arches and bodies, the n_clusters hyper-parameter is set to 2. Other hyper-parameters are set to their default values. Experiments where we changed the init, n_init, algorithm and max_iter hyper-parameters did not result in improvements. After performing the clustering, it is important to determine which cluster regards vertebral bodies and which cluster concerns vertebral arches. This is necessary because the clustering analysis does not know the nature of the samples, it only groups the clusters. For this purpose, the distinction is made by looking at the total area of the clusters: the greatest represents the vertebral bodies. The cluster analysis is not always successful: cervical vertebrae’s shape is not well distinguishable from the arch, and this can lead to an inaccurate outcome.
4.2.3. Arch/Body Coupling
As mentioned before, this step assigns each vertebral arch to the nearest vertebral body. For each vertebral arch, the Euclidean distance between the arch and every vertebral body is computed. Let be the number of vertebrae, are the sets of vertebral arches and bodies, respectively. Distance between and can be defined as in Equation (1).
We need to compute the distance between each and . The vertebral body which has the minimum distance from the arch is linked to the vertebra body, and the labels are merged. Figure 5 depicts the output of cluster analysis and coupling.
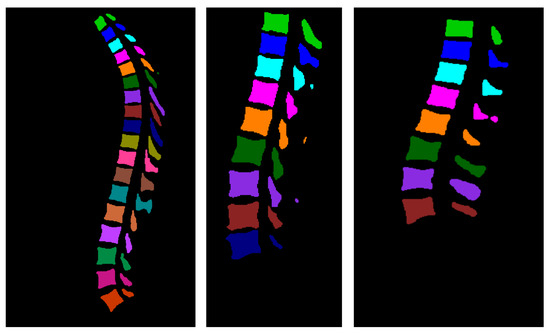
Figure 5.
Sample outputs of cluster analysis and arch/body coupling.
4.2.4. Multi-Class Segmentation
Once the centroids have been computed, every point of the volume which is not part of the background is assigned to the same label of the nearest centroid in terms of Euclidean distances. To accomplish this procedure, we exploited a non-parametric method, the k-nearest neighbors (k-NN) classifier, which is based on distances between samples. The workflow of this algorithm can be summarized into three main steps [36]:
- The learning phase, which is not mandatory, results in the partitioning of the hyperspace in clusters based on samples’ positions.
- The distance computation phase consists of the computation of all the distances between samples and centroids (the most used distance metric is the Euclidean Distance, as we did in this work, but it is also possible to use Manhattan Distance or other distances).
- The classification phase assigns each sample to the class of the nearest cluster’s centroid.
For our purposes, the learning phase has not been performed since the centroids have already been computed in the k-means clustering stage.
4.3. Visualization Tool
In this study, we also developed a visualization tool that enables to visualize the CT scans and masks through a graphic user interface (GUI) based on the Qt framework, ITK, VTK and OpenCV libraries [37,38,39]. It offers multiple functionalities, such as image contrast adjustment, mask visualization and mesh reconstruction. As shown in Figure 6, the interface is composed of three major parts. The toolbox section facilitates the loading and reading of the CT images from a local folder and allows to smoothly navigate through the slices. The toolbox includes a windowing option to set custom values of window-width and window-level and adjusts image contrast for optimized visualization of the anatomical regions of interest. The segmentation results are overlaid on the original images and each vertebra is colored differently so that it remains convenient to identify a particular vertebra. Furthermore, the vertebrae’s centroids and names are shown in the sagittal and coronal views. Three of the four windows in the views section show the CT scan in the axial, sagittal and coronal planes. A fourth window is used to show a reconstruction of the volume obtained from the segmentation masks. The aforementioned task is achieved by using the VTK discrete marching cubes algorithm.
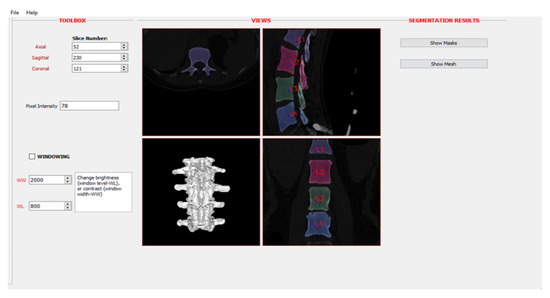
Figure 6.
Visualization tool for visualizing CT scans and masks.
5. Results
5.1. Quality Measures
The quality measures considered, analogously to those adopted in other segmentation works [40,41,42], can be grouped in two classes:
- measures based on volumetric overlap, such as Dice coefficient (), and . Such metrics allow to compute a similarity degree between the prediction and the ground truth;
- measures based on the concept of surface distance, such as maximum symmetric surface distance () and average symmetric surface distance ().
, and can be expressed in terms of true positives (), false negatives () and false positives (). They are defined in Equation (2), Equation (3) and Equation (4), respectively.
In surgical planning applications, it is important to have precise meshes of the anatomical site of interest. In order to properly assess this aspect, a collection of really important quality measures are those based on the external surface distance. Let P be the predicted volume and G the ground truth volume, then we can define , as in Equation (5), where d is a distance measure and () is the distance between every point on the surface of the prediction and the ground truth surface (every point on the surface of the ground truth and the prediction surface).
The distance between a point and a surface is defined as in Equation (6).
The is defined as in Equation (7).
5.2. Experimental Results
Regarding the binary segmentation task, 3D V-Net obtained the results reported in Table 3 considering a test set of 50 images. We reported quality measures for the CNN trained every 100 epochs, showing that convergence for the considered model can be achieved after 200 epochs. These results allowed to obtain a realistic segmentation of the whole spine, as can be seen from Figure 7.

Table 3.
Spine binary segmentation results. stands for average symmetric surface distance, whereas stands for maximum symmetric surface distance. Best result for each of the reported measures is in bold font.
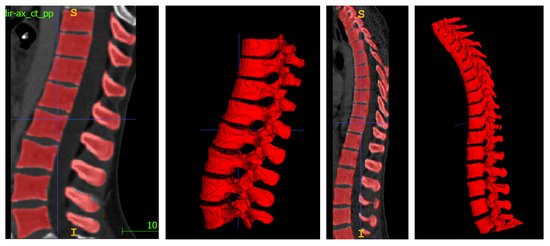
Figure 7.
Examples of binary spine segmentation.
For what concerns the multi-class vertebrae identification, we obtained a multi-class of 90.09 ± 3.14%. We calculated the multi-class score for the vertebrae labeling task in an ideal condition, i.e., starting the vertebrae identification procedure from ground truths of spine segmentation. Results are reported as mean ± standard deviation. Multi-class is computed as the average of the binary s for each vertebra class. Kindly note that the vertebrae identification algorithm proposed in this paper may not work optimally for the C1, C2 and C3 vertebrae, since the shapes of the bodies of these vertebrae can be easily mistaken with their arches. The centroids’ predictions examples are shown in Figure 8. The following vertebrae labeling, obtained with k-NN, is depicted in Figure 9.
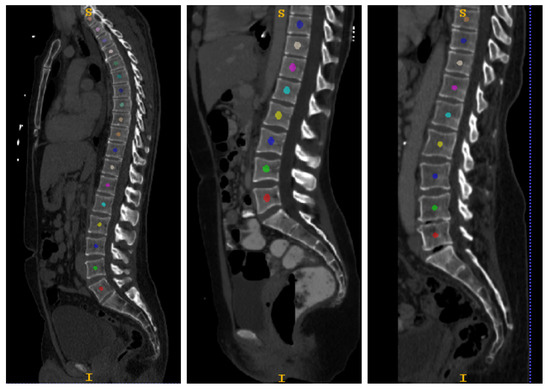
Figure 8.
Samples of final output of the centroids’ prediction.
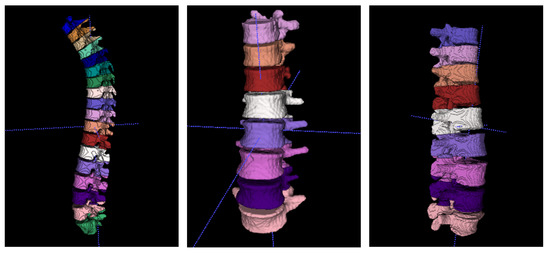
Figure 9.
Sample outputs of meshes of multi-class vertebrae segmentation. These meshes have been obtained exploiting ITK-Snap (http://www.itksnap.org/, last accessed: 6 June 2021).
In order to assess the quality of the vertebrae labeling stage on scoliosis cases, we exploited a collection of 12 CT scans coming from Medica Sud s.r.l. Four out of the 12 CT scans belong to the patients with severe scoliosis, 4 to the patients with moderate scoliosis and the remaining 4 to the patients with mild scoliosis. Since for these images we only had information about the severity of the scoliosis, we considered the method of Payer et al. [17] as the gold standard, and computed the multi-class as a similarity measure across the two methodologies. We started from the same binary spine segmentation for both algorithms, obtained by exploiting Payer’s pre-trained models, therefore focusing the comparison on the labeling stage. We calculated multi-class separately for each scoliosis category, obtaining 43.40 ± 30.03%, 70.61 ± 18.50%, 83.38 ± 12.51%, for severe, moderate and mild scoliosis patients, respectively. After adding Inertia Tensor to the feature set for discriminating between arches and bodies, we obtained multi-class s of 49.79 ± 24.90%, 77.76 ± 15.05% and 83.48 ± 12.56%, clearly showing an improvement for severe and moderate scoliosis cases. The results show that the proposed vertebrae identification stage appears to have promising results on mild and moderate scoliosis; however, the identification for severe scoliosis cases can be further improved in future works. This problem arises from the fact that the k-NN model has a too low complexity for modeling severe scoliosis cases. Example results on this dataset are shown in Figure 10. A comparison between the proposed method and related works is reported in Table 1.
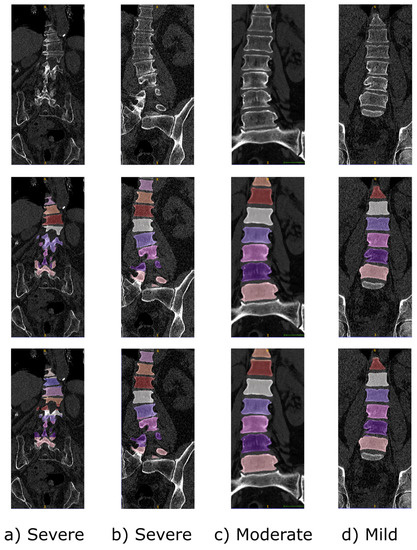
Figure 10.
Comparison between Payer et al. [17] and the proposed method for the vertebrae labeling task. The first row shows original CT scans, the second row shows predictions from Payer et al., the third row shows predictions with the proposed vertebrae labeling method. Columns: (a,b) are of patients with severe scoliosis, (c) of a patient with moderate scoliosis and (d) of a patient with mild scoliosis. It is important to note that for case (a) our method did not provide an accurate result.
6. Conclusions and Future Works
Several methods have been proposed in the literature for the purpose of vertebrae segmentation and labeling. Many of these address only the binary spine segmentation, as in Kim et al. [10] and Vania et al. [3]. However, the methods which involve individual vertebrae segmentation are characterized by complex architectures and require tons of labeled data to be correctly implemented, as for the top scoring architectures in VerSe challenges, e.g., Payer et al. [17] and Lessman et al. [9]. Our method for vertebrae labeling can be considered a novel approach, implementing k-means clustering for separating vertebral arches from bodies and k-NN classification in the context of vertebrae labeling. It is a simple yet effective solution and, most importantly, it does not require a specific training procedure. Therefore, it can also be performed without having masks provided by domain experts. The developed algorithm addresses the issues of vertebrae identification and segmentation, which are two essential steps in understanding spine imaging data. Vertebrae segmentation is a challenging and time-consuming task, due to the size of the problem. The proposed work provides accurate results in a fast and straightforward way. The clinical implications of this study also include the possibility of improving functionalities of surgical navigators for minimally invasive procedures. This can help spine surgeons to operate even in unideal conditions, such as with restricted field-of-views. Moreover, our method can be exploited to pre-label larger CT scan datasets with individual vertebrae annotations, so that purely supervised approaches can be enhanced. The obtained is quite good, also if we consider that the proposed approach is less general than those involved in the VerSe challenges, which covered all kinds of orientation, spacing and field-of-view for CT spine imaging data.
Author Contributions
Conceptualization, N.A. and V.B.; methodology, N.A. and V.B.; software, N.A., G.D.G., N.F., C.C. and E.S.; supervision, A.G., G.B., V.T. and V.B.; validation, N.A., A.B., D.B. and I.S.T.; visualization, N.A., G.D.G., N.F., C.C. and E.S.; writing—original draft, N.A., G.D.G., N.F., C.C., E.S., B.P. and S.M.H.; writing—review and editing, N.A., G.D.G., N.F., C.C., E.S., B.P., S.M.H., A.B., D.B., A.G., I.S.T., G.B., V.T. and V.B. All authors have read and agreed to the published version of the manuscript.
Funding
This research has been partially funded by the project “ARONA—Advanced Robotic Surgical Navigation” (n. ARS01_00132) within the Ministry of Education, University and Research (MIUR) call PNR 2015-2020.
Institutional Review Board Statement
For the data coming from Medica Sud s.r.l., the study was conducted according to the guidelines of the Declaration of Helsinki. Ethical review and approval were waived for this study since this was a retrospective observational study with anonymized data.
Informed Consent Statement
Patient consent was waived due to the fact that this was a retrospective observational study with anonymized data, already acquired for medical diagnostic purposes.
Data Availability Statement
The CT scans from the VerSe challenges are available from OSF repository (https://osf.io/t98fz/, last accessed: 6 June 2021). The CT scans from Medica Sud s.r.l. presented in this study are available on request from the corresponding author.
Conflicts of Interest
The authors declare no conflict of interest.
References
- Sekuboyina, A.; Bayat, A.; Husseini, M.E.; Löffler, M.; Li, H.; Tetteh, G.; Kukačka, J.; Payer, C.; Štern, D.; Urschler, M.; et al. VerSe: A Vertebrae Labelling and Segmentation Benchmark for Multi-detector CT Images. arXiv 2020, arXiv:2001.09193. [Google Scholar]
- Williams, A.L.; Al-Busaidi, A.; Sparrow, P.J.; Adams, J.E.; Whitehouse, R.W. Under-reporting of osteoporotic vertebral fractures on computed tomography. Eur. J. Radiol. 2009, 69, 179–183. [Google Scholar] [CrossRef] [PubMed]
- Vania, M.; Mureja, D.; Lee, D. Automatic spine segmentation from CT images using Convolutional Neural Network via redundant generation of class labels. J. Comput. Des. Eng. 2019, 6, 224–232. [Google Scholar] [CrossRef]
- Korez, R.; Ibragimov, B.; Likar, B.; Pernuš, F.; Vrtovec, T. A Framework for Automated Spine and Vertebrae Interpolation-Based Detection and Model-Based Segmentation. IEEE Trans. Med. Imaging 2015, 34, 1649–1662. [Google Scholar] [CrossRef]
- Yao, J.; Burns, J.E.; Forsberg, D.; Seitel, A.; Rasoulian, A.; Abolmaesumi, P.; Hammernik, K.; Urschler, M.; Ibragimov, B.; Korez, R.; et al. A multi-center milestone study of clinical vertebral CT segmentation. Comput. Med. Imaging Graph. 2016, 49, 16–28. [Google Scholar] [CrossRef]
- Löffler, M.T.; Sekuboyina, A.; Jacob, A.; Grau, A.L.; Scharr, A.; El Husseini, M.; Kallweit, M.; Zimmer, C.; Baum, T.; Kirschke, J.S. A Vertebral Segmentation Dataset with Fracture Grading. Radiol. Artif. Intell. 2020, 2, e190138. [Google Scholar] [CrossRef] [PubMed]
- Sekuboyina, A.; Rempfler, M.; Valentinitsch, A.; Menze, B.H.; Kirschke, J.S. Labeling Vertebrae with Two-dimensional Reformations of Multidetector CT Images: An Adversarial Approach for Incorporating Prior Knowledge of Spine Anatomy. Radiol. Artif. Intell. 2020, 2, e190074. [Google Scholar] [CrossRef]
- Yao, J.; Burns, J.E.; Munoz, H.; Summers, R.M. Detection of Vertebral Body Fractures Based on Cortical Shell Unwrapping; Springer: Berlin/Heidelberg, Germany, 2012; pp. 509–516. [Google Scholar]
- Lessmann, N.; van Ginneken, B.; de Jong, P.A.; Išgum, I. Iterative fully convolutional neural networks for automatic vertebra segmentation and identification. Med. Image Anal. 2019, 53, 142–155. [Google Scholar] [CrossRef]
- Kim, Y.J.; Ganbold, B.; Kim, K.G. Web-based spine segmentation using deep learning in computed tomography images. Healthc. Inform. Res. 2020, 26, 61–67. [Google Scholar] [CrossRef]
- Furqan Qadri, S.; Ai, D.; Hu, G.; Ahmad, M.; Huang, Y.; Wang, Y.; Yang, J. Automatic Deep Feature Learning via Patch-Based Deep Belief Network for Vertebrae Segmentation in CT Images. Appl. Sci. 2019, 9, 69. [Google Scholar] [CrossRef]
- Zareie, M.; Parsaei, H.; Amiri, S.; Awan, M.S.; Ghofrani, M. Automatic segmentation of vertebrae in 3D CT images using adaptive fast 3D pulse coupled neural networks. Australas. Phys. Eng. Sci. Med. 2018, 41, 1009–1020. [Google Scholar] [CrossRef] [PubMed]
- Ronneberger, O.; Fischer, P.; Brox, T. U-net: Convolutional networks for biomedical image segmentation. Lect. Notes Comput. Sci. 2015, 9351, 234–241. [Google Scholar] [CrossRef]
- Hinton, G.E.; Osindero, S.; Teh, Y.W. A fast learning algorithm for deep belief nets. Neural Comput. 2006, 18, 1527–1554. [Google Scholar] [CrossRef] [PubMed]
- Chang, Q.; Shi, J.; Xiao, Z. A New 3D Segmentation Algorithm Based on 3D PCNN for Lung CT Slices. In Proceedings of the 2009 2nd International Conference on Biomedical Engineering and Informatics, Tianjin, China, 17–19 October 2009; pp. 1–5. [Google Scholar] [CrossRef]
- Bae, H.J.; Hyun, H.; Byeon, Y.; Shin, K.; Cho, Y.; Song, Y.J.; Yi, S.; Kuh, S.U.; Yeom, J.S.; Kim, N. Fully automated 3D segmentation and separation of multiple cervical vertebrae in CT images using a 2D convolutional neural network. Comput. Methods Programs Biomed. 2020, 184. [Google Scholar] [CrossRef] [PubMed]
- Payer, C.; Štern, D.; Bischof, H.; Urschler, M. Coarse to fine vertebrae localization and segmentation with spatialconfiguration-Net and U-Net. VISIGRAPP 2020, 5, 124–133. [Google Scholar] [CrossRef]
- Sekuboyina, A.; Rempfler, M.; Kukačka, J.; Tetteh, G.; Valentinitsch, A.; Kirschke, J.S.; Menze, B.H. Btrfly Net: Vertebrae Labelling with Energy-Based Adversarial Learning of Local Spine Prior. Lect. Notes Comput. Sci. 2018, 11073 LNCS, 649–657. [Google Scholar] [CrossRef]
- Glocker, B.; Zikic, D.; Konukoglu, E.; Haynor, D.R.; Criminisi, A. Vertebrae Localization in Pathological Spine CT via Dense Classification from Sparse Annotations; Springer: Berlin/Heidelberg, Germany, 2013; pp. 262–270. [Google Scholar]
- Glocker, B.; Feulner, J.; Criminisi, A.; Haynor, D.R.; Konukoglu, E. Automatic Localization and Identification of Vertebrae in Arbitrary Field-of-View CT Scans; Springer: Berlin/Heidelberg, Germany, 2012; pp. 590–598. [Google Scholar]
- LeCun, Y.; Bengio, Y.; Hinton, G. Deep learning. Nature 2015, 521, 436–444. [Google Scholar] [CrossRef]
- Long, J.; Shelhamer, E.; Darrell, T. Fully Convolutional Networks for Semantic Segmentation. arXiv 2014, arXiv:1411.4038. [Google Scholar]
- Çiçek, O.; Abdulkadir, A.; Lienkamp, S.S.; Brox, T.; Ronneberger, O. 3D U-Net: Learning Dense Volumetric Segmentation from Sparse Annotation. Lect. Notes Comput. Sci. 2016, 9901 LNCS, 424–432. [Google Scholar] [CrossRef]
- Milletari, F.; Navab, N.; Ahmadi, S.A.A. V-Net: Fully Convolutional Neural Networks for Volumetric Medical Image Segmentation. In Proceedings of the 2016 Fourth International Conference on 3D Vision (3DV), Stanford, CA, USA, 25–28 October 2016; pp. 565–571. [Google Scholar] [CrossRef]
- Liu, L.; Cheng, J.; Quan, Q.; Wu, F.X.; Wang, Y.P.; Wang, J. A survey on U-shaped networks in medical image segmentations. Neurocomputing 2020, 409, 244–258. [Google Scholar] [CrossRef]
- Lateef, F.; Ruichek, Y. Survey on semantic segmentation using deep learning techniques. Neurocomputing 2019, 338, 321–348. [Google Scholar] [CrossRef]
- Altini, N.; Cascarano, G.D.; Brunetti, A.; Marino, F.; Rocchetti, M.T.; Matino, S.; Venere, U.; Rossini, M.; Pesce, F.; Gesualdo, L.; et al. Semantic Segmentation Framework for Glomeruli Detection and Classification in Kidney Histological Sections. Electronics 2020, 9, 503. [Google Scholar] [CrossRef]
- Altini, N.; Cascarano, G.D.; Brunetti, A.; De Feudis, D.I.; Buongiorno, D.; Rossini, M.; Pesce, F.; Gesualdo, L.; Bevilacqua, V. A Deep Learning Instance Segmentation Approach for Global Glomerulosclerosis Assessment in Donor Kidney Biopsies. Electronics 2020, 9, 1768. [Google Scholar] [CrossRef]
- Bevilacqua, V.; Brunetti, A.; Cascarano, G.D.; Guerriero, A.; Pesce, F.; Moschetta, M.; Gesualdo, L. A comparison between two semantic deep learning frameworks for the autosomal dominant polycystic kidney disease segmentation based on magnetic resonance images. BMC Med. Inform. Decis. Mak. 2019, 19, 244. [Google Scholar] [CrossRef]
- Altini, N.; Prencipe, B.; Brunetti, A.; Brunetti, G.; Triggiani, V.; Carnimeo, L.; Marino, F.; Guerriero, A.; Villani, L.; Scardapane, A.; et al. A Tversky Loss-Based Convolutional Neural Network for Liver Vessels Segmentation; Springer: Cham, Switzerland, 2020; Volume 12463 LNCS. [Google Scholar] [CrossRef]
- Adams, J.E.; Mughal, Z.; Damilakis, J.; Offiah, A.C. Radiology. Biol. Dis. 2012. [Google Scholar] [CrossRef]
- He, K.; Zhang, X.; Ren, S.; Sun, J. Delving deep into rectifiers: Surpassing human-level performance on imagenet classification. In Proceedings of the 2015 IEEE International Conference on Computer Vision (ICCV), Santiago, Chile, 7–13 December 2015; pp. 1026–1034. [Google Scholar] [CrossRef]
- Shen, C.; Milletari, F.; Roth, H.R.; Oda, H.; Oda, M.; Hayashi, Y.; Misawa, K.; Mori, K. Improving V-Nets for multi-class abdominal organ segmentation. In Medical Imaging 2019: Image Processing; Angelini, E.D., Landman, B.A., Eds.; International Society for Optics and Photonics, SPIE: Bellingham, DC, USA, 2019; Volume 10949, pp. 76–82. [Google Scholar] [CrossRef]
- Pérez-García, F.; Sparks, R.; Ourselin, S. TorchIO: A Python library for efficient loading, preprocessing, augmentation and patch-based sampling of medical images in deep learning. arXiv 2020, arXiv:2003.04696. [Google Scholar]
- Sonka, M.; Hlavac, V.; Boyle, R. Image Processing, Analysis, and Machine Vision; Cengage Learning: Boston, MA, USA, 2014. [Google Scholar]
- Shakhnarovich, G.; Darrell, T.; Indyk, P. Nearest-neighbor methods in learning and vision. In Neural Information Processing Series; MIT Press: Cambrdige, MA, USA, 2005. [Google Scholar]
- McCormick, M.; Liu, X.; Ibanez, L.; Jomier, J.; Marion, C. ITK: Enabling reproducible research and open science. Front. Neuroinform. 2014, 8, 13. [Google Scholar] [CrossRef]
- Schroeder, W.; Martin, K.L.B. The Visualization Toolkit, 4th ed.; Kitware: Clifton Park, NY, USA, 2006. [Google Scholar]
- Bradski, G. The OpenCV Library. Dr. Dobb’s J. Softw. Tools 2000, 25, 120–125. [Google Scholar]
- Heimann, T.; van Ginneken, B.; Styner, M.M.A.; Arzhaeva, Y.; Aurich, V.; Bauer, C.; Beck, A.; Becker, C.; Beichel, R.; Bekes, G.; et al. Comparison and Evaluation of Methods for Liver Segmentation From CT Datasets. IEEE Trans. Med. Imaging 2009, 28, 1251–1265. [Google Scholar] [CrossRef]
- Bilic, P.; Christ, P.F.; Vorontsov, E.; Chlebus, G.; Chen, H.; Dou, Q.; Fu, C.W.; Han, X.; Heng, P.A.; Hesser, J.; et al. The Liver Tumor Segmentation Benchmark (LiTS). arXiv 2019, arXiv:1901.04056. [Google Scholar]
- Prencipe, B.; Altini, N.; Cascarano, G.D.; Guerriero, A.; Brunetti, A. A Novel Approach Based on Region Growing Algorithm for Liver and Spleen Segmentation from CT Scans. In Intelligent Computing Theories and Application; Huang, D.S., Bevilacqua, V., Hussain, A., Eds.; Springer International Publishing: Cham, Switzerland, 2020; pp. 398–410. [Google Scholar]
Publisher’s Note: MDPI stays neutral with regard to jurisdictional claims in published maps and institutional affiliations. |
© 2021 by the authors. Licensee MDPI, Basel, Switzerland. This article is an open access article distributed under the terms and conditions of the Creative Commons Attribution (CC BY) license (https://creativecommons.org/licenses/by/4.0/).