Estimating Freeway Level-of-Service Using Crowdsourced Data
Abstract
1. Introduction
2. Literature Review
2.1. Traffic Status and LOS Assessment Methods
2.2. Travel Time Reliability
2.3. Alternative LOS Methods
2.4. Waze Data
2.5. Gap in the Literature
3. Data
3.1. Waze Speed and Travel Time Data
3.2. Waze Crowdsourced Alert Data
3.3. Fixed Location Data
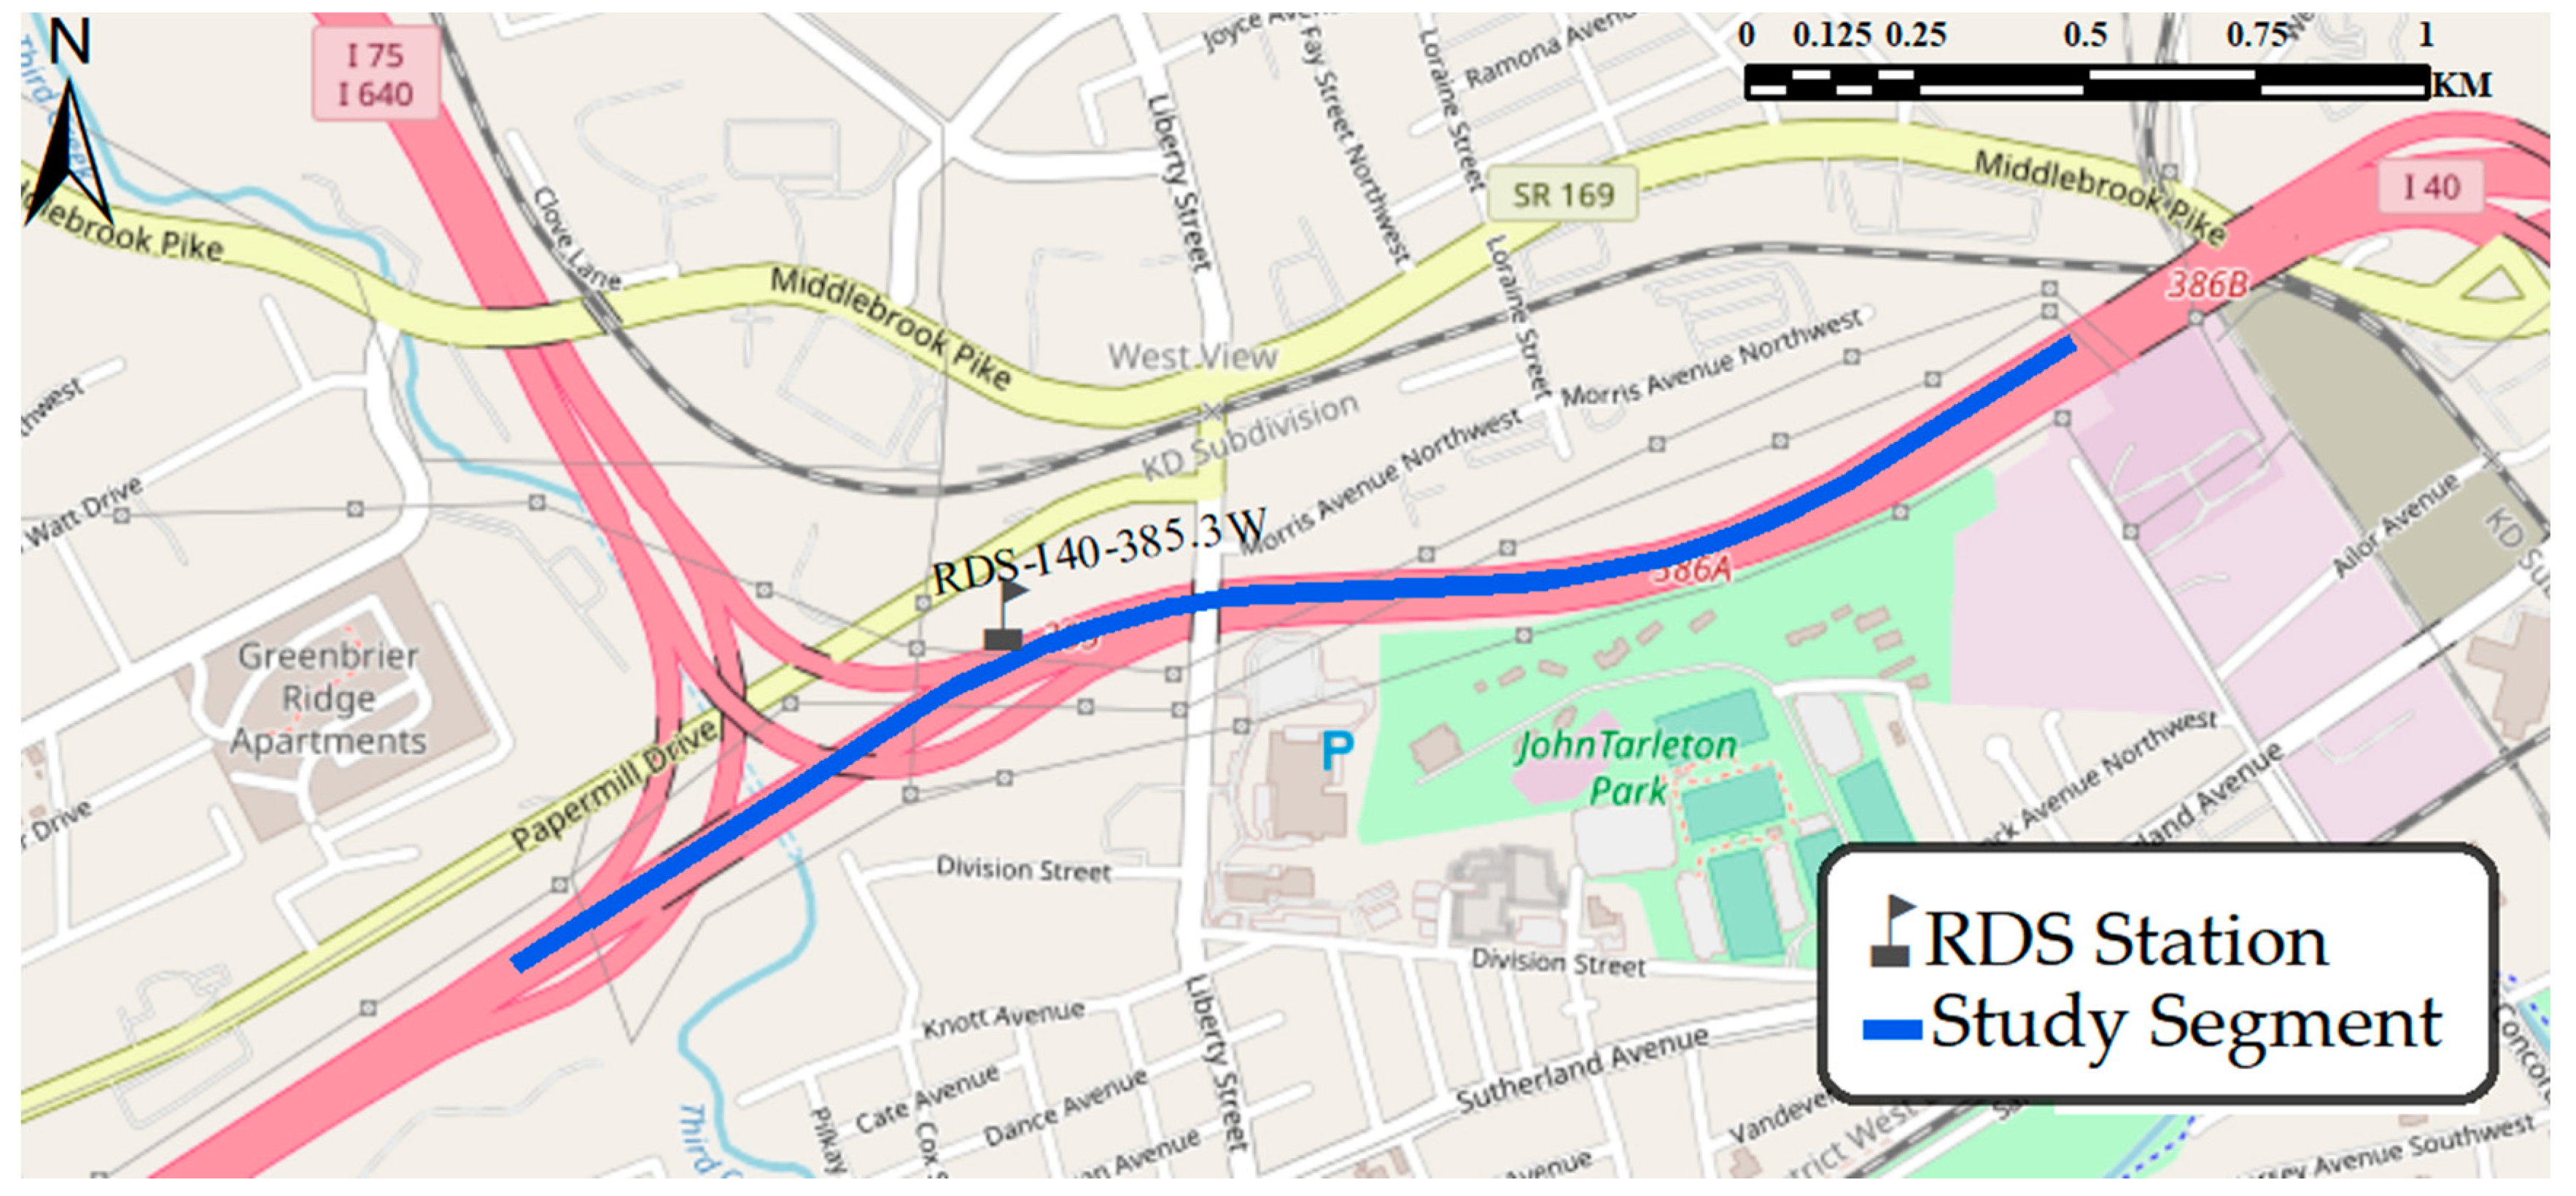
3.4. Study Time and Area
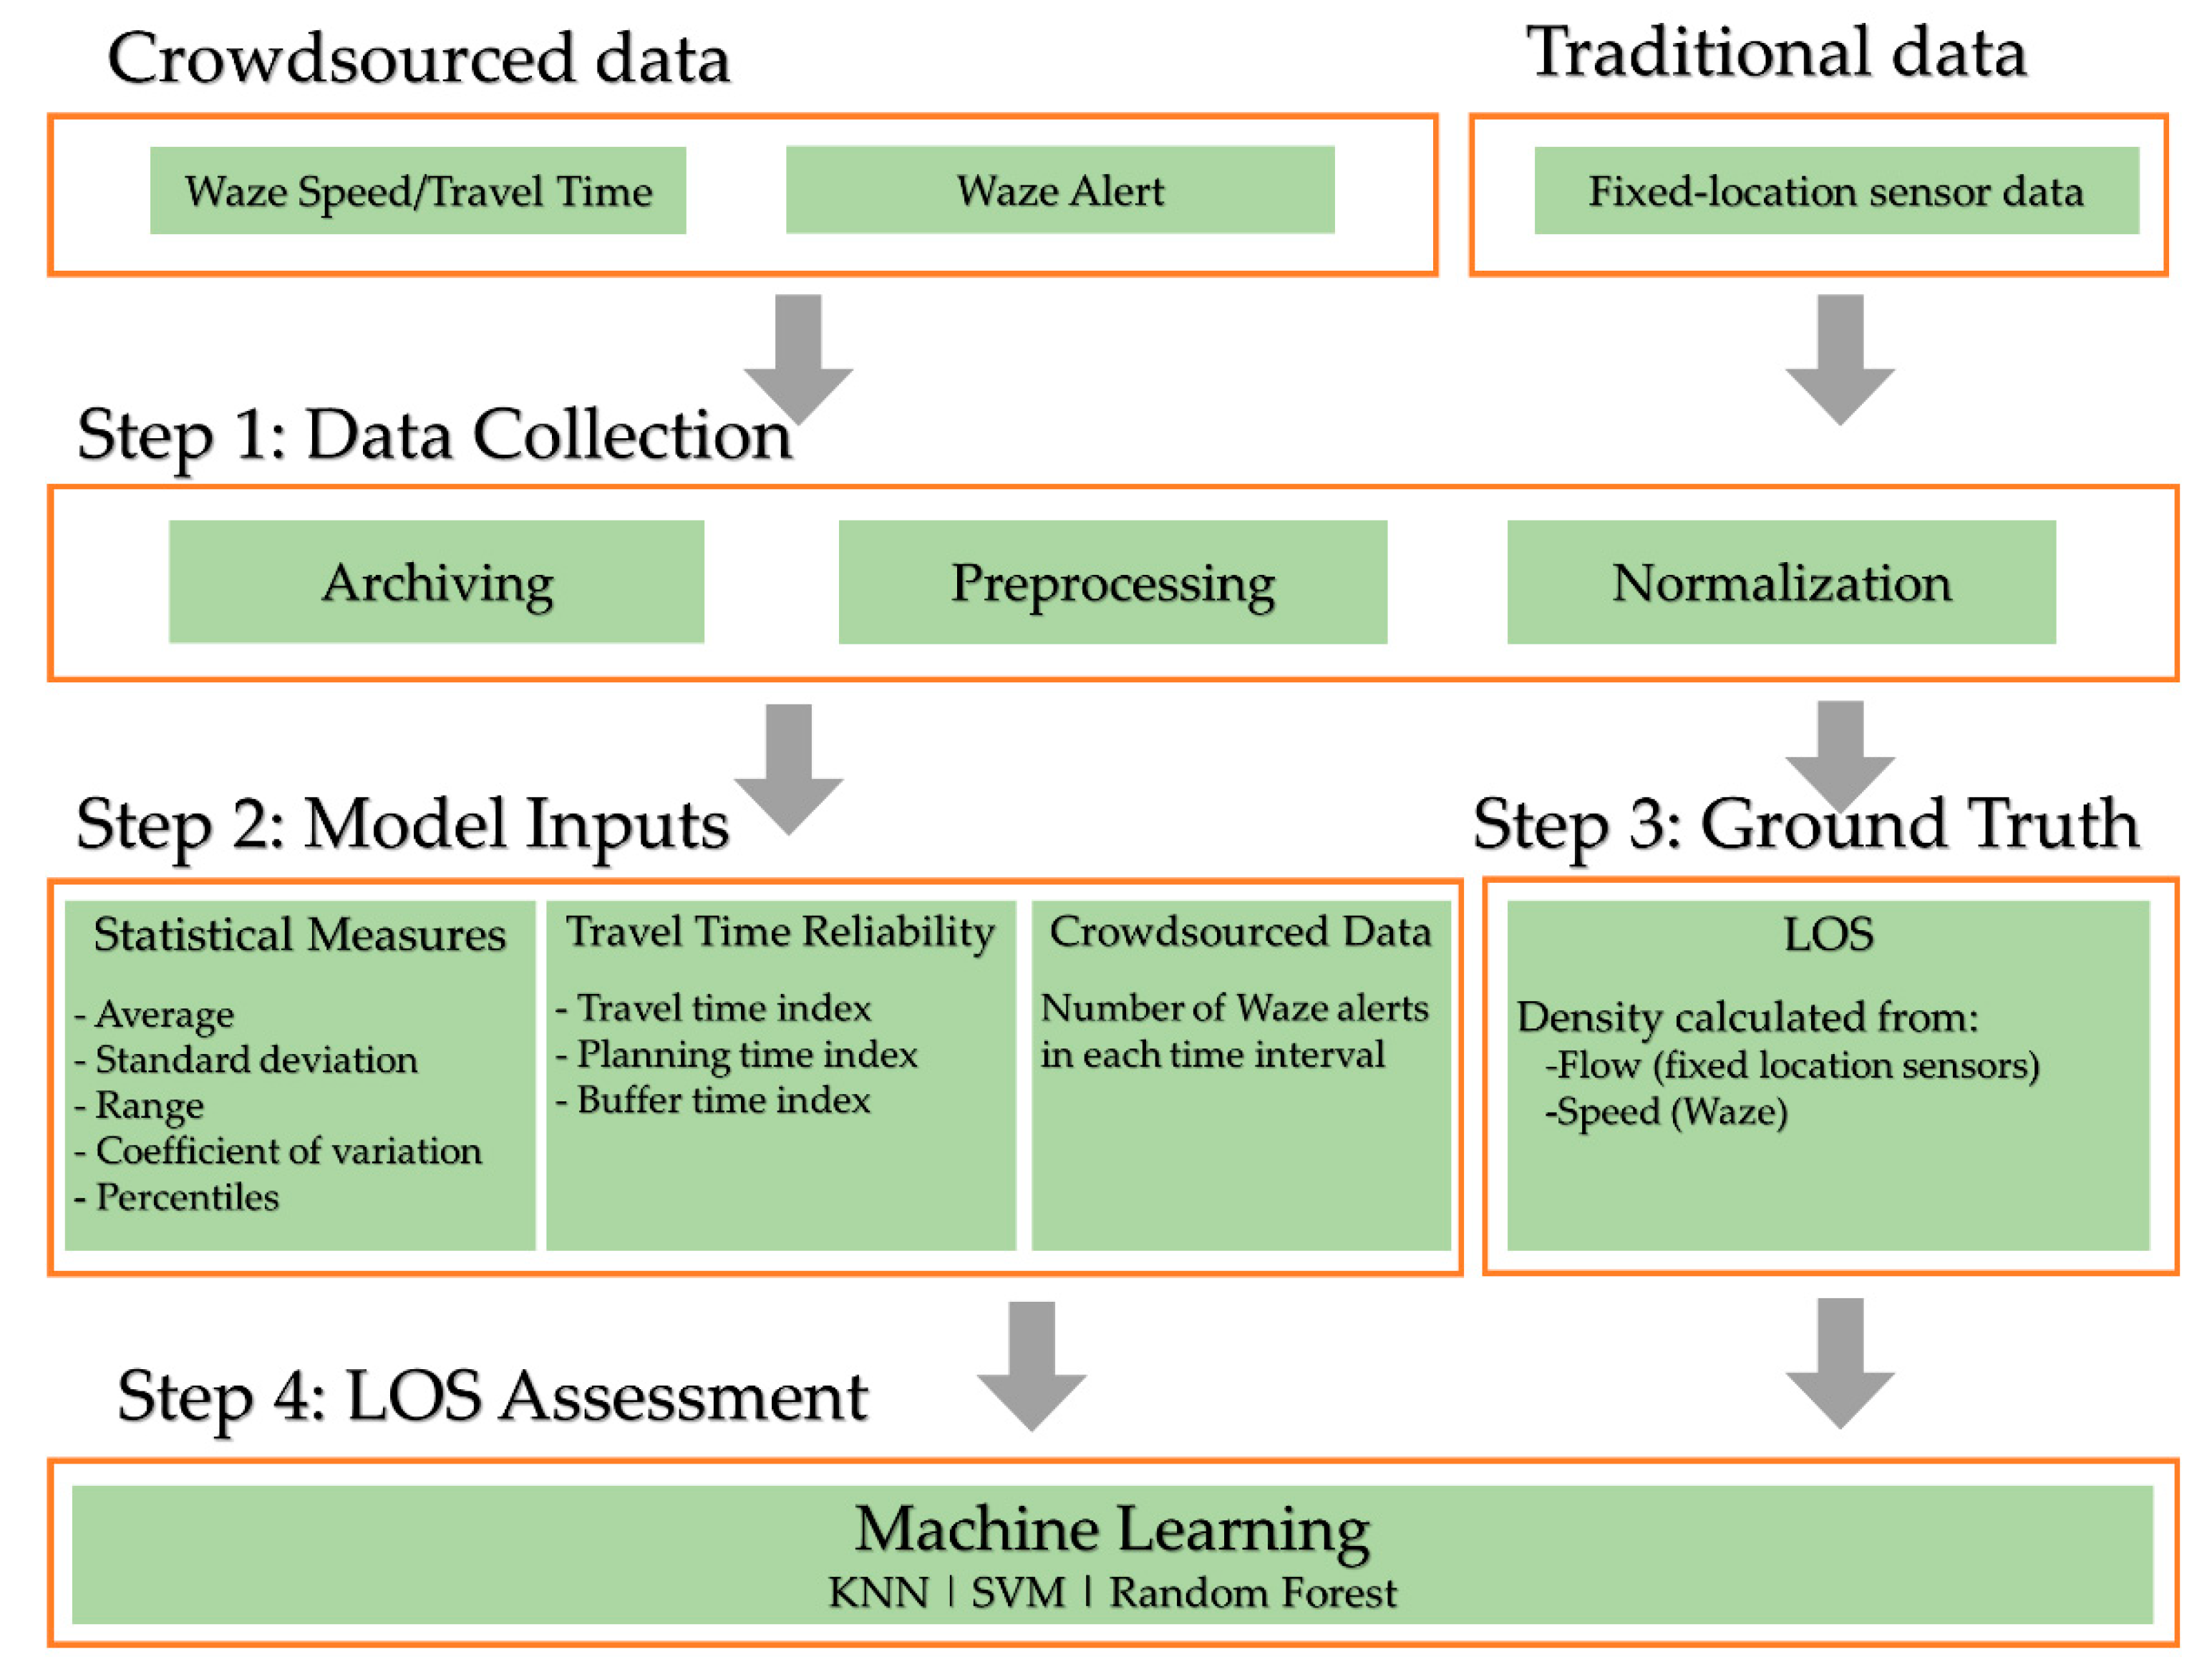
4. Methodology
- Step 1: Data collection, which includes archiving Waze data and traditional fixed location sensor data, as well as preprocessing and normalization;
- Step 2: Extract model inputs, which includes statistical measures, travel time performance measures, and crowdsourced Waze alerts;
- Step 3: Calculating ground truth LOS, using fixed location sensors, and labeling observations of Waze input data with the corresponding ground truth data;
- Step 4: LOS assessment, by performing different machine learning methods. This part includes feature selection, cross validation, and selecting the preferred method.
4.1. Step 1: Data Collection
4.2. Step 2: Model Inputs
- Basic statistical measures, including the average speed, standard deviation, range, coefficient of variation, standard error, percentiles (25th, 50th, and 90th), and interquartile range.
- Travel time performance measures, including the Travel Time Index, Planning Time Index, and Buffer Time Index.
- Crowdsourced data, including the number of users’ accident, jam, and hazard reports in the Waze alerts data.
4.2.1. Basic Statistical Measures
4.2.2. Travel Time Performance Measures
- The Travel Time Index (TTI) captures the travel time variation by calculating the average travel time ratio to the free flow travel time in the segment. This index explores how the travel time deviates from the free flow travel time during the intended period, which is typically LOS A [30].
4.2.3. Crowdsourced Data
4.3. Step 3: Ground Truth LOS
4.4. Step 4: Machine Learning Methods
- Random Forest (RF): RF is an ensemble classification method that combines several random decision trees. In this method, all trees are built independently. Then, it classifies the data based on the majority of votes of all trees;
- Support Vector Machines (SVM): SVMs are well-known margin-based classification methods. For each class, the SVM algorithm finds the optimal support vector that provides the maximum distance to other classes. By calculating the optimal support vectors, the algorithm can identify the boundaries and classify the data;
- K-Nearest Neighbor (KNN): KNNs are non-parametric methods that are widely used for classification. All training data are considered in an n-dimensional feature space (n = number of input features) in this method. For each observation, the algorithm looks for the k (a predefined constant) nearest neighbors based on the Euclidean distance. Then, it assigns the category based on the most frequent label of the neighbors.
5. Results
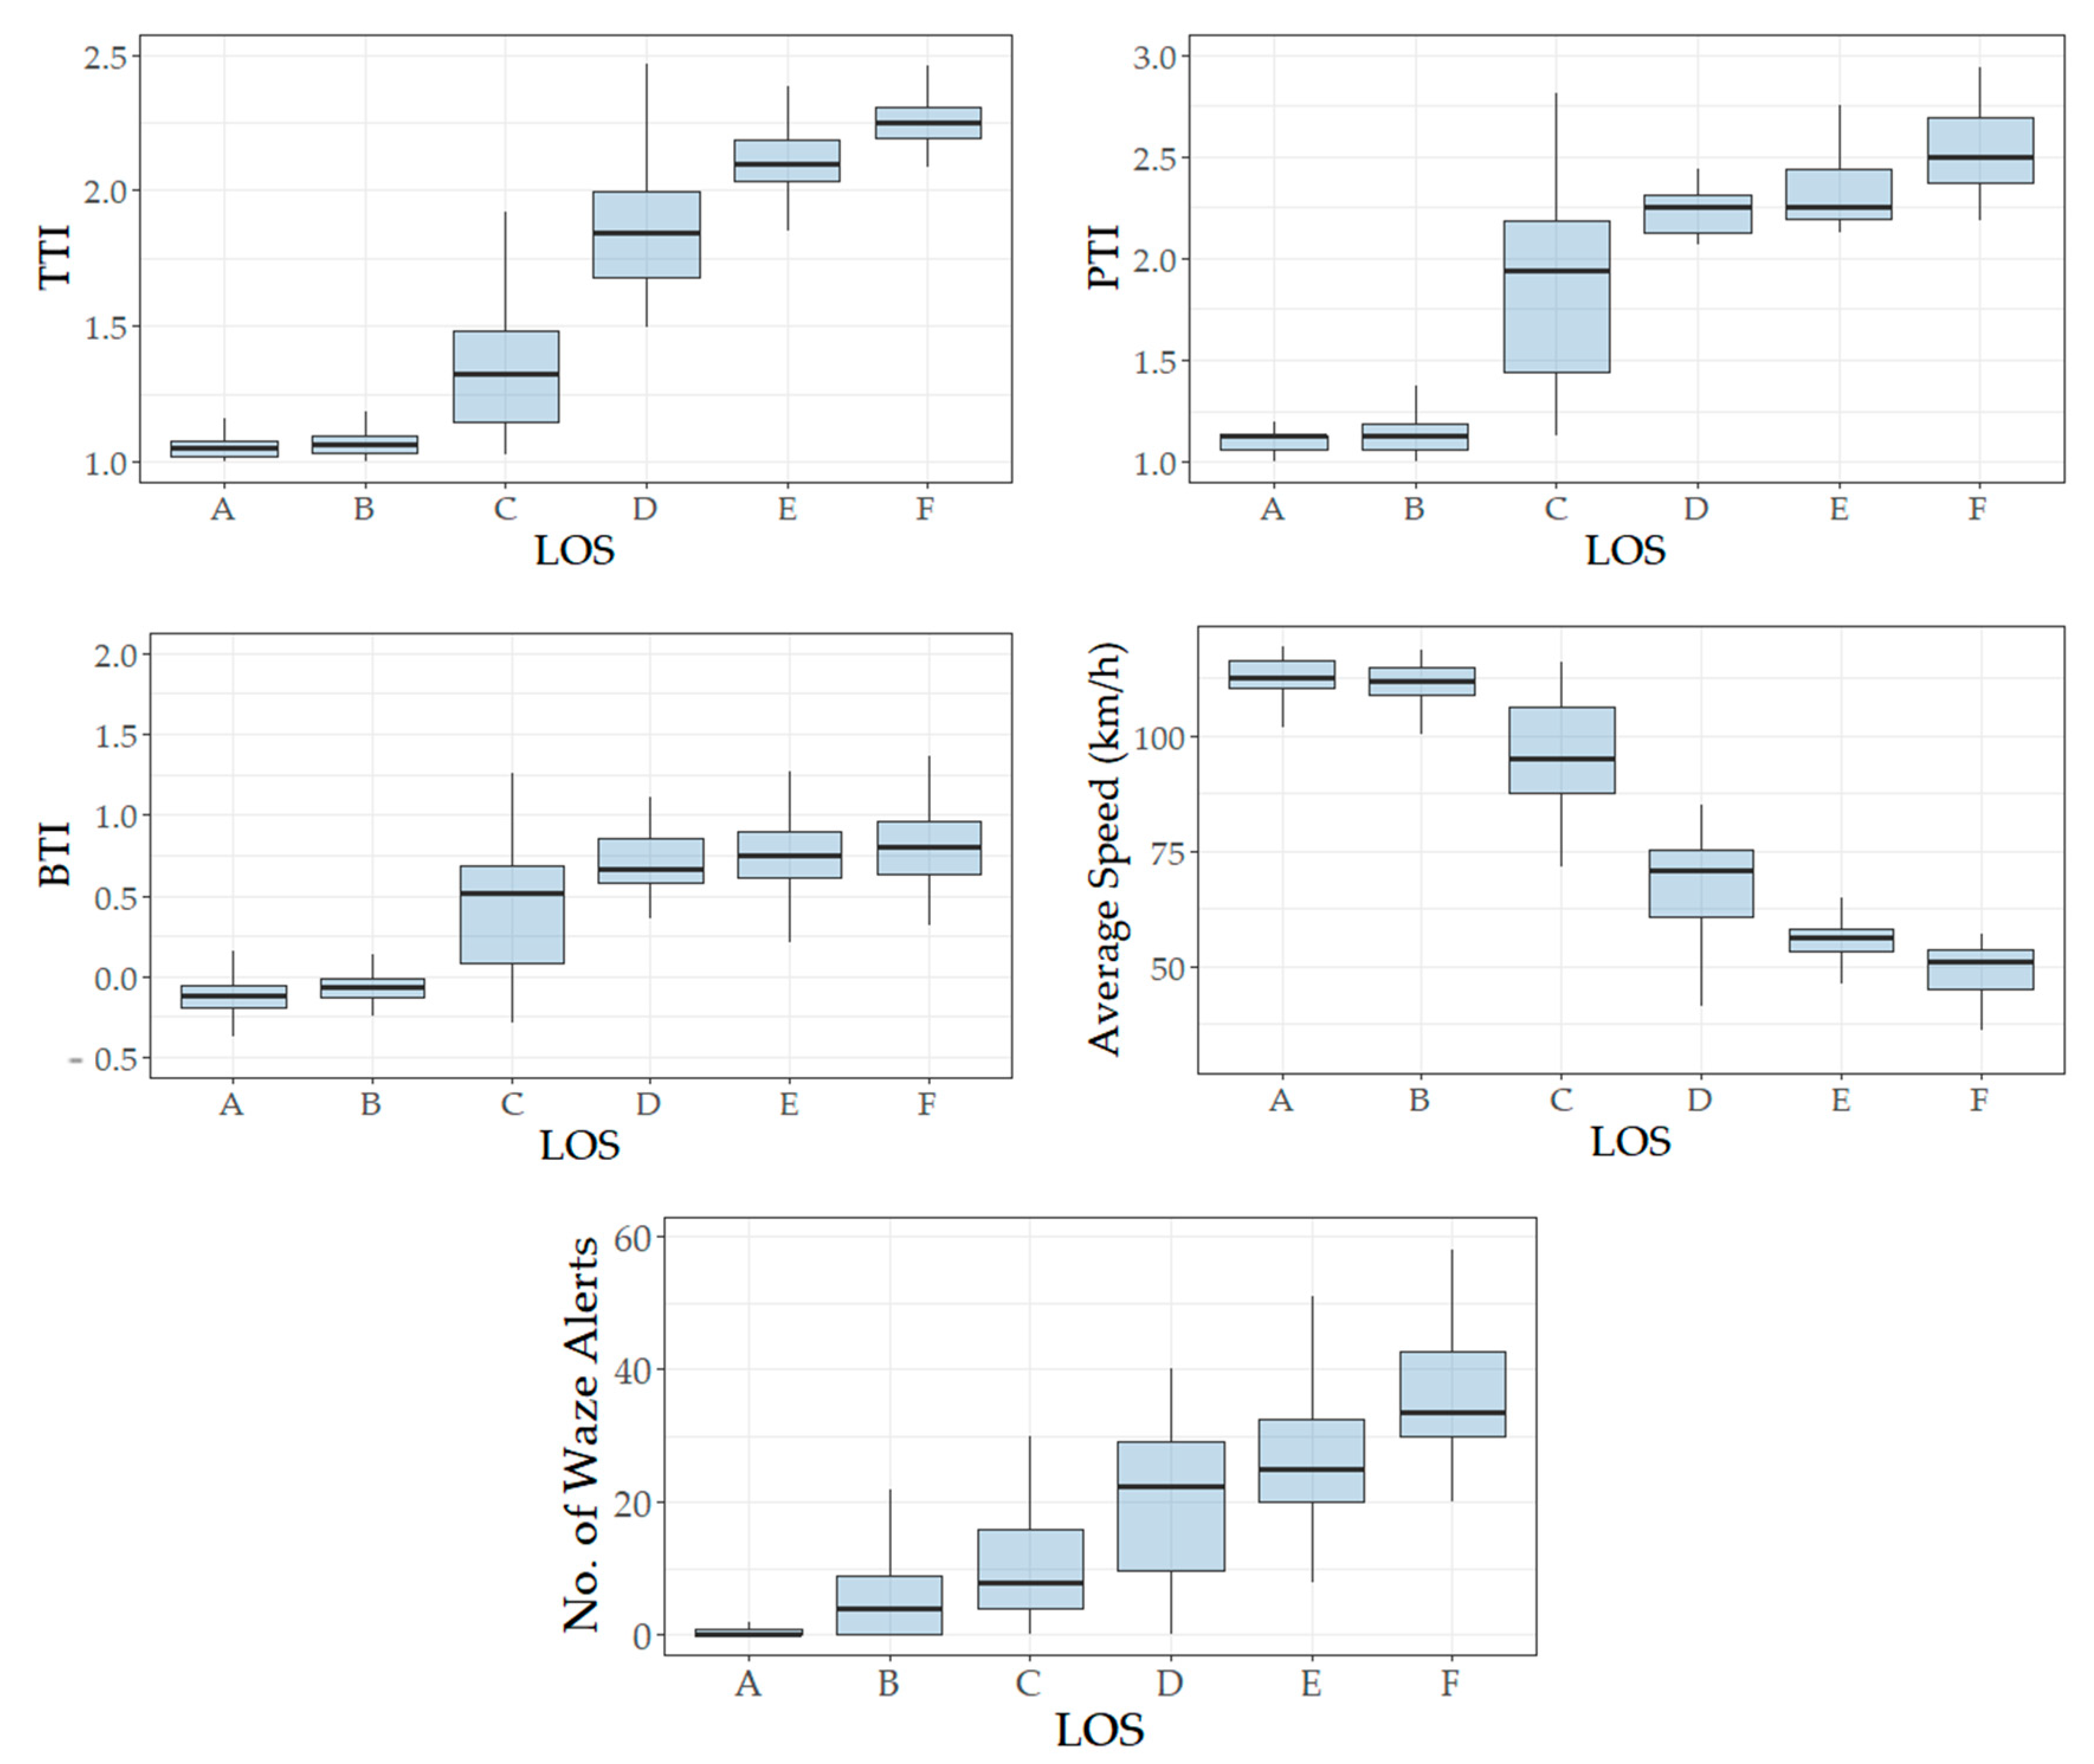
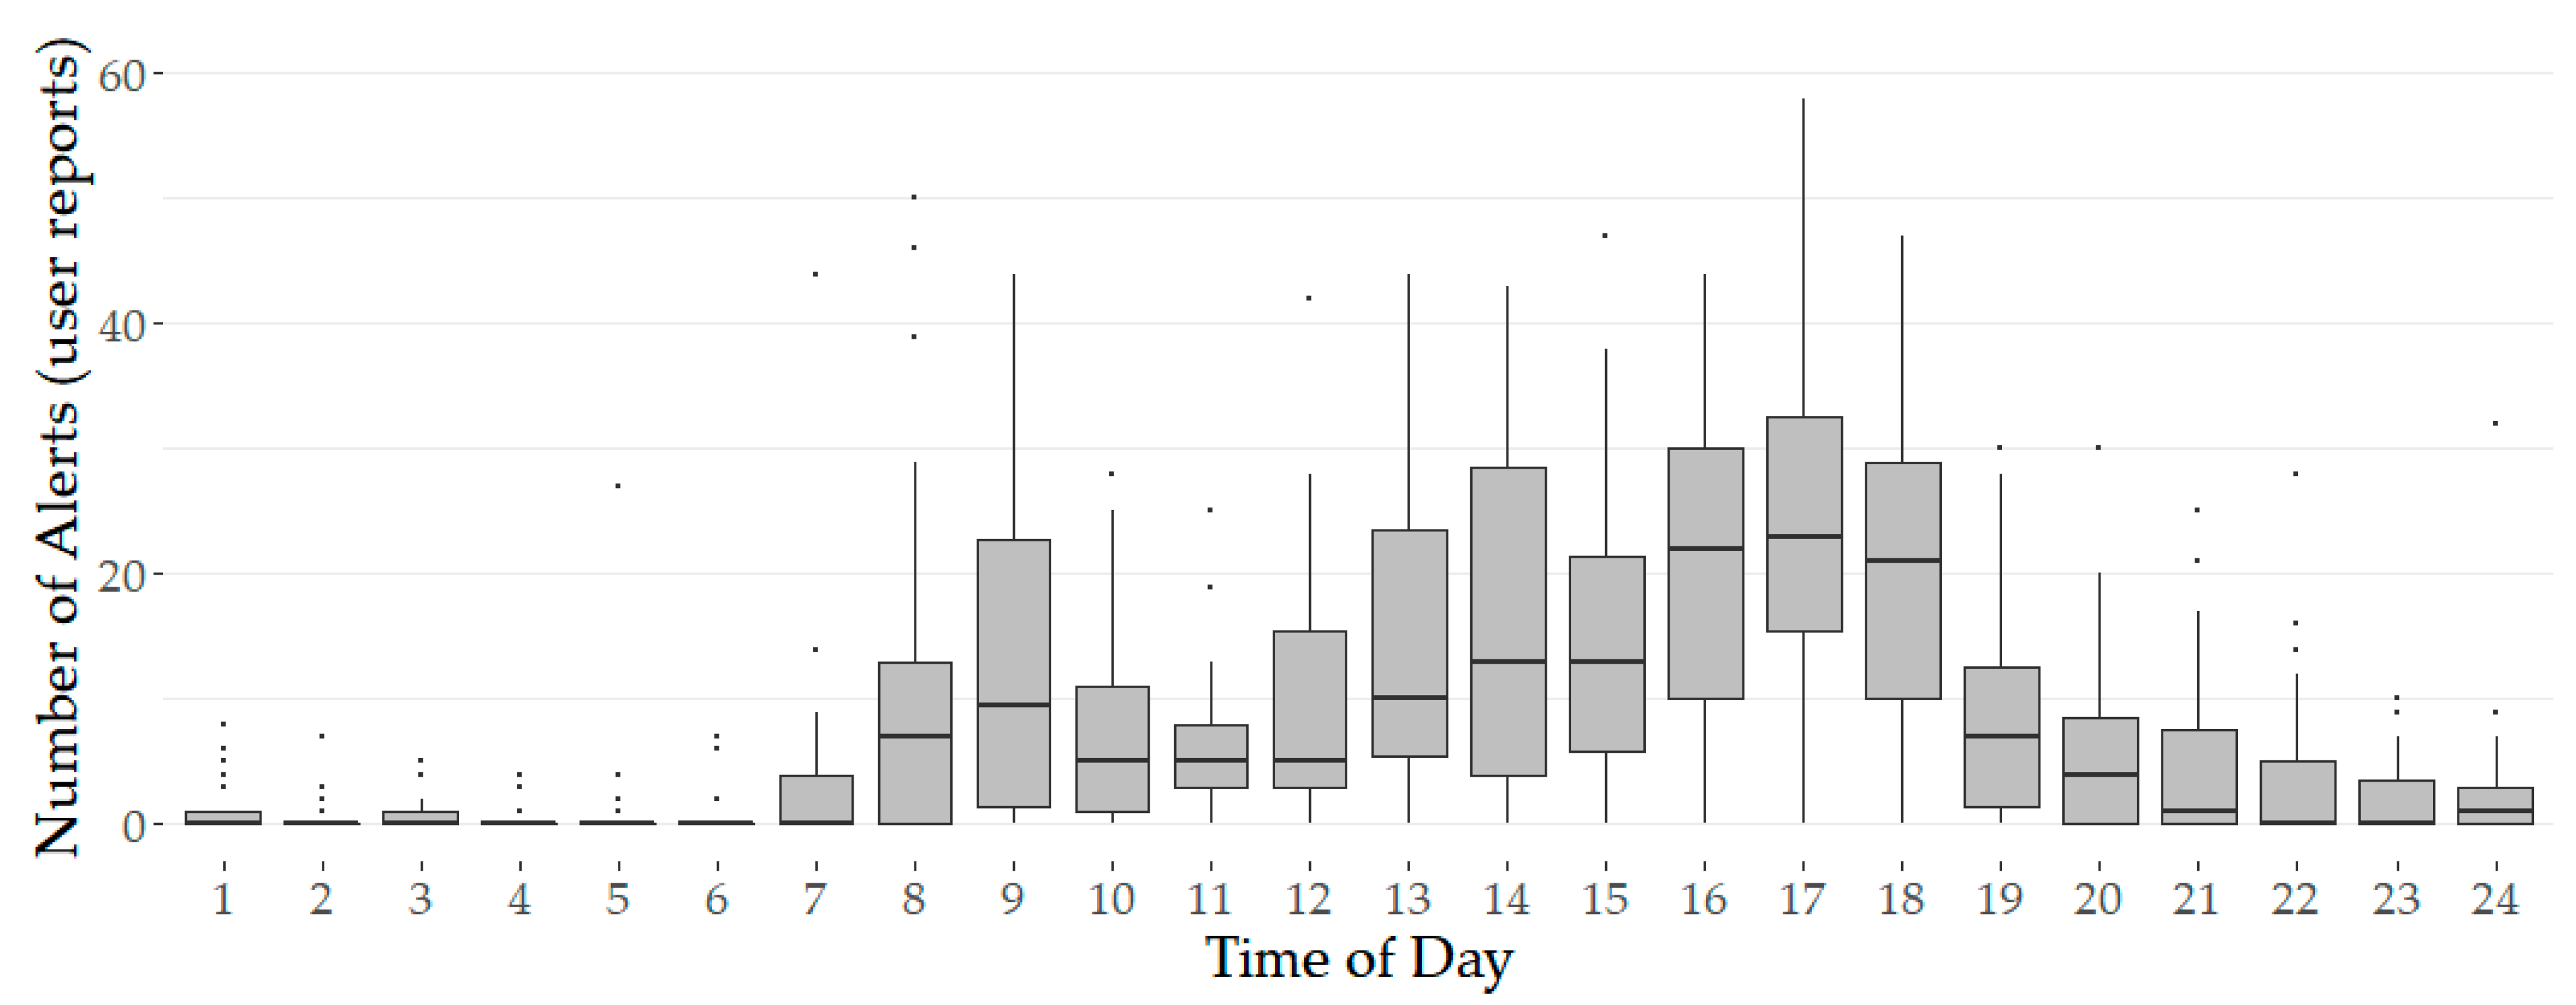
5.1. Descriptive Statistics
5.2. LOS Classification Model Using Machine Learning
5.2.1. Model Training and Hyperparameter Tuning
- RF:
- -
- Number of trees: A higher number of trees typically avoids overfitting;
- -
- Maximum number of features: A smaller number of features basically reduces the chance of overfitting;
- -
- Maximum tree depth: The lower the tree depth, the less likely overfitting is;
- KNN:
- -
- Number of neighbors (K): Increasing the number of neighbors can avoid overfitting;
- SVM:
- -
- C: Demonstrates a trade-off between a high and low accuracy, with a low C value resulting in a smoother decision surface and a lower chance of overfitting.
- -
- Sigma: A large gamma value can cause overfitting.
5.2.2. Model Selection
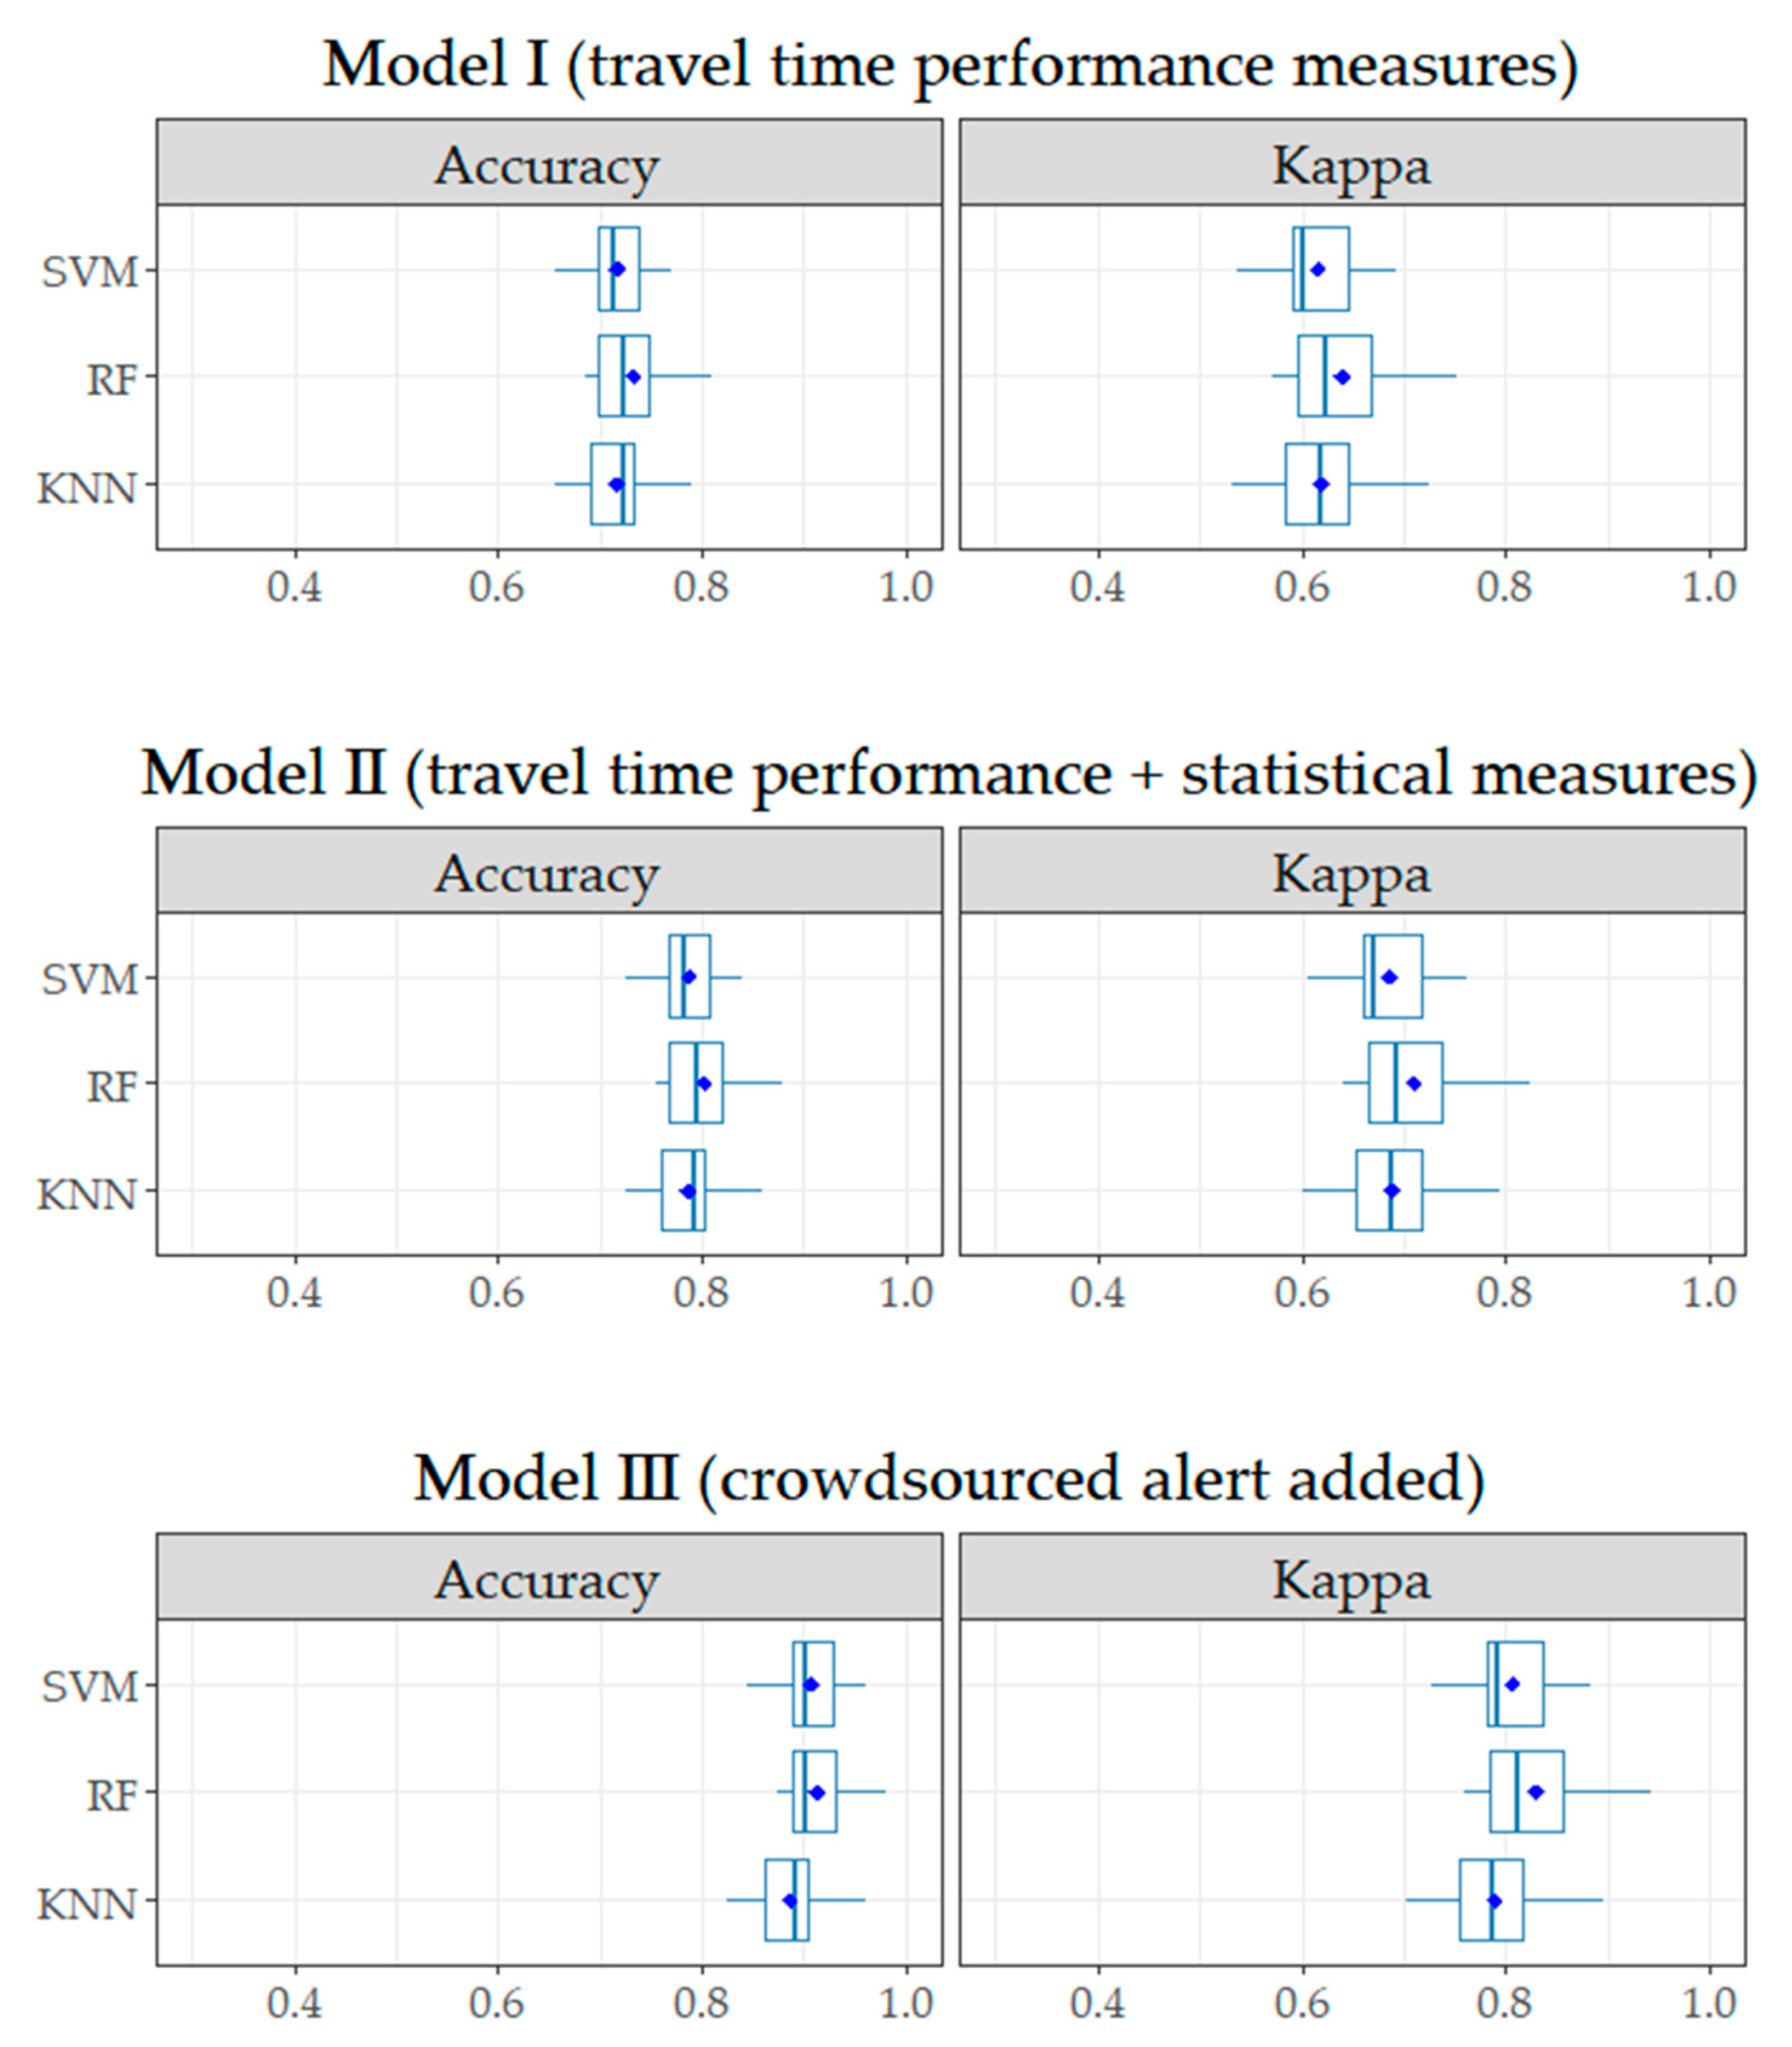
- Model I uses only travel time performance measures as the model inputs and shows how accurately travel time performance measures can determine LOS;
- Model II uses travel time performance measures and basic statistical measures as the inputs;
- Model III incorporates crowdsourced Waze alerts and uses all three types of input. Model III captures the impact of the crowdsourced alerts in terms of improvement of the LOS classification.
5.2.3. Test Result
5.3. Sensitivity Analysis
5.4. Variable Importance
6. Limitations and Future Work
7. Conclusions
Author Contributions
Funding
Institutional Review Board Statement
Informed Consent Statement
Data Availability Statement
Acknowledgments
Conflicts of Interest
References
- Board, T.R. Highway Capacity Manual 6th Edition: A Guide for Multimodal Mobility Analysis; The National Academies Press: Washington, DC, USA, 2016; p. 6. [Google Scholar]
- Khan, S.M.; Dey, K.C.; Chowdhury, M. Real-time traffic state estimation with connected vehicles. Ieee Trans. Intell. Transp. Syst. 2017, 18, 1687–1699. [Google Scholar] [CrossRef]
- Hernandez, S.; Tok, A.; Ritchie, S.G. Density Estimation Using Inductive Loop Signature Based Vehicle Re-Identification and Classification; Institute of Transportation Studies University of California: Irvine, CA, USA, 2013. [Google Scholar]
- Hargrove, S.R.; Lim, H.; Han, L.D.; Freeze, P.B. Empirical evaluation of the accuracy of technologies for measuring average speed in real time. Transp. Res. Rec. 2016, 2594, 73–82. [Google Scholar] [CrossRef]
- Underwood, S.E. A Review and Classification of Sensors for Intelligent Vehicle-Highway Systems; University of Michigan Transportation Research Institute: Ann Arbor, MI, USA, 1990. [Google Scholar]
- Zhang, J.; Wang, F.-Y.; Wang, K.; Lin, W.-H.; Xu, X.; Chen, C. Data-driven intelligent transportation systems: A survey. IEEE Trans. Intell. Transp. Syst. 2011, 12, 1624–1639. [Google Scholar] [CrossRef]
- Herrera, J.C.; Work, D.B.; Herring, R.; Ban, X.J.; Jacobson, Q.; Bayen, A.M. Evaluation of traffic data obtained via GPS-enabled mobile phones: The Mobile Century field experiment. Transp. Res. Part C Emerg. Technol. 2010, 18, 568–583. [Google Scholar] [CrossRef]
- Hoseinzadeh, N.; Arvin, R.; Khattak, A.J.; Han, L.D. Integrating safety and mobility for pathfinding using big data generated by connected vehicles. J. Intell. Transp. Syst. 2020, 24, 404–420. [Google Scholar] [CrossRef]
- Khattak, A.J.; Mahdinia, I.; Mohammadi, S.; Mohammadnazar, A.; Wali, B. Big Data Generated by Connected and Automated Vehicles for Safety Monitoring, Assessment and Improvement, Final Report (Year 3). arXiv 2021, arXiv:06106. [Google Scholar]
- Mohammadnazar, A.; Arvin, R.; Khattak, A.J. Classifying travelers’ driving style using basic safety messages generated by connected vehicles: Application of unsupervised machine learning. Transp. Res. Part C Emerg. Technol. 2021, 122, 102917. [Google Scholar] [CrossRef]
- Mousavi, S.M.; Lord, D.; Dadashova, B.; Mousavi, S.R. Can Autonomous Vehicles Enhance Traffic Safety at Unsignalized Intersections? In Proceedings of the International Conference on Transportation and Development, Seattle, WA, USA, 26–29 May 2020; American Society of Civil Engineers: Reston, VA, USA, 2020; pp. 194–206. [Google Scholar]
- Mousavi, S.M.; Osman, O.A.; Lord, D.; Dixon, K.K.; Dadashova, B. Investigating the safety and operational benefits of mixed traffic environments with different automated vehicle market penetration rates in the proximity of a driveway on an urban arterial. Accid. Anal. Prev. 2021, 152, 105982. [Google Scholar] [CrossRef] [PubMed]
- Azad, M.; Hoseinzadeh, N.; Brakewood, C.; Cherry, C.R.; Han, L.D. Fully autonomous buses: A literature review and future research directions. J. Adv. Transp. 2019, 2019, 4603548. [Google Scholar] [CrossRef]
- Azad, M.; Hoseinzadeh, N.; Brakewood, C.; Cherry, C.R.; Han, L.D. A literature review on fully autonomous buses. In Proceedings of the Transportation Research Board 98th Annual 2019, Washington, DC, USA, 13–17 January 2019. [Google Scholar]
- Mahdinia, I.; Mohammadnazar, A.; Arvin, R.; Khattak, A.J. Integration of automated vehicles in mixed traffic: Evaluating changes in performance of following human-driven vehicles. Accid. Anal. Prev. 2021, 152, 106006. [Google Scholar] [CrossRef]
- Mahdinia, I.; Arvin, R.; Khattak, A.J.; Ghiasi, A. Safety, energy, and emissions impacts of adaptive cruise control and cooperative adaptive cruise control. Transp. Res. Rec. 2020, 2674, 253–267. [Google Scholar] [CrossRef]
- Chatzimilioudis, G.; Konstantinidis, A.; Laoudias, C.; Zeinalipour-Yazti, D. Crowdsourcing with smartphones. IEEE Internet Comput. 2012, 16, 36–44. [Google Scholar] [CrossRef]
- Kanhere, S.S. Participatory sensing: Crowdsourcing data from mobile smartphones in urban spaces. In Proceedings of the 2011 IEEE 12th International Conference on Mobile Data Management, Luleå, Sweden, 6–9 June 2011; Volume 2, pp. 3–6. [Google Scholar]
- Nair, D.J.; Gilles, F.; Chand, S.; Saxena, N.; Dixit, V. Characterizing multicity urban traffic conditions using crowdsourced data. PLoS ONE 2019, 14, e0212845. [Google Scholar]
- Pack, M.; Ivanov, N. Are You Gonna Go My WAZE? Inst. Transp. Eng. ITE J. 2017, 87, 28. [Google Scholar]
- Hoseinzadeh, N.; Liu, Y.; Han, L.D.; Brakewood, C.; Mohammadnazar, A. Quality of location-based crowdsourced speed data on surface streets: A case study of Waze and Bluetooth speed data in Sevierville, TN. Comput. Environ. Urban. Syst. 2020, 83, 101518. [Google Scholar] [CrossRef]
- Senarath, Y.; Nannapaneni, S.; Purohit, H.; Dubey, A. Emergency Incident Detection from Crowdsourced Waze Data using Bayesian Information Fusion. arXiv 2020, arXiv:05440. [Google Scholar]
- Ali, F.; Ali, A.; Imran, M.; Naqvi, R.A.; Siddiqi, M.H.; Kwak, K.-S. Traffic accident detection and condition analysis based on social networking data. Accid. Anal. Prev. 2021, 151, 105973. [Google Scholar] [CrossRef]
- Farajiparvar, P.; Hoseinzadeh, N.; Han, L.D.; Hedayatipour, A. Deep Learning Techniques for Traffic Speed Forecasting with Side Information. In Proceedings of the 2020 IEEE Green Energy and Smart Systems Conference (IGESSC), Long Beach, CA, USA, 2–3 November 2020; pp. 1–5. [Google Scholar]
- Li, X.; Dadashova, B.; Yu, S.; Zhang, Z. Rethinking Highway Safety Analysis by Leveraging Crowdsourced Waze Data. Sustainability 2020, 12, 10127. [Google Scholar] [CrossRef]
- Chen, Y.; Zhou, M.; Zheng, Z.; Huo, M. Toward practical crowdsourcing-based road anomaly detection with scale-invariant feature. IEEE Access 2019, 7, 67666–67678. [Google Scholar] [CrossRef]
- Daraghmi, Y.-A.; Wu, T.-H. Crowdsourcing-Based Road Surface Evaluation and Indexing. IEEE Trans. Intell. Transp. Syst. 2020. [Google Scholar] [CrossRef]
- Martinez, M.; Yang, K.; Constantinescu, A.; Stiefelhagen, R.J.S. Helping the Blind to Get through COVID-19: Social Distancing Assistant Using Real-Time Semantic Segmentation on RGB-D Video. Sensors 2020, 20, 5202. [Google Scholar] [CrossRef] [PubMed]
- Amin-Naseri, M.; Chakraborty, P.; Sharma, A.; Gilbert, S.B.; Hong, M. Evaluating the reliability, coverage, and added value of crowdsourced traffic incident reports from Waze. Transp. Res. Rec. 2018, 2672, 34–43. [Google Scholar] [CrossRef]
- Singh, V.; Gore, N.; Chepuri, A.; Arkatkar, S.; Joshi, G.; Pulugurtha, S. Examining Travel Time Variability and Reliability on an Urban Arterial Road Using Wi-Fi Detections—A Case Study. J. East. Asia Soc. Transp. Stud. 2019, 13, 2390–2411. [Google Scholar]
- Celikoglu, H.B. An approach to dynamic classification of traffic flow patterns. Comput. Aided Civ. Infrastruct. Eng. 2013, 28, 273–288. [Google Scholar] [CrossRef]
- Sekuła, P.; Marković, N.; Laan, Z.V.; Sadabadi, K.F. Estimating historical hourly traffic volumes via machine learning and vehicle probe data: A Maryland case study. Transp. Res. Part C Emerg. Technol. 2018, 97, 147–158. [Google Scholar] [CrossRef]
- Marwah, B.; Singh, B. Level of service classification for urban heterogeneous traffic: A case study of Kanpur metropolis. In Proceedings of the Fourth International Symposium on Highway Capacity, Maui, HI, USA, 27 June–1 July 2000. [Google Scholar]
- Altintasi, O.; Tuydes-Yaman, H.; Tuncay, K. Detection of urban traffic patterns from Floating Car Data (FCD). Transp. Res. Procedia 2017, 22, 382–391. [Google Scholar] [CrossRef]
- Geistefeldt, J.; Giuliani, S.; Vortisch, P.; Leyn, U.; Trapp, R.; Busch, F.; Rascher, A.; Celikkaya, N. Assessment of level of service on freeways by microscopic traffic simulation. Transp. Res. Rec. 2014, 2461, 41–49. [Google Scholar] [CrossRef]
- Wu, N.; Lemke, K. A new model for level of service of freeway merge, diverge, and weaving segments. Procedia-Soc. Behav. Sci. 2011, 16, 151–161. [Google Scholar] [CrossRef]
- Jolovic, D.; Stevanovic, A.; Sajjadi, S.; Martin, P.T. Assessment of Level-Of-Service for Freeway Segments Using HCM and Microsimulation Methods. Transp. Res. Procedia 2016, 15, 403–416. [Google Scholar] [CrossRef][Green Version]
- Celikoglu, H.B.; Silgu, M.A. Extension of traffic flow pattern dynamic classification by a macroscopic model using multivariate clustering. Transp. Sci. 2016, 50, 966–981. [Google Scholar] [CrossRef]
- Aljamal, M.A.; Abdelghaffar, H.M.; Rakha, H.A. Developing a Neural–Kalman Filtering Approach for Estimating Traffic Stream Density Using Probe Vehicle Data. Sensors 2019, 19, 4325. [Google Scholar] [CrossRef] [PubMed]
- Wassantachat, T.; Li, Z.; Chen, J.; Wang, Y.; Tan, E. Traffic density estimation with on-line SVM classifier. In Proceedings of the 2009 Sixth IEEE International Conference on Advanced Video and Signal Based Surveillance, Genoa, Italy, 2–4 September 2009; pp. 13–18. [Google Scholar]
- Khan, S.M. Real-Time Traffic Condition Assessment with Connected Vehicles. Master’s Thesis, Clemson University, Clemson, SC, USA, 2015. [Google Scholar]
- Kurniawan, F.; Sajati, H.; Dinaryanto, O. Image Processing Technique for Traffic Density Estimation. Int. J. Eng. Technol. 2017, 9, 1496–1503. [Google Scholar] [CrossRef][Green Version]
- Lomax, T.; Margiotta, R. Selecting Travel Reliability Measures; Citeseer: University Park, TX, USA, 2003. [Google Scholar]
- Schrank, D.; Eisele, B.; Lomax, T. TTI’s 2012 Urban Mobility Report; Texas A&M Transportation Institute, The Texas A&M University System: College Station, TX, USA, 2012; Volume 4. [Google Scholar]
- Martchouk, M.; Mannering, F.L.; Singh, L. Travel time reliability in Indiana; Publication FHWA/IN/JTRP-2010/08; Joint Transportation Research Program, Indiana Department of Transportation and Purdue University: West Lafayette, IN, USA, 2010. [Google Scholar] [CrossRef]
- Chepuri, A.; Wagh, A.; Arkatkar, S.S.; Joshi, G. Study of travel time variability using two-wheeler probe data–an Indian experience. In Proceedings of the Institution of Civil Engineers-Transport, London, UK, 4 August 2018; Thomas Telford Ltd.: London, UK, 2018; Volume 171, pp. 190–206. [Google Scholar] [CrossRef]
- Kittelson, W.; Vandehey, M. Incorporation of Travel Time Reliability into the HCM; Transportation Research Board: Washington, DC, USA, 2013. [Google Scholar]
- Chen, C.; Skabardonis, A.; Varaiya, P. Travel-time reliability as a measure of service. Transp. Res. Rec. 2003, 1855, 74–79. [Google Scholar] [CrossRef]
- Pulugurtha, S.S.; Imran, M.S. Modeling basic freeway section level-of-service based on travel time and reliability. Case Stud. Transp. Policy 2020, 8, 127–134. [Google Scholar] [CrossRef]
- Kodupuganti, S.R.; Pulugurtha, S.S. Link-level travel time measures-based level of service thresholds by the posted speed limit. Transport. Res. Interdiscipl. Perspect. 2019, 3, 100068. [Google Scholar] [CrossRef]
- Misra, A.; Gooze, A.; Watkins, K.; Asad, M.; Le Dantec, C.A. Crowdsourcing and its application to transportation data collection and management. Transp. Res. Rec. 2014, 2414, 1–8. [Google Scholar] [CrossRef]
- Santos, S.R.d.; Davis, C.A., Jr.; Smarzaro, R. Integration of data sources on traffic accidents. In Proceedings of the GeoInfo, Campos do Jordão, Brazil, 27–30 November 2016; pp. 192–203. [Google Scholar]
- Bahaweres, R.B.; Akbar, M.R. Analysis of travel time computation accuracy from Crowdsource data of hospitality application in South of Tangerang City with estimated travel time method. In Proceedings of the 2017 5th International Conference on Cyber and IT Service Management (CITSM), Bali, Indonesia, 8–10 August 2017; pp. 1–5. [Google Scholar]
- Turner, S.; Martin, M.; Griffin, G.; Le, M.; Das, S.; Wang, R.; Dadashova, B.; Li, X. Exploring Crowdsourced Monitoring Data for Safety; Bureau of Transportation Statistics U.S. Department of Transportation: Washington, DC, USA, 2020.
- Perez, G.V.A.; Lopez, J.C.; Cabello, A.L.R.; Grajales, E.B.; Espinosa, A.P.; Fabian, J.L.Q. Road Traffic Accidents Analysis in Mexico City through Crowdsourcing Data and Data Mining Techniques. Int. J. Comput. Inf. Eng. 2018, 12, 604–608. [Google Scholar]
- Sanchez, R.; Martinez, D.; Mitnik, O.A.; Yanez-Pagans, P.; Lanzalot, M.L.; Stucchi, R.; Sanguino, L. Dynamic Traffic Lights and Urban Mobility: An Application of Waze Data to the City of Medellın; The Research Institute for Development, Growth and Economics (RIDGE): Montevideo, Uruguay, 2019. [Google Scholar]
- Naming the Coronavirus Disease (COVID-19) and the Virus that Causes it. 2020. Available online: https://www.who.int/emergencies/diseases/novel-coronavirus-2019/technical-guidance/naming-the-coronavirus-disease-(covid-2019)-and-the-virus-that-causes-it/ (accessed on 8 February 2021).
- Al-Sobky, A.-S.A.; Mousab, R.M. Traffic density determination and its applications using smartphone. Alex. Eng. J. 2016, 55, 513–523. [Google Scholar] [CrossRef]
- Ensley, J.O. Application of Highway Capacity Manual 2010 Level-of-Service Methodologies for Planning Deficiency Analysis. Master’s Thesis, University of Tennessee, Knoxville, TN, USA, 2012. [Google Scholar]

| No. | Reference | Year | Data | Index Used | Method |
|---|---|---|---|---|---|
| 1 | Kittelson et al. [47] | 2008 | Sensor data (speed, density, travel time) |
|
|
| 2 | Altinatasi et al. [34]. | 2016 | Floating Car Data (speed) |
|
|
| 3 | Khan, Dey, and Chowdhury [2] | 2017 | Simulation (speed, density) |
|
|
| 4 | Singh et al. [30] | 2019 | Wi-Fi probe vehicle (speed, travel time) |
|
|
| 5 | Kodupuganti, and Pulugurtha [50] | 2019 | Travel time data provided by North Carolina DOT |
|
|
| 6 | Pulugurtha and Imran [49] | 2020 | Simulation (travel time) |
|
|
| No. | Reference | Year | Country | Waze Data Used | Findings and Application |
|---|---|---|---|---|---|
| 1 | Santos et al. [52] | 2016 | Brazil | Waze accident alerts |
|
| 2 | Bahaweres et al. [53] | 2017 | Indonesia | Waze travel time |
|
| 3 | Pack and Ivanov [20] | 2017 | United States | Waze alerts |
|
| 4 | Amin-Naseri et al. [29] | 2018 | United States | Waze congestion and accident alerts |
|
| 5 | Perez et al. [55] | 2018 | Mexico | Waze alerts |
|
| 6 | Raul Sanchez et al. [56] | 2019 | Colombia | Waze jam and accident alerts |
|
| 7 | Turner et al. [54] | 2020 | United States | Waze alerts |
|
| 8 | Hoseinzadeh et al. [21] | 2020 | United States | Waze speed |
|
| 9 | Li et al. [25] | 2020 | United States | Waze alerts |
|
| 10 | Senarath et al. [22] | 2020 | United States | Waze alerts |
|
| Model Input | Measure | Equation | Eq. No. |
|---|---|---|---|
| Basic statistical measures of speed | Average Speed | ||
| Standard Deviation (SD) | |||
| Range | |||
| Coefficient of Variation (CoV) | |||
| Standard Error (SE) | |||
| Percentiles (25th, 50th, 75th, 90th) | Here, rank is ordering the dataset from smallest to largest and finds the value with the index | ||
| Interquartile Range (IQR) | |||
| Travel time performance | Travel Time Index (TTI) | (8) | |
| Buffer Time Index (BTI) | (9) | ||
| Planning Time Index (PTI) | (10) | ||
| Crowdsourced data | Hourly Number of Alerts | ) | (11) |
| LOS | Density (Vehicle/Mile/Lane) | Description |
|---|---|---|
| A | ≤11 | Free flow |
| B | >11–18 | Reasonably free flow |
| C | >18–26 | Stable flow (acceptable delays) |
| D | >26–35 | Speeds decline slightly with increasing flows |
| E | >35–45 | Operation near or at capacity |
| F | >45 | Forced or breakdown flow |
| Model Input | Measure | Mean | Min. | Max. | Median | S.D. |
|---|---|---|---|---|---|---|
| Basic statistical measures on speed | Average speed (km/h) | 100.6 | 31.1 | 119.4 | 110.7 | 21.7 |
| Speed standard deviation (km/h) | 6.6 | 0.0 | 39.4 | 4.0 | 6.3 | |
| Minimum speed (km/h) | 88.4 | 18.0 | 118.4 | 105.4 | 25.7 | |
| Maximum speed (km/h) | 111.0 | 39.4 | 146.0 | 118.4 | 20.1 | |
| Range of speed (km/h) | 22.7 | 0.0 | 91.1 | 14.5 | 18.2 | |
| CoV of speed | 0.0 | 0.0 | 0.5 | 0.0 | 0.1 | |
| SE of speed | 0.5 | 0.0 | 3.1 | 0.3 | 0.5 | |
| 25th percentile (km/h) | 96.9 | 25.9 | 114.4 | 109.8 | 24.5 | |
| 50th percentile (km/h) | 100.9 | 29.1 | 118.4 | 110.7 | 22.9 | |
| 75th percentile (km/h) | 105.1 | 36.5 | 121.0 | 111.5 | 21.1 | |
| 90th percentile (km/h) | 107.7 | 39.4 | 126.5 | 118.4 | 20.3 | |
| Travel time performance | IQR | 5.1 | 0.0 | 51.9 | 3.8 | 7.7 |
| TTI | 1.2 | 1.0 | 3.9 | 1.0 | 0.5 | |
| BTI | 0.2 | −0.4 | 3.4 | 0.0 | 0.4 | |
| PTI | 1.4 | 1.0 | 5.8 | 1.1 | 0.7 | |
| Crowdsourced data | Number of Waze alerts | 9.0 | 0.0 | 101.0 | 4.0 | 20.0 |
| Classifier | 3-Fold Cross Validation | 5-Fold Cross Validation | 10-Fold Cross Validation | |||
|---|---|---|---|---|---|---|
| Accuracy | Kappa | Accuracy | Kappa | Accuracy | Kappa | |
| SVM | 0.91 | 0.81 | 0.91 | 0.81 | 0.90 | 0.79 |
| RF | 0.91 | 0.82 | 0.93 | 0.83 | 0.92 | 0.83 |
| KNN | 0.88 | 0.77 | 0.89 | 0.79 | 0.88 | 0.76 |
| Date | Random Forest Test Result | |
|---|---|---|
| Accuracy | Kappa | |
| 03/15/2020 to 04/15/2020 | 0.95 | 0.86 |
| 08/01/2020 to 08/31/2020 | 0.92 | 0.83 |
Publisher’s Note: MDPI stays neutral with regard to jurisdictional claims in published maps and institutional affiliations. |
© 2021 by the authors. Licensee MDPI, Basel, Switzerland. This article is an open access article distributed under the terms and conditions of the Creative Commons Attribution (CC BY) license (http://creativecommons.org/licenses/by/4.0/).
Share and Cite
Hoseinzadeh, N.; Gu, Y.; Han, L.D.; Brakewood, C.; Freeze, P.B. Estimating Freeway Level-of-Service Using Crowdsourced Data. Informatics 2021, 8, 17. https://doi.org/10.3390/informatics8010017
Hoseinzadeh N, Gu Y, Han LD, Brakewood C, Freeze PB. Estimating Freeway Level-of-Service Using Crowdsourced Data. Informatics. 2021; 8(1):17. https://doi.org/10.3390/informatics8010017
Chicago/Turabian StyleHoseinzadeh, Nima, Yangsong Gu, Lee D. Han, Candace Brakewood, and Phillip B. Freeze. 2021. "Estimating Freeway Level-of-Service Using Crowdsourced Data" Informatics 8, no. 1: 17. https://doi.org/10.3390/informatics8010017
APA StyleHoseinzadeh, N., Gu, Y., Han, L. D., Brakewood, C., & Freeze, P. B. (2021). Estimating Freeway Level-of-Service Using Crowdsourced Data. Informatics, 8(1), 17. https://doi.org/10.3390/informatics8010017


