Abstract
The use of data visualization is increasing; however, there is little empirical explanation for how it supports users. Our goal in this paper is to deepen our understanding of the role of interactive visualizations in a particular context of decision making. Specifically, we attempt to understand the role of the working memory system, which is a concept to understand the mechanism of the processing and temporary storage of information in variety of cognitive tasks. We compared two interfaces, SimulSort and its non-visual counterpart Typical Sorting, with a multi-attribute decision-making problem. Because decision outcomes are known to be affected by the limitations of a person’s working memory, we conducted a crowdsourcing-based user study using SimulSort to understand how working memory, especially the phonological loop, can benefit from the using visualizations. We examined the impact on working memory with a well known dual-task methodology by designing a concurrent task to tap into the main decision-making task. The experiment was conducted with a total of 137 participants and an ordered logistic regression using a proportional odds model was applied to analyze the decision quality. The results supported the hypothesis that when using SimulSort, participants required less working memory than they required with Typical Sorting to accomplish the multi-attribute decision-making task even though SimulSort outperformed Typical Sorting in terms of decision quality. We also provide methodologies to conduct working memory studies by implementing an articulatory suppression task on crowdsourcing platforms in which experimenters have less control over the participants.
1. Introduction
Data visualization is widely used for understanding public data through dashboards [1,2,3], utilized in mobile services to understand personal data [4,5], and is gaining interest even for K-12 education [6,7]. Even though the importance is growing we have less understanding on how it is helping the users understand data. One of the commonly accepted definitions of data visualization (henceforth, visualization) is “the use of computer-supported, interactive, visual representations of abstract data to amplify cognition” [8]. An interesting phrase is that visualizations “amplify cognition”. Numerous studies [9] have demonstrated that visualizations help people find novel insights and serendipitous findings. These findings could be results of amplified cognition, but it is difficult to explain how visualizations amplify cognition. In general, the cognition amplification claim emphasizes that the final product of accomplishing a task or gaining insight is something the user could not have done without the visualization. Previous work has been focused mainly on visual perception to understand what makes visualizations effective e.g., [10,11,12,13,14,15], but they are not sufficient to explain higher level cognition. As noted by [16] (2004), it is difficult to conduct controlled studies with visualizations, which makes it challenging to have detailed observation of cognitive processes.
Recently, research has been conducted to understand the underlying impact of visualizations on the human cognitive process [17,18,19]. However, the majority of these researches still remain on recognition and recall tasks on static visualizations. Padilla et al. introduce methods to evaluate working memory with visualization tasks using geospatial maps in a controlled-lab environment [20]. The authors utilized pupillometry and dual-task experimental designs and show how visuo-spatial sketchpad memory plays a role with static geospatial visualizations. However, several visualizations have visual encodings that represent non-spatial data. For example, bar charts and line charts show numeric values and people execute common tasks while utilizing these graphs such as reading, comparing, or memorizing numeric values. Working memory consists of various components that can hold a limited amount of transformable information for a finite period of time [21]. A well-known model suggests that the working memory consists of two temporary memory systems, a phonological loop and a visuo-spatial sketchpad [22]. The phonological loop is involved in verbal information and the visuo-spatial sketchpad serves as a temporal storage for visual and spatial information. The tasks mentioned earlier above may involve the phonological loop as it is well known to be used for math calculations [23].
Therefore, in this study we would like to deepen our understanding of the effect of visualizations on human cognition by looking into working memory, especially about the phonological loop, with interactive visualizations. Thus, the goal of this study is to obtain robust, empirical evidence showing how visualization amplifies cognition. To overcome the aforementioned challenges, we have made two choices in the design of the experiment.
First, we chose “multi-attribute decision making” as the experimental task, which we experience in everyday life such as selecting a car or renting a house. It can be expressed in a matrix format, where rows represent alternatives, and columns represent the attributes considered (e.g., horsepower, MPG for cars and rent price, distance to workplace for houses). Unlike other tasks often supported by visualizations, the performance of multi-attribute decision making can be objectively and quantitatively measured, so that we can see the effect of factors more clearly. In addition, this task is commonly used in choice-making experiments to understand consumers and is known to be a mentally demanding task [24]. It still presents sufficient cognitive challenges in that a participant must perform complex mental processing to accomplish the task, which is far more complicated than a perception-level task (e.g., picking a red circle out of blue circles).
Second, out of many visualization tools used to support multi-attribute decision making refer to [25], we chose SimulSort [26]. SimulSort has been empirically tested by a series of studies [27,28,29], so there are proven experimental settings and comparable empirical data. Its interface is also simple enough to investigate the role of visualizations without concerns about confounding factors. In addition, a previous study using SimulSort [28] showed that participants could evaluate more information without employing greater effort. To find a better explanation of these phenomena, we examined the role of working memory to explain how cognition was amplified with visualizations–eventually visualizations unburden working memory to accomplish more complicated tasks.
We made these choices to improve internal validity while sacrificing external validity, but we believe that this study can provide far more robust evidence showing how visualizations amplify cognition.
The contributions of this paper are as follows:
- We provided quantitative empirical evidence showing that the interactive visualization, SimulSort, amplifies cognition, more specifically unburdening working memory on the phonological loop; and
- We suggest an experimental method to vary the burden on working memory with a phonological suppression task in a crowdsourcing-based study in which controlling participants’ behaviors is challenging.
2. Background
2.1. Multi-Attribute Decision Making
Multi-attribute decision making occurs when the decision maker has to select one option from a set of alternatives, each of which has a set of attributes [30]. This is a common situation in which one can easily organize the data in tabular form [31]. The decision-making process is cognitively demanding as the goal is to select the best option considering all of the given information. For example, when people purchase a car, they may consider several aspects such as price, fuel economy, horsepower, and consumer ratings. Specifically, the consumer may want a car with a lower price, lower fuel economy, higher horsepower, and higher consumer ratings. They need to compare all the attributes and furthermore, one can collect more information about the car to consider. However, giving decision-makers more information to consider does not mean that they will make better decisions. This phenomenon is due to that even with more information, people have a hard time processing all the given data. The decision making process becomes more difficult when there are several alternatives to compare. Simon introduced the concept of bounded rationality that has implications for human information processing systems in which the overall cognitive capacity is limited, including working memory [32]. In other words, decision makers keep information-processing demands within the bounds of their limited cognitive capacity and might not be able to make a rational choice if they process requires a high level of computational effort. Even when it entails sacrificing decision accuracy, many people select effort reduction [33,34]. This suggests that external aids could help decision makers achieve higher decision quality by reducing the cognitive load so as to not exceed the decision maker’s effort limitations. Bettman also suggested design implications based on processing capabilities of the decision maker [35]. One approach is to examine whether visualization can lower the memory demands. The external system can partially decouple the memory system from the processing system, so that eventually, the information can be easily processed without relying on memory.
2.2. Visualization Techniques
There have been several visualization tools to project multi-dimensional data to be perceived more easily, especially presuming the tabular forms. For example, TableLens supports large data sets and expands the boundaries of a table that can be shown on a screen, allowing users to magnify certain areas for detailed examination [36]. LineUp supports multi-attribute ranking tasks and interactive refinement of weights, helping the user to follow the shuffling in rank that happens through transition animation and highlighting. It also supports stacked bar charts, which reflect the cell value and also help in visualizing the sum of multiple items [37]. Mostly these tools support large data sets and are intended to use for exploration, filtering, or weight adjustments to attributes. One standard function to interact with columns is to sort a column in a descending or ascending order. One problem with this one-column sorting is that as the sorting is done for a single column, data sequences for other columns are changed accordingly. For example, with the car data set explained in the previous section, if one is interested in lower price and sorts by this attribute in ascending order, the car with the lowest price will be shown on the top. Next, when the user wants to see the consumer ratings in a descending order, the previous sorted results disappear and the car with highest rating will show on top. To keep track of the continuous shuffling, the user needs a substitute method to record the results.
To overcome this problem, SimulSort (see Figure 1a) presents all columns sorted simultaneously so that one can see the relative values or utilities (i.e., pros and cons) of an alternative over multiple attributes [26]. SimulSort can be explained as a tabular look of parallel-coordinate plots (PCPs). PCP is an example of a classic approach to projecting hyper-dimensional data onto a 2-D display. The attributes are represented as axes parallel to each other, and a data point with multiple attributes is visualized as a poly line connecting each data dot on each axis [38]. As one option is represented in a line, data points in PCP are initially hidden and require additional interactions in order to retrieve the data. Therefore, SimulSort adopts the idea that all columns can be sorted simultaneously, but still maintain the cells for the data to be shown. In order to find a corresponding attribute of each item, the user has to follow the highlighted cells which change color by hovering the mouse over (yellow color) or selecting an item (green color). This visual representation is expected to avoid the constant shuffling of rows when sorting each column separately in common spreadsheet applications. SimulSort offers insights to users by presenting the trend of the data at a glance; because it preserves the tabular form that reveals the values, however, there is a limit to the number of alternatives and attributes that can be represented on the screen without additional interaction techniques (e.g., zooming).
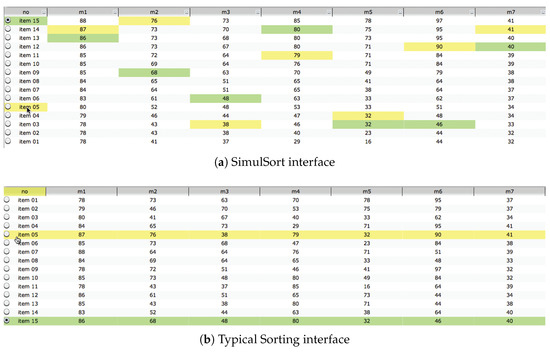
Figure 1.
Example of the two interfaces, SimulSort and Typical Sorting, comparing two alternatives; item 15 is highlighted in green, and item 5 is highlighted in yellow. (a) SimulSort: The comparison of the two items can be done by comparing the vertical positions of the highlighted cells. (b) Typical Sorting: The comparison of the two items can be done by reading the face values of all of the cells.
The value of using SimulSort interface for evaluation studies is that it has a nonvisual interface counterpart, Typical Sorting (see Figure 1b), which differs only in terms of the sorting technique. Previous studies comparing these two interfaces showed that SimulSort enhanced the decision quality and shortened the time spent with higher decision outcomes compared to a Typical Sorting interface [27]. The participants could also apply more cognitively-demanding decision strategies while making a decision [28]. Therefore, to deepen the understanding of why visual aids are effective, we chose to extend the studies by borrowing the methodological approaches from previous experiments. The details of the task are explained in Section 4.2 as the experiment in the paper adopts the same data sets and tasks.
2.3. Visual Representation in Decision Making
Lurie introduced a framework to understand how visual representations can affect decision-making processes that involve large amounts of data [25]. Based on extensive literature reviews, the authors introduced several testable propositions. Visualizations could offer a way to shift the cognitive load to the human perceptual system [39], which will eventually expand an individual’s capability to solve problems [40]. For example, pre-attentive features can be processed readily with little effort [41]. Due to visual representations, the ease of assessment and comparability of the given information could be changed [42]. If it becomes to be easier to evaluate the options, it is likely to lead the decision maker to more information through acquisition, weighting, and comparing [43]. In particular, visual representations lead to intuitive judgments by supporting simultaneous processing. They enhance the decision maker’s ability to evaluate large amounts of information [44]. However, these propositions about the effectiveness of visualizations should be tested empirically.
2.4. Working Memory
Working memory is the cognitive system responsible for temporarily storing and manipulating information during a cognitive activity. The model of working memory was proposed by Baddeley [22] and has been widely used to explain the process used to accomplish cognitive tasks. According to the multiple-component working-memory model [22], the working memory consists of three components: a limited capacity of two temporary memory systems, a phonological loop and a visuo-spatial sketchpad, and a central executive controller. The phonological loop is involved in the temporary storage of verbal information and it was initially named the articulatory loop because a vocal or subvocal rehearsal was assumed to be necessary to maintain information. The visuo-spatial sketchpad serves as a temporal storage for visual and spatial information. The principle role of the central executive system is to coordinate the actions between the phonological loop and the visuo-spatial sketchpad.
As the main decision-making task requires the decision maker to evaluate different alternatives that consist of numbers, the components involving arithmetic are our main interest. The phonological loop is known to be important for retaining information in verbal form during mental addition [23,45]. Widaman et al. [46] showed that subvocal articulation in counting and arithmetic is important. Along with the phonological loop, the central executive is involved in a simple arithmetic problem [23]. The visuo-spatial sketchpad also has been investigated to see how it is used during math calculations. However, in this case the experiments verified whether numbers were present on a screen and whether a vertical or horizontal arrangement of numbers had an impact on accuracy. As the form of the numbers was not to be changed in the experimental interface, we did not take visuo-spatial sketchpad into further consideration.
Dual-task methodology is often used to measure whether a working memory component is used in a given cognitive task [45]. The experiment is designed to have a primary cognitive task of interest and includes a secondary task that taps into the component of the working memory. If the secondary task disrupts the performance of the primary cognitive task compared to the control condition with only the primary task then one can infer that the component used for the secondary task is involved in the performance of the primary cognitive task. For example, if the performance of a primary task decreases when phonological suppression is added (e.g., by counting a number out loud) but not while a spatial task is performed (e.g., moving the non-preferred hand in a pattern), it can be inferred that the primary task involves the phonological loop but not the visuo-spatial sketchpad component. Different secondary tasks have been implemented, by adding memory span tasks to remember a series of numbers, operation span tasks to read or listen to a series of statements, or visuo-spatial memory span tasks to remember a array of items.
2.5. Visualization and Human Cognition
A large number of researches wanted understand the role of interactive visualizations in human cognitive activities [17,18,19,47]. Ref. [19] (2010) attempts to understand the dynamics between mental models and visualizations that are considered to be external representations. With a top-down approach, the authors explain that humans enhance reasoning using visualizations by an interactive process with the medium: internalization, processing, augmentations and creation. Ref. [18] (2015) conducted a more lower-level experiment on how pictographic representations had impact on memory, speed of finding information, and engagement and preference in seeking out these visualizations. Pictographs were found to help people remember information and entice people to inspect visuailzation more closely. Recently, ref. [20] (2019) initiated to provide practical cross-domain methodological guidance for objectively evaluating working memory demands in data visualizations. The authors conducted a study with geospatial visualizations to compare of the average elevations of two regions that was to be a visual-spatial aggregation task related to the visuo-spatial sketchpad. The results show that the use of dual-task experimental designs and pupil dilation can reveal working memory demands associated with task difficulty and dual-tasking. However, the study does not reveal how to conduct a dual-task working memory experiment for testing the phonological loop and is limited to a controlled-lab setting.
3. Hypotheses
One of the main visual features of SimulSort (henceforth, SS) and Typical Sorting (henceforth, TS) is the visual bar (see Figure 1), which consists of the three main components: number, color and vertical location. First, a number is a value of an alternative’s attribute. Second, visual bars can be one of two colors (i.e., green or yellow) that appear when a decision maker is hovering over or selecting a cell in both SS and TS. The same color of visual bars indicates the same alternative among the given options so the decision maker can interpret the same-colored cell as representing attribute values for any single alternative. Third, vertical location exhibits different features in SS and TS. Because the vertical location of a visual bar in SS is determined based on a numerical value in the cell, the vertical locations of cells for the same alternative are inconsistent. However, the vertical location of every cell for an alternative in TS is the same.
The numerical component of the visual bars is essential for comparing the values of an attribute in two alternatives. This is a common component of the visual bars used identically in both SS and TS. In addition, the vertical locations of the visual bars may have a complementary role in comparing values in SS. Because the vertical location of a cell represents its relative value compared to other attributes in a column in SS, a decision maker could use this characteristic to compare values between two alternatives. For example, with SS, a decision maker can compare the value in two alternatives for every attribute and decide which one is higher than the other without reading the exact values simply by comparing the relative vertical height in each attribute. However, in a TS environment the decision maker might have to read the numbers and compare the face values to determine which one is higher than the other. Thus, SS may allow the decision maker to perform fewer mental subtraction calculations when making a decision.
We believe that some part of the analytical task might be converted into a perceptual task by using the vertical locations of the visual bars in SS for processing information. Graphical elements in visualizations lead to releasing working memory resources by shifting some cognitive tasks to perceptual tasks [48,49]. Therefore, the cognitive operations performed using SS might occupy less working memory capacity than with TS. To support this hypothesis, working memory was considered to be a system that is used by a decision maker to process information when making a decision [50]. In particular, we focused on the phonological loop because simple arithmetic, which is a key cognitive operation involved in multi-attribute decision-making tasks [51], is known to involve the phonological loop [52]. In this study we adopted the methodology to add a articulatory task as a secondary task to suppress the phonological loop. This would tap on the working memory while performing the the primary multi-attribute decision-making task. Because the cognitive operation of comparing values with SS might rely more on the vertical locations of the visual bars, and because it might occupy fewer working memory resources than with TS, the decision quality may not be significantly affected by the addition of the secondary task. In contrast, the cognitive operations with TS might rely more on the number component of the visual bars and on mental calculations that might use more working memory capacity. Thus in this case the decision quality may be influenced by the addition of the secondary task in this case. Therefore, the hypotheses for this study are as follows:
Hypothesis 1 (H1).
In data processing using SS, the decision quality would not be different with the added phonological suppression task.
Hypothesis 2 (H2).
In data processing using TS, the decision quality would decrease with the addition of a phonological suppression task.
4. Experiment
We compared the two interfaces SS and TS (see Figure 1a,b accordingly) by borrowing the experimental methods from previous studies [27]. In order to examine the impact on working memory, the dual-task methodology was employed by designing a concurrent task to tap into the main decision-making task.
4.1. Data Sets
We used the same data sets from the previous study [27]. Each data set was randomly generated which had 15 alternatives (i.e., rows) and seven attributes (i.e., columns) consisted with a two-digit numerical value from 10 to 99. To maintain similar difficulty level for each data set, the Average of Inter-Attribute Correlations (AIAC) value was controlled [24]. The AIAC calculated by computing the average of the correlations among all of the combinations of the two columns out of all of the columns. The task to select the best alternative becomes more difficult when the AIAC value is lower, as the decision maker needs to consider the trade-off due to negative correlation between attributes. When the AIAC is higher (maximum = 1), there is fewer trade-offs to consider, therefore selecting the best alternative becomes easier [53]. In real situations, negative correlation exist such as price and certain aspects for a product. Therefore, in our study, the AIAC value was controlled to be low around 0.01 to generate the appropriate level of difficulty [27]. If a decision maker does not consider all of the columns, it is likely that the decision quality of the choice will decrease.
The data was also context-free as we did not want to introduce participants’ preferences during the decision-making process. For example, if we used a car dataset, participants could favor certain attributes to be more important, which results in having no objectively best option. This kind of context-free experimental task has been widely used in other decision science and economic studies [54].
4.2. Design of Primary and Secondary Tasks
4.2.1. Primary Task
The decision-making task was to selection the best option out of 15 options, with the highest utility by considering seven attributes. The calculation for utility was borrowed from economics and decision science, which is the sum of its normalized attribute values. The evaluation of whether a number was high or low was relative for each attribute. For a car dataset, face value 8 for cylinder size could be a large value even though it was a smaller number than 45, which may be a small number for the fuel economy attribute. To mimic such a reality in calculation, the attribute-wise utility of a face value of a cell was normalized within that attribute. Eventually, the utility of an option was calculated by summing all seven normalized attributed values, as shown in Equation (1):
where is the ith alternative’s utility, is the jth attribute-wise utility of the ith alternative, and is the face value in the jth attribute of the ith alternative in data set T. Due to the normalization, the range of the attribute-wise utility was . As the dataset was generated randomly, the range of utility for the options was within in the range of . Intuitively, the participants had to select an option that had high attribute-wise values as much as possible.
4.2.2. Secondary Task
The secondary task was chosen for articulatory suppression to investigate the role of the phonological loop in decision-making tasks. The task was to recite the alphabet following a beep. A common procedure for the secondary task included asking participants to continuously rehearse a word such as “the” when they heard a beep sound, while performing the primary task [45]. However, as the experiment was conducted over Amazon Mechanical Turk, we had to make sure that participants were performing the secondary task properly. Therefore, we selected the secondary task to be rehearsing the alphabet. The participants started from the letter “a” and recited the alphabet in order on each beep. If they reached the letter “z,” the participants had to start from “a” again. At the end of the trials, participants were asked to enter the letter on the last beep in a pop-up window. To make the answer for the last letter different for each trial, the interval of the beep was selected randomly to be between 700 ms to 1200 ms. The bonus payment scheme was designed to encourage participants to perform the secondary task more actively (see Rewards section).
4.3. Experimental Design
The experiment followed the Split-Plot design, which involves two experiment factors, interface (i.e., SS vs. TS) and the existence of the secondary task, which was the phonological memory load suppression task (i.e., only primary task and primary task with secondary phonological memory task). The main effects of interface and the existence of the secondary task were considered fixed, whereas the effects of participants and the interaction between the participants and interface was considered random. Each three positions were measured eight times.
Given the split-plot design, the model for the experiment was as follows:
where represents the random subject effect; represents the whole-plot factor, interface (j = SS, TS), represents the split-plot factor, the existence of the secondary task (k = 0, 1); l () represents the replicates.
4.4. Participants
A total of 139 crowdsourced workers were recruited on Amazon Mechanical Turk and one participant was removed as they were detected to be a random clicker [55] and one participant was removed due to a technical issue with the audio. Eventually, 137 legitimate participants (60 female) remained with 68 participants for SS and 69 participants for TS. The ages ranged from 19 to 65 years old (, ). The countries in which they lived were as follows: USA, 90.7%; India, 9.3%. The education levels of participants were as follows: high school graduate or below, 10%; enrolled as college student, 30%; associate degree, 6.4%; Bachelor’s degree, 43.6%; Master’s degree, 5.8%; and professional degree, 4.2%. The major of the participants who reported were as follows: Science and Math, 10.7%; Business, 9.3%; Engineering, 8.6%; and Liberal Arts, 7.9%.
4.5. Procedure
The participants read the instructions of the experiment on Amazon Mechanical Turk and if the participant accepted our HIT, they were redirected to an experimental website. After accepting the IRB consent form the participants started the experiment. Each participant had two initial trials each for only the primary task, only the secondary task, and the primary task with the secondary task. This was to help the participants get comfortable with all three types of settings. Though these six trials were not used for analysis, the participants were not informed that they were practice sessions. Next, four trials were given to only perform the secondary task to help participants recite the alphabet. Next, the two settings with and without the secondary task were performed eight times each. To minimize the confusion between switching the conditions for each trial, four consecutive trials had the same settings. The eight trials with only the primary task were used to detect whether a participant was a random clicker. For each trial, there was a time limit of 40 s to finish the task. After the 26 trials were done, individual working-memory capacity was measured using operated span task (OSPAN). Finally, a demographic survey was conducted. The procedure is shown in Figure 2.
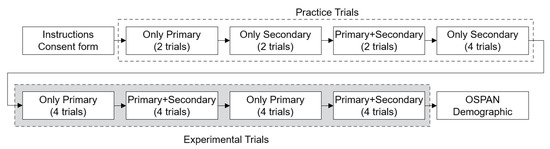
Figure 2.
Flowchart of the procedure of the experiment.
4.6. Measurements
4.6.1. Decision Quality
As mentioned in the Data Sets and Primary task sections, the data sets were generated randomly to be different for each trial, therefore the highest utility of the best option differed for each trial. In order to be comparable among each trial, we normalized the utility of options. We followed the measure decision quality used in the previous study [27], calculated as follows:
where is derived from Equation (1). Eventually the decision quality ranged from 0 to 1, in which 1 was the maximum decision quality when the best option was selected and 0 when the worst option was selected.
4.6.2. Individual Working Memory Span
Although the main interest of this study is not investigating individual differences of working memory capacity, we measured the working memory capacity for each participant. There are different methods to measure the individual working-memory capacity such as operation span, reading span, and counting span. Different working-memory span measurements have shown to have good reliability and validity [56]. These tasks require a series of recall of the to-be-remembered tasks along with the distracting tasks, which have been shown to be good predictors of individual differences in different types of cognitive performance [57]. Particularly, operated span task (OSPAN) requires solving a series of math operations while remembering a set of words. Considering the online environment, we adopted the automated version of OSPAN [58], as it only requires interaction with the mouse. The participants were asked to solve a series of math problems and remember the letters shown. A sequence of math problems and letters form a set. For example, in the case in which the set size is three, three math problems and three letters are shown. The participants have to recall the three letters in the same order and actual position. There were five different set sizes, which ranged from 3 to 7 and each set size was shown twice. A total of 10 sets, which contained a total of 50 math problems and 50 letters to remember. Because the participants should be attempting to solve both the math problems and remember the letters, the task imposed an 85% accuracy rate for the math problems. It was mentioned that they would not be paid if the accuracy was lower than 85% on the instructions. The OSPAN score was calculated by the sum of all perfectly recalled letters, which ranged from 0 to 50.
4.7. Rewards
The base payment for participating in the task was $1.80, and the maximum bonus for each of the trials was as follows: only the primary task ($0.12), only the secondary task ($0.06), both the primary and secondary tasks ($0.12 and $0.06 for each task). For the trials with only primary task, the bonus amount was calculated proportionally to the participants’ decision quality. If they selected the best item, they would get the maximum reward. For the reciting-only alphabet task, they were paid if the alphabet was correct. For the trial with both primary and secondary task, the participants were informed that they would receive no bonus if the alphabet was wrong, regardless of their performance for the decision-making task. This was to make sure that the participants would focus on the secondary task while doing the primary task. If they got the secondary task correct, the bonus amount of $0.06 was given for getting the secondary task correct and bonus proportionally to the decision quality for the primary task (max $0.06) was added. For the OSPAN task, $0.20 was paid if the participants finished the OSPAN task with an accuracy of the math problems higher than 85%. The average earning for the participants was $3.95 ().
5. Results
5.1. Secondary Task Performance
First, we examined the performance of the secondary task. The letter the participants entered was checked to see if it matched with the last letter on the beep. The number of trials in which the participants entered the correct letter is shown in Table 1. The distribution of the number of incorrect and correct trials was similar for both SS and TS interfaces. The mean response time to enter the letter and click on the done button to close the pop-up window was 1.7 s for SS () and 2.0 s for TS ().

Table 1.
Number of trials in which case participants entered the correct letter for the secondary task.
The difference between the correct letter and the letter entered by the participants was calculated for the error size using the ASCII code of the lower case alphabet letter. However, as the participants were asked to start from “a” again after they reached “z,” if the letter was incorrect, it was not clear whether they overcounted or undercounted the letter. For example, the ASCII code is 97 for “a” and 122 for “z,” the difference between the two letters by ASCII code would be 25 (). However, if we consider the alphabet to be loop, the distance between two can be 1. Therefore, the error size was calculated by following these rules: (1) calculate the absolute difference of the two ASCII codes; (2) subtract the value from 26 (the length of the alphabet); and (3) select the smaller value of the two. The distribution of errors is shown in Figure 3.
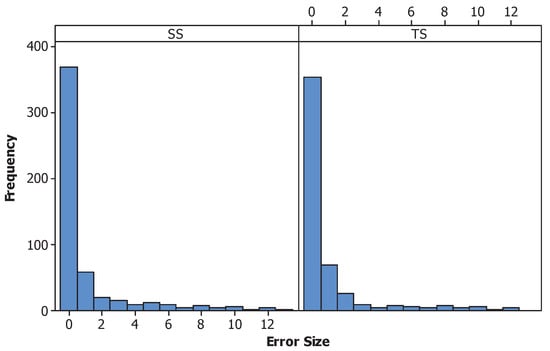
Figure 3.
Histogram of the error size for the secondary task.
For these types of secondary tasks, it is important to ensure that participants were focusing on both the primary and the secondary task. Although an incorrect letter was selected in the secondary task, all the data was included for further analysis. We believe that even though participants paid attention to the secondary tasks, errors can occur and the distribution of the error size seems reasonable without showing much difference between the two interfaces.
5.2. Decision Quality
To give an overview of the decision quality comparing the two interfaces, Figure 4 depicts the decision quality for each group. It is shown to help understand the decision quality with the scale of the actual response [0, 1] before categorizing it into three levels. With the SS interface, the mean decision quality for only the primary task and the primary task combined with the secondary task were 0.86 and 0.84, respectively. With the TS interface, the mean decision quality for only the primary task and the primary task combined with the secondary task were 0.80 and 0.75, respectively.
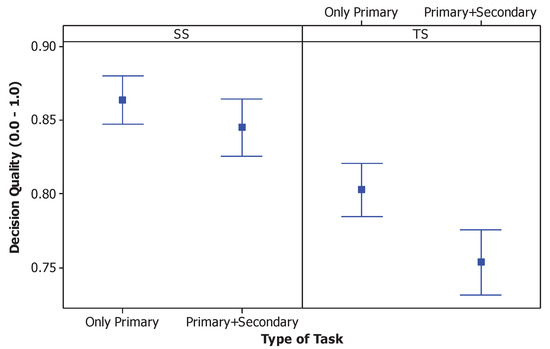
Figure 4.
Interval plot of decision quality for both interfaces (SimulSort—SS and Typical Sorting—TS) and the comparing the settings with only the primary task and the primary combined with the secondary task (95% CI for the mean).
The decision quality of the responses did not follow a normal distribution. As the assumptions of the standard linear mixed model did not hold, we categorized the responses into three groups and conducted an ordered logistic regression using the proportional odds model with PROC GLIMMIX. By grouping the decision quality, we made a trade-off between losing the granularity of the decision measurement and keeping the mixed model split-plot design into analysis. Using visual inspection, the threshold to determine the three groups in the histogram was to inspect for two locations where the frequency declined the most. After splitting the histogram, three sections remained, one for each of the levels. Each section had its own peak representing an individual distribution for each level. The range of decision quality for the three levels was: low [0,0.7625), medium [0.7625, 0.9875), and high [0.9875, 1]. The items that are included in the high-level decision quality was the top-ranked item, for the medium-level decision quality the next top 3 to 4 ranked items were included, the remaining were included in the low-level decision quality range depending on the dataset. The main effects of the interface and the existence of the secondary task were considered fixed, whereas the effects of participants and the interaction between the participants and the secondary task were considered random.
The probability of having a higher level of decision quality was affected by the interface (, ) and the existence of a secondary task (, ). The interaction effect was found to be not significant (, ). To test the hypotheses that a secondary task had an impact within each interface, the odds ratios were computed. A pairwise comparison using an odds ratio revealed that the secondary task had an impact on the decision quality level (see Figure 5a). For the SS interface, the probability of completing only a primary task () was not different from that for a primary task combined with a secondary task () (H1 confirmed). For the TS interface, the probability for only a primary task () was significantly higher than that of a primary task combined with a secondary task () (H2 confirmed). While the overall decision quality was higher with SS, only TS was impacted by the secondary task. This indicates that the strategies chosen by the users while using SS required less working memory for accomplishing the tasks. For each OSPAN group, while the participants used SS always, they outperformed the participants using TS for all cases (see Figure 5c).
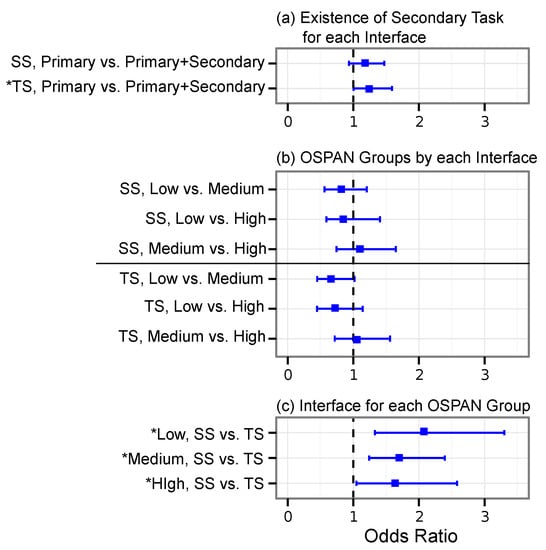
Figure 5.
The 95% confidence intervals of odds ratios of different comparisons. The asterisk mark (*) indicates statistically significant odds ratios. Comparison of (a) the existence of secondary task for each interface; (b) operated span task (OSPAN) groups by each interface; and (c) interfaces for each OSPAN group.
5.3. Individual Difference of Working Memory Span
5.3.1. Individual OSPAN Score
Only participants who had over 85% accuracy were included. With this criterion, eight participants were filtered. A total of 129 participants (66 for SS and 63 for TS) were included for further analysis. The distribution of the OSPAN scores are shown in Figure 6.
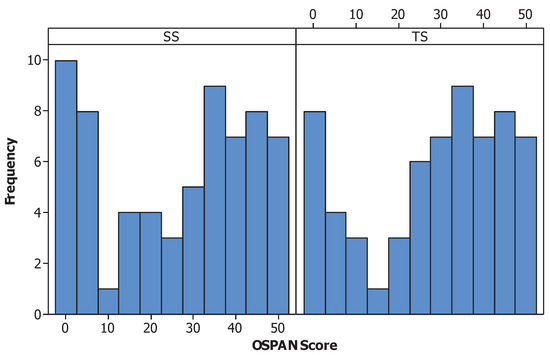
Figure 6.
Distribution of OSPAN score of the participants.
A common method to use OSPAN scores in analysis is to divide the participants into groups of high, middle, and low OSPAN groups (e.g., [59,60]). The quantile of the score is used and the participants in the lower quantile are grouped as “low” and the participants in the higher quantile are grouped as “high”. The others are considered as the “middle” group. The lower group had OSPAN scores below or equal to 11 and the higher group had scores greater than or equal to 41. The number of participants for each group is shown in Table 2.
Table 2.
Number of participants for each OSPAN group.
5.3.2. Decision Quality by OSPAN Groups
The trials that only had the primary task were included in the analysis, as the interest was to see the performance on object selection decision-making task. The OSPAN group was added to the model for further analysis using PROC GLIMMIX.
The probability of having a higher level of decision quality was affected by interface (, ) and not by the OSPAN group (, ). In order to see the impact of interface within each OSPAN group, a pairwise comparison using odds ratio is reported in Figure 5b. For the low OSPAN group, the probability for SS () was higher than that for TS (). For the medium OSPAN group, the probability for SS () was higher than that for TS (). For the high OSPAN group, the probability for SS () was higher than that for TS (). Figure 7 depicts the decision quality for the two interfaces divided into the OSPAN groups. It is shown to help understand the decision quality with the scale of the actual response [0, 1] before categorizing into three levels.
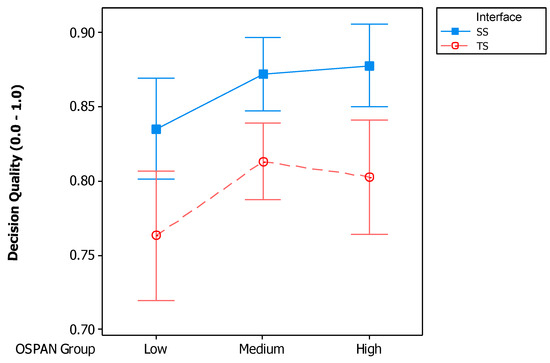
Figure 7.
Interval plot of decision quality for both two interfaces and each OSPAN group (95% CI for the mean).
6. Discussion
6.1. Unburdening Working Memory
Through this study, it was shown that using SS leads to utilizing less working memory capacity than using TS, especially on the phonological loop. The decision quality did not drop during the secondary task with SS, whereas it dropped significantly with TS. Core processes required for evaluating alternatives, such as subtracting or multiplying values, might require more working memory resources while using TS than SS, which could not be fully achieved due to the secondary task. Although people apply different strategies by fully or partially relying on visual information, and extracting visual information demands higher attention, overall we believe that using visual bars in SS helps accomplish certain processes, allowing individuals to use less working memory to accomplish tasks. While using SS, the task of problem solving might become easier because the participants do not have to fully engage in a complicated mental calculation. Instead, they might shift to using visual bars in SS by using less cognitive capacity to accomplish the task. Thus, they can use their remaining cognitive capacity to perform other tasks.
This will also refine the claim that the effectiveness or benefit of using an information visualization technique results from amplifying cognition [8]. We believe that the outcome of using these visualizations in interpreted as “amplified cognition” because the final product is something the user could not have done without the visualizations. Through visual perception, the cognitive abilities required during the process decreases with the user able to accomplish the goal more easily. One similar example is that multiplying three-digit numbers becomes easier when using a paper and pencil than when doing it in your head [61]. If the visual interface is well designed, then complex problem solving can become a simple task. It is possible that while using SimulSort, the task of decision making became easier because the participants did not have to fully engage in a complicated mental calculation with the numbers.
6.2. Individual Difference on Decision Quality
By considering the working memory capacity of individuals, we could see if one type of visual aid, SimulSort, was beneficial to different groups. In this experiment, all three OSPAN groups (i.e., low, medium, and high) using SS had higher decision quality than the groups using TS. Considering that the decision outcome was higher with SS than TS, we can see that this result is applicable for all three OSPAN groups, without favoring a particular group. Therefore, even for people with low working memory capacity, the performance for decision-making tasks may be as comparable to other people with higher cognitive capacity.
Among the three OSPAN groups using SS and TS, there was no difference in terms of the decision quality within each interface. This was unexpected, as the hypotheses were derived from the fact that the decision-making tasks required working-memory capacity. There are two possible speculations. As shown in Figure 5b, a marginal difference was shown between the low and medium OSPAN group with the TS interface, and the decision quality of the medium group is relatively higher than that of the low group. Because the method to divide the group used quartiles, with the sample for this experiment, only a few remained for each group, as shown in Table 2. If a large sample size is collected, it might be able detect difference among different OSPAN groups. Another possibility is that the OSPAN measure was not articulated enough to measure cognitive capacity. The maximum score for this experiment was 50, which is similar to studies that also ranged from 42 to 56 e.g., [59,60]). There are also tests that have more sets with a maximum score of 75 [58], which might be able to detect the difference in cognitive capacity with more granularity.
6.3. Conducting Online Working Memory Experiments
In previous studies, experiments to investigate the effects on working memory with dual-task methodology have been conducted in a controlled-lab setting [57,62]. However, it is challenging to conduct these types of experiments online because the experimenter can not have full control over participants. The main concern is if the participants are actually making an effort to accomplish both primary and secondary tasks. In order to overcome this issue, we designed a way to measure the accuracy of the secondary task. We could have an exact answer as the secondary task was to recite the alphabet on the beep within a time constraint. By having this measure to check accuracy, we could motivate the participants to do the task by designing the reward scheme to reflect the performance. In this experiment, participants were penalized if they missed the secondary task, which was easy enough to accomplish if they were focused on it. The results of this study also shows that an online experiment can be an appropriate experimental method to investigate the impacts on working memory when conducting a secondary task. In spite of the concern, a lot of participants can be recruited, and they can be sufficiently controlled with an online experiment environment. However, one limitation is that this task could require more control from the central-executive controller compared to a simple task such as reciting the same word, “the”, on a beep.
7. Conclusions
Through this study we investigated how visualization techniques could help decision makers reach better decision outcomes, especially, by examining the role of working memory. Although visualizations are developed to rely on a human’s visual system, the tasks required to associate with a higher cognition level for data analytic. Therefore, we conducted a study to understand better how the working memory is affected by these data visualizations. Working memory consists of various components that can hold a limited amount of transformable information for a finite period. A well-known model suggests that the working memory consists of two temporary memory systems, a phonological loop, and a visuo-spatial sketchpad [22]. In our study we focus the phonological loop that is involved in verbal information. This study revealed that SimulSort occupied less working memory capacity compared to Typical Sorting, while accomplishing multi-attribute decision-making tasks. A common concurrent task methodology showed that performance deteriorated only with Typical Sorting whereas SimulSort was not affected by the added secondary task. The result of occupying less working memory while processing information could be due to the visual information retrieved. We believe that certain visual encodings can efficiently shift subprocesses to accomplish the task effectively.
Further studies can be conducted on what subprocesses should be externalized and what visual representation can be effective to support the whole process. Working with multi-attribute decision-making problems were interesting as a large amount of literature has already suggested clues of what steps are required to reach the optimal goal and the behavior that people actually do. Retrospectively, we could find how SimulSort was actually supporting these subtasks in a visual way. We believe that while designing a tool for certain tasks, tasks analysis could be an interesting way to determine the type of subtasks that can be transferred into visual representations. Obviously, visualizations rely on visual perception and it is an important aspect to look into. Early works that have focused on the perceptual aspects of effective visual representations can be also extended to see the effect on working memory, and how it can support our cognition in terms of accomplishing more high-level tasks.
Additionally, we should investigate different visual aspects of tabular visualizations. For example, a standard visual encoding is to add a horizontal bar in the cell to show the size of the face value. This shows the distribution for a particular column that also provides a visual cue to help the decision-making process. We should also compare how the polylines in PCP play a different role compared to the cells preserved in tabular visualizations. Researchers have developed several tabular visualizations attempting to come up with a full-function tool aiming at different aspects that can help people understand two-dimensional data. We believe that we need a better understanding of how users utilize these tools. However, the user studies may be more qualitative as the tools have several functions. Along with the rigorously controlled experiments on visual aspects, these findings can lead to theoretical frameworks to suggest design guidelines and predict the value of visualizations.
Funding
This research was supported by the MSIT (Ministry of Science and ICT), Korea, under the Grand Information Technology Research Center support program (IITP-2020-0-01791) supervised by the Institute for Information and communications Technology Planning and Evaluation (IITP) and the National Research Foundation of Korea (NRF) grant funded by the Korea government (MSIT) (No. 2019R1C1C1005508).
Conflicts of Interest
The author declares no conflict of interest.
References
- Berry, I.; Soucy, J.P.R.; Tuite, A.; Fisman, D. Open access epidemiologic data and an interactive dashboard to monitor the COVID-19 outbreak in Canada. CMAJ 2020, 192, 420. [Google Scholar] [CrossRef] [PubMed]
- Eberhardt, A.; Silveira, M.S. Show me the data! A systematic mapping on open government data visualization. In Proceedings of the 19th Annual International Conference on Digital Government Research: Governance in the Data Age, Delft, The Netherlands, 30 May–1 June 2018; pp. 1–10. [Google Scholar]
- Matheus, R.; Janssen, M.; Maheshwari, D. Data science empowering the public: Data-driven dashboards for transparent and accountable decision-making in smart cities. Gov. Inf. Q. 2018, 2018, 101284. [Google Scholar] [CrossRef]
- Cabitza, F.; Locoro, A.; Fogli, D.; Giacomin, M. Valuable visualization of healthcare information: From the quantified self data to conversations. In Proceedings of the International Working Conference on Advanced Visual Interfaces, Bari, Italy, 7–10 June 2016; pp. 376–380. [Google Scholar]
- Rapp, A.; Cena, F. Personal informatics for everyday life: How users without prior self-tracking experience engage with personal data. Int. J. Hum. Comput. Stud. 2016, 94, 1–17. [Google Scholar] [CrossRef]
- Lacefield, W.E.; Applegate, E.B. Data Visualization in Public Education: Longitudinal Student-, Intervention-, School-, and District-Level Performance Modeling. In Proceedings of the Annual Meeting of the American Educational Research Association, New York, NY, USA, 13–17 April 2018. [Google Scholar]
- Shreiner, T.L. Data literacy for social studies: Examining the role of data visualizations in K–12 textbooks. Theory Res. Soc. Educ. 2018, 46, 194–231. [Google Scholar] [CrossRef]
- Card, S.K.; Mackinlay, J.D.; Shneiderman, B. Readings in Information Visualization: Using Vision to Think; Morgan Kaufmann: San Francisco, CA, USA, 1999. [Google Scholar]
- Fekete, J.D.; Van Wijk, J.J.; Stasko, J.T.; North, C. The value of information visualization. In Information Visualization; Springer: Berlin/Heidelberg, Germany, 2008; pp. 1–18. [Google Scholar]
- Cleveland, W.S.; McGill, R. Graphical perception: Theory, experimentation, and application to the development of graphical methods. J. Am. Stat. Assoc. 1984, 79, 531–554. [Google Scholar] [CrossRef]
- Fuchs, J.; Fischer, F.; Mansmann, F.; Bertini, E.; Isenberg, P. Evaluation of alternative glyph designs for time series data in a small multiple setting. In Proceedings of the SIGCHI Conference on Human Factors in Computing Systems, Paris, France, 27 April–2 May 2013; pp. 3237–3246. [Google Scholar]
- Heer, J.; Bostock, M. Crowdsourcing graphical perception: Using mechanical turk to assess visualization design. In Proceedings of the 28th International Conference on Human Factors in Computing Systems, Atlanta, GA, USA, 10–15 April 2010; pp. 203–212. [Google Scholar]
- Heer, J.; Kong, N.; Agrawala, M. Sizing the horizon: The effects of chart size and layering on the graphical perception of time series visualizations. In Proceedings of the SIGCHI Conference on Human Factors in Computing Systems, Boston, MA, USA, 4–9 April 2009; pp. 1303–1312. [Google Scholar]
- Ondov, B.; Jardine, N.; Elmqvist, N.; Franconeri, S. Face to face: Evaluating visual comparison. IEEE Trans. Vis. Comput. Graph. 2018, 25, 861–871. [Google Scholar] [CrossRef]
- Wolfe, J.M.; Horowitz, T.S. Five factors that guide attention in visual search. Nat. Hum. Behav. 2017, 1, 0058. [Google Scholar] [CrossRef]
- Plaisant, C. The challenge of information visualization evaluation. In Proceedings of the Working Conference on Advanced Visual Interfaces, Gallipoli, Italy, 25–28 May 2004; pp. 109–116. [Google Scholar]
- Borkin, M.A.; Bylinskii, Z.; Kim, N.W.; Bainbridge, C.M.; Yeh, C.S.; Borkin, D.; Pfister, H.; Oliva, A. Beyond memorability: Visualization recognition and recall. IEEE Trans. Vis. Comput. Graph. 2015, 22, 519–528. [Google Scholar] [CrossRef]
- Haroz, S.; Kosara, R.; Franconeri, S.L. Isotype visualization: Working memory, performance, and engagement with pictographs. In Proceedings of the 33rd Annual ACM Conference on Human Factors in Computing Systems, Seoul, Korea, 18–23 April 2015; pp. 1191–1200. [Google Scholar]
- Liu, Z.; Stasko, J. Mental models, visual reasoning and interaction in information visualization: A top-down perspective. IEEE Trans. Vis. Comput. Graph. 2010, 16, 999–1008. [Google Scholar]
- Padilla, L.M.; Castro, S.C.; Quinan, P.S.; Ruginski, I.T.; Creem-Regehr, S.H. Toward Objective Evaluation of Working Memory in Visualizations: A Case Study Using Pupillometry and a Dual-Task Paradigm. IEEE Trans. Vis. Comput. Graph. 2019, 26, 332–342. [Google Scholar] [CrossRef]
- Cowan, N. The many faces of working memory and short-term storage. Psychon. Bull. Rev. 2017, 24, 1158–1170. [Google Scholar] [CrossRef] [PubMed]
- Baddeley, A.D.; Hitch, G.J. Working memory. Psychol. Learn. Motiv. 1974, 8, 47–89. [Google Scholar]
- DeStefano, D.; LeFevre, J.A. The role of working memory in mental arithmetic. Eur. J. Cogn. Psychol. 2004, 16, 353–386. [Google Scholar] [CrossRef]
- Lurie, N.H. Decision Making in Information-Rich Environments: The Role of Information Structure. J. Consum. Res. 2004, 30, 473–486. [Google Scholar] [CrossRef]
- Lurie, N.H.; Mason, C.H. Visual representation: Implications for decision making. J. Mark. 2007, 71, 160–177. [Google Scholar] [CrossRef]
- Hur, I.; Yi, J.S. SimulSort: Multivariate Data Exploration Through An Enhanced Sorting Technique. In Human-Computer Interaction. Novel Interaction Methods and Techniques; Jacko, J., Ed.; Lecture Notes in Computer Science; Springer: Berlin/Heidelberg, Germany, 2009; Volume 5611, pp. 684–693. [Google Scholar]
- Hur, I.; Kim, S.H.; Samak, A.; Yi, J.S. A Comparative Study of Three Sorting Techniques in Performing Cognitive Tasks on a Tabular Representation. Int. J. Hum. Comput. Interact. 2013, 29, 379–390. [Google Scholar] [CrossRef]
- Kim, S.H.; Dong, Z.; Xian, H.; Upatising, B.; Yi, J.S. Does an eye tracker tell the truth about visualizations? Findings while investigating visualizations for decision making. IEEE Trans. Vis. Comput. Graph. 2012, 18, 2421–2430. [Google Scholar] [CrossRef]
- Samek, A.; Hur, I.; Kim, S.H.; Yi, J.S. An experimental study of the decision process with interactive technology. J. Econ. Behav. Organ. 2016, 130, 20–32. [Google Scholar] [CrossRef][Green Version]
- Hwang, C.; Yoon, K. Multiple Attribute Decision Making: Methods And Applications: A State-of-the-Art Survey; Springer: Berlin/Heidelberg, Germany, 1981. [Google Scholar]
- Yoon, K.; Hwang, C. Multiple Attribute Decision Making: An Introduction; Sage: Thousand Oaks, CA, USA, 1995. [Google Scholar]
- Simon, H.A. A behavioral model of rational choice. Q. J. Econ. 1955, 69, 99–118. [Google Scholar] [CrossRef]
- Payne, J.W.; Bettman, J.R.; Johnson, E.J. The Adaptive Decision Maker; Cambridge University Press: Cambridge, UK, 1993. [Google Scholar]
- Shah, A.; Oppenheimer, D. Heuristics Made Easy: An Effort-reduction Framework. Psychol. Bull. 2008, 134, 207–222. [Google Scholar] [CrossRef]
- Bettman, J.R. Issues in Designing Consumer Information Environments. J. Consum. Res. 1975, 2, 169–177. [Google Scholar] [CrossRef]
- Rao, R.; Card, S.K. The Table Lens: Merging Graphical and Symbolic Representations in An Interactive Focus+ Context Visualization for Tabular Information. In Proceedings of the SIGCHI Conference on Human Factors in Computing Systems: Celebrating Interdependence, Boston, MA, USA, 24–28 April 1994; pp. 318–322. [Google Scholar]
- Gratzl, S.; Lex, A.; Gehlenborg, N.; Pfister, H.; Streit, M. Lineup: Visual analysis of multi-attribute rankings. IEEE Trans. Vis. Comput. Graph. 2013, 19, 2277–2286. [Google Scholar] [CrossRef] [PubMed]
- Wegman, E.J. Hyperdimensional data analysis using parallel coordinates. J. Am. Stat. Assoc. 1990, 85, 664–675. [Google Scholar] [CrossRef]
- Zhang, P.; Whinston, A.B. Business Information Visualization for Decision-Making Support-A Research Strategy. In Proceedings of the First Americas Conference on Information Systems, San Francisco, CA, USA, 12–14 June 1995. [Google Scholar]
- Tegarden, D.P. Business information visualization. Commun. AIS 1999, 1, 4. [Google Scholar] [CrossRef]
- Treisman, A. Preattentive processing in vision. Comput. Vis. Graph. Image Process. 1985, 31, 156–177. [Google Scholar] [CrossRef]
- Hsee, C.K. The evaluability hypothesis: An explanation for preference reversals between joint and separate evaluations of alternatives. Organ. Behav. Hum. Decis. Process. 1996, 67, 247–257. [Google Scholar] [CrossRef]
- Schkade, D.A.; Kleinmuntz, D.N. Information displays and choice processes: Differential effects of organization, form, and sequence. Organ. Behav. Hum. Decis. Process. 1994, 57, 319–337. [Google Scholar] [CrossRef]
- Sloman, S.A. The empirical case for two systems of reasoning. Psychol. Bull. 1996, 119, 3–22. [Google Scholar] [CrossRef]
- Logie, R.H.; Gilhooly, K.J.; Wynn, V. Counting on working memory in arithmetic problem solving. Mem. Cogn. 1994, 22, 395–410. [Google Scholar] [CrossRef]
- Widaman, K.F.; Geary, D.C.; Cormier, P.; Little, T.D. A componential model for mental addition. J. Exp. Psychol. Learn. Mem. Cogn. 1989, 15, 898–919. [Google Scholar] [CrossRef][Green Version]
- Borkin, M.A.; Vo, A.A.; Bylinskii, Z.; Isola, P.; Sunkavalli, S.; Oliva, A.; Pfister, H. What makes a visualization memorable? IEEE Trans. Vis. Comput. Graph. 2013, 19, 2306–2315. [Google Scholar] [CrossRef] [PubMed]
- Lohse, G.L. The role of working memory on graphical information processing. Behav. Inf. Technol. 1997, 16, 297–308. [Google Scholar] [CrossRef]
- Wickens, C.D.; Carswell, C.M. The proximity compatibility principle: Its psychological foundation and relevance to display design. Hum. Factors J. Hum. Factors Ergon. Soc. 1995, 37, 473–494. [Google Scholar] [CrossRef]
- Wickens, C.D. Engineering Psychology and Human Performance; Prentice-Hall: Englewood Cliffs, NJ, USA, 2000. [Google Scholar]
- Johnson, E.J.; Payne, J.W. Effort and Accuracy in Choice. Manag. Sci. 1985, 31, 395–414. [Google Scholar] [CrossRef]
- Trbovich, P.L.; LeFevre, J.A. Phonological and visual working memory in mental addition. Mem. Cogn. 2003, 31, 738–745. [Google Scholar] [CrossRef] [PubMed]
- Fasolo, B.; McClelland, G.H.; Todd, P.M. Escaping the Tyranny of Choice: When Fewer Attributes Make Choice Easier. Mark. Theory 2007, 7, 13–26. [Google Scholar] [CrossRef]
- Seidl, C.; Traub, S. Testing Decision Rules for Multiattribute Decision Making. In Current Trends in Economics; Springer: Berlin/Heidelberg, Germany, 1999; Volume 8, pp. 413–454. [Google Scholar]
- Kim, S.H.; Yun, H.; Yi, J.S. How to filter out random clickers in a crowdsourcing-based study? In Proceedings of the 2012 BELIV Workshop: Beyond Time and Errors-Novel Evaluation Methods for Visualization, Seattle, WA, USA, 14–15 October 2012; p. 15. [Google Scholar]
- Conway, A.R.; Cowan, N.; Bunting, M.F.; Therriault, D.J.; Minkoff, S.R. A latent variable analysis of working memory capacity, short-term memory capacity, processing speed, and general fluid intelligence. Intelligence 2002, 30, 163–183. [Google Scholar] [CrossRef]
- Engle, R.W.; Tuholski, S.W.; Laughlin, J.E.; Conway, A.R. Working memory, short-term memory, and general fluid intelligence: A latent-variable approach. J. Exp. Psychol. Gen. 1999, 128, 309–331. [Google Scholar] [CrossRef]
- Unsworth, N.; Heitz, R.P.; Schrock, J.C.; Engle, R.W. An automated version of the operation span task. Behav. Res. Methods 2005, 37, 498–505. [Google Scholar] [CrossRef]
- Bengson, J.J.; Mangun, G.R. Individual working memory capacity is uniquely correlated with feature-based attention when combined with spatial attention. Atten. Percept. Psychophys. 2011, 73, 86–102. [Google Scholar] [CrossRef][Green Version]
- Hutchison, K.A. Attentional control and the relatedness proportion effect in semantic priming. J. Exp. Psychol. Learn. Mem. Cogn. 2007, 33, 645–662. [Google Scholar] [CrossRef] [PubMed]
- Norman, D.A. Things That Make Us Smart: Defending Human Attributes in the Age of the Machine; Basic Books: New York, NY, USA, 1993. [Google Scholar]
- Burnham, B.R.; Sabia, M.; Langan, C. Components of working memory and visual selective attention. J. Exp. Psychol. Hum. Percept. Perform. 2014, 40, 391–403. [Google Scholar] [CrossRef] [PubMed]


Publisher’s Note: MDPI stays neutral with regard to jurisdictional claims in published maps and institutional affiliations. |
© 2020 by the author. Licensee MDPI, Basel, Switzerland. This article is an open access article distributed under the terms and conditions of the Creative Commons Attribution (CC BY) license (http://creativecommons.org/licenses/by/4.0/).