Article

Balancing Layout Space and Risk Comprehension in Health Communication: A Comparison of Separated and Integrated Icon Arrays

1
Doctoral Program in Design, College of Design, National Taipei University of Technology, 1, Sec. 3, Zhongxiao E. Rd., Taipei 10608, Taiwan
2
Department of Industrial Design, National Taipei University of Technology, 1, Sec. 3, Zhongxiao E. Rd., Taipei 10608, Taiwan
*
Author to whom correspondence should be addressed.
Informatics 2025, 12(4), 105; https://doi.org/10.3390/informatics12040105
Submission received: 28 June 2025 / Revised: 18 September 2025 / Accepted: 22 September 2025 / Published: 30 September 2025

Abstract

This study investigated how icon array layouts influence comprehension of medical risk information, particularly in relation to users’ cognitive abilities. In a within-subjects experiment (N = 121), participants reviewed clinical scenarios with treatment-related risks and side effect risks displayed in either separated or integrated icon arrays. Comprehension was significantly higher for separated treatment-related risk layouts (p < 0.001), while side effect layout showed no effect. Numeracy and graph literacy significantly predicted comprehension. Crucially, individuals with lower numeracy showed marked gains when viewing separated formats, whereas those with higher numeracy performed well regardless of layout. Despite this, participants preferred hybrid formats—separated treatment-related risk with integrated side effect risks—revealing a critical preference–performance gap. By demonstrating how visual layout interacts with user abilities, this study provides actionable guidance for patient decision aid design. The findings show that comprehension accuracy must take precedence over layout compactness and user preference, with separated layouts recommended for treatment-related risks—especially for individuals with lower numeracy—and greater flexibility allowed for side effect risks when space is limited.

1. Introduction

With the growing emphasis on patient-centered care, Shared Decision Making (SDM) has become a pivotal framework in contemporary clinical practice and health communication [1]. In the SDM process, healthcare providers are expected to help patients evaluate the benefits and risks associated with various treatment options [2,3], while patients must possess adequate risk comprehension to make decisions aligned with their personal values [4,5]. However, numerous studies have revealed that patients often struggle to accurately interpret quantitative risk information [6,7].
To enhance patient understanding, visual aids have been increasingly utilized in the design of Patient Decision Aids (PDAs), with icon arrays emerging as one of the most effective tools for representing probabilistic health data [8]. Icon arrays depict natural frequencies in a clear and intuitive format, helping users—especially those with lower health literacy or numeracy—comprehend complex medical information [8,9,10,11]. Compared to bar or pie charts, icon arrays enable a more immediate grasp of probabilities (e.g., “1 in 100”) and are thus widely recommended in clinical communication and PDA design guidelines [12].
Despite these advantages, real-world applications often require the presentation of multiple outcomes (e.g., treatment effectiveness and side effect risks) across different time points or treatment options. For instance, patients deciding on anticoagulants for atrial fibrillation must weigh stroke prevention against bleeding risks [13]; vaccine discussions must address both protective efficacy and adverse events; and breast cancer patients must evaluate the trade-offs between recurrence prevention and therapy-related side effects. These scenarios demand the simultaneous display of multiple icon arrays, which introduces a critical design tension between visual clarity and space efficiency, especially in constrained settings such as printed leaflets or mobile interfaces.
Two primary layout strategies exist to address this challenge: the separated format and the integrated format. In the separated format, treatment and control risks are displayed in distinct arrays, allowing for straightforward comparison but requiring additional space and cognitive effort to compute differences. In contrast, the integrated format combines multiple data points within a single array, reducing spatial demands while aiming to support intuitive interpretation [14,15].
Previous research has yielded mixed findings regarding the relative efficacy of these formats. Some studies have reported that separated formats enhance understanding by lowering cognitive load and enabling clearer distinctions between risks [16,17]. Others suggest that integrated formats promote holistic processing and are better suited for space-constrained designs [18,19]. Tiede et al. further introduced the incremental risk format, which visualizes the risk difference directly within one icon array. Although initially more cognitively demanding, this approach was shown to foster better gist understanding following guided exposure [20].
Nevertheless, current evidence does not establish a definitive recommendation for layout strategies when presenting multi-faceted medical risks. Moreover, few studies have systematically examined how individual differences—such as health literacy, graph literacy, and numeracy—moderate the effectiveness of visual risk formats, despite growing recognition of their impact on health comprehension [6,21,22].
This study seeks to fill these gaps by simulating a realistic decision-making scenario and investigating how layout strategies—specifically separated vs. integrated icon arrays used to present treatment and side effect information—influence comprehension, decision-making, and user preferences. Additionally, we examine whether individual cognitive abilities (health literacy, graph literacy, and numeracy) moderate these effects. In this study, treatment-related risks refer to disease probabilities before and after treatment, reflecting treatment effectiveness (e.g., risk of stroke with and without medication). Side effect risks denote the probabilities of adverse events occurring as a result of the treatment (e.g., bleeding risk from anticoagulants).
Two primary research questions guide this investigation:
(1)
Under space-constrained conditions, which visual layout—separated or integrated—more effectively enhances users’ comprehension of medical risk information?
(2)
Do individual differences in health literacy, graph literacy, and numeracy moderate the effects of these layout strategies?
Grounded in cognitive load theory, we hypothesize that layout design will systematically influence comprehension. Cognitive load theory posits that as attentional demands increase, the limited resources of working memory available for processing and maintaining information decrease, resulting in reduced comprehension [23,24]. Separated icon arrays, by visually disaggregating treatment and side effect risks, are expected to reduce simultaneous processing demands and cognitive interference, thereby enhancing comprehension. In contrast, integrated layouts may impose higher working memory load by requiring users to extract multiple probabilistic outcomes from a single visual field.
Accordingly, we hypothesize the following: (1) the separated format will lead to higher comprehension than the integrated format, and (2) individual cognitive abilities will significantly moderate the impact of layout design. By providing empirical evidence on how layout strategies interact with cognitive factors, this study offers practical design guidance for improving the usability of PDAs. Our findings aim to support designers in optimizing the trade-off between comprehension and visual efficiency, ultimately advancing informed decision-making and patient-centered care.

2. Materials and Methods

2.1. Experimental Design

We conducted a 2 × 2 within-subjects factorial experiment to investigate how visual presentation formats of icon arrays affect users’ comprehension of treatment-related risk information. Two layout factors were manipulated: (1) treatment-related risk presentation (separated vs. integrated), and (2) side effect risk presentation (separated vs. integrated).
The primary dependent variable was comprehension, assessed using a structured questionnaire comprising identification, comparison, and calculation tasks (Supplementary Table S1). Participants were also asked to indicate their subjective preferences for the visual formats.
In addition, to examine whether individual cognitive abilities moderated the effects of visual presentation formats on comprehension, we assessed health literacy, graph literacy, and numeracy prior to the main experimental task.

2.2. Participants

Participants were recruited online through the SurveyCake platform, and the survey link was disseminated via popular social media channels (e.g., Facebook, LINE). Eligible participants were required to be 20 years or older, able to use a computer, and not colorblind. After completing demographic questions and validated scales measuring health literacy, graph literacy, and numeracy (see Section 2.5), they participated in a within-subjects experiment.
Each participant completed four clinical scenarios featuring different combinations of the layout factors. The presentation order of scenarios was randomized to control for sequence effects. After each scenario, participants completed a dedicated set of comprehension questions. At the end of the study, they ranked their preferences for the different visual presentation formats. The study protocol was approved by the National Taiwan University Institutional Review Board (202206ES059).

2.3. Stimuli

To simulate realistic decision-making scenarios, four clinical vignettes were developed, each involving a different chronic disease (hypertension, hyperlipidemia, osteoporosis, or diabetes). While the disease context and medication names varied, all scenarios followed a consistent structure: a diagnosis was presented, followed by two treatment options accompanied by icon arrays visualizing treatment benefits and two potential side effect risks. Treatment-related risks were presented as disease probabilities before and after treatment, allowing participants to directly compare baseline and post-treatment values. Side effect risks were presented as the probabilities of adverse events resulting from treatment.
Each icon array used a 10 × 10 grid (100 avatars), with each icon representing 1%. Colors denoted outcome categories: blue for disease risk, and orange or red for side effects. Person-shaped icons were used to enhance memorability and comprehension [25]. To isolate the effects of layout, all other visual parameters (e.g., icon size, layout direction, and font) were kept constant.
Two layout factors were manipulated, resulting in four visual conditions (Figure 1):
Treatment-related risk presentation
  • Separated: Risks before and after treatment were shown in two distinct arrays.
  • Integrated: Risks were combined in one array using two shades of blue.
Side effect risk presentation
  • Separated: Each side effect was displayed in a separate icon array.
  • Integrated: Multiple side effects were combined in a single array using different colors.
All arrays were grouped and stacked from bottom to top, arranged left to right. This layout followed prior research showing that horizontally grouped arrays improve comprehension [26,27], particularly among users with lower numeracy [9,10]. The overall visual design was guided by evidence-based principles for effective risk communication and patient decision aids [8,25,28].

2.4. Statistical Analysis

Statistical analyses were performed using IBM SPSS Statistics (Version 29). Descriptive statistics were used to summarize demographic and cognitive variables. The primary analysis was a 2 (treatment-related risk: separated vs. integrated) × 2 (side effect risk: separated vs. integrated) repeated measures ANOVA on comprehension scores. Assumptions of normality (Shapiro–Wilk) and sphericity (Mauchly’s test) were assessed, with Greenhouse–Geisser corrections applied where necessary.
To explore moderation effects, general linear models were conducted with health literacy, graph literacy, and numeracy entered as covariates or interaction terms. Preference rankings for the visual formats (1 = most preferred, 4 = least preferred) were analyzed using Friedman tests, followed by Bonferroni-adjusted Wilcoxon signed-rank tests.
Statistical significance was set at p < 0.05. Effect sizes were reported where appropriate. A priori power analysis (G*Power 3.1) indicated that a minimum of 34 participants would be sufficient to detect medium effects (f = 0.25) with 80% power. The final sample (N = 121) exceeded this threshold.

2.5. Measures

The following instruments were used to assess participants’ comprehension and cognitive abilities relevant to processing visual risk information. All instruments have been previously validated and are widely used in health communication, literacy, and decision-making research. Reliability information for the adapted comprehension scale was calculated based on the current sample.

2.5.1. Comprehension

Comprehension of risk information was evaluated using 11 items adapted from prior research on risk communication and icon array interpretation [17]. The items measured four types of cognitive tasks: identification (Q1–Q4), calculation (Q5–Q7), comparative reasoning (Q8–Q10), and decision-making (Q11) (Supplementary Table S2). Each correct answer received one point, yielding a total comprehension score ranging from 0 to 11. In the present study, the adapted comprehension scale demonstrated good internal consistency (Cronbach’s α = 0.95).

2.5.2. Health Literacy

Health literacy was measured using the 3-item Health Literacy Screener [29], which assesses confidence in reading, understanding, and filling out medical forms. Each item was rated on a 5-point Likert scale (1 = not at all, 5 = extremely), with higher total scores indicating greater perceived health literacy. The scale has demonstrated good predictive validity in healthcare contexts.

2.5.3. Graph Literacy

Graph literacy was measured using the 4-item Short Graph Literacy Scale [30], which evaluates the ability to interpret commonly used visual formats in medical communication. Each item presented a health-related chart followed by a single-choice question. Correct responses were scored as 1 and incorrect responses as 0, with total scores ranging from 0 to 4. Higher scores reflected better graphical interpretation skills.

2.5.4. Numeracy Skill

Numeracy skill was assessed using the Adaptive Berlin Numeracy Test (BNT) [31], a validated tool designed to measure statistical reasoning and risk comprehension. Each participant completed between 2 and 3 items, based on a branching structure: a correct answer led to a more difficult item, whereas an incorrect answer led to an easier one. Correct responses were scored as 1 point each (total score range: 0 to 3).

3. Results

3.1. Participant Characteristics

A total of 121 participants completed the study. The mean age was 36.64 years (SD = 8.03), ranging from 22 to 65 years. Among them, 57.0% were female (n = 69), and 43.0% were male (n = 52). Regarding education level, most participants had a university degree (69.4%), followed by high school education (20.7%) and graduate-level education or above (9.9%). No missing data were observed.
Cognitive measures indicated a mean health literacy score of 10.42 (SD = 1.80; range: 3–15), a mean numeracy skill (BNT) score of 1.71 (SD = 1.14; range: 0–3), and a mean graph literacy score of 1.55 (SD = 1.19; range: 0–4) (Table 1).

3.2. Effects of Presentation Layout on Comprehension

A two-way within-subjects ANOVA was conducted to examine the effects of treatment-related risk presentation format (separated vs. integrated) and side effect risk presentation format (separated vs. integrated) on participants’ comprehension scores.
The analysis revealed a significant main effect of treatment-related risk presentation. Comprehension scores were higher for separated presentations (M = 6.03, SD = 3.23) than for integrated presentations (M = 5.55, SD = 3.15), F(1, 120) = 12.46, p < 0.001, partial η2 = 0.094 (Figure 2, Table 2). In contrast, the main effect of side effect risk presentation was not significant, F(1, 120) = 0.54, p = 0.47, partial η2 = 0.004. Comprehension scores were comparable between the separated (M = 5.83, SD = 3.09) and integrated (M = 5.74, SD = 3.28) side effect formats. The interaction between treatment-related risk and side effect risk presentation was also not significant, F(1, 120) = 1.72, p = 0.193, partial η2 = 0.014 (Table 3).
In summary, presenting treatment-related risk information in a separated format significantly improved comprehension, regardless of how side effect risks were displayed. No specific combination of layout factors yielded a synergistic advantage.

3.3. Moderating Effects of Cognitive Abilities

To examine whether individual cognitive abilities moderated the effects of visual risk presentation formats on comprehension, a General Linear Model (GLM) with covariates was conducted. Numeracy (Berlin Numeracy Test), graph literacy, and health literacy were entered as continuous predictors in a within-subjects design.
Without adjusting for covariates, the main effects of treatment-related risk format, F(1, 117) = 1.381, p = 0.242, and side effect risk format, F(1, 117) = 0.226, p = 0.635, were not statistically significant. Their interaction was also not significant, F(1, 117) = 1.650, p = 0.201. These findings suggest that the visual layout alone did not significantly impact comprehension when cognitive factors were not considered.
However, when covariates were added, several significant effects emerged. Graph literacy had a significant main effect, F(1, 117) = 14.870, p < 0.001, partial η2 = 0.113, indicating that higher graph literacy was associated with better comprehension. Similarly, numeracy significantly predicted comprehension, F(1, 117) = 6.290, p = 0.014, partial η2 = 0.051. In contrast, health literacy was not a significant predictor, F(1, 117) = 0.380, p = 0.540, partial η2 = 0.003.
A significant Interaction was found between treatment-related risk format and numeracy, F(1, 117) = 7.119, p = 0.009, partial η2 = 0.057. This indicates that the effectiveness of layout varied by numeracy level. No significant interactions were found for side effect risk format or for any terms involving health literacy and graph literacy. A follow-up analysis revealed that individuals with lower numeracy showed significantly higher comprehension in separated treatment-related risk layouts (M = 5.15) than in integrated layouts (M = 4.46, p < 0.001). In contrast, among individuals with higher numeracy, comprehension was consistently high regardless of treatment-related risk format (M = 6.81 for separated vs. M = 6.52 for integrated, p = 0.116). Table 4 and Table 5 summarize these moderation results, and Figure 3 visualizes the interaction between treatment-related risk presentation and numeracy. These findings indicate that separating treatment-related risks may be particularly beneficial for individuals with lower numeracy skills.
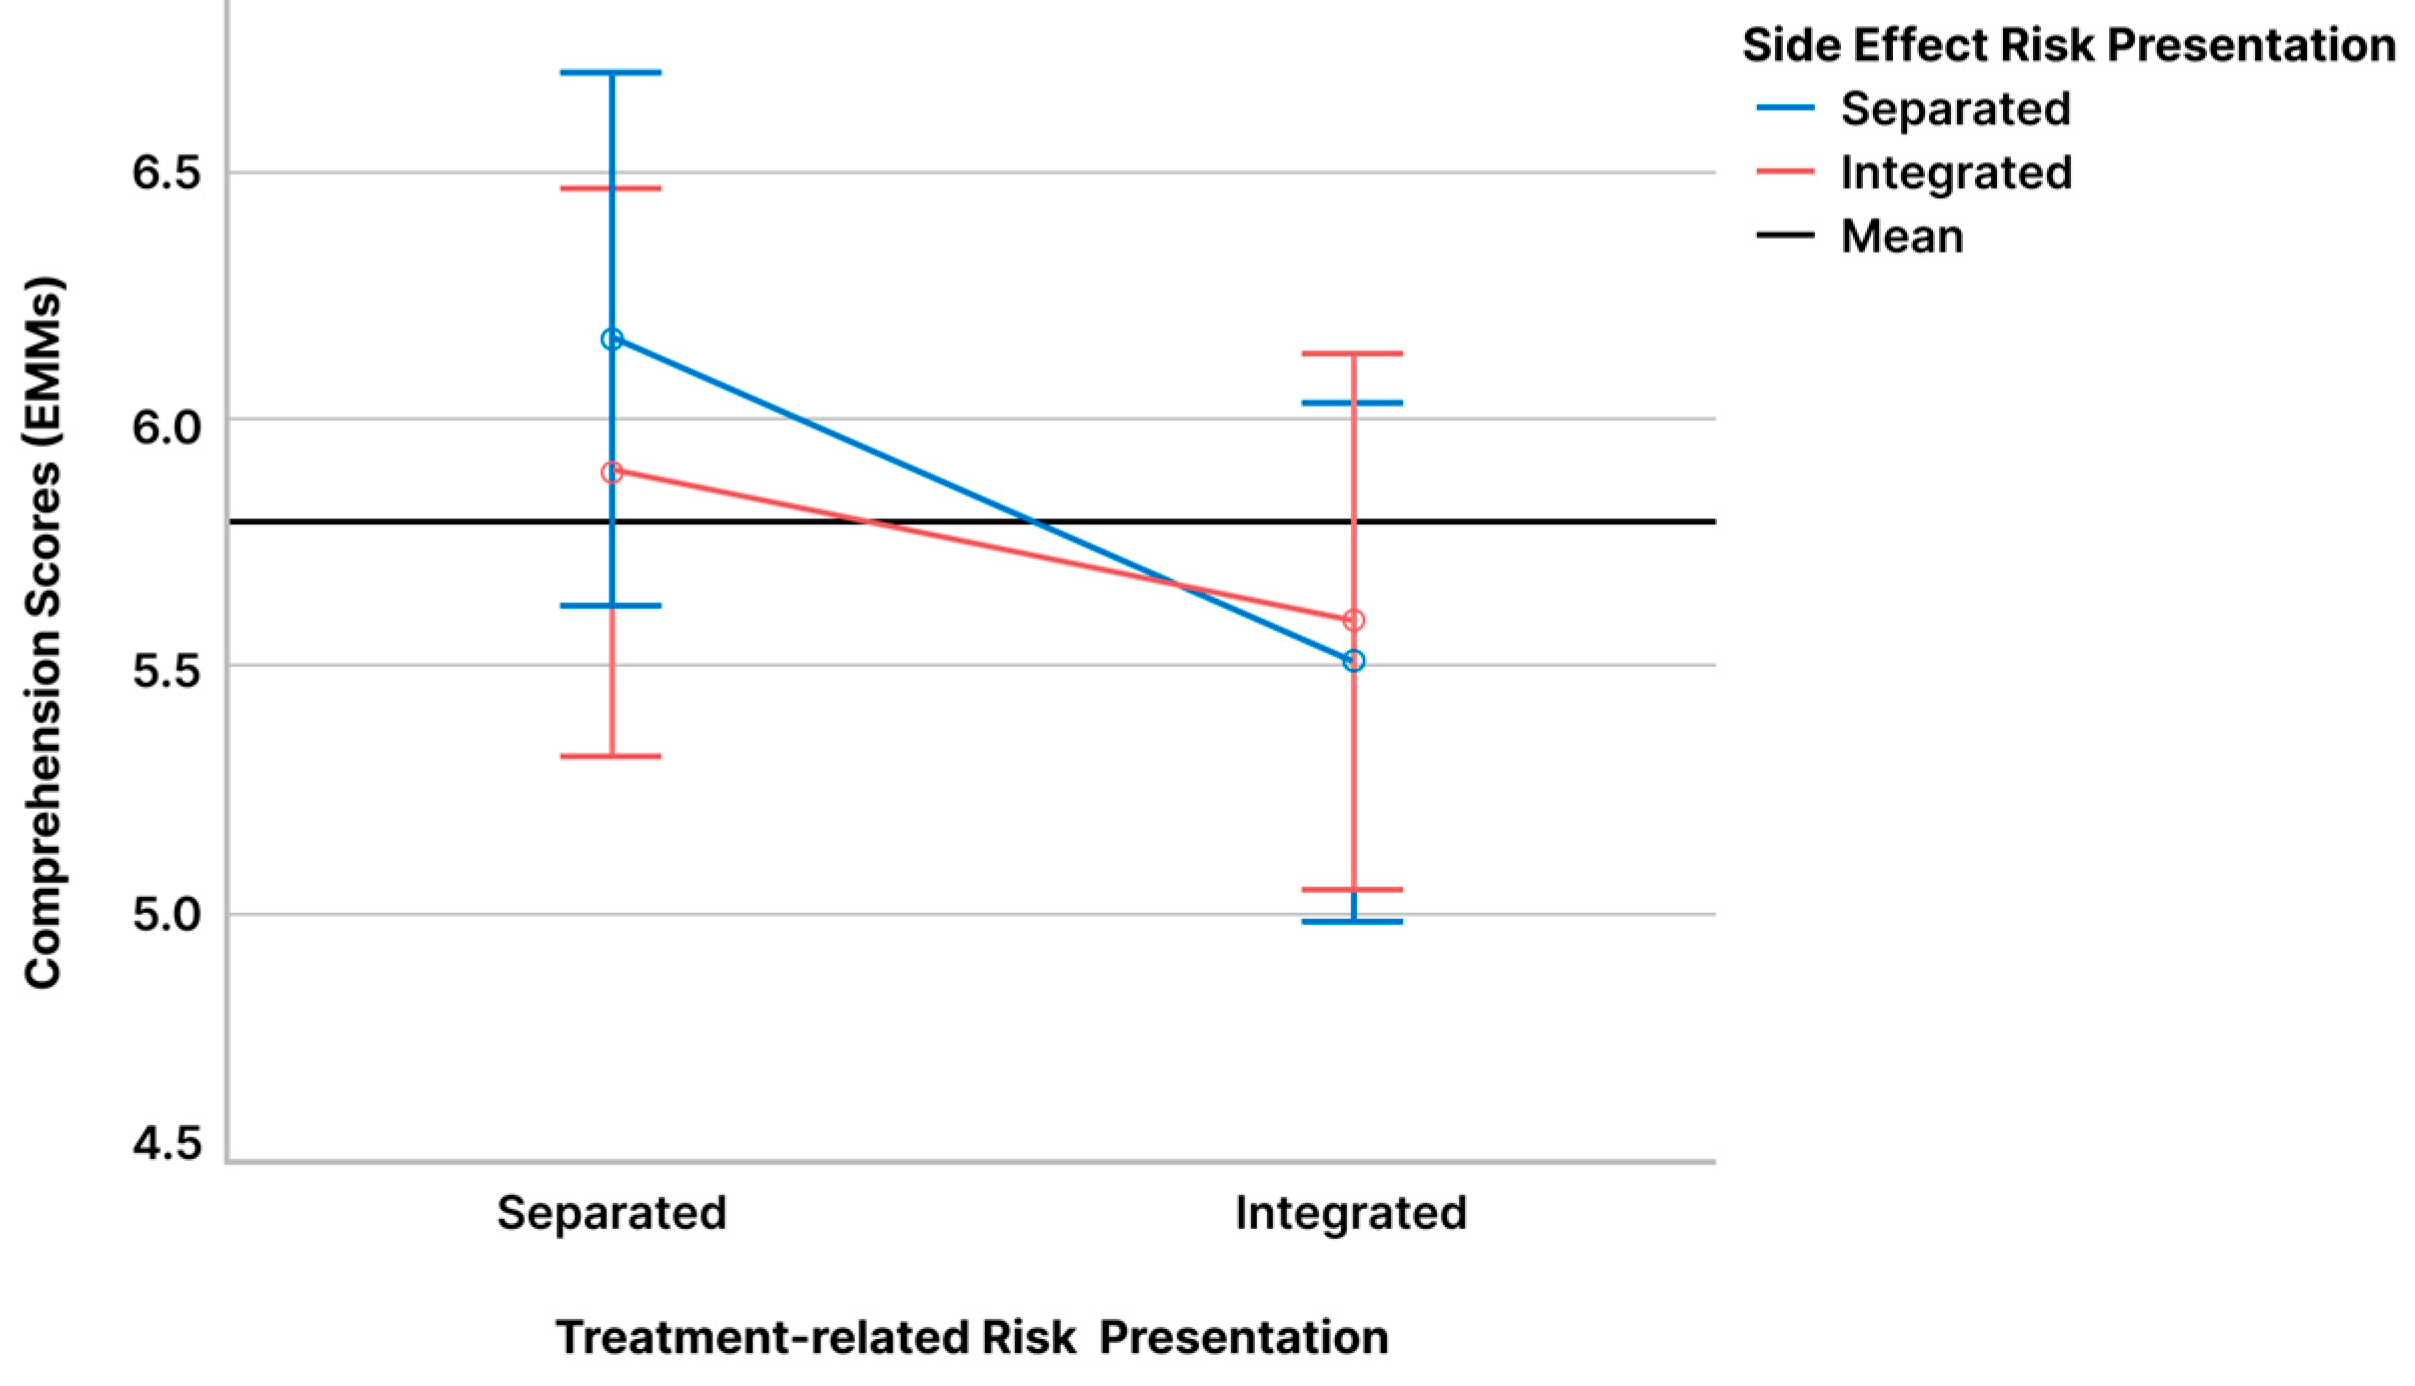
Estimated marginal means (EMMs) showed that comprehension was highest when both treatment-related risk and side effect risk were presented in a separated format (Condition 1: EMM = 6.165), followed by Condition 2 (EMM = 5.893), Condition 4 (EMM = 5.587), and Condition 3 (EMM = 5.504). Pairwise comparisons using Bonferroni adjustment revealed that Condition 1 significantly outperformed both Condition 3 (p = 0.005) and Condition 4 (p = 0.009). Other comparisons were not statistically significant. Table 6 and Table 7 report these results, while Figure 4 presents the adjusted estimated marginal means of comprehension scores across layout conditions.
Overall, these results underscore the importance of numeracy and graph literacy in shaping users’ comprehension of risk information. Moreover, separating treatment and side effect risks in visual displays may offer consistent comprehension benefits across individuals with varying cognitive profiles.

3.4. Preferences for Visual Layouts

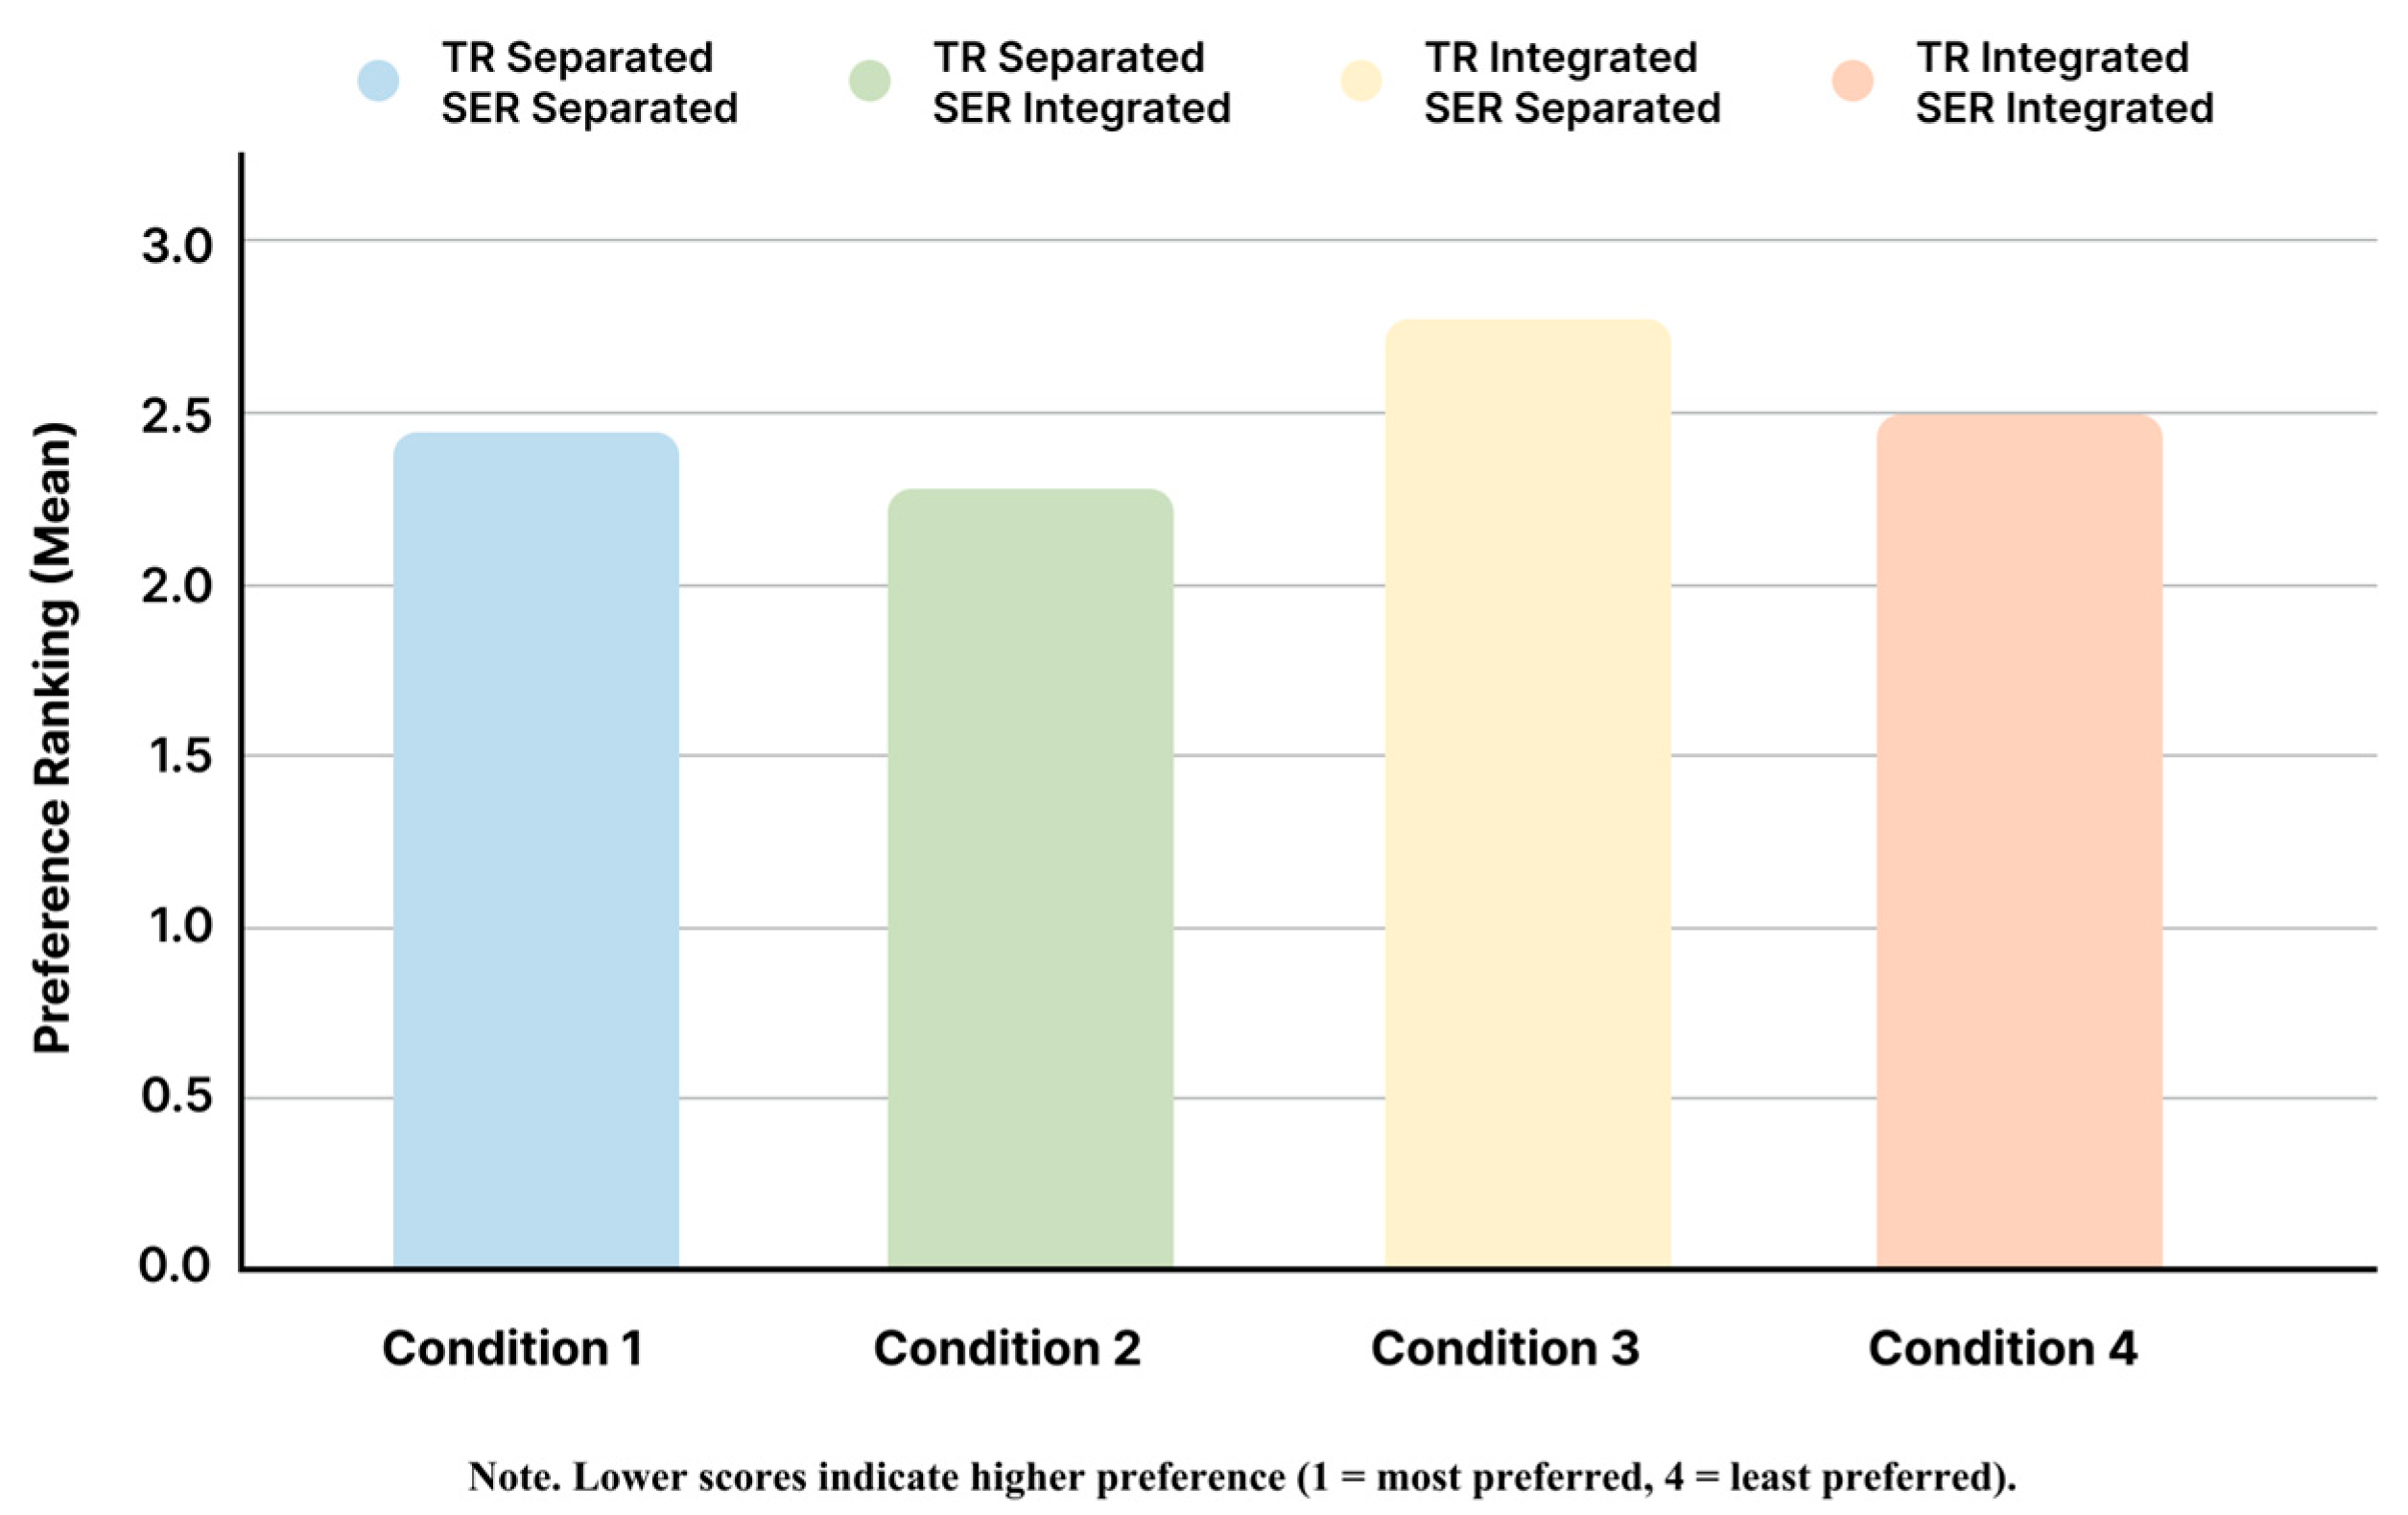
To evaluate participants’ subjective preferences regarding different visual presentation formats, respondents were asked to rank the four layout conditions—combinations of treatment-related risk and side effect risk presentation formats—on a scale from 1 (most preferred) to 4 (least preferred). A Friedman test showed a significant difference in rankings, χ2(3) = 8.931, p = 0.030.
Descriptive statistics revealed that the layout combining Treatment Separated + Side Effect Integrated was most preferred (Mean Rank = 2.28), followed by Treatment Separated + Side Effect Separated (2.45), Treatment Integrated + Side Effect Integrated (2.50), and Treatment Integrated + Side Effect Separated (2.77), which received the lowest preference ranking. Figure 5 depicts the mean preference rankings for each layout condition.
Post hoc pairwise comparisons using (Wilcoxon signed-rank tests with Bonferroni adjustment) showed that the Treatment Separated + Side Effect Integrated layout was significantly more preferred than the Treatment Integrated + Side Effect Separated layout (p = 0.036). No other pairwise differences reached statistical significance. Table 8 provides the post hoc pairwise comparisons of visual layout preferences.
These results suggest a potential mismatch between subjective preferences and objective comprehension. Although participants most favored layouts with visually integrated side effect risk, comprehension was higher when both treatment-related risk and side effect risk were presented in separated formats. This preference–performance gap underscores the importance of balancing user preferences with cognitive effectiveness when designing risk communication interfaces, particularly in patient decision aids.

4. Discussion

This study, in line with our first hypothesis, found that presenting treatment-related risk information using separated icon arrays significantly enhanced comprehension compared to integrated formats. This result supports the view that disaggregated visual formats can reduce cognitive load and facilitate information processing, particularly in contexts where users must simultaneously comprehend both treatment efficacy and side effects.
Our findings also extend prior research on outcome-specific icon array design by providing empirical support for single-outcome formats. Consistent with earlier studies, we observed that multi-outcome icon arrays tend to impair initial comprehension [16,17]. Although interface training or repeated exposure may mitigate this effect [20], separating each risk outcome remains a cognitively more accessible strategy for most users. Notably, this study is the first to simultaneously manipulate (1) the temporal structure of treatment-related risk and (2) the categorical grouping of side effect risks—two layout strategies that have rarely been examined in tandem. For example, McDowell explored multiple outcomes without time comparison [16]; Tiede focused on placebo versus treatment differences without addressing multiple side effects [20]; and Wallace included multiple time points and outcomes but did not employ a layout that separately visualized how a single risk changed over time [17]. Our study fills this empirical gap by offering insight into how to maintain both informational clarity and space efficiency when presenting evolving risks in decision-making scenarios that require weighing treatment benefits against potential harms. These findings offer valuable guidance for clinical decision support design.
Regarding our second hypothesis, the analysis revealed that individual cognitive abilities—particularly numeracy and graph literacy—were significant predictors of risk comprehension. A significant interaction between treatment-related risk layout and numeracy, indicating that the effectiveness of visual formats varied depending on users’ numeracy skill. Specifically, individuals with lower numeracy showed significantly higher comprehension when treatment-related risks were presented in a separated format compared to an integrated format. This aligns with recent research identifying numeracy as a key moderating factor in decision quality within complex health environments [8,21]. In contrast, health literacy was neither a significant predictor nor a moderator in our model. This may be due to the distinction between general and task-specific cognitive skills. Health literacy refers to the ability to access, understand, appraise, and apply health information for decisions in healthcare, disease prevention, and health promotion [32]. In this study, health literacy was assessed using the 3-item screener, which primarily captures self-reported confidence in reading medical materials and navigating healthcare contexts. Our experiment, however, required participants to interpret probabilistic information displayed in icon arrays, a task more directly dependent on numeracy and graph literacy. While health literacy is crucial in real-world healthcare, its influence may be less evident in controlled tasks focused on extracting statistical meaning from visual displays. This interpretation aligns with prior studies showing that numeracy and graph literacy are stronger predictors of risk comprehension [8,22].
Another important finding was the discrepancy between users’ subjective layout preferences and their actual comprehension. Although participants most preferred a hybrid format—where treatment-related risks were separated and side effect risk were integrated—the fully separated format yielded the highest comprehension scores. This preference–performance gap aligns with the findings of Nielsen, underscoring the ongoing challenge of striking a balance between user experience and cognitive effectiveness in interface design [33]. This result is also consistent with prior research showing that people’s preferences for visual aids often do not correspond to improved comprehension. Garcia-Retamero and Cokely reported that in most studies, formats enhancing objective accuracy were not always preferred, with this gap being particularly pronounced among individuals with lower numeracy and graph literacy [8]. Similar discrepancies have been documented in other risk communication contexts, where designs favored by users did not necessarily improve comprehension [34,35,36]. Taken together, these findings highlight the importance of prioritizing comprehension accuracy over both layout space efficiency and user preference when designing patient decision aids. From a clinical perspective, treatment-related risks should be presented in separated layouts to maximize comprehension, even when compact or visually appealing formats are preferred. In contrast, side effect risks showed no significant differences between separated and integrated formats and may therefore be integrated with greater flexibility when space is constrained. This consideration is especially relevant for patients with lower numeracy in clinical decision-making. One possible explanation is that when users are able to comprehend the information, they may favor layouts that simplify spatial organization (e.g., integrated formats). Future qualitative research could provide deeper insights into these preference patterns.
Despite the empirical contributions of this study, several limitations should be acknowledged. First, our sample was recruited online and may not fully represent clinical populations, particularly older adults or individuals with lower levels of digital literacy, or those from diverse educational and cultural backgrounds. Second, the use of hypothetical treatment scenarios and simulated icon arrays may not fully reflect the emotional salience or practical constraints inherent in real-world medical decision-making contexts. Third, although this study focused on the structural manipulation of presentation formats, other important design variables—such as labeling frameworks, grouping strategies, or icon spacing—were held constant and not assessed for potential interaction effects. Furthermore, while we examined numeracy, graph literacy, and health literacy, other cognitive abilities such as memory or attentional control may also influence risk comprehension and were not included. Future research should systematically examine how these elements may amplify or attenuate the observed effects and consider how physical or digital space constraints—such as those encountered on mobile devices or in printed materials—affect the trade-off between information clarity and space efficiency. Moreover, longitudinal and clinical validation studies will be essential to evaluate whether the benefits of separated layouts persist over time, particularly in repeated decision-making contexts and real-world clinical practice.

5. Conclusions

This study demonstrates that separating treatment-related risks into distinct icon arrays enhances users’ comprehension of medical information, particularly among individuals with lower numeracy. While graph literacy and numeracy significantly predicted understanding, general health literacy did not, highlighting the importance of task-specific cognitive skills in visual risk communication.
A critical preference–performance gap was also observed: although participants favored hybrid layouts, comprehension was highest with fully separated formats. These findings indicate that, in designing patient decision aids, comprehension accuracy must take precedence over layout compactness and user preference, with separated layouts recommended for treatment-related risks and greater flexibility allowed for side effect risk when space is limited.

Supplementary Materials

The following supporting information can be downloaded at: https://www.mdpi.com/article/10.3390/informatics12040105/s1, Table S1. Question Type of the Questionnaire; Table S2. Full Question Set for Online Comprehension Test.

Author Contributions

L.-J.W. authored the main manuscript text, and M.-C.Z. provided supervision. All authors have read and agreed to the published version of the manuscript.

Funding

This research received no external funding.

Data Availability Statement

Data is unavailable due to ethical restrictions.

Acknowledgments

The authors wish to thank for Yi-Jen Wang for insightful comments that greatly improved the manuscript.

Conflicts of Interest

The authors declare that they have no known competing financial interest or personal relationships that could have appeared to influence the work reported in this paper.

Abbreviations

The following abbreviations are used in this manuscript:
SDMShared Decision Making
PDAsPatient Decision Aids
BNTBerlin Numeracy Test
TRTreatment-Related Risk
SERSide Effect Risk

References

  1. Stacey, D.; Volk, R.J. The International Patient Decision Aid Standards (IPDAS) Collaboration: Evidence Update 2.0. Med. Decis. Mak. 2021, 41, 729–733. [Google Scholar] [CrossRef]
  2. Morgan, D.J.; Scherer, L.D.; Korenstein, D. Improving Physician Communication About Treatment Decisions. JAMA 2020, 324, 937–938. [Google Scholar] [CrossRef]
  3. Elwyn, G.; Durand, M.A.; Song, J.; Aarts, J.; Barr, P.J.; Berger, Z.; Cochran, N.; Frosch, D.; Galasiński, D.; Gulbrandsen, P.; et al. A three-talk model for shared decision making: Multistage consultation process. BMJ 2017, 359, j4891. [Google Scholar] [CrossRef] [PubMed]
  4. Hanson, J.L. Shared decision making: Have we missed the obvious? Arch. Intern. Med. 2008, 168, 1368–1370. [Google Scholar] [CrossRef]
  5. Hawley, S.T.; Zikmund-Fisher, B.; Ubel, P.; Jancovic, A.; Lucas, T.; Fagerlin, A. The impact of the format of graphical presentation on health-related knowledge and treatment choices. Patient Educ. Couns. 2008, 73, 448–455. [Google Scholar] [CrossRef]
  6. Richter, R.; Jansen, J.; Bongaerts, I.; Damman, O.; Rademakers, J.; Van Der Weijden, T. Communication of benefits and harms in shared decision making with patients with limited health literacy: A systematic review of risk communication strategies. Patient Educ. Couns. 2023, 116, 107944. [Google Scholar] [CrossRef]
  7. Gigerenzer, G.; Hoffrage, U. How to improve Bayesian reasoning without instruction: Frequency formats. Psychol. Rev. 1995, 102, 684–704. [Google Scholar] [CrossRef]
  8. Garcia-Retamero, R.; Cokely, E.T. Designing Visual Aids That Promote Risk Literacy: A Systematic Review of Health Research and Evidence-Based Design Heuristics. Hum. Factors 2017, 59, 582–627. [Google Scholar] [CrossRef] [PubMed]
  9. Galesic, M.; Garcia-Retamero, R.; Gigerenzer, G. Using icon arrays to communicate medical risks: Overcoming low numeracy. Health Psychol. 2009, 28, 210. [Google Scholar] [CrossRef]
  10. Garcia-Retamero, R.; Galesic, M. Who proficts from visual aids: Overcoming challenges in people’s understanding of risks. Soc. Sci. Med. 2010, 70, 1019–1025. [Google Scholar] [CrossRef]
  11. Tait, A.R.; Voepel-Lewis, T.; Zikmund-Fisher, B.J.; Fagerlin, A. Presenting Research Risks and Benefits to Parents. Anesth. Analg. 2010, 111, 718–723. [Google Scholar] [CrossRef]
  12. Trevena, L.J.; Bonner, C.; Okan, Y.; Peters, E.; Gaissmaier, W.; Han, P.K.J.; Ozanne, E.; Timmermans, D.; Zikmund-Fisher, B.J. Current Challenges When Using Numbers in Patient Decision Aids: Advanced Concepts. Med. Decis. Mak. 2021, 41, 834–847. [Google Scholar] [CrossRef]
  13. O’Neill, E.S.; Grande, S.W.; Sherman, A.; Elwyn, G.; Coylewright, M. Availability of patient decision aids for stroke prevention in atrial fibrillation: A systematic review. Am. Heart J. 2017, 191, 1–11. [Google Scholar] [CrossRef] [PubMed]
  14. Zikmund-Fisher, B.J.; Ubel, P.A.; Smith, D.M.; Derry, H.A.; McClure, J.B.; Stark, A.; Pitsch, R.K.; Fagerlin, A. Communicating side effect risks in a tamoxifen prophylaxis decision aid: The debiasing influence of pictographs. Patient Educ. Couns. 2008, 73, 209–214. [Google Scholar] [CrossRef] [PubMed]
  15. Zikmund-Fisher, B.J.; Fagerlin, A.; Roberts, T.R.; Derry, H.A.; Ubel, P.A. Alternate Methods of Framing Information About Medication Side Effects: Incremental Risk Versus Total Risk of Occurrence. J. Health Commun. 2008, 13, 107–124. [Google Scholar] [CrossRef]
  16. McDowell, M.; Gigerenzer, G.; Wegwarth, O.; Rebitschek, F.G. Effect of Tabular and Icon Fact Box Formats on Comprehension of Benefits and Harms of Prostate Cancer Screening: A Randomized Trial. Med. Decis. Mak. 2019, 39, 41–56. [Google Scholar] [CrossRef]
  17. Wallace, M.J.; Weissler, E.H.; Yang, J.-C.; Brotzman, L.; Corriere, M.A.; Secemsky, E.A.; Sutphin, J.; Johnson, F.R.; Marcos Gonzalez, J.; Tarver, M.E.; et al. Using Separate Single-Outcome Risk Presentations Instead of Integrated Multioutcome Formats Improves Comprehension in Discrete Choice Experiments. Med. Decis. Mak. 2024, 44, 649–660. [Google Scholar] [CrossRef]
  18. Zikmund-Fisher, B.J.; Fagerlin, A.; Ubel, P.A. Improving understanding of adjuvant therapy options by using simpler risk graphics. Cancer 2008, 113, 3382–3390. [Google Scholar] [CrossRef] [PubMed]
  19. Zikmund-Fisher, B.J.; Fagerlin, A.; Ubel, P.A. A Demonstration of ‘Less Can Be More’ in Risk Graphics. Med. Decis. Mak. 2010, 30, 661–671. [Google Scholar] [CrossRef] [PubMed]
  20. Tiede, K.E.; Ripke, F.; Degen, N.; Gaissmaier, W. When Does the Incremental Risk Format Aid Informed Medical Decisions? The Role of Learning, Feedback, and Number of Treatment Options. Med. Decis. Mak. 2020, 40, 212–221. [Google Scholar] [CrossRef]
  21. Congelosi, P.D.; Carroll, M.C.; Wong, S.L. Numeracy levels influence shared decision-making and surgical outcomes: A scoping review of the literature. Am. J. Surg. 2023, 225, 967–974. [Google Scholar] [CrossRef]
  22. Okan, Y.; Garcia-Retamero, R.; Cokely, E.T.; Maldonado, A. Individual Differences in Graph Literacy: Overcoming Denominator Neglect in Risk Comprehension. J. Behav. Decis. Mak. 2012, 25, 390–401. [Google Scholar] [CrossRef]
  23. Barrouillet, P.; Camos, V. Developmental Increase in Working Memory Span: Resource Sharing or Temporal Decay? J. Mem. Lang. 2001, 45, 1–20. [Google Scholar] [CrossRef]
  24. Barrouillet, P.; Bernardin, S.; Camos, V. Time Constraints and Resource Sharing in Adults’ Working Memory Spans. J. Exp. Psychol. Gen. 2004, 133, 83–100. [Google Scholar] [CrossRef]
  25. Zikmund-Fisher, B.J.; Witteman, H.O.; Dickson, M.; Fuhrel-Forbis, A.; Kahn, V.C.; Exe, N.L.; Valerio, M.; Holtzman, L.G.; Scherer, L.D.; Fagerlin, A. Blocks, ovals, or people? Icon type affects risk perceptions and recall of pictographs. Med. Decis. Mak. 2014, 34, 443–453. [Google Scholar] [CrossRef]
  26. Zikmund-Fisher, B.J.; Witteman, H.O.; Fuhrel-Forbis, A.; Exe, N.L.; Kahn, V.C.; Dickson, M. Animated graphics for comparing two risks: A cautionary tale. J. Med. Internet Res. 2012, 14, e106. [Google Scholar] [CrossRef]
  27. Price, M.; Cameron, R.; Butow, P. Communicating risk information: The influence of graphical display format on quantitative information perception—Accuracy, comprehension and preferences. Patient Educ. Couns. 2007, 69, 121–128. [Google Scholar] [CrossRef]
  28. Trevena, L.J.; Zikmund-Fisher, B.J.; Edwards, A.; Gaissmaier, W.; Galesic, M.; Han, P.K.; King, J.; Lawson, M.L.; Linder, S.K.; Lipkus, I.; et al. Presenting quantitative information about decision outcomes: A risk communication primer for patient decision aid developers. BMC Med. Inf. Decis. Mak. 2013, 13 (Suppl. 2), S7. [Google Scholar] [CrossRef]
  29. Chew, L.D.; Griffin, J.M.; Partin, M.R.; Noorbaloochi, S.; Grill, J.P.; Snyder, A.; Bradley, K.A.; Nugent, S.M.; Baines, A.D.; Vanryn, M. Validation of Screening Questions for Limited Health Literacy in a Large VA Outpatient Population. J. Gen. Intern. Med. 2008, 23, 561–566. [Google Scholar] [CrossRef] [PubMed]
  30. Okan, Y.; Janssen, E.; Galesic, M.; Waters, E.A. Using the Short Graph Literacy Scale to Predict Precursors of Health Behavior Change. Med. Decis. Mak. 2019, 39, 183–195. [Google Scholar] [CrossRef]
  31. Cokely, E.T.; Galesic, M.; Schulz, E.; Ghazal, S.; Garcia-Retamero, R. Measuring Risk Literacy: The Berlin Numeracy Test. Judgm. Decis. Mak. 2012, 7, 25–47. [Google Scholar] [CrossRef]
  32. Sørensen, K.; Van den Broucke, S.; Fullam, J.; Doyle, G.; Pelikan, J.; Slonska, Z.; Brand, H. Health literacy and public health: A systematic review and integration of definitions and models. BMC Public Health 2012, 12, 80. [Google Scholar] [CrossRef] [PubMed]
  33. Nielsen, J. User Satisfaction vs. Performance Metrics. 2012. Available online: https://www.nngroup.com/articles/satisfaction-vs-performance-metrics/ (accessed on 20 March 2025).
  34. McCaffery, K.J.; Dixon, A.; Hayen, A.; Jansen, J.; Smith, S.; Simpson, J.M. The Influence of Graphic Display Format on the Interpretations of Quantitative Risk Information among Adults with Lower Education and Literacy. Med. Decis. Mak. 2012, 32, 532–544. [Google Scholar] [CrossRef]
  35. Micallef, L.; Dragicevic, P.; Fekete, J.-D. Assessing the Effect of Visualizations on Bayesian Reasoning through Crowdsourcing. IEEE Trans. Vis. Comput. Graph. 2012, 18, 2536–2545. [Google Scholar] [CrossRef]
  36. Feldman-Stewart, D.; Kocovski, N.; McConnell, B.A.; Brundage, M.D.; Mackillop, W.J. Perception of Quantitative Information for Treatment Decisions. Med. Decis. Mak. 2000, 20, 228–238. [Google Scholar] [CrossRef] [PubMed]
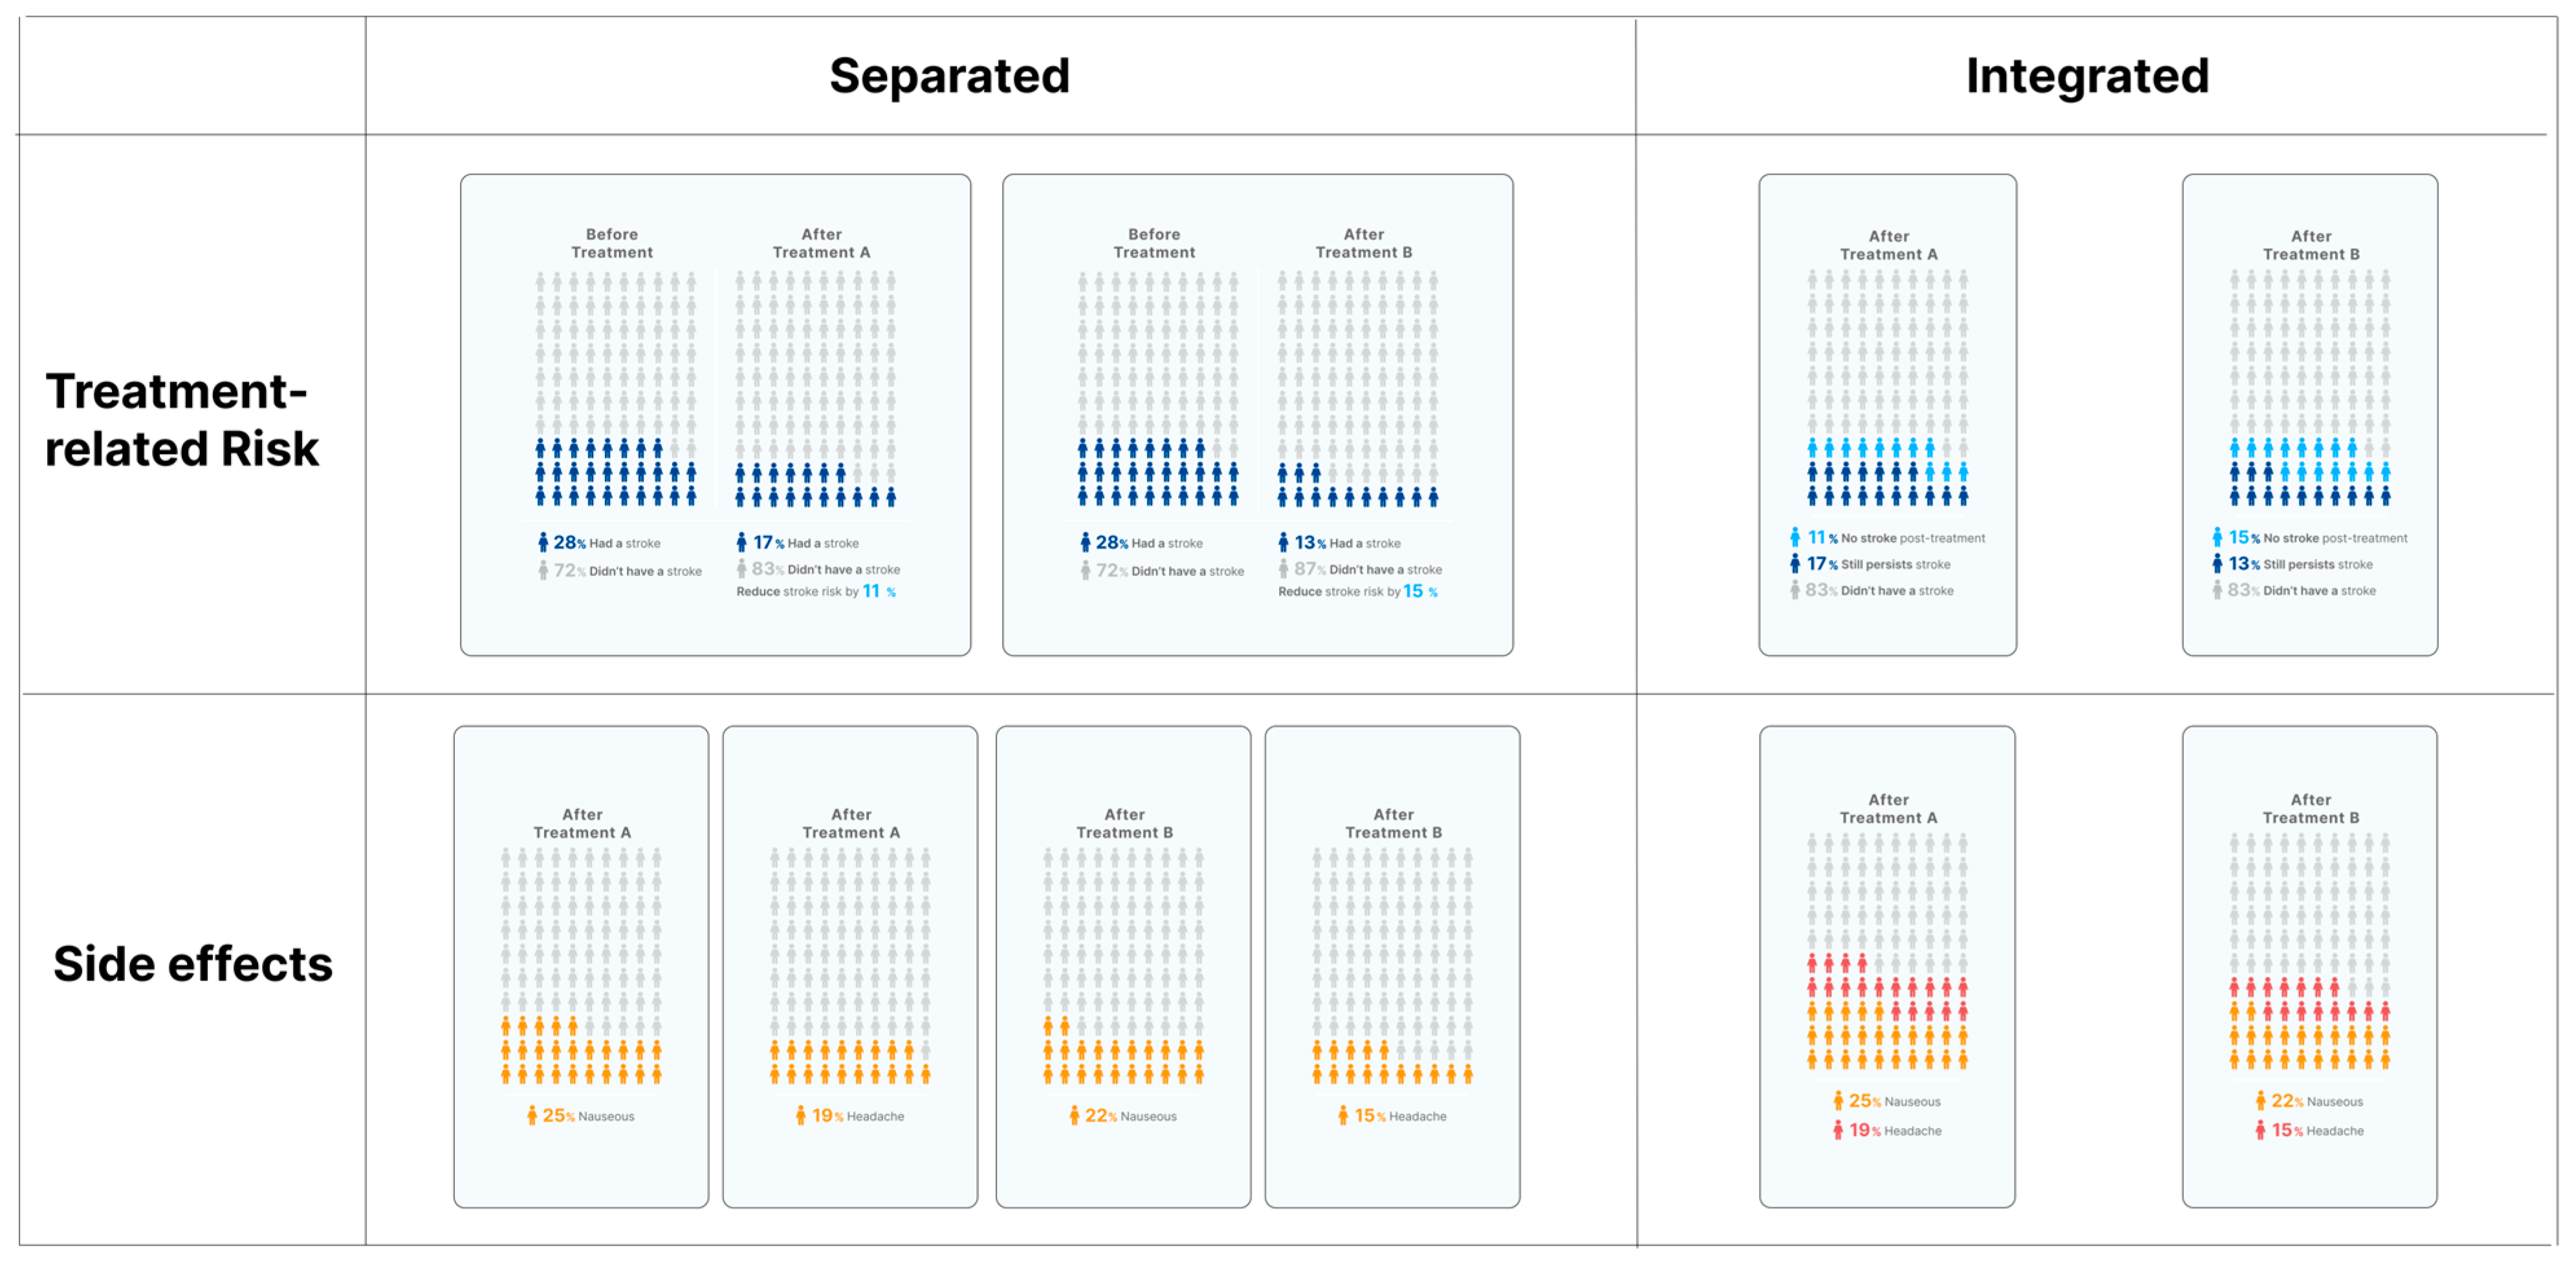
Figure 1. Experimental conditions for treatment-related risk and side effect risk presentation. Condition 1 = Treatment Separated + Side Effect Separated; Condition 2 = Treatment Separated + Side Effect Integrated; Condition 3 = Treatment Integrated + Side Effect Separated; Condition 4 = Treatment Integrated + Side Effect Integrated.
Informatics 12 00105 g001
Figure 2. Mean Comprehension Scores for Each Treatment-related Risk (TR) × Side Effect Risk (SER) Layout Combination.
Informatics 12 00105 g002
Figure 3. Interaction between Treatment-related Risk Presentation and Numeracy on Comprehension.
Informatics 12 00105 g003
Figure 4. Estimated Marginal Means of Comprehension Scores by Layout Condition with Covariate Adjustment.
Informatics 12 00105 g004
Figure 5. Mean Preference Rankings for Each Treatment-Related Risk (TR) × Side Effect Risk (SER) Layout Condition (N = 121).
Informatics 12 00105 g005
Table 1. Participants’ Demographic Characteristics and Cognitive Measures (N = 121).
VariableCategory/RangeMean (SD)n (%)
GenderMale52 (43.0%)
Female69 (57.0%)
Age22–65 years36.64 (8.03)
EducationHigh school25 (20.7%)
University84 (69.4%)
Graduate or above12 (9.9%)
Health Literacy3–1510.42 (1.80)
Graph Literacy0–41.55 (1.19)
Numeracy (BNT)0–31.71 (1.14)
Table 2. Mean Comprehension Scores by Main Effect Levels.
Layout FactorPresentation TypeMean (M)Standard
Deviation (SD)
Treatment-Related Risk PresentationSeparated6.033.23
Integrated5.553.15
Side Effect Risk PresentationSeparated5.833.09
Integrated5.743.28
Note: These values reflect collapsed means across conditions for each layout factor.
Table 3. Results of 2 × 2 Repeated Measures ANOVA on Comprehension Scores.
EffectFdfpPartial η2
Treatment-Related Risk Presentation12.4561, 120<0.0010.094
Side Effect Risk Presentation0.5361, 1200.4650.004
Treatment × Side Effect Interaction1.7171, 1200.1930.014
Table 4. General Linear Model Results for Comprehension Scores with Cognitive Covariates and Interaction Terms.
SourceFdfp-ValuePartial η2
Within-Subjects Effects
Treatment-related risk Format1.38110.2420.012
Side Effect risk Format0.22610.6350.002
Treatment × Side Effect1.65010.2010.014
Between-Subjects (Covariates)
Health Literacy0.38010.5400.003
Graph Literacy14.8701<0.0010.113
Numeracy (BNT)6.29010.0140.051
Interactions (Moderation Effects)
Treatment × Health Literacy0.21410.6440.002
Treatment × Graph Literacy3.37810.0690.028
Treatment × Numeracy (BNT)7.11910.0090.057
Side Effect × Health Literacy0.00810.929<0.001
Side Effect × Graph Literacy0.35110.5540.003
Side Effect × Numeracy (BNT)0.22010.6400.002
Treatment × Side Effect × Health Literacy0.86910.3530.007
Treatment × Side Effect × Graph Literacy1.98010.1620.017
Treatment × Side Effect × Numeracy (BNT)0.89810.3450.008
Note: The table reports within-subject effects, between-subject covariate effects, and interaction terms from the GLM predicting comprehension. Indicates marginal significance (p < 0.10). Partial η2 values represent effect size.
Table 5. Effects of Treatment-related Risk Presentation on Comprehension by Numeracy Group.
Numeracy GroupTreatment-Related Risk FormatMean (EMM)SE95% CIp-Value
LowSeparated5.150.415[4.33, 5.97]<0.001
Integrated4.460.396[3.67, 5.24]
HighSeparated6.810.392[6.04, 7.59]0.116
Integrated6.520.374[5.78, 7.26]
Table 6. Estimated Marginal Means of Comprehension by Layout Condition.
ConditionLayout TypeUnadjusted MeanSE95% CIEMM
(Adjusted)
SE95% CI
1Treatment Separated + Side Effect Separated6.170.29[5.61, 6.79]6.170.28[5.62, 6.71]
2Treatment Separated + Side Effect Integrated5.890.31[5.33, 6.55]5.890.29[5.31, 6.47]
3Treatment Integrated + Side Effect Separated5.500.30[4.96, 6.16]5.500.27[4.97, 6.04]
4Treatment Integrated + Side Effect Integrated5.590.30[5.00, 6.26]5.590.28[5.04, 6.13]
Covariates held constant at the following values: Health Literacy = 10.42; Numeracy = 1.71; Graph Literacy = 1.55.
Table 7. Pairwise Comparisons Between Layout Conditions (Bonferroni-Adjusted).
Condition (I)Condition (J)Mean Difference (I–J)SEp-Value95% CI
120.2730.1950.987[−0.251, 0.796]
130.6610.1910.005[0.148, 1.174]
140.5790.1780.009[0.101, 1.056]
230.3880.1960.301[−0.138, 0.915]
240.3060.1900.661[−0.204, 0.816]
340.0830.1821.000[−0.405, 0.570]
Note. Conditions represent combinations of treatment-related risk and side effect risk presentation formats.
Table 8. Post Hoc Pairwise Comparisons of Visual Layout Preferences (Wilcoxon Signed-Rank Tests with Bonferroni Correction, N = 121).
Condition (I)Condition (J)Z StatisticAsymptotic Sig.
(2-Tailed)
Adjusted p-Value
(Bonferroni)
12−1.0080.3131.0
13−2.1050.0350.21
14−0.9240.3561.0
23−2.7330.0060.036
24−0.6120.5411.0
34−2.0280.0430.258
Disclaimer/Publisher’s Note: The statements, opinions and data contained in all publications are solely those of the individual author(s) and contributor(s) and not of MDPI and/or the editor(s). MDPI and/or the editor(s) disclaim responsibility for any injury to people or property resulting from any ideas, methods, instructions or products referred to in the content.