Abstract
To address the high false alarm rate of intrusion detection systems based on distributed acoustic sensing (DAS) for power cables in complex underground environments, an innovative GRT-Transformer multimodal deep learning model is proposed. The core of this model lies in its distinctive three-branch parallel collaborative architecture: two branches employ Gramian Angular Summation Field (GASF) and Recursive Pattern (RP) algorithms to convert one-dimensional intrusion waveforms into two-dimensional images, thereby capturing rich spatial patterns and dynamic characteristics and the third branch utilizes a Gated Recurrent Unit (GRU) algorithm to directly focus on the temporal evolution features of the waveform; additionally, a Transformer component is integrated to capture the overall trend and global dependencies of the signals. Ultimately, the terminal employs a Bidirectional Long Short-Term Memory (BiLSTM) network to perform a deep fusion of the multidimensional features extracted from the three branches, enabling a comprehensive understanding of the bidirectional temporal dependencies within the data. Experimental validation demonstrates that the GRT-Transformer achieves an average recognition accuracy of 97.3% across three typical intrusion events—illegal tapping, mechanical operations, and vehicle passage—significantly reducing false alarms, surpassing traditional methods, and exhibiting strong practical potential in complex real-world scenarios.
1. Introduction
Distributed optical fiber sensing technology, a novel sensing modality, has demonstrated significant application prospects and development potential both domestically and internationally in recent years. Phase-sensitive optical time-domain reflectometry (Φ-OTDR), based on Rayleigh scattering principles, utilizes narrow linewidth lasers as light sources to inject highly coherent optical pulse signals into the sensing fiber. This configuration provides superior detection sensitivity compared to other distributed optical fiber sensing technologies, making it widely applicable in long-distance monitoring and high-precision measurement within complex and harsh environments [1,2]. Distributed acoustic sensing (DAS) systems, characterized by high spatial resolution, real-time performance, strong sensitivity, and long sensing distances, are extensively employed in the security monitoring of large-scale infrastructure including underground communication cables, power transmission equipment [3], national border security [4], and the monitoring of natural gas and oil pipelines and heating pipelines [5]. However, the high sensitivity of Φ-OTDR systems leads to a high false alarm rate (NAR) in DAS systems when faced with complex environmental factors and non-intrusive interference, posing challenges in practical applications. One key challenge is the effective identification and differentiation of unpredictable interference signals from genuine threat signals within the optical fiber. Consequently, recent research on Φ-OTDR-based DAS systems has largely focused on improving the accuracy of intrusion event recognition.
Traditional methods for reducing the false alarm rate in DAS intrusion recognition systems often suffer from high algorithmic complexity, insufficient accuracy, and poor real-time performance, making them inadequate for practical engineering requirements. Furthermore, many of these methods perform poorly when processing high-dimensional, non-linear, and multi-modal data. With the rise of deep learning in recent years, pattern recognition techniques have been increasingly applied to intrusion vibration event recognition in DAS systems [6,7,8,9].Wu et al. introduced an unsupervised identification model based on Spiking Neural Networks (SNNs), demonstrating significant advantages in intrusion recognition scenarios with limited DAS samples [10]. This method utilizes the Spike-Timing-Dependent Plasticity (STDP) mechanism for unsupervised learning, exhibiting greater stability compared to mainstream supervised Convolutional Neural Networks (CNNs) when trained with few samples or imbalanced datasets. Lyu et al. proposed a multi-dimensional intrusion recognition scheme based on Gramian Angular Field (GAF) and CNNs [11]. This approach initially transforms one-dimensional time-series intrusion signals acquired by DAS optical fibers into two-dimensional images via the GAF algorithm, capturing deeper data features while preserving the temporal characteristics of the signal. The recognition model then utilizes multi-dimensional features, thereby enhancing accuracy. He et al. presented a two-stage recognition network method for identifying intrusion events in complex environments [9]. Subsequently, He et al. further developed a method combining Feature Pyramid Network (FPN) and Bidirectional Long Short-Term Memory (BiLSTM) networks, achieving favorable results in the accurate identification of third-party threats within underground geological structures [12]. Ref. [13] employed the Gramian Angular Summation Field (GASF) algorithm to encode one-dimensional time-series signals, effectively transforming them into more concentrated two-dimensional image features. A convolutional neural network model, ConvNeXt_tiny, was then applied as a classifier to achieve the effective identification of various disturbances. To stabilize network training, the study utilized a cosine annealing algorithm to control the decay of the learning rate and incorporated transfer learning techniques to further enhance the model’s classification accuracy and convergence speed [13]. Sun et al. introduced a hybrid deep learning network based on Bayesian Optimization (BO), integrating Convolutional Neural Networks (CNNs) and BiLSTM networks for efficient multi-class pattern recognition and classification [14]. Lyu et al. achieved the end-to-end feature extraction and classification of intrusion signals by integrating prototype learning into a multi-scale convolutional neural network. This model not only enhances the recognition rate of known intrusion events but also effectively rejects unknown interference [15]. Huo et al. achieved promising results in identifying six types of intrusion interference signals by employing Empirical Mode Decomposition (EMD) for denoising and an enhanced MSResNet network [16]. Wu et al. analyzed field experimental data and discovered that one-dimensional convolutional neural networks (1D-CNNs) significantly outperformed two-dimensional convolutional neural networks (2D-CNNs) in extracting features from distributed acoustic sensing (DAS) vibration signals. Furthermore, a more comprehensive feature extraction of intrusion signals is achieved by integrating prototype learning with multi-scale convolutional neural network technology. Their team applied this method to the security monitoring of oil and gas pipelines, and the accuracy and real-time performance of their method were more effective than traditional intrusion recognition methods in the identification experiments of five different intrusion events [17]. Sun et al. preprocessed the intrusion recognition time-series signals using time–frequency analysis methods and then performed classification and recognition using an improved deep convolutional neural network [18]. Wu et al. proposed a multi-source separation method, which first used the GDE (Gerschgorin Disk Estimator) algorithm to perform a unsupervised estimation of mixed intrusion interference signals, and then separated statistically independent signal sources to identify intrusion events through a non-linear instantaneous mixing model and improved xSFA (slow feature analysis) technology [19]. To tackle the problem of intense ambient noise severely contaminating the collected signals, which impairs effective feature extraction, Ref. [13] proposed a denoising method that combines Variational Mode Decomposition (VMD) with Genetic Algorithm (GA) optimization and wavelet thresholding. This technique aims to effectively separate the signal from interference noise and improve the Signal-to-Noise Ratio (SNR) [20]. Similarly, Li et al. introduced a signal processing approach that integrates GWO-VMD with an enhanced wavelet threshold, designed to accurately decompose ultrasonic echo signals and suppress noise [21]. Li et al. proposed the Urefiner model, which integrates the advantages of CNN and Transformer models and extracts global features of signals by introducing an attention mechanism. The CNN module, improved by the attention mechanism, can aggregate and strengthen local features, and a DLA (Distributed Local Attention) module and a learnable linear transformation matrix are also introduced to better promote the fusion of local and global information [22]. Inspired by computer vision methodologies, Zhang et al. introduced a modified data augmentation integration (modified-DAI) strategy, leveraging data augmentation ensembles to enhance model generalization across diverse environments [23]. However, most of these deep learning models primarily focus on feature extraction and classification within a single modality, with a limited exploration of multi-modal approaches. Ref. [24] proposed a dual-attention mechanism—comprising cross-modal attention and self-attention—to enhance sentiment classification performance by capturing dynamic inter-modal correlations. On the CMU-MOSI dataset, this approach achieved an 8.3% improvement in accuracy over unimodal (text-only) models, demonstrating the complementary nature of visual and acoustic modalities in disambiguating emotional expressions [24]. Ref. [25] proposed a Multimodal Hybrid Parallel Network (MHPN), which integrates network traffic statistical features (processed via a CNN) with raw load data (extracted through a dual-branch CNN+LSTM to capture spatiotemporal characteristics). This multimodal fusion enables complementary feature representation, and the experimental results demonstrate an average accuracy of 99.98%, significantly outperforming unimodal models [25].
Therefore, this paper proposes a multimodal deep learning model, GRT-Transformer. Prior to inputting data into the model, it undergoes a secondary denoising process using the VMD-SWTTV algorithm. The model leverages the complementary nature of different modality data and incorporates an attention mechanism to effectively extract global features. Through multi-angle feature extraction and fusion, the approach enhances the model’s recognition capabilities in highly complex environments and addresses the issue of elevated false alarm rates in the system. Our contributions are as follows.
- (1)
- We introduce the GRT-Transformer, a novel multi-modal deep learning model integrating Transformer, Gramian Angular Sum Field (GASF), Recurrence Plots (RP), and 1D-2D-GRU, for power cable intrusion detection in distributed acoustic sensing (DAS) systems, effectively mitigating complex environmental interference.
- (2)
- By converting raw one-dimensional time-series data into two-dimensional GASF and RP images, we successfully extract the overall trends and non-linear dynamic properties of the signals, providing a richer feature set for the deep learning model and enhancing its discriminative ability.
- (3)
- This study utilizes BiLSTM to achieve the deep integration of features from different data modalities, forming a comprehensive intrusion detection system that effectively captures bidirectional dependencies in time series, thereby enhancing the model’s ability to process time-series data dependencies.
- (4)
- Leveraging the multi-head self-attention mechanism integrated within the Transformer architecture, the model effectively evaluates and reinforces salient features, thereby significantly enhancing the accuracy of intrusion detection.
2. Distributed Optical Fiber Sensing Principles and Data Acquisition
2.1. Distributed Fiber Optic Sensing Principles
The distributed acoustic sensing (DAS) system is a sophisticated distributed fiber-optic acoustic monitoring system and exhibits exceptional sensitivity in capturing vibrational disturbances indicative of intrusions across diverse and complex scenarios. This system leverages the principles of Φ-OTDR and the spatial differential interference of high-correlation backscattered Rayleigh light for its operation. It facilitates the precise localization of fiber optic impairments, including attenuation, breaks, and bends. The schematic of the Φ-OTDR system is illustrated in Figure 1. The system employs a narrow pulse laser to emit a highly coherent light source. This light undergoes modulation via an acousto-optic modulator (AOM), transforming continuous light into pulsed light, which is subsequently amplified by an erbium-doped fiber amplifier (EDFA). The amplified signal is then injected into two ports of a circulator within the sensing cable. Rayleigh scattering occurs within the fiber, and the backscattered light is received by the circulator. External intrusion events induce vibrations in the sensing cable, leading to localized changes in refractive stress. Consequently, the backscattered light undergoes interference, resulting in corresponding intensity variations. The detector captures the Rayleigh backscattered light reflected from various points along the fiber, extracting the disturbance signals to accurately pinpoint intrusion events, thereby enabling the detailed monitoring of phase variations in power cables [10].
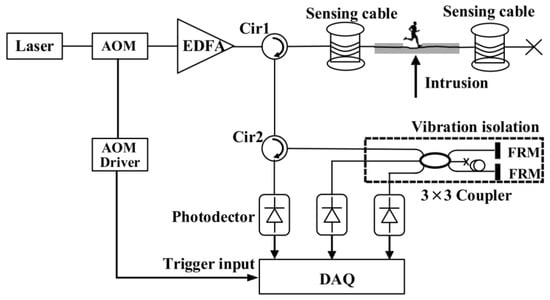
Figure 1.
φ-OTDR sensing principle.
2.2. Data Acquisition
With the active assistance of personnel from Chengdu Shengting Technology Co., Ltd. (Chengdu, China), we conducted on-site experiments in Chengdu, Sichuan Province, China, from October to November 2024. An optical fiber was embedded approximately one meter underground within a 48-core pipeline communication cable used as a sensing fiber. The DAS monitoring system equipment was located in Sandaojian Baiyun Village, Pidu District, Chengdu, where three types of event data were collected and artificially simulated. The total length of the monitoring fiber was 33 km, with the test site approximately 6.6 km from the installation point. On-site data collection records are shown in Figure 2a–c (The picture was taken at the construction site), with the DAS device used for data acquisition depicted in Figure 2d. The resulting DAS intrusion detection waveform is presented in Figure 2e. The weather during the field tests was mild, with no heavy rain, ensuring normal operation across all scenarios.
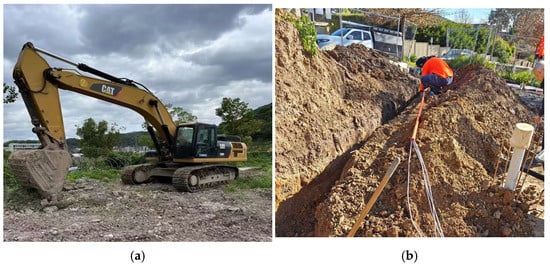
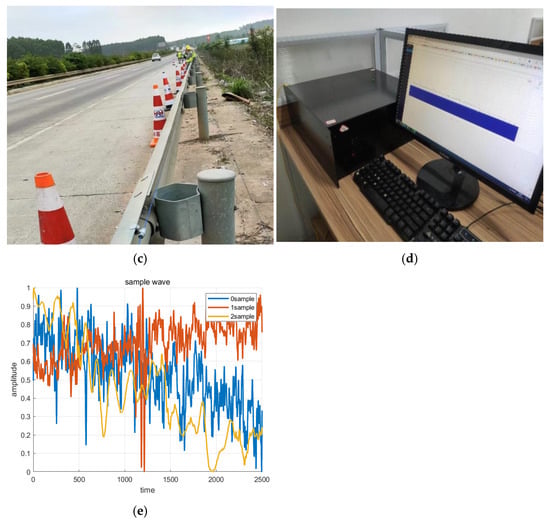
Figure 2.
(a) Mechanical operation data acquisition; (b) illegal hammering excavation data collection; (c) vehicle passage data collection; (d) DAS monitoring equipment; (e) waveforms of the three data categories.
Task one involved a 120 kW, two-ton excavator performing excavation activities at various radial distances, generating a dataset of mechanical operation scenarios. Task two simulated illegal hammering excavation through manual excavation and impact at different radial distances, with the bucket striking the ground at distances of 0, 1, 2, 3, …, up to 15 m, including measurements at 2, 4, 6, 8, 10, 12, and 14 m, which were pre-measured and marked with red lines. Vehicle passage was primarily recorded by capturing four seconds of data as vehicles passed nearby. The DAS monitoring system sampled data at a frequency of 1 kHz, with each intrusion signal comprising 2500 sampling points at an interval of 1.29 m. This system, independently developed by Chengdu Shengting Technology Co., Ltd. (Chengdu, China), integrates distributed fiber optic sensing, real-time intelligent analysis, and early warning capabilities into a unified platform.
Furthermore, the system enables the continuous, real-time monitoring of environmental acoustic–vibration events along the entire fiber optic line. The key performance indicators of the equipment are detailed in Table 1.

Table 1.
Main indicators of DAS system.
3. The GRT-Transformer-Based Recognition Methodology
The GRT-Transformer model’s identification framework, as presented in this study, is illustrated in Figure 3. This model employs a three-branch, parallel, and collaborative end-to-end architecture designed for the extraction of multi-dimensional features from intrusion data. Specifically, the GASF and RP branches convert one-dimensional time-series intrusion waveform data into two-dimensional images, which, in conjunction with the Transformer, extract the global trends of the signals. This approach effectively enhances the model’s capacity to capture the spatial features of intrusion waveform data. Simultaneously, a Gated Recurrent Unit (GRU) algorithm branch directly extracts the one-dimensional time-series dynamic features of the intrusion waveforms, enabling the model to comprehensively learn the multi-dimensional data characteristics of the intrusion waveforms. The model’s terminal utilizes a BiLSTM (Bidirectional Long Short-Term Memory) network to deeply fuse the multi-dimensional features extracted by the three branches, further capturing the bidirectional temporal dependencies within the DAS intrusion data. This integrated strategy not only significantly improves the model’s accuracy in identifying various intrusion events of the model’s recognition capabilities by filtering out intrusion events not surrounding the DAS-based power cables but also ensures the stability intrusion event interference in complex environments. The DAS power cable intrusion detection algorithm based on the multimodal Transformer that we constructed is shown in Algorithm 1.
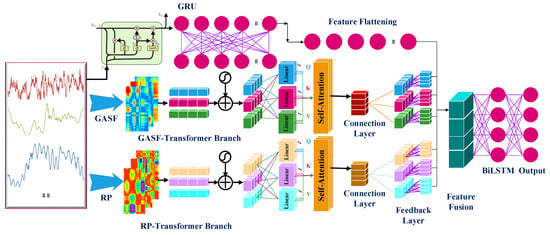
Figure 3.
Depicts the feature extraction branches for one-dimensional time-series waveforms: GRU network, GASF-Transformer network, and branch converting one-dimensional time-series waveforms into two-dimensional Recurrence Plot (RP) images.
| Algorithm 1: GRT-Transformer Algorithm |
| Input relevant parameters: Image input size ; Sequence input size
; Number of identified classes N; Initial learning rate
;
, where
is the patch size. Output the relevant parameters: Probability distribution of N classification outputs for each input mode: is the classification probability of class i. Model training steps: step 1: Initializing parameters, The truncated normal distribution is used to initialize the model parameters , including the filter parameters of the convolutional layer and the weight matrix in the multi-head attention mechanism: , where is the standard deviation. step 2: Forward propagation, For the l-th layer computation, the model will do the following: (1) Convolution and embedding: Convert the input image I to an embedded representation as follows: , (2) Self-Attention: Multi-head self-attention is computed for patch features: (3) Feature flattening and time series modeling: The sequence input is passed through the GRU layer to extract temporal features , After bidirectional LSTM modeling (4) Feature fusion: The features of the two modalities are fused by weighting: where and are the features of images and sequences, and Is the modal fusion weight. (5) The output layer is calculated as follows: Finally, through the fully connected layer and softmax, the probability distribution is generated: . step 3: Back propagation, The model loss value is obtained through the loss function Calculating the gradient Update by the chain rule. step 4: Parameter update, Adam optimizer is used to update the parameters Here, the learning rate decays according to the Adam rule, and is the learning rate decline interval. |
3.1. Data Preprocessing
The preprocessing of raw data is crucial in distributed acoustic sensing (DAS) systems, significantly impacting the accuracy and efficacy of subsequent analysis and model training. This paper introduces a two-stage denoising algorithm, VMD-SWTTV, specifically designed for one-dimensional time-series intrusion data from DAS power cable monitoring. The algorithm comprises two primary stages: Variational Mode Decomposition (VMD) for the initial decomposition of the noisy signal and a refined wavelet threshold denoising method (SWTTV). The SWTTV stage, enhanced with total variation wavelet transform, further decomposes and reconstructs the VMD components, achieving secondary denoising. Initially, the VMD algorithm adaptively decomposes the signal into ‘n’ Intrinsic Mode Functions (IMFs). Subsequently, the kurtosis criterion is employed to select IMFs with superior signal quality and reduced noise levels. To further mitigate noise, each selected IMF component undergoes secondary processing via wavelet decomposition. This is followed by the application of a threshold function incorporating non-convex penalty terms and total variation regularization, which is tailored to the characteristics of non-linear signals. By integrating stationary wavelet transform and fast total variation denoising techniques, the algorithm then reconstructs the signal using an appropriate reconstruction function to obtain the denoised output. The algorithmic flowchart is presented in Figure 4.

Figure 4.
Flowchart of VMD-SWTTV algorithm for 1D data denoising.
Variational Mode Decomposition (VMD) constitutes a non-stationary signal’s time–frequency analysis technique, enabling the decomposition of non-stationary signals into a series of Intrinsic Mode Functions (IMFs). Each IMF represents a signal component, approximating the physically inherent modes [21]. The mathematical formulation of VMD is presented in Equation (1).
Here, denotes the decomposed Intrinsic Mode Function (IMF), represents the k-th center frequency, is the Dirac delta function, and * signifies the convolution operator.
The optimization objective of Variational Mode Decomposition (VMD) is to solve a constrained variational problem to obtain sparse IMFs, where each IMF’s center frequency, , is adaptable. The specific optimization objective can be formulated as
Here, μ denotes the regularization parameter, which governs the sparsity among the Intrinsic Mode Functions (IMFs).
Leveraging the linear properties of wavelet thresholding, the noisy signal, post Variational Mode Decomposition (VMD) processing, undergoes discrete wavelet transform to segregate the wavelet coefficients representing the original signal and noise. The wavelet transform is primarily a transformation of the function f(t) under a wavelet basis, with the specific implementation detailed by Equation (3).
Here, ψ(t) denotes the wavelet basis function; ‘a’ represents the dilation and contraction parameter; and ‘t’ is the translation parameter.
Within the wavelet domain, the experimental data exhibit significant statistical divergence from the original noisy data. Consequently, an appropriate threshold, λ, is established as a selection criterion to determine the retention of the decomposed coefficients. Two primary methodologies for wavelet thresholding are employed: soft thresholding and hard thresholding. Hard thresholding selectively preserves coefficients exceeding a predefined threshold, while coefficients below this threshold are nullified. This approach serves to accentuate salient signals while mitigating the impact of noise. Equation (4) delineates the operational specifics of this method. Soft thresholding involves the nullification of wavelet coefficients below a specified threshold and the attenuation of coefficients exceeding the threshold, causing them to converge towards zero, as illustrated by Equation (5) [20].
Here, is the wavelet coefficient and represents the threshold.
3.2. One-Dimensional Time-Series Feature Extraction Based on GRU
Recurrent Neural Networks (RNNs) were extensively utilized in early sequence signal processing, leveraging recurrent connections to effectively capture temporal dependencies within sequences. However, the simple design of RNNs presented challenges such as vanishing and exploding gradients when processing long sequences, thereby limiting their ability to learn long-term temporal dependencies. To address this, Long Short-Term Memory networks (LSTMs) were introduced, incorporating gating mechanisms, including forget, input, and output gates, to better control information flow and enhance the network’s capacity for handling long-term dependencies. Due to the longer training times associated with LSTMs, Gated Recurrent Units (GRUs), a variant of LSTM, were developed. GRUs merge the forget and input gates into an update gate, reducing the number of network parameters. Consequently, GRUs were selected as the one-dimensional feature extraction tool for our time-series intrusion signals [26]. The internal structure of the GRU network is illustrated in Figure 5. Our model utilizes the GRU branch to more accurately capture and predict the dynamic characteristics of intrusion sequence data. The mathematical expressions for the GRU are provided in Equations (6)–(9).
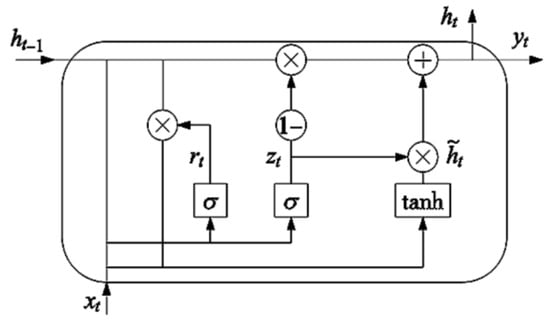
Figure 5.
GRU internal architecture.
In the provided equations, represents the update gate, denotes the reset gate, signifies the current candidate hidden state, is the hidden state, is the hidden state from the preceding time step, symbolizes the activation function, is the input data at the current time step, , and are bias vectors, and , are weight matrices.
3.3. Dual-Branch Feature Transformation with GASF and RP
The GRT-Transformer model necessitates multi-modal feature extraction from intrusion sequence data. Specifically, the GASF and RP branches convert one-dimensional time-series intrusion signals into two-dimensional image data for feature extraction. The GASF algorithm is designed to preserve the original sequence data features, thereby preventing feature loss. Its core principle involves transforming one-dimensional time-series data from Cartesian coordinates into a polar coordinate system, followed by the construction of a Gramian matrix to maintain the dynamic characteristics of the sequence. Furthermore, the Recurrence Plot (RP) method visualizes trajectory periodicity through phase space, generating two-dimensional images by monitoring the recurrence of states within the time series. This approach enables the model to effectively reveal the periodicity and underlying structure of the sequence, thereby enhancing its spatial capture capabilities. In this study, we employ the GASF and RP dual parallel branches of the model to extract spatial two-dimensional features from the DAS monitoring data of power cables, enhancing the model’s recognition accuracy through the fusion of multi-dimensional features.
The core principle of GASF involves mapping a one-dimensional time series, Z, to angular values, followed by constructing a symmetric Gramian matrix using the cosine of these angular values. , where n represents the total number of time points, and k denotes a specific time point, with k = 1, 2, , n. The GASF algorithm implementation is as follows:
- (1)
- Normalization
Initially, the time series, Z, in Cartesian coordinates is scaled to the range of −1 to 1 using Equation (10), resulting in .
- (2)
- Polar Coordinate Transformation
The one-dimensional time-series data derived from the distributed acoustic sensing (DAS) of power cables is converted into vector representations, facilitating subsequent inner product computations. The transformation is defined by the following equation:
Here, denotes the normalized time series; represents the timestamp; and signifies the polar coordinate radius.
- (3)
- GASF
The defined Gramian Angular Summation Field (GASF) is presented in Equation (12) [27]:
The fundamental principle of a Recurrence Plot (RP) involves expanding a one-dimensional time series into a high-dimensional space via phase space reconstruction. Subsequently, the recurrence matrix is generated by computing the probability of state points recurring within the phase space, which is then transformed into a two-dimensional image. Given an original time series , the reconstruction process entails determining appropriate embedding dimension m and delay time τ. The reconstructed trajectory is then derived.
The R-value within the Recurrence Plot (RP) framework quantifies the pairwise distances between trajectories. The RP is formally defined as
where ε denotes the threshold for minimum distance, and Θ(⋅) represents the Heaviside function [28].
In this study, we acquired intrusion data from power cables via a distributed acoustic sensing (DAS) system, sampling at a rate of 2500 points per event. These raw data underwent preprocessing, followed by transformation into Gramian Angular Summation Field (GASF) and RP representations. Subsequently, the proposed model was employed for feature extraction and intrusion identification.
3.4. Bidirectional Feature Quadratic Extraction BiLSTM
In this study, we enhance the accuracy of the GRT-Transformer model for identifying intrusion events in DAS power cables by employing a feature fusion strategy based on a BiLSTM network, followed by the secondary processing of the fused features. BiLSTM, an extension of LSTM, is designed to capture the relationships between historical and current information. It comprises two LSTM layers that process input data bidirectionally, with the outputs of both layers concatenated to form the final BiLSTM output [29]. The fundamental principle is illustrated in Equation (16). This architecture enables BiLSTM to effectively leverage contextual information when processing time-series data, as detailed in Figure 6. Since we have three distinct feature channels, the value of t is set to 3.
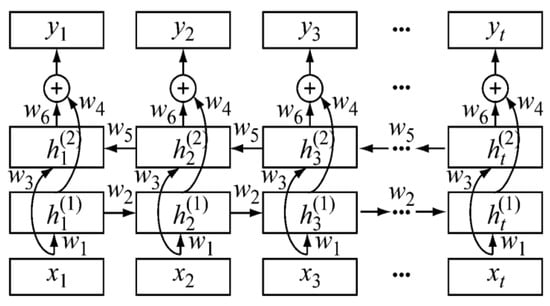
Figure 6.
BiLSTM structure.
In the equation, represent the network weights; denotes the input at time t; signifies the output of the forward hidden layer at time t; represents the output of the backward hidden layer at time t; is the final output of the network; is the LSTM cell function; and is the activation function.
3.5. Transformer and Multi-Head Attention
In this study, we employ the Transformer model as the core component of the GRT-Transformer classifier. Unlike conventional CNN and RNN architectures, the Transformer model adopts an end-to-end architecture, with the multi-head attention mechanism (MSA) based on self-attention at its core. The Transformer structure is illustrated in Figure 7, comprising N-stacked Transformer Blocks, each primarily composed of a multi-head attention layer and a feedforward neural network layer (FNN). Feature extraction is performed using the MSA, followed by the feedforward neural network for fitting in the final layer. Layer normalization (LN) is utilized to smoothly integrate inputs and outputs from other layers. To optimize the training process and mitigate gradient issues in deep networks, residual connections are incorporated within each sub-module, thereby enhancing the overall model performance.
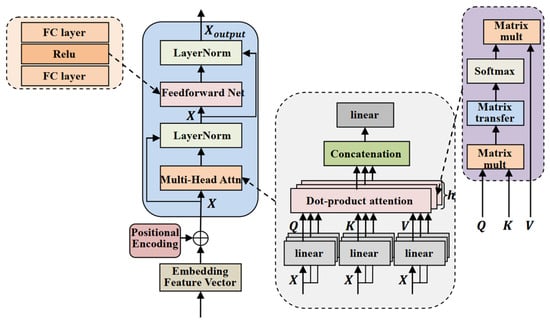
Figure 7.
Transformer framework architecture diagram.
Positional encoding is crucial within the Transformer architecture, providing positional information by characterizing the relative relationships between features. This is achieved by adding the positional encoding to the embedding layer, thereby enabling the model to understand the relative positions of elements within a sequence. This mechanism effectively addresses the inherent disorderliness of sequence processing in the Transformer model. The underlying mathematical principles are as follows [30]:
In the equation, represents the sequence length; denotes the dimension index of the feature vector; and signifies the feature length. is a linear transformation of .
The Transformer model’s performance is primarily achieved through a self-attention mechanism. This mechanism is composed of two key components: multi-head self-attention (MSA), which integrates multiple self-attention heads, and scaled dot-product attention, which is employed for the attention calculation within each head. By dynamically assigning weights, the model captures the interdependencies among elements within a sequence. The self-attention mechanism provides a global receptive field, with the multi-head attention structure illustrated in Figure 7. The parallel computation of attention h times yields multiple parameter-independent subspaces, thereby enhancing the model’s capacity to focus on diverse features.
The input matrix, , undergoes three distinct linear transformations to produce the query matrix, Q, the key matrix, K, and the value matrix, V.
In the equation, . The embedding vector X is projected from a dmodel-dimensional space to a -dimensional space.
The mathematical formulation of the multi-head self-attention mechanism employed by the Transformer is given by Equation (19).
In the equation, denotes the self-attention mechanism function, where Q, K, and V represent the query, key, and value matrices, respectively. The softmax function transforms the obtained scores into a probability distribution, ensuring all scores fall between 0 and 1 and sum to 1; signifies the self-attention output for the ith head; and represents the multi-head self-attention output, derived by concatenating the outputs of all heads and subsequently applying a linear transformation, .
The feedforward network is represented as follows:
In the equation, x represents the output vector after attention layer normalization; W denotes the weight vector; and b is the bias term.
The residual connection mechanism significantly enhances the efficiency of gradient propagation, thereby preventing the degradation of model performance. Within a Transformer Block employing residual connection technology, the data processing flow can be expressed as
In the equation, and represent the output and input matrices of the Transformer Block, respectively; denotes the input matrix of the feedforward network layer; and (.) signifies the layer normalization operation [31].
4. Experimental Results and Discussion
In this section, I will first detail the construction of the DAS dataset for training and testing our model, specifically focusing on power cable monitoring. Subsequently, I will evaluate the efficacy of our data preprocessing techniques. Following this, I will analyze the training and testing results to validate the effectiveness and generalizability of our model in real-world power cable intrusion detection scenarios. Finally, I will compare our results with those obtained using alternative methods to highlight the advantages of our proposed approach.
4.1. Dataset Construction
The experimental data were acquired from a 33 km power cable route in Chengdu, Sichuan Province, using a Distributed Acoustic Sensing (DAS) system to monitor and select three types of intrusion events. The DAS monitoring system sampled data at a frequency of 1 kHz. Each intrusion signal sample comprised 2500 sampling points, with the three intrusion events being illegal tapping, mechanical operations, and vehicle passage, respectively. The intrusion events consisted of both those artificially induced by our experimental personnel and naturally occurring events. Following data quality assessment, we selected the raw dataset that met the experimental requirements. The dataset consisted of 2857 samples each of illegal tapping, mechanical operations, and vehicle passage, which were used to train and validate the performance of the GRT-Transformer model in identifying DAS power cable intrusion events. We randomly allocated the data into training and validation sets at a 7:3 ratio, with no overlap between the datasets. The sample data description is presented in Table 2.

Table 2.
Power cable DAS security intrusion monitoring dataset.
The raw waveform data from the DAS intrusion monitoring across three scenarios are depicted in Figure 8a–c. Subsequently, the Gramian Angular Summation Field (GASF) representations derived from these images are illustrated in Figure 8d–f, while the Recurrence Plots (RPs) are presented in Figure 8g–i. These three datasets constitute the training and testing dataset for our model.
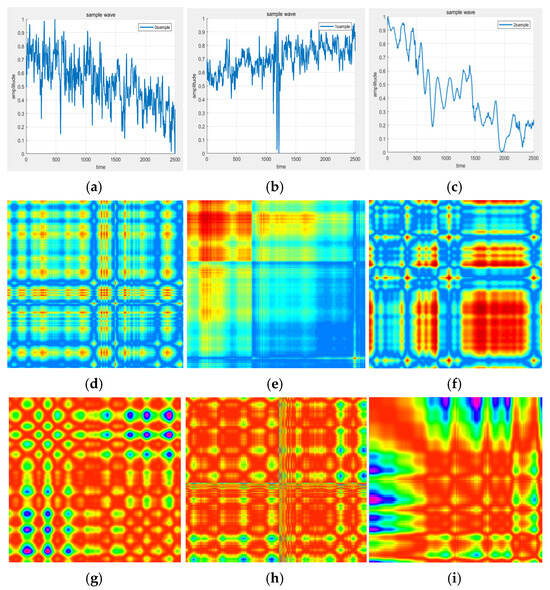
Figure 8.
Raw waveform data of DAS intrusion monitoring: (a) illegal tapping; (b) mechanical operation; (c) vehicle passage; (d) GASF plot of illegal tapping; (e) GASF plot of mechanical operation; (f) GASF plot of vehicle passage; (g) Recurrence Plot of illegal tapping; (h) Recurrence Plot of mechanical operation; (i) Recurrence Plot of vehicle passage.
4.2. Data Preprocessing Results
The raw intrusion data acquired via the DAS system are contaminated by environmental noise, leading to a degradation in signal quality. Consequently, denoising algorithms are essential for preprocessing the raw data. This paper introduces an enhanced Variational Mode Decomposition-based denoising algorithm, VMD-SWTTV. To evaluate the denoising performance, we conducted tests on randomly selected raw DAS intrusion monitoring data samples. To ensure consistent Signal-to-Noise Ratio (SNR) across samples, 5 dB of Gaussian white noise was added prior to denoising. The addition of Gaussian white noise resulted in the emergence of numerous spikes and glitches within the samples. Subsequently, the denoising results of five different algorithms are compared, as illustrated in Figure 9, which presents the denoising outcomes of VMD-SWTTV, VMD-WTD, SVD-VMD, CEECMSA, and WAVELET algorithms on the raw DAS intrusion monitoring data. The results demonstrate the effective suppression of spikes and glitches. Notably, VMD-SWTTV and VMD-WTD exhibited the best denoising performance, followed by WAVELET threshold denoising. Conversely, SVD-VMD and CEECMSA algorithms introduced signal distortion in the denoised DAS data. To assess the performance of the five denoising algorithms, we employed the SNR and Root Mean Square Error (RMSE) as performance metrics for evaluating the denoising methods applied to DAS intrusion monitoring signals. The SNR and RMSE calculations are detailed below.
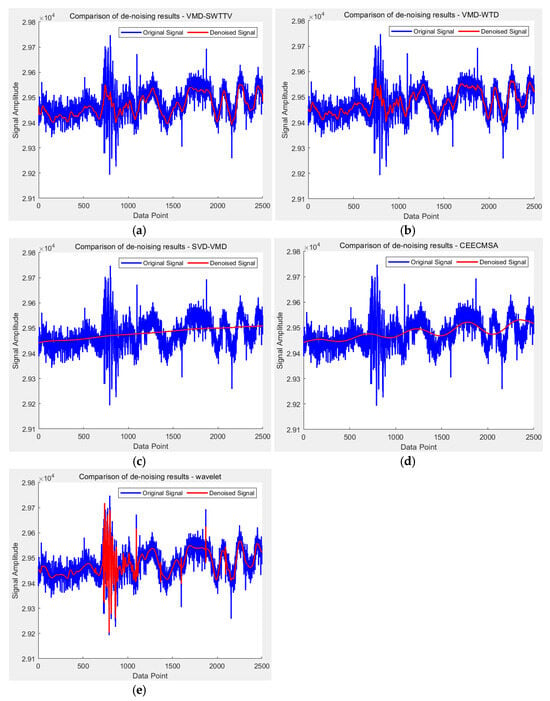
Figure 9.
A comparative analysis of denoising outcomes derived from the application of various algorithms to raw DAS intrusion monitoring data. The algorithms under evaluation include (a) VMD-SWTTV, (b) VMD-WTD, (c) SVD-VMD, (d) CEECMSA, and (e) WAVELET denoising, with the results juxtaposed against the original, unprocessed data.
Here, denotes the peak power of the Rayleigh scattering signal within the sensing signal, represents the average noise power, m signifies the total number of observation points, y(i) is the actual value at the i-th observation point, and is the predicted value at the i-th observation point, with k representing the model number.
Using Equations (23) and (24), we obtained a comparative analysis of the performance metrics for five noise reduction algorithms, as presented in Table 3. A comparison was conducted using ten sampling points from the dataset. The original DAS intrusion detection data, after being contaminated with 5 dB of Gaussian white noise, was processed through the five denoising algorithms. The resulting SNR and RMSE metrics are summarized in Table 3. The results indicate that, for the ten sampling points with an SNR of 5 dB, all five algorithms significantly improved the Signal-to-Noise Ratio. Notably, the proposed VMD-SWTTV denoising algorithm demonstrated the most optimal performance. Analyzing the RMSE metrics, the initial error value of 0.039158 for the raw signal was further reduced after processing with each of the five algorithms. Among these, the VMD-SWTTV algorithm yielded the minimum root mean square error, markedly outperforming the other four methods. Overall, the VMD-SWTTV denoising algorithm not only achieved the best noise suppression but also minimized the error, leading to its selection as the preferred denoising approach for DAS intrusion signal recognition in this study.

Table 3.
Comparison of noise reduction performance of five noise reduction algorithms.
4.3. GRT-Transformer Model Recognition Results
To provide a more intuitive demonstration of the GRT-Transformer model’s recognition performance, we conducted a t-SNE dimensionality reduction visualization analysis on both the original samples and the samples after classification. This approach allows us to illustrate the data distribution within a two-dimensional space. Figure 10 presents the scatter plot of the original samples. As observed in the figure, the three types of intrusion event samples exhibit no discernible patterns or clustering before recognition in the two-dimensional space, thus making it impossible to differentiate between sample types. By comparing the scatter plot of the original data to that of the data samples after recognition, we can clearly assess the model’s performance.
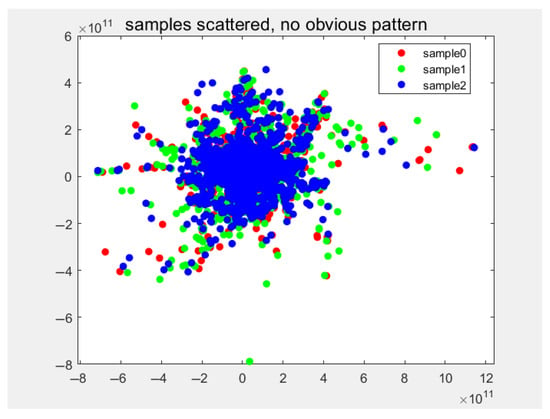
Figure 10.
Scatter plot of original sample data.
Figure 11 presents a scatter plot of sample distribution following classification by the GRT-Transformer model. Compared to the original sample distribution, a clear clustering trend is observed in the samples processed by the GRT-Transformer model, with samples of the same type clustering together. The experimental results demonstrate that the GRT-Transformer model can effectively and reasonably differentiate, identify, and cluster samples of the same intrusion event, reflecting the accuracy and stability of our model.
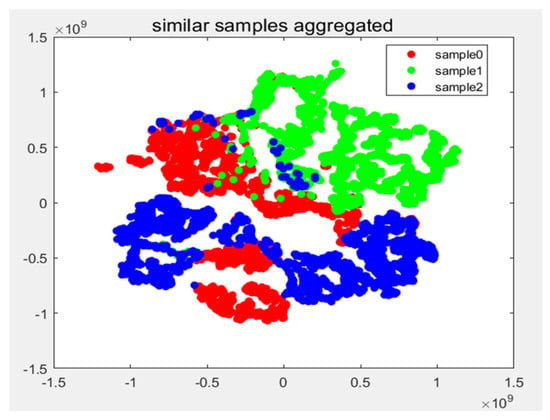
Figure 11.
Scatter plot of sample distribution after model identification.
Figure 12a presents the iterative curves of the model’s training accuracy and loss. It is evident from the graph that, with increasing training iterations, the model’s accuracy steadily improves. The training confusion matrix in Figure 12b indicates a training accuracy of 96.15%, demonstrating the model’s robust learning capability. The validation confusion matrix in Figure 13 further confirms the model’s excellent performance on real-world data, achieving an average recognition accuracy of 97.3%, which significantly surpasses traditional methods, particularly in reducing false alarm rates for Damage Assessment Systems (DASs). In the validation results, the model’s identification of “vehicle passage” approaches near perfection at 99.6%. However, the confusion matrix also reveals areas for improvement: the model misclassified 35 instances of “illegal hammering” as “mechanical operation” and 14 instances of “mechanical operation” as “illegal hammering.” This suggests that, in complex underground environments, the vibration signal features—such as amplitude, frequency, or pattern—of “illegal hammering” and “mechanical operation” exhibit a certain degree of overlap, leading to primary misclassification errors and posing a significant challenge in reducing overall false positives. Despite this, the recognition accuracy for “mechanical operation” remains high at 96.7%, and for “illegal hammering” at 95.6%, indicating the model’s excellent overall discriminative ability across the three event categories. These quantitative error analyses precisely delineate the current boundaries of the model’s resistance to false alarms in practical applications and highlight the potential for further optimization by refining and distinguishing the vibrational features of these two confusable event types.
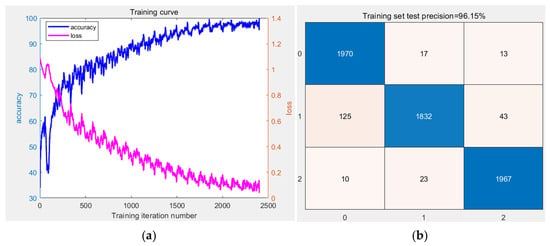
Figure 12.
(a) Model training iteration curve; (b) confusion matrix for training set(Blue: Identify the correct part; Light white: Identify the incorrect part).
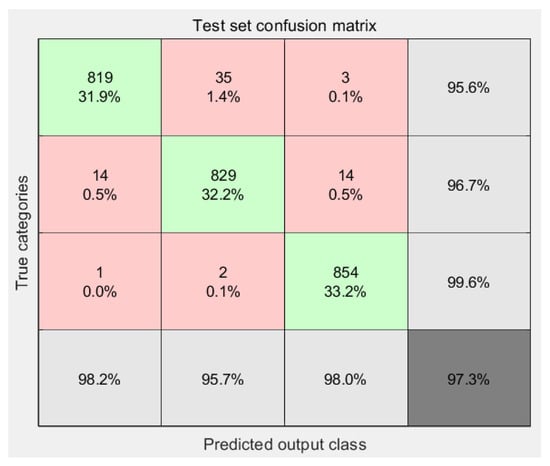
Figure 13.
The confusion matrix for the validation set. (Green: Identify the correct part; Red: Identifies the erroneous parts; Light gray: The recognition accuracy rates corresponding to the three events respectively; Dark gray: Average recognition accuracy of all events).
The performance metrics of the GRT-Transformer model in identifying three intrusion disturbance events are detailed in Table 4, encompassing various disturbance event types and their averages. Precision, recall, F1-score, and accuracy, which are key evaluation metrics, are also presented. The GRT-Transformer model demonstrates high precision, recall, and F1-scores in the identification of these three disturbance events. Furthermore, the GRT-Transformer model achieves an accuracy of 97.3%, indicating its superior ability to recognize our experimental data. As can be directly observed from Table 4, the identification of vehicle passage is most effective, with all metrics approaching or exceeding 99%. In conclusion, the model exhibits high stability and accuracy in the identification of these three types of disturbance events.

Table 4.
GRT-Transformer performance on three disturbance event identification.
4.4. Comparison with Traditional Other Models
The GRT-Transformer model proposed in this paper demonstrates superior performance in the identification of intrusion disturbance events in DAS power cables. To highlight the advantages of our proposed algorithm, we compared its performance with that of the CDIL-CBAM, DBN-LSTM, CDIL-BiLSTM-CBAM, CNN-Dense, and GRT-Transformer algorithms, which were previously investigated. Figure 14 presents the confusion matrix results for the identification of three intrusion events on the validation set for the five recognition models. The recognition accuracy rates for the five models are 85.4%, 95.8%, 94.1%, 88.1%, and 97.3%, respectively. The GRT-Transformer model proposed in this paper achieves the highest recognition accuracy. The comparative results of the precision, recall, F1 score, and accuracy metrics for the five recognition algorithms are illustrated in Figure 15.
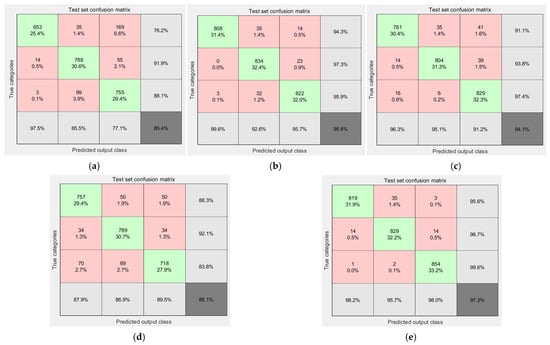
Figure 14.
The confusion matrix results for the identification of three types of DAS power cable intrusion events are presented for the following models: (a) CDIL-CBAM, (b) DBN-LSTM, (c) CDIL-BiLSTM-CBAM, (d) CNN-Dense, and (e) GRT-Transformer. (Green: Identify the correct part; Red: Identifies the erroneous parts; Light gray: The recognition accuracy rates corresponding to the three events respectively; Dark gray: Average recognition accuracy of all events).
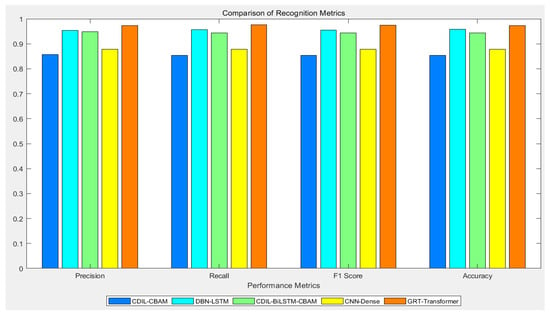
Figure 15.
A comparative analysis of performance metrics for the identification of three intrusion events across five distinct algorithms.
To compare the computational efficiency advantages of the GRT-Transformer model against other models, we evaluated five models based on parameters such as model size, computational complexity, and the time costs associated with the offline training and online testing of individual spatiotemporal samples, as illustrated in Figure 16a–d. The GRT-Transformer model has a parameter size of only 17.0 MB, representing a 69.1% reduction compared to the suboptimal model CDIL-CBAM (55.0 MB), thereby enhancing hardware compatibility for edge deployment. Its computational complexity is 0.950 G, a 14.7% improvement over the baseline CDIL-CBAM (1.114 G), significantly reducing the energy consumption bottleneck during real-time inference. The incremental training time for the GRT-Transformer is merely 20.8 s, representing a 36-fold acceleration over traditional models such as CNN-Dense (which requires 755.0 s), supporting high-frequency model iterations. The GPU inference latency of the GRT-Transformer is 0.5 ms, a 3.6-fold speedup compared to the average latency of the other four models, enabling a full-link response to cable intrusion events within 200 ms. These results demonstrate that, within the proposed GRT-Transformer framework, shared feature extraction and redundancy layer removal significantly minimize computational resource requirements and time costs. Consequently, synchronized event detection in DAS with tens of thousands of sensor nodes can be efficiently performed online, even on standard CPUs. This presents a promising approach for large-scale or ultra-large-scale DAS tasks.
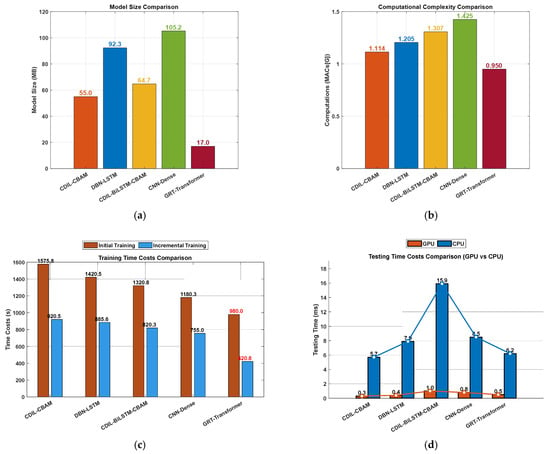
Figure 16.
Computation cost: (a) model size, (b) computational complexity with MACs, (c) offline training time with GPU, including initial and incremental learning(Brown: Initial learning; Blue: Incremental Learning), and (d) online test time of one time–space sample of 100 sensing nodes with 5 s time length on commercial GPU: NVIDIA GeForce GTX 1080 Ti and CPU: Intel Core i7-10700.
Table 5 presents a comparative analysis of the recognition accuracy achieved by five algorithmic models in identifying three types of DAS power cable intrusion events. The results indicate that all five models exhibit high recognition accuracy for mechanical operation and vehicle passage intrusion events, with our proposed model achieving recognition accuracies of 96.7% and 99.6%, respectively. Although the DBN-LSTM model slightly outperforms the proposed GRT-Transformer model in the recognition of mechanical operation intrusions, our model achieves an overall average recognition accuracy of 97.3%, surpassing DBN-LSTM by 1.47%. Furthermore, our model demonstrates the highest recognition accuracy among the five models for both illegal tapping and vehicle passage intrusion events.

Table 5.
The recognition accuracy results for the five-class comparative experiments.
The parameters of the GRT-Transformer utilized in this study are detailed in Table 6 and Table 7. The GRT-Transformer outputs three categories, corresponding to illegal striking, mechanical operations, and vehicular passage, representing three newly identified event types.

Table 6.
Parameters of the GRT-Transformer model.

Table 7.
GRT-Transformer training protocol.
5. Conclusions
This paper investigates feature extraction and intrusion recognition methods for distributed acoustic sensing (DAS) systems, with a primary focus on their application in security monitoring for intrusion event identification in complex power cable environments. We introduce the GRT-Transformer, a multi-modal deep learning framework featuring a three-branch parallel collaborative architecture. The GRT-Transformer model offers high recognition accuracy and robust generalization capabilities, effectively addressing the issue of high false alarm rates in existing systems. Compared to traditional intrusion recognition algorithms, the GRT-Transformer model demonstrates superior ability in extracting deep-level features from the data. Data undergo preprocessing via the VMD-SWTTV algorithm prior to model input. The model converts one-dimensional time-series intrusion waveform data into two-dimensional images using two branches: the two-dimensional Gramian Angular Field (GASF) and Recurrence Plot (RP) algorithms. By integrating a Transformer to extract global trends from the signals, the model effectively enhances its ability to capture spatial features of intrusion waveforms, representing a significant innovation. Simultaneously, a Gated Recurrent Unit (GRU) algorithm branch directly extracts one-dimensional time-series dynamic features of the intrusion waveforms, enabling the model to comprehensively learn multi-dimensional data characteristics of the intrusion waveforms. The model’s terminal employs a Bidirectional Long Short-Term Memory (BiLSTM) network to deeply fuse the multi-dimensional features extracted by the three branches, further capturing the bidirectional temporal dependencies of the DAS intrusion data. This approach constructs an end-to-end DAS intrusion recognition model framework, thereby improving the system’s robustness and practicality. The experimental results demonstrate that the proposed feature extraction and intrusion recognition method effectively distinguishes the three types of DAS power cable intrusion event datasets collected, achieving a recognition accuracy of 97.3% and effectively reducing the system’s false alarm rate. In conclusion, this research provides an efficient technical solution for DAS systems in power cable security monitoring and intrusion recognition. Future work will focus on further optimizing the model architecture to enhance its accuracy and applying the GRT-Transformer model to a wider range of datasets to validate its generalization capabilities.
Author Contributions
Conceptualization, X.W. and X.H.; methodology, X.W.; software, X.W.; validation, X.W., X.H. and H.Q.; formal analysis, X.W.; investigation, X.W.; resources, X.H.; data curation, X.W., H.Q. and Z.Z.; writing—original draft preparation, X.W.; writing—review and editing, X.W. and X.H.; visualization, X.W.; supervision, X.H.; project administration, X.H.; funding acquisition, X.H. All authors have read and agreed to the published version of the manuscript.
Funding
This research was funded by Xihua University, grant number No. H242038.
Institutional Review Board Statement
Not applicable.
Informed Consent Statement
Not applicable.
Data Availability Statement
Our dataset is placed in “Mendeley Data” at https://data.mendeley.com/datasets/fp77d4223z/1 (accessed on 20 May 2025).
Acknowledgments
We sincerely thank the Electrical and Electronic Equipment Laboratory of Xihua University for providing the experimental instruments and technical support. Special thanks go to the Sample Data Set of Chengdu Sound Listening Technology Co., Ltd. We also thank the Graduate Office for their administrative assistance in the project coordination.
Conflicts of Interest
The authors declare no conflicts of interest.
Abbreviations
The following abbreviations are used in this manuscript:
| AOM | Acousto-Optic Modulator |
| BiLSTM | Bidirectional Long Short-Term Memory Abstract |
| BO | Bayesian Optimization |
| ConvNeXt | Convolutional Next-Generation Network |
| DAS | Distributed Acoustic Sensing Abstract |
| DLA | Distributed Local Attention |
| EDFA | Erbium-Doped Fiber Amplifier |
| EMD | Empirical Mode Decomposition |
| FNN | Feedforward Neural Network |
| FPN | Feature Pyramid Network |
| GASF | Gramian Angular Summation Field |
| GRU | Gated Recurrent Unit |
| IMF | Intrinsic Mode Function |
| LSTM | Long Short-Term Memory |
| MSA | Multi-Head Self-Attention |
| MSResNet | Modified ResNet |
| OTDR | Optical Time-Domain Reflectometry |
| φ-OTDR | Phase-Sensitive Optical Time-Domain Reflectometry |
| RP | Recurrence Plot |
| RNN | Recurrent Neural Network |
| RMSE | Root Mean Square Error |
| SNR | Signal-to-Noise Ratio |
| STDP | Spike-Timing-Dependent Plasticity |
| SVD-VMD | Singular Value Decomposition with Variational Mode Decomposition |
| SWTTV | Stationary Wavelet Transform with Total Variation |
| VMD | Variational Mode Decomposition |
| VMD-WTD | Variational Mode Decomposition with Wavelet Threshold Denoising |
| WAVELET | Wavelet Transform |
References
- Bin Shahabudin, M.S.; Jaafar, J.; Bencheva, N.; Paputungan, I.V.; Farisha Binti Muhamad Krishnan, N. Graph Neural Networks for Microseismic Event Detection: Focusing on Distributed Acoustic Sensing Data. In Proceedings of the 2024 5th International Conference on Communications, Information, Electronic and Energy Systems (CIEES), Veliko Tarnovo, Bulgaria, 20–22 November 2024; pp. 1–8. [Google Scholar]
- Ran, C.; Xiao, P.; Luo, Z.; Chen, X. Identification of Pipeline Intrusion Signals Based on ICEEMDAN-FE-AIT and F-ELM in the uwDAS System. IEEE Sens. J. 2024, 24, 36874–36881. [Google Scholar] [CrossRef]
- Han, S.; Huang, M.-F.; Li, T.; Fang, J.; Jiang, Z.; Wang, T. Deep Learning-Based Intrusion Detection and Impulsive Event Classification for Distributed Acoustic Sensing Across Telecom Networks. J. Light. Technol. 2024, 42, 4167–4176. [Google Scholar] [CrossRef]
- Wu, H.; Wang, Y.; Liu, X.; Sun, Y.; Yan, G.; Wu, Y.; Rao, Y. Smart Fiber-Optic Distributed Acoustic Sensing (sDAS) with Multitask Learning for Time-Efficient Ground Listening Applications. IEEE Internet Things J. 2024, 11, 8511–8525. [Google Scholar] [CrossRef]
- Wu, H.; Liu, X.; Wang, X.; Wu, Y.; Liu, Y.; Wang, Y.; Rao, Y. Multi-Dimensional Information Extraction and Utilization in Smart Fiber-Optic Distributed Acoustic Sensor (sDAS). J. Light. Technol. 2024, 42, 6967–6980. [Google Scholar] [CrossRef]
- Fu, W.; Yi, D.; Huang, Z.; Huang, C.; Geng, Y.; Li, X. Multiple Event Recognition Scheme Using Variational Mode Decomposition-Based Hybrid Feature Extraction in Fiber Optic DAS System. IEEE Sens. J. 2023, 23, 27316–27323. [Google Scholar] [CrossRef]
- Yan, S.; Shang, Y.; Wang, C.; Zhao, W.; Ni, J. Mixed Intrusion Events Recognition Based on Group Convolutional Neural Networks in DAS System. IEEE Sens. J. 2022, 22, 678–684. [Google Scholar] [CrossRef]
- Bai, Y.; Xing, J.; Xie, F.; Liu, S.; Li, J. Detection and identification of external intrusion signals from 33 km optical fiber sensing system based on deep learning. Opt. Fiber Technol. 2019, 53, 102060. [Google Scholar] [CrossRef]
- He, T.; Sun, Q.; Zhang, S.; Li, H.; Yan, B.; Fan, C.; Yan, Z.; Liu, D. A Dual-Stage-Recognition Network for Distributed Optical Fiber Sensing Perimeter Security System. J. Light. Technol. 2023, 41, 4331–4340. [Google Scholar] [CrossRef]
- Wu, H.; Gan, D.; Xu, C.; Liu, Y.; Liu, X.; Song, Y.; Rao, Y. Improved Generalization in Signal Identification with Unsupervised Spiking Neuron Networks for Fiber-Optic Distributed Acoustic Sensor. J. Light. Technol. 2022, 40, 3072–3083. [Google Scholar] [CrossRef]
- Lyu, C.; Hue, Z.; Cheng, X.; Jiang, J.; Alimasi, A.; Liu, H. Distributed Optical Fiber Sensing Intrusion Pattern Recognition Based on GAF and CNN. J. Light. Technol. 2020, 38, 4174–4182. [Google Scholar] [CrossRef]
- He, T.; Li, H.; Zhang, S.; Zeng, Z.; Yan, Z.; Sun, Q.; Liu, D. A Surveillance System for Urban Utility Tunnel Subject to Third-Party Threats Based on Fiber-Optic DAS and FPN-BiLSTM Network. IEEE Trans. Instrum. Meas. 2024, 73, 3369087. [Google Scholar] [CrossRef]
- Wang, Y.-J.; Zhuo, W.; Liu, B.; Liu, J.; Hu, Y.; Fu, Y.; Xiao, W.; He, X.-D.; Yuan, J.; Wu, Q. GASF-ConvNeXt-TF Algorithm for Perimeter Security Disturbance Identification Based on Distributed Optical Fiber Sensing System. IEEE Internet Things J. 2024, 11, 17712–17726. [Google Scholar] [CrossRef]
- Sun, Z.; Yang, H.; Fang, M.; Dai, Y.; Huang, D.; Zhao, C. On Bayesian Optimization-Based CNN-BiLSTM Network for Multiclass Classification in Distributed Optical Fiber Vibration Sensing Systems. IEEE Trans. Instrum. Meas. 2024, 73, 3451576. [Google Scholar] [CrossRef]
- Lyu, C.; Huo, Z.; Liu, Y.; Cheng, X.; Jiang, J.; Alimasi, A.; Yang, J.; Su, H. Robust Intrusion Events Recognition Methodology for Distributed Optical Fiber Sensing Perimeter Security System. IEEE Trans. Instrum. Meas. 2021, 70, 3048521. [Google Scholar] [CrossRef]
- Huo, Z.; Yang, J.; Xi, M.; Chen, D.; Wen, J. SP-MSResNet: A Multiscale Residual Network with Strip Pooling Module for Intrusion Pattern Recognition. IEEE Sens. J. 2024, 24, 30136–30146. [Google Scholar] [CrossRef]
- Wu, H.; Chen, J.; Liu, X.; Xiao, Y.; Wang, M.; Zheng, Y.; Rao, Y. One-Dimensional CNN-Based Intelligent Recognition of Vibrations in Pipeline Monitoring with DAS. J. Light. Technol. 2019, 37, 4359–4366. [Google Scholar] [CrossRef]
- Sun, Z.; Liu, K.; Xu, T.; Xu, Y.; Fang, W.; Xue, K.; Huang, Y.; Li, S.; Liu, T. Intelligent Sensing Analysis Using Mel-Time-Frequency-Imaging and Deep Learning for Distributed Fiber-Optic Vibration Detection. IEEE Sens. J. 2022, 22, 21933–21941. [Google Scholar] [CrossRef]
- Wu, H.; Lu, M.; Xu, C.; Jiao, X.; Liao, H.; Wang, X.; Shu, X.; Liu, Y.; Wu, Y.; Rao, Y. Nonlinear Mixture Signal Separation with the Extended Slow Feature Analysis (xSFA) in Fiber-Optic Distributed Acoustic Sensor (DAS). J. Light. Technol. 2024, 42, 2580–2594. [Google Scholar] [CrossRef]
- Wang, Y.; Chen, P.; Zhao, Y.; Sun, Y. A Denoising Method for Mining Cable PD Signal Based on Genetic Algorithm Optimization of VMD and Wavelet Threshold. Sensors 2022, 22, 9386. [Google Scholar] [CrossRef] [PubMed]
- Li, H.; Li, S.; Sun, J.; Huang, B.; Zhang, J.; Gao, M. Ultrasound signal processing based on joint GWO-VMD wavelet threshold functions. Measurement 2024, 226, 114143. [Google Scholar] [CrossRef]
- Li, J.; Xiong, P.; Li, Y.; Feng, Q. DAS Noise Suppression Network Based on Distributing-Local-Attention Expansion. IEEE Geosci. Remote Sens. Lett. 2024, 21, 3433006. [Google Scholar] [CrossRef]
- Zhang, S.; He, T.; Li, H.; Fan, C.; Yan, Z.; Sun, Q. Modified Data Augmentation Integration Method for Robust Intrusion Events Recognition with Fiber Optic DAS System. J. Light. Technol. 2024, 42, 453–462. [Google Scholar] [CrossRef]
- Wang, P.; Liu, S.; Chen, J. CCDA: A Novel Method to Explore the Cross-Correlation in Dual-Attention for Multimodal Sentiment Analysis. Appl. Sci. 2024, 14, 1934. [Google Scholar] [CrossRef]
- Shi, S.; Han, D.; Cui, M. A multimodal hybrid parallel network intrusion detection model. Connect. Sci. 2023, 35, 2227780. [Google Scholar] [CrossRef]
- Wang, W.; Liu, Y.; Song, F.; Lu, J.; Qu, J.; Guo, J.; Huang, J. CGMV-EGR: A multimodal fusion framework for electromyographic gesture recognition. Pattern Recognit. 2025, 162, 111387. [Google Scholar] [CrossRef]
- Xie, F.; Li, G.; Hu, W.; Fan, Q.; Zhou, S. Intelligent Fault Diagnosis of Variable-Condition Motors Using a Dual-Mode Fusion Attention Residual. J. Mar. Sci. Eng. 2023, 11, 1385. [Google Scholar] [CrossRef]
- Xie, S.; Li, Y.; Tan, H.; Liu, R.; Zhang, F. Multi-scale and multi-layer perceptron hybrid method for bearings fault diagnosis. Int. J. Mech. Sci. 2022, 235, 107708. [Google Scholar] [CrossRef]
- You, K.; Wang, P.; Gu, Y. Toward Efficient and Interpretative Rolling Bearing Fault Diagnosis via Quadratic Neural Network with Bi-LSTM. IEEE Internet Things J. 2024, 11, 23002–23019. [Google Scholar] [CrossRef]
- Dai, X.; Yi, K.; Wang, F.; Cai, C.; Tang, W. Bearing fault diagnosis based on POA-VMD with GADF-Swin Transformer transfer learning network. Measurement 2024, 238, 115328. [Google Scholar] [CrossRef]
- Yan, S.; Shao, H.; Wang, J.; Zheng, X.; Liu, B. LiConvFormer: A lightweight fault diagnosis framework using separable multiscale convolution and broadcast self-attention. Expert Syst. Appl. 2024, 237, 121338. [Google Scholar] [CrossRef]
Disclaimer/Publisher’s Note: The statements, opinions and data contained in all publications are solely those of the individual author(s) and contributor(s) and not of MDPI and/or the editor(s). MDPI and/or the editor(s) disclaim responsibility for any injury to people or property resulting from any ideas, methods, instructions or products referred to in the content. |
© 2025 by the authors. Licensee MDPI, Basel, Switzerland. This article is an open access article distributed under the terms and conditions of the Creative Commons Attribution (CC BY) license (https://creativecommons.org/licenses/by/4.0/).