4.3. Experimental Results and Analysis
In this experiment, we used the color V–I trajectory map based on power mapping combined with the FD-2DCNN model for multi-label classification experiments. The experimental results are shown in
Table 4.
From the results in the table, it can be seen that all metrics of this method perform relatively well. The specificity and recall rate reached 99.85% and 99.50%, respectively, proving that this method can accurately identify the correct categories of appliances and has a low False Positive rate. The specificity also reached 99.95%, indicating that this method has very high accuracy for identifying categories of appliances. The F1 Macro score achieved 99.67%, demonstrating the method’s excellent comprehensive classification performance, and its average calculation time per data is only 0.88 milliseconds, showing excellent temporal performance and providing the possibility for deployment on edge computing devices. In summary, this method has excellent performance in all metrics and can perform appliance classification tasks very well.
To more intuitively show the classification performance of this method on different appliance categories, a comparison chart was drawn for visual analysis of the results.
Figure 7 is the multi-label classification confusion matrix of this experiment. From the figure, it can be seen that the model performs excellently in most appliance categories, being able to accurately identify the operating status of various categories. However, there is still some misclassification of refrigerators, lithium batteries, and other devices. Among them, the misclassification rate of the model for refrigerators is the highest. This is because when the refrigerator is working, its compressor operates periodically, leading to significant differences in features within different time segments, making it difficult for the model to distinguish.
Furthermore, as shown in the precision-recall curve of
Figure 8, the model demonstrates high precision and recall rates across most appliance categories, indicating good classification performance. However, the recall rate for certain appliance categories, such as refrigerators, is relatively low. This is due to the unstable operating state of refrigerators; when the compressor is not activated, the model cannot correctly identify it.
Figure 9 shows the model’s misclassification rates across different appliance categories. It can be observed that the overall misclassification rate of the model is relatively low across all categories. However, the misclassification rate for refrigerators is relatively high, indicating that there is still room for improvement in the model’s classification performance for refrigerators.
Overall, the model performs excellently across all categories, being able to correctly classify most appliances. There are misclassifications only in certain appliance categories where the electrical signal characteristics change significantly during operation, such as refrigerators. Additionally, the model also demonstrates excellent temporal performance, with an average calculation time of only 0.88 milliseconds per sample on the experimental platform, making it possible to deploy on edge computing devices.
To verify the effectiveness of our method, we conducted ablation experiments to validate the contribution of each component. The overall results are shown in
Table 5.
From the overall ablation experiment results, it is evident that different feature expression methods and feature fusion methods have a significant relationship with model performance. When using the V–I trajectory map as the feature expression method, all performance metrics are at the lowest level. After switching to the color V–I trajectory map, due to its inclusion of more features compared to the traditional V–I trajectory map, there is a certain improvement in performance metrics, especially the F1 Macro score, which increased from 99.17% to 99.54%, proving the effectiveness of the proposed color V–I trajectory map method based on power mapping. When introducing the spectrum map as another feature input to the model, both the V–I trajectory map and the color V–I trajectory map show a slight decrease in performance compared to methods that do not include the spectrum map. Although it is generally expected that introducing richer features should enhance model performance, the spectrum map and the V–I trajectory map do not belong to the same type of feature, and forced fusion leads to mutual interference, increasing feature redundancy and affecting overall performance. However, after incorporating the SE module, the performance of both the traditional V–I trajectory map combined with the spectrum map and the color V–I trajectory map combined with the spectrum map improved compared to using only the two types of V–I trajectory maps, with the F1 Macro score increasing from 99.17% to 99.25% for the traditional V–I trajectory map and from 99.54% to 99.67% for the color V–I trajectory map, proving the effectiveness of the spectrum map in enhancing performance. Moreover, compared to the methods without the SE module, the performance of the V–I trajectory map combined with the spectrum map and the color V–I trajectory map combined with the spectrum map significantly improved after adding the SE module, proving the effectiveness of the SE module.
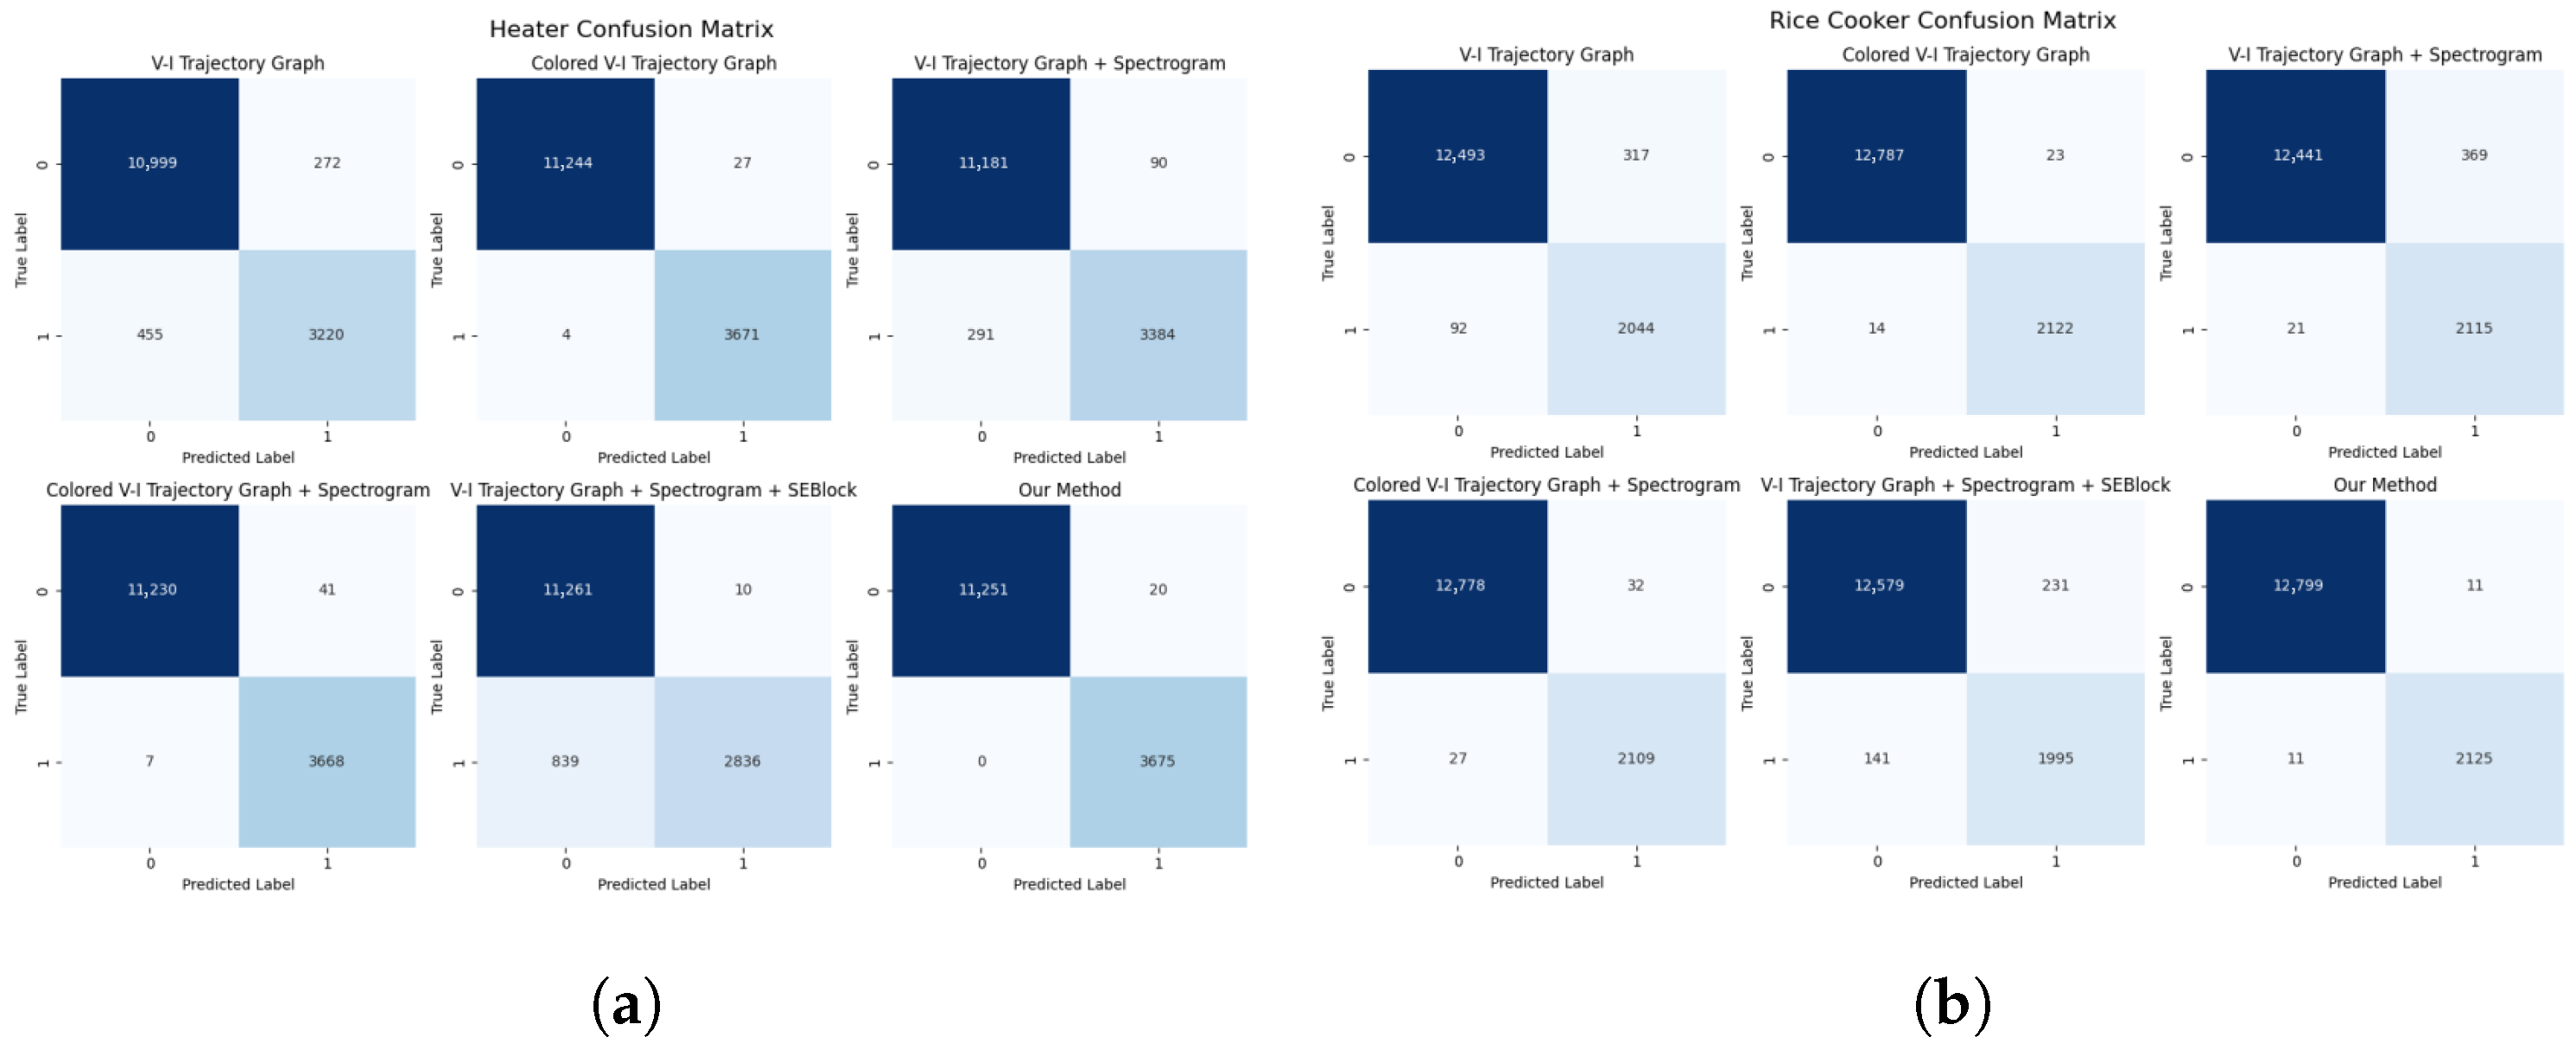
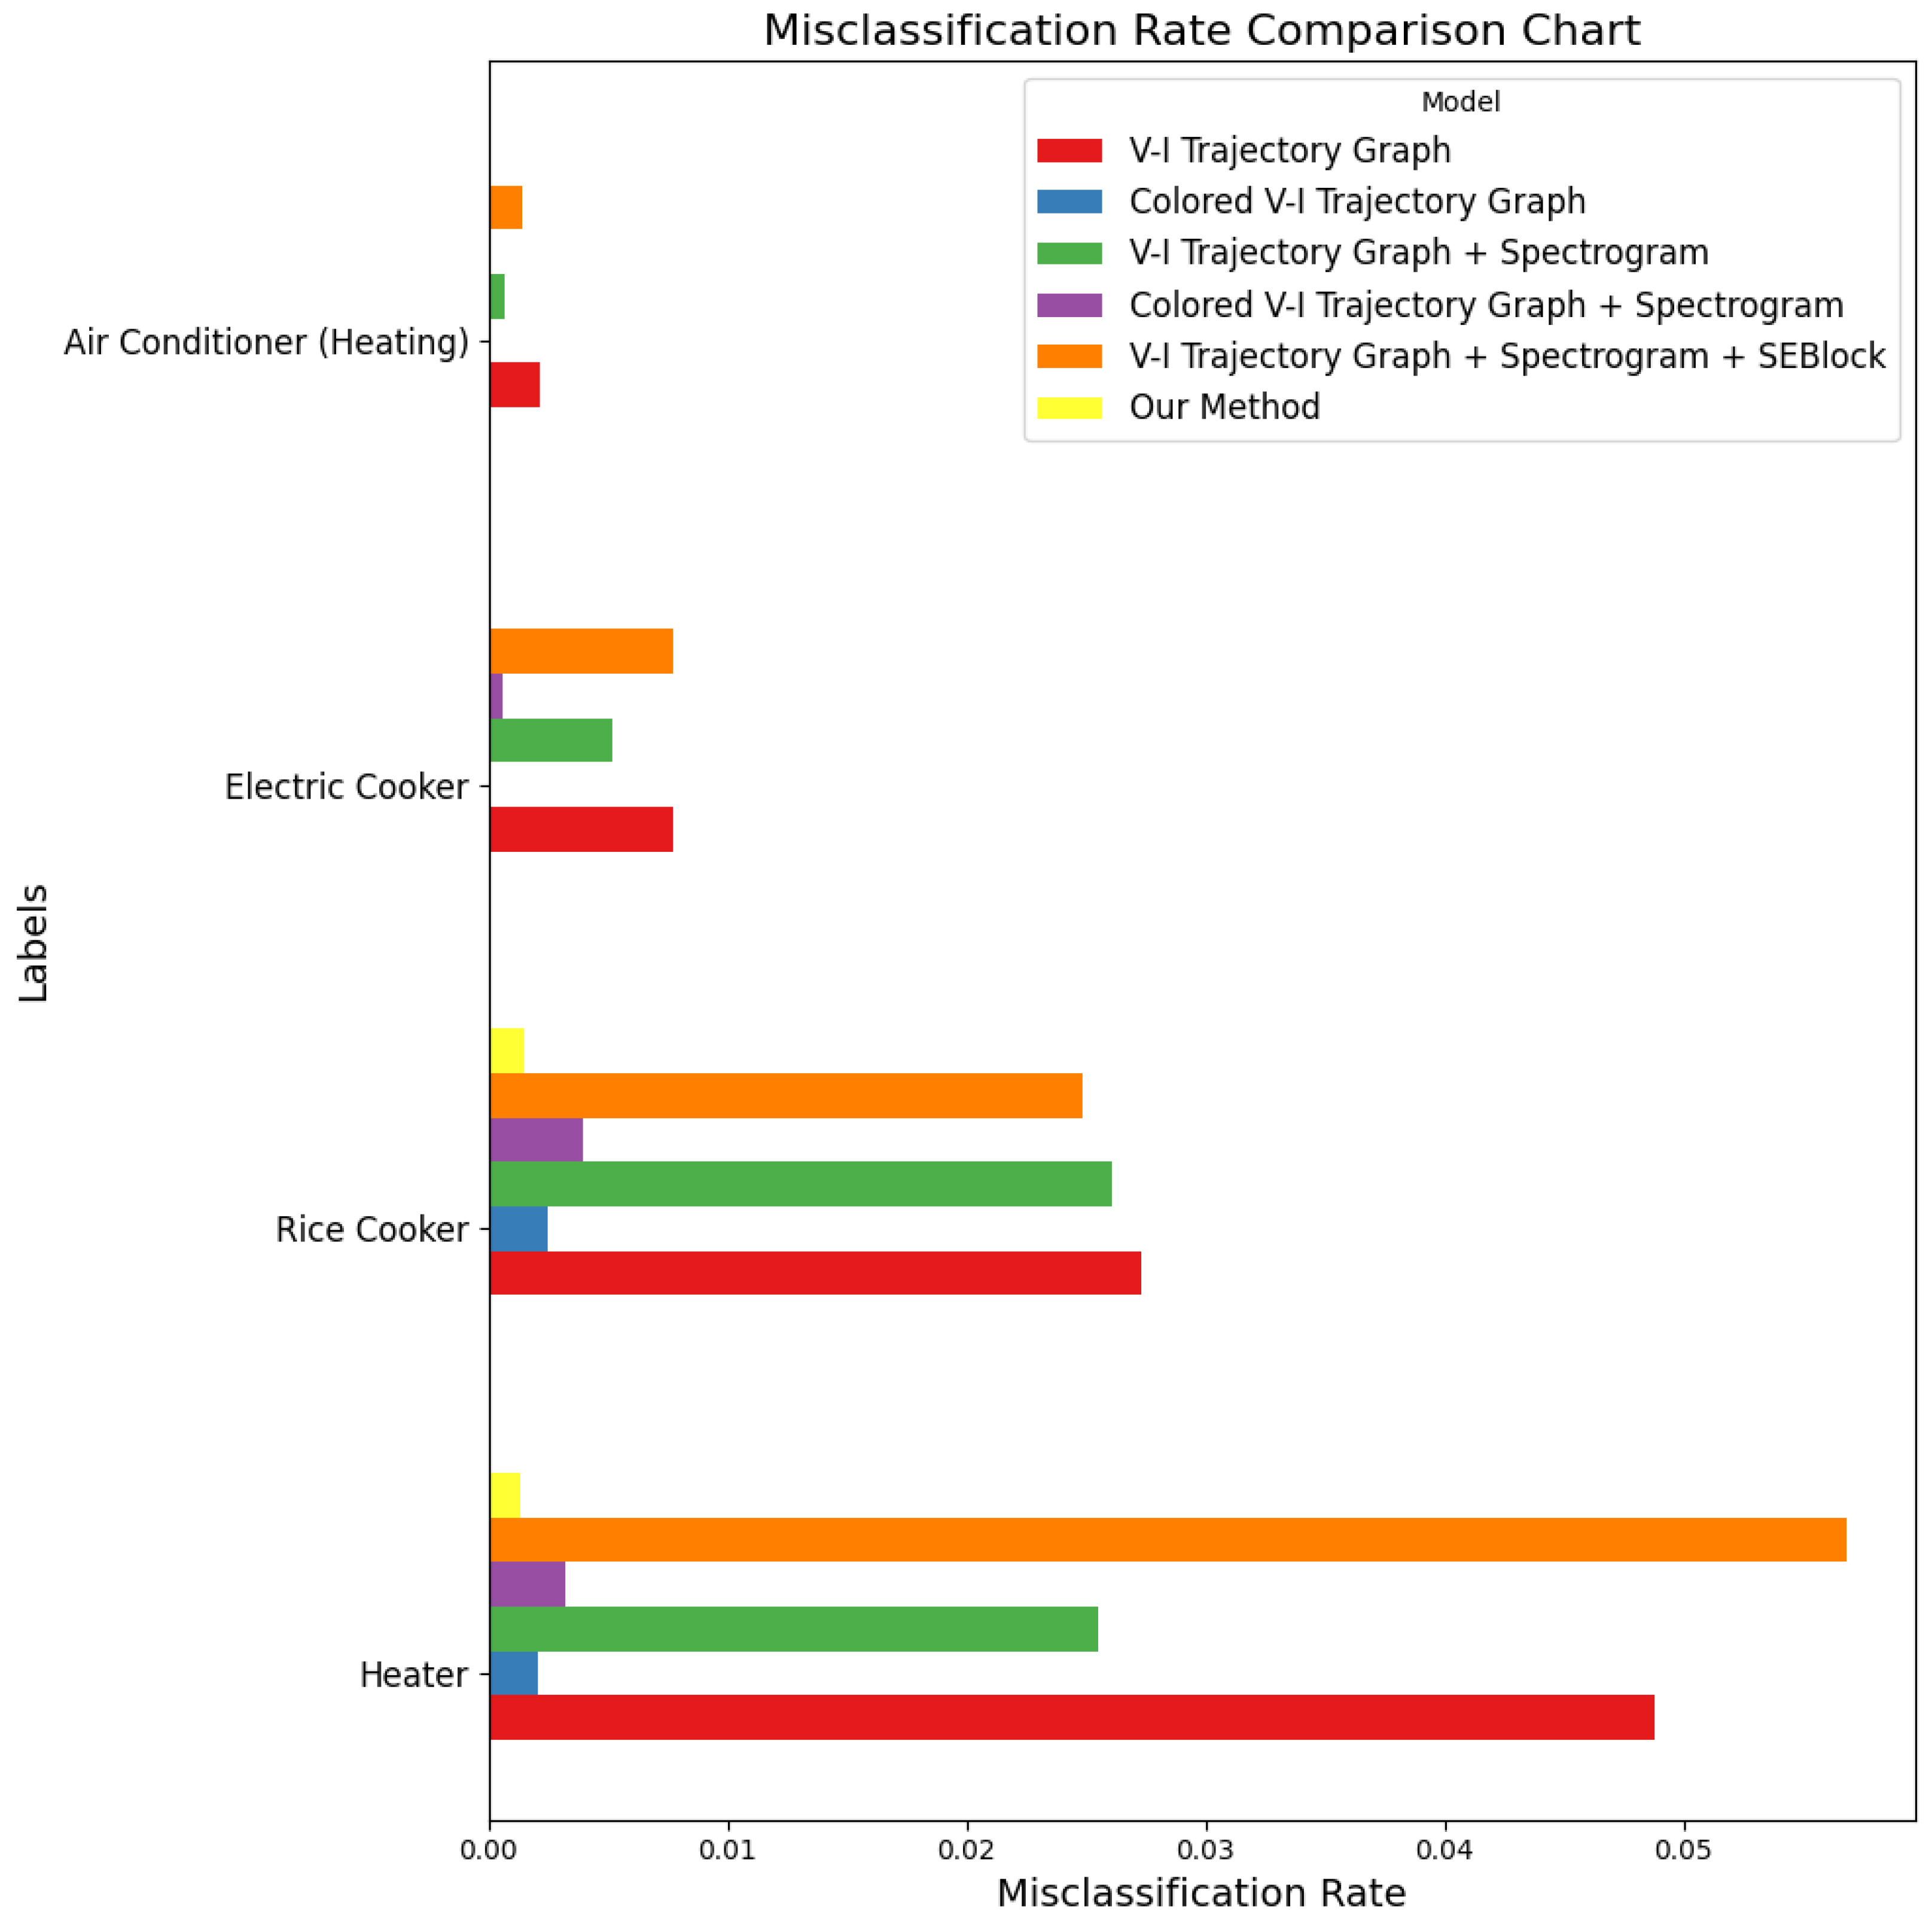
To more intuitively compare the impact of each ablation scheme on performance, the experiment compared the average confusion matrix, precision-recall curve, and misclassification rate diagram of different schemes.
Figure 10 shows the average confusion matrix corresponding to different schemes. It is evident from the figure that as the input features and fusion strategies are gradually optimized, the misclassification phenomenon gradually decreases.
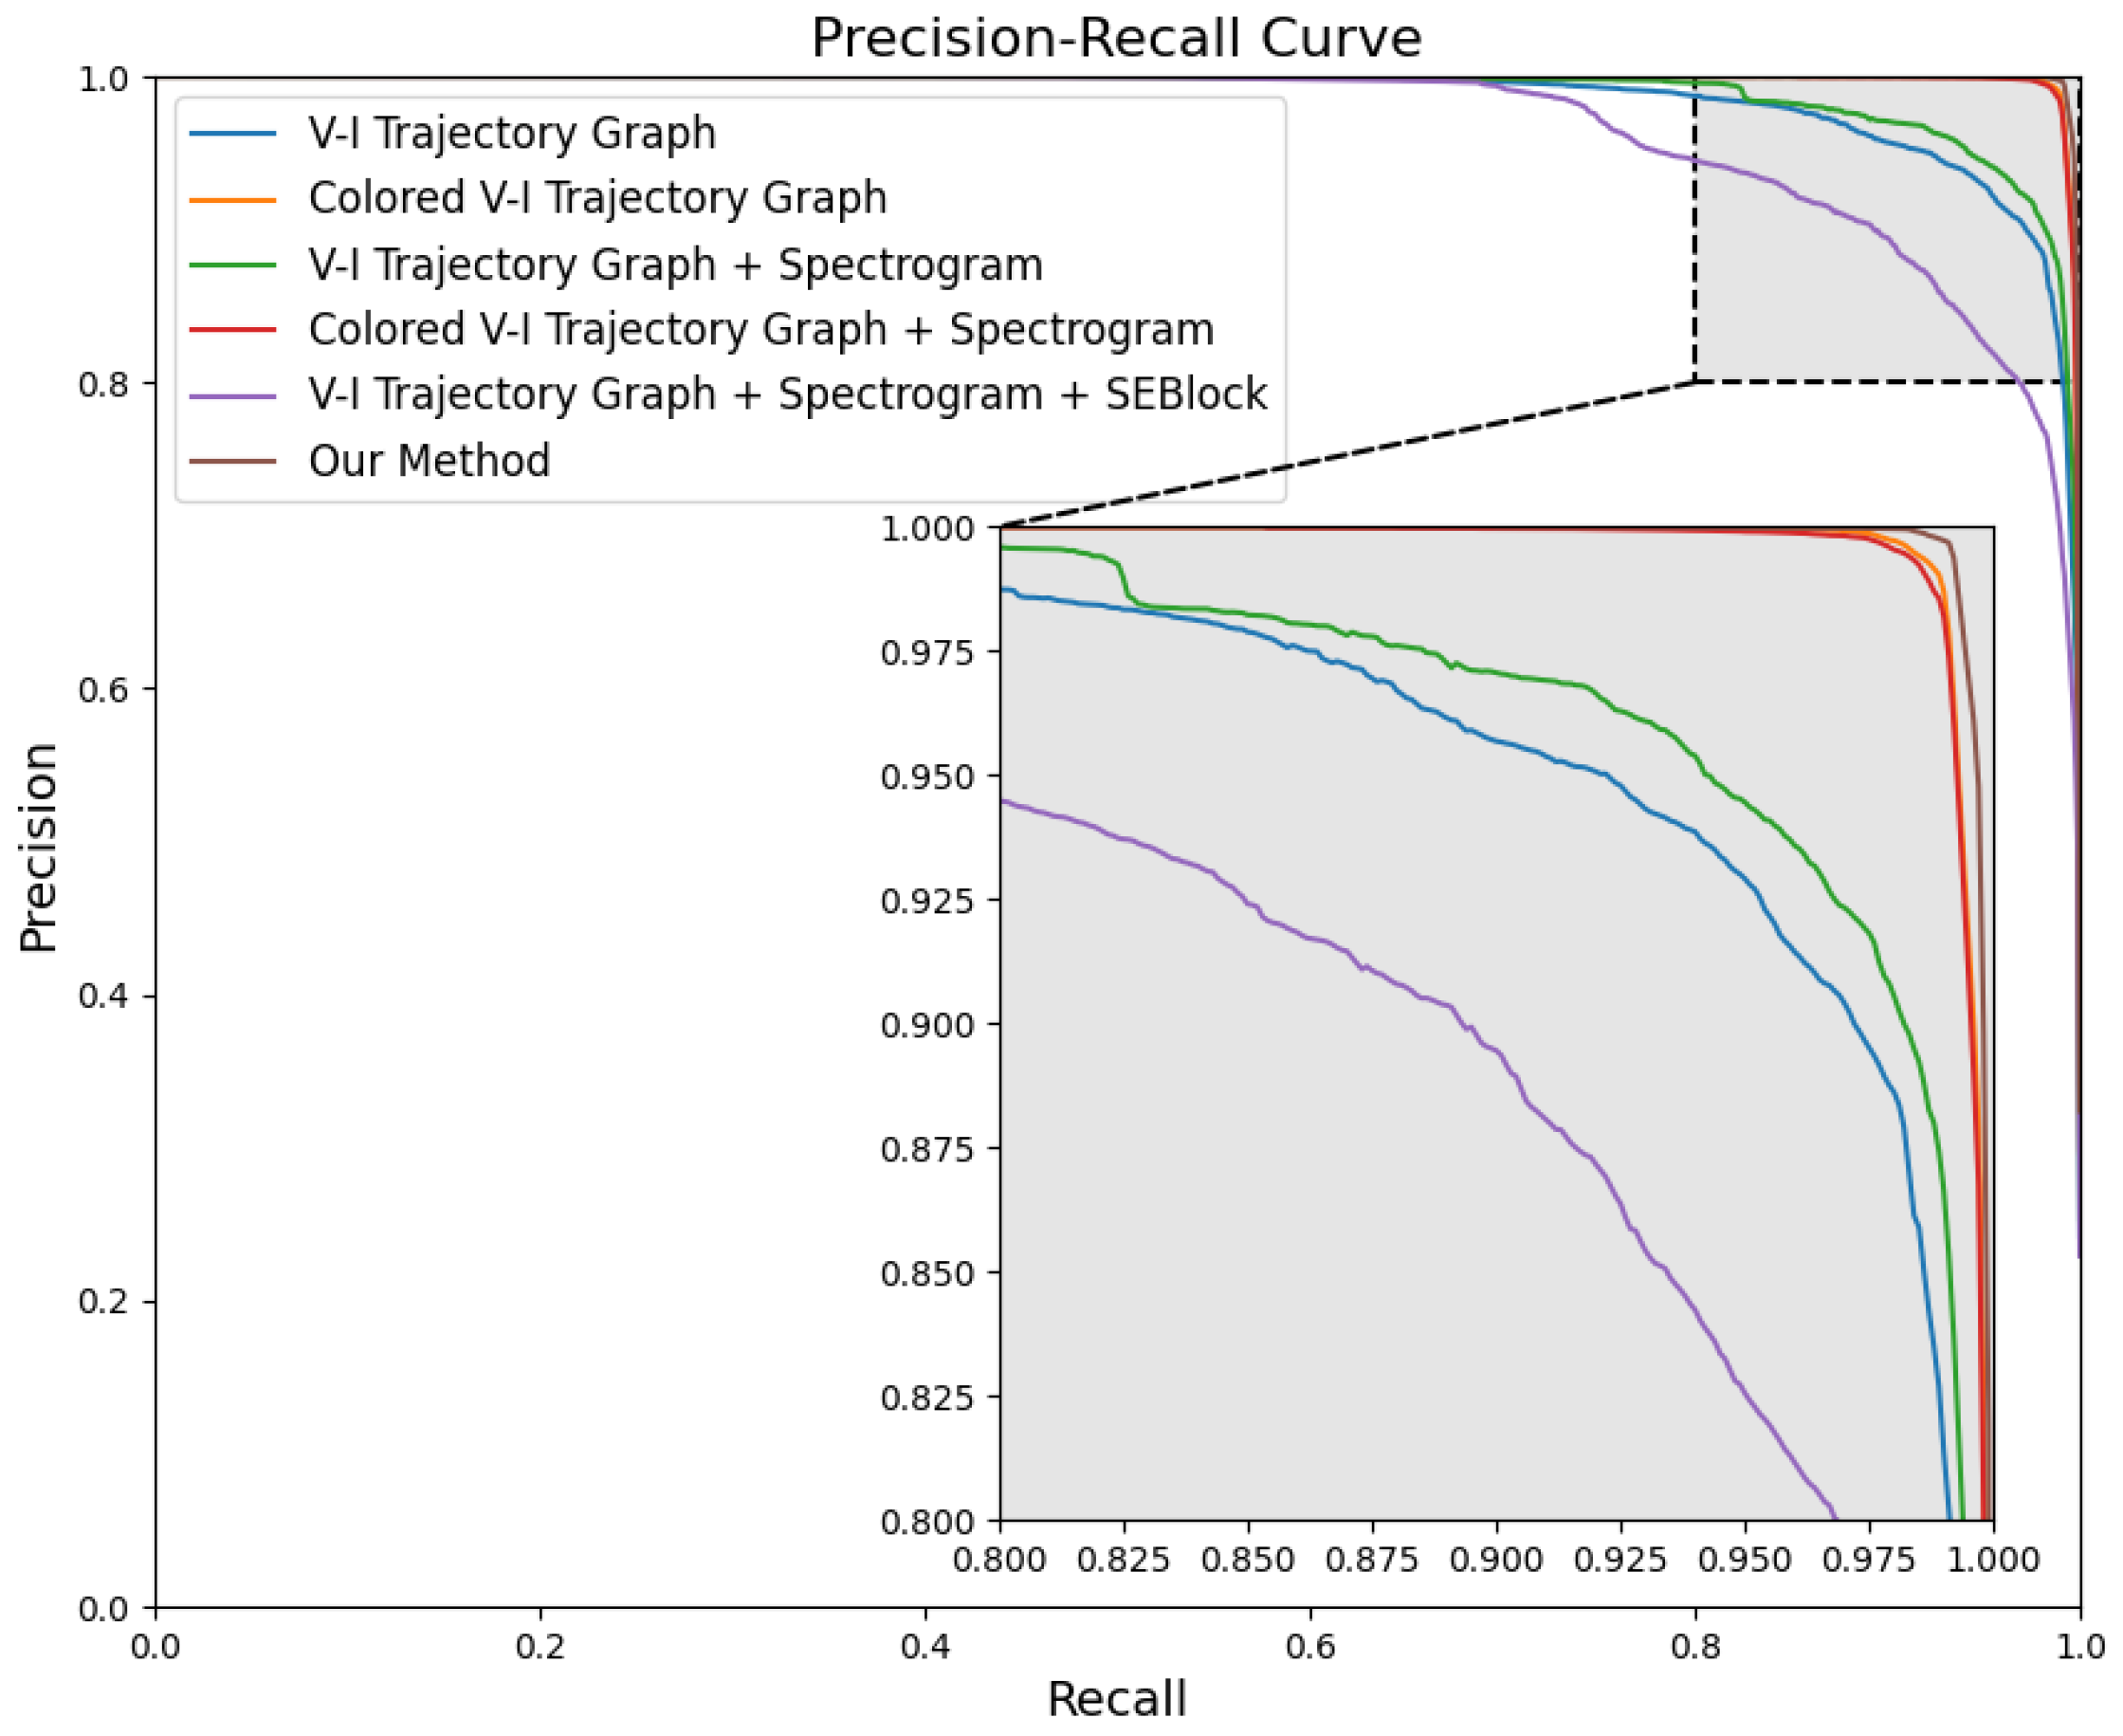
Figure 11 presents the precision-recall curves for each ablation scheme. For precision-recall curves, the larger the area enclosed by the curve and the coordinate axes, the better the performance. From the performance of the curves, it can be seen that our method has the largest curve area, indicating the best performance, which proves the effectiveness of our method.
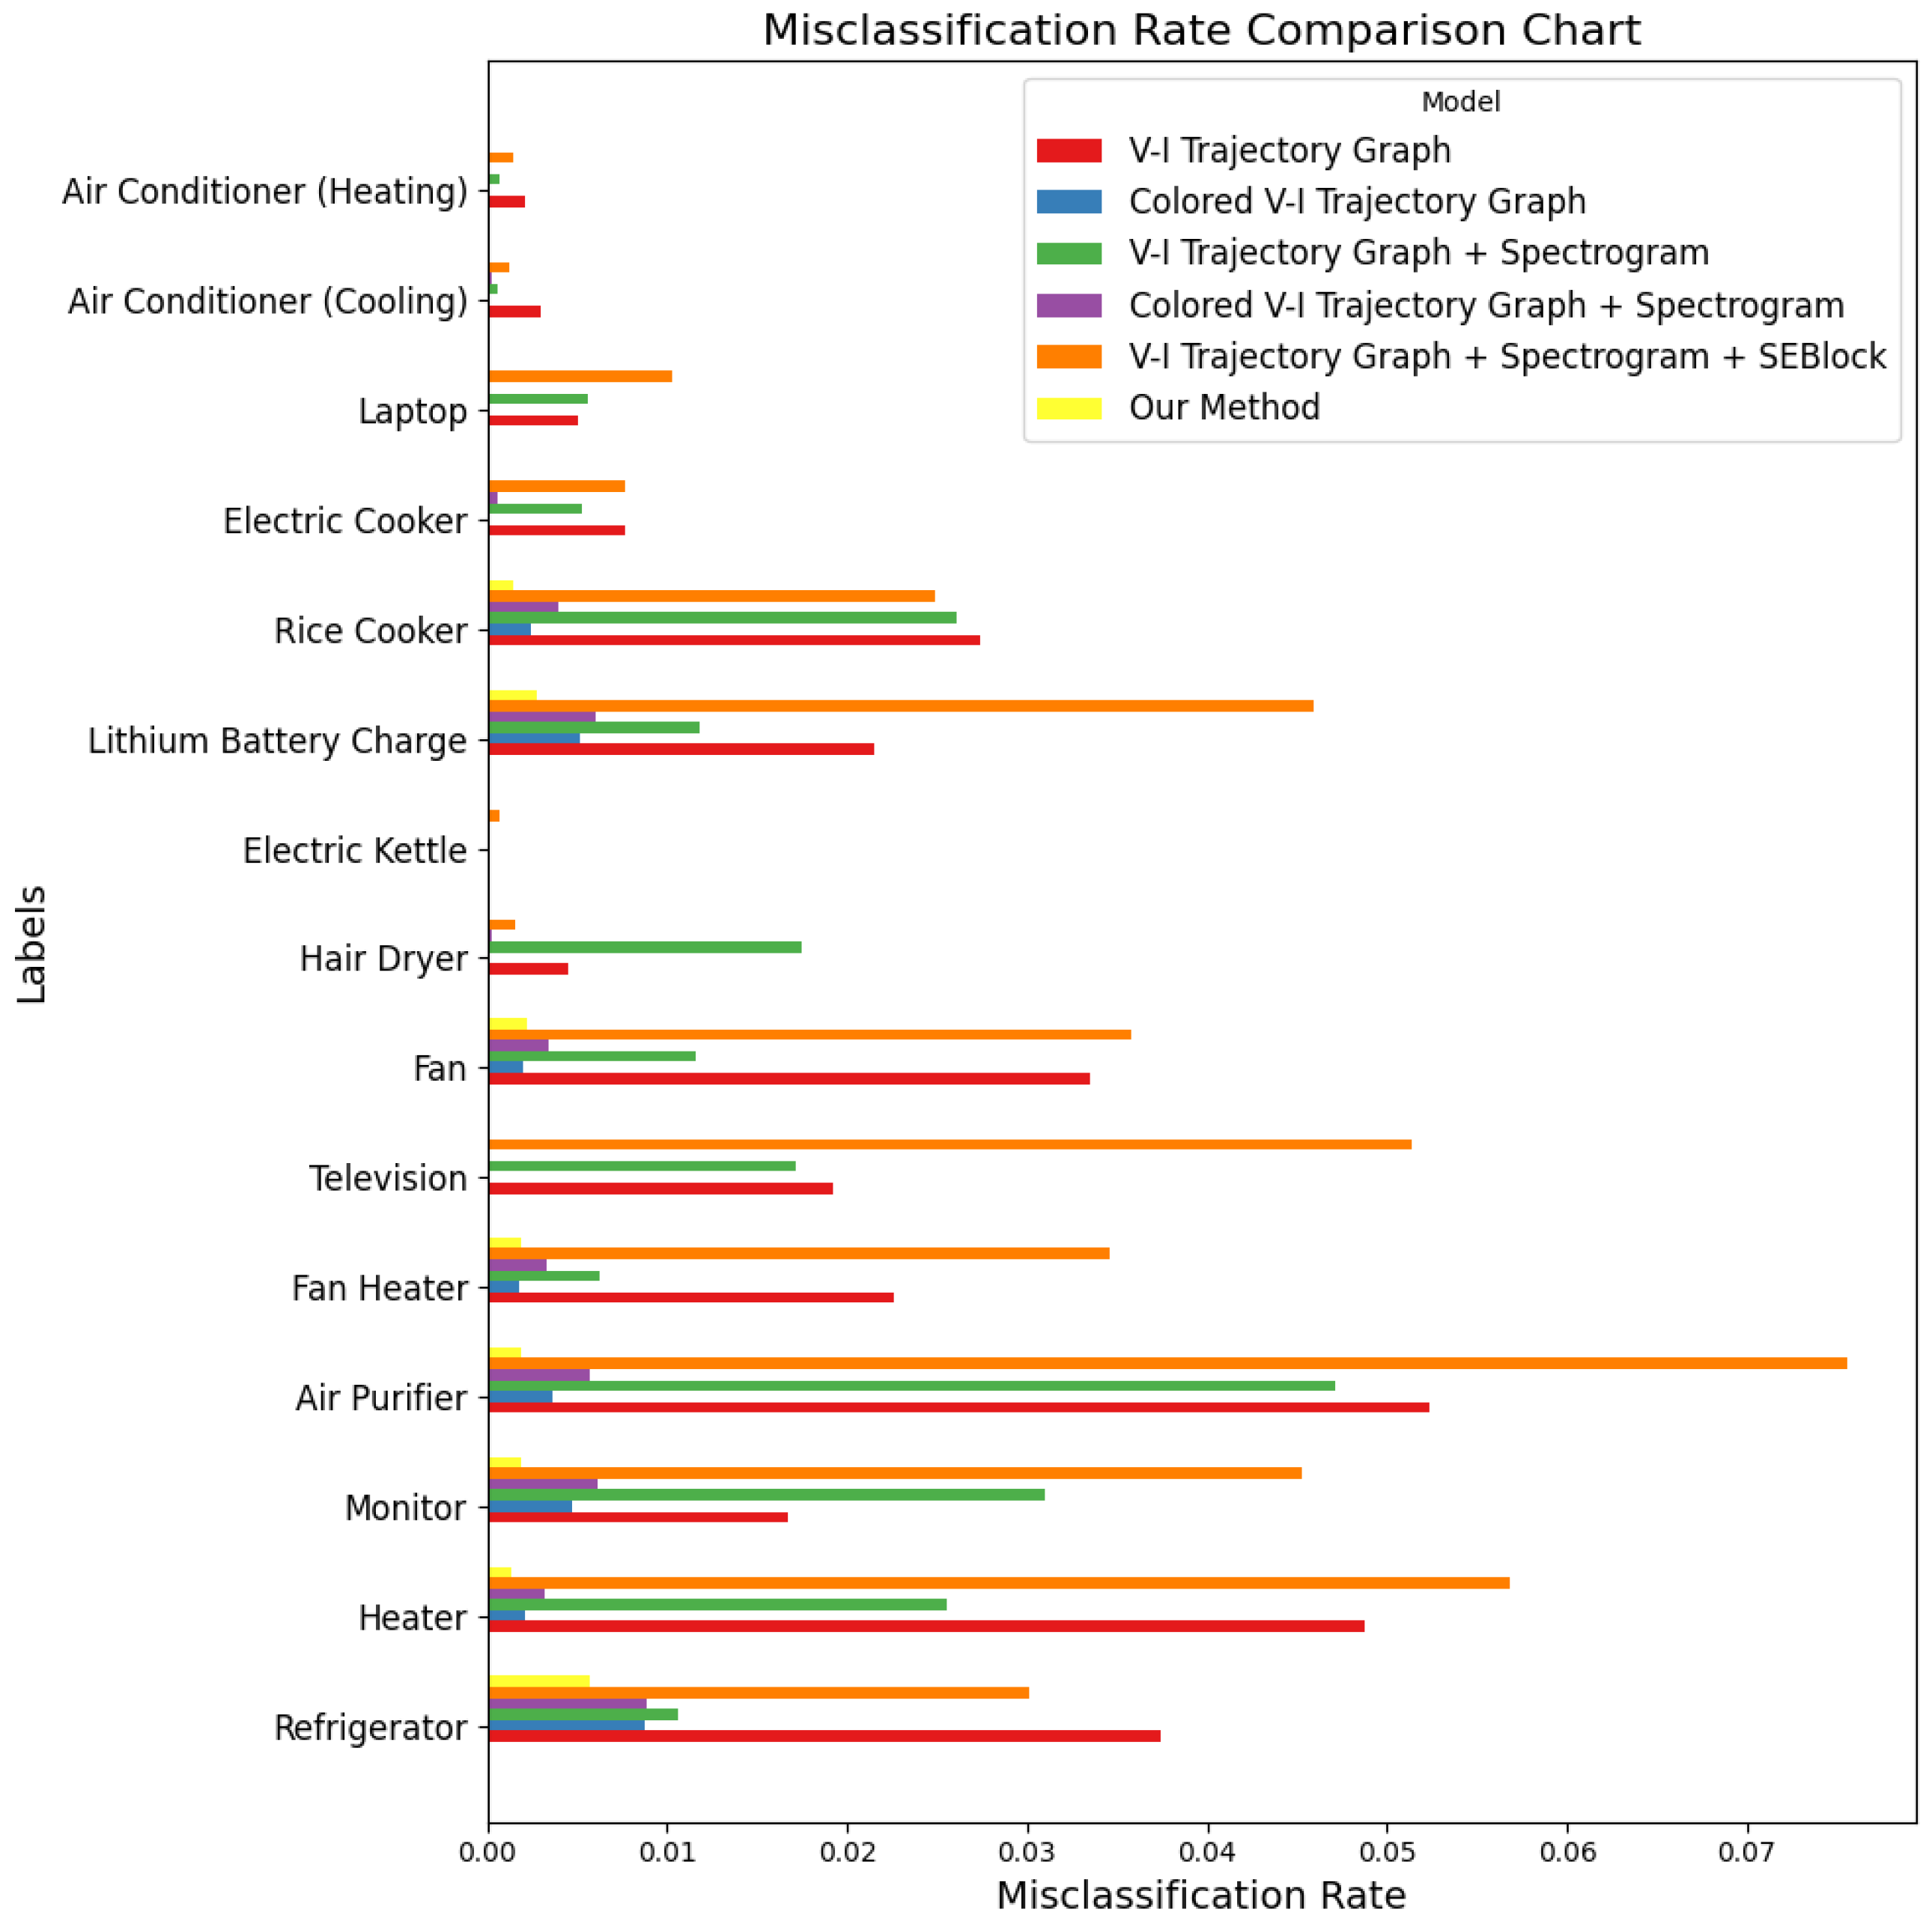
Figure 12 shows a comparison of misclassification rates for different ablation schemes. It is evident that our method has the lowest misclassification rate across various appliance categories, significantly outperforming the other ablation schemes, further demonstrating the effectiveness of our method.
To further evaluate the effectiveness of our method in classifying devices with similar load characteristics, an ablation analysis was conducted on heat-generating appliances—electric heaters (Category 1), rice cookers (Category 10), electric steamers (Category 11), and air conditioning heating (Category 14). The impact of different feature inputs and feature fusion methods on classification performance was observed. The experiment used three metrics: precision, recall, and F1 score. The results are shown in
Table 6.
Figure 13,
Figure 14,
Figure 15 and
Figure 16 further demonstrate the performance of each ablation scheme on these heating appliances. Through these charts, the classification capabilities of each method can be seen more clearly.
It can be seen that when only using the V–I trajectory as input, some appliances with similar power consumption patterns (such as rice cookers and electric heaters) exhibit confusion, and their F1 Macro score is significantly lower than other categories. This indicates that relying solely on the features provided by the V–I trajectory is insufficient to accurately distinguish appliances with similar power consumption and the same load type. After using the colored V–I trajectory as a feature expression method, it can be observed that the classification performance has significantly improved compared to the V–I trajectory. The recall rate for rice cookers increased from 98.50% to 99.34%, and the F1 Macro score also increased to 99.14%, with the classification performance of air conditioning reaching the best level. This demonstrates that after adding power consumption features, the colored V–I trajectory has improved the model’s ability to distinguish similar loads, proving the effectiveness of this contribution.
After adding the frequency spectrum as the second input to the model, the results were consistent with the overall ablation experimental results, and the model’s performance on each category fluctuated. The F1 Macro score for rice cookers dropped to 96.77%, and the recall rate also decreased to 98.92%. The recall rate for electric kettles dropped significantly to only 82.48%. This was also due to the interference caused by the direct integration of features of two different types. When using the colored V–I trajectory and frequency spectrum as model inputs, although the overall classification performance improved compared to the traditional V–I trajectory combined with the frequency spectrum, there was still a slight decrease in performance compared to using only the colored V–I trajectory.
After the inclusion of the SE module, the performance of the schemes using frequency spectrum diagrams compared to those not using them showed a certain improvement, which verified the effectiveness of frequency spectrum diagrams in enhancing the classification performance of appliances with similar load characteristics. Moreover, after adding SEBlock, the performance of the schemes compared to direct integration showed a significant improvement, proving the effectiveness of SEBlock in dynamically adjusting feature weights.
The results of the above ablation experiments indicate that for this method, using colored V–I trajectories, introducing frequency spectrum diagrams as secondary input features, and dynamically adjusting each feature weight through the SE module improves the model’s performance in load classification tasks and verifies the effectiveness of each contribution.
To further verify the effectiveness of this method, a comparison was made with traditional deep learning models. The same dataset and evaluation metrics were used, and the input features of the traditional models all used colored V–I trajectories. The evaluation metrics included precision (Precision), recall (Recall), specificity (Specificity), accuracy (Accuracy), and F1 Macro score. For the detailed experimental results, see
Table 7.
Figure 17,
Figure 18 and
Figure 19 represent the average confusion matrix, precision-recall curve, and misclassification rate curve for different models, respectively. Through these figures, the differences in classification performance between different models can be more intuitively observed.
From the results, it can be seen that ResNet10, as a lightweight network, still has certain applicability for processing V–I trajectory images, which are not very complex in terms of features, and has relatively good classification performance, with an F1 Macro score reaching 97.16%. Although its overall performance is not advantageous compared to other models, especially the relatively low accuracy (only 92.27%), the misclassification rate chart shows that the misclassification rate of the ResNet10 model is generally at a lower level across all categories, except for air purifiers. This indicates that it can extract features needed for appliance classification relatively well, but compared to our method, there is still a significant performance gap.
After further increasing the network depth, the performance of ResNet18 compared to ResNet10 improved, with the F1 Macro score increased to 98.99%, and the misclassification rates for all categories decreased compared to ResNet10.
For the ResNet50 and DenseNet121 networks with a larger number of parameters, the additional parameters did not bring significant performance improvements. On the contrary, the precision rate of DenseNet121 is lower than that of ResNet18, and its precision-recall curve is the worst among all methods. Despite having a relatively high F1 Macro score of 99.59% (second only to our method), even ResNet50 has high misclassification rates across all categories, indicating that an excessive number of parameters in V–I trajectory identification can lead to overfitting.
VGG16 and GoogLeNet, as classic convolutional neural network models, also perform well in tasks that require the extraction of multi-scale features from V–I trajectory images. Benefiting from the depth of VGG16, it has outstanding performance in terms of accuracy and specificity, with a specificity of 99.96%, but its F1 Macro of 99.18% is slightly lower than other models, indicating a certain disadvantage compared to our method. GoogLeNet, with the help of Inception modules, provides multi-scale feature extraction capabilities, achieving a recall rate of 99.46%, and its F1 Macro of 99.58% is only slightly lower than the 99.59% value of ResNet50. It also shows good performance in misclassification rate charts, second only to our method.
Finally, our method, by incorporating power-mapped colored V–I trajectory images and combining them with the proposed FD-2DCNN model, integrates V–I trajectory feature extraction modules and frequency domain feature extraction modules. By introducing an attention mechanism, the overall performance is optimized. It can be seen that our method leads other models in terms of precision, recall, and F1 Macro, and it also has the best performance in misclassification rates across all categories, verifying its superiority and reliability in classification tasks.
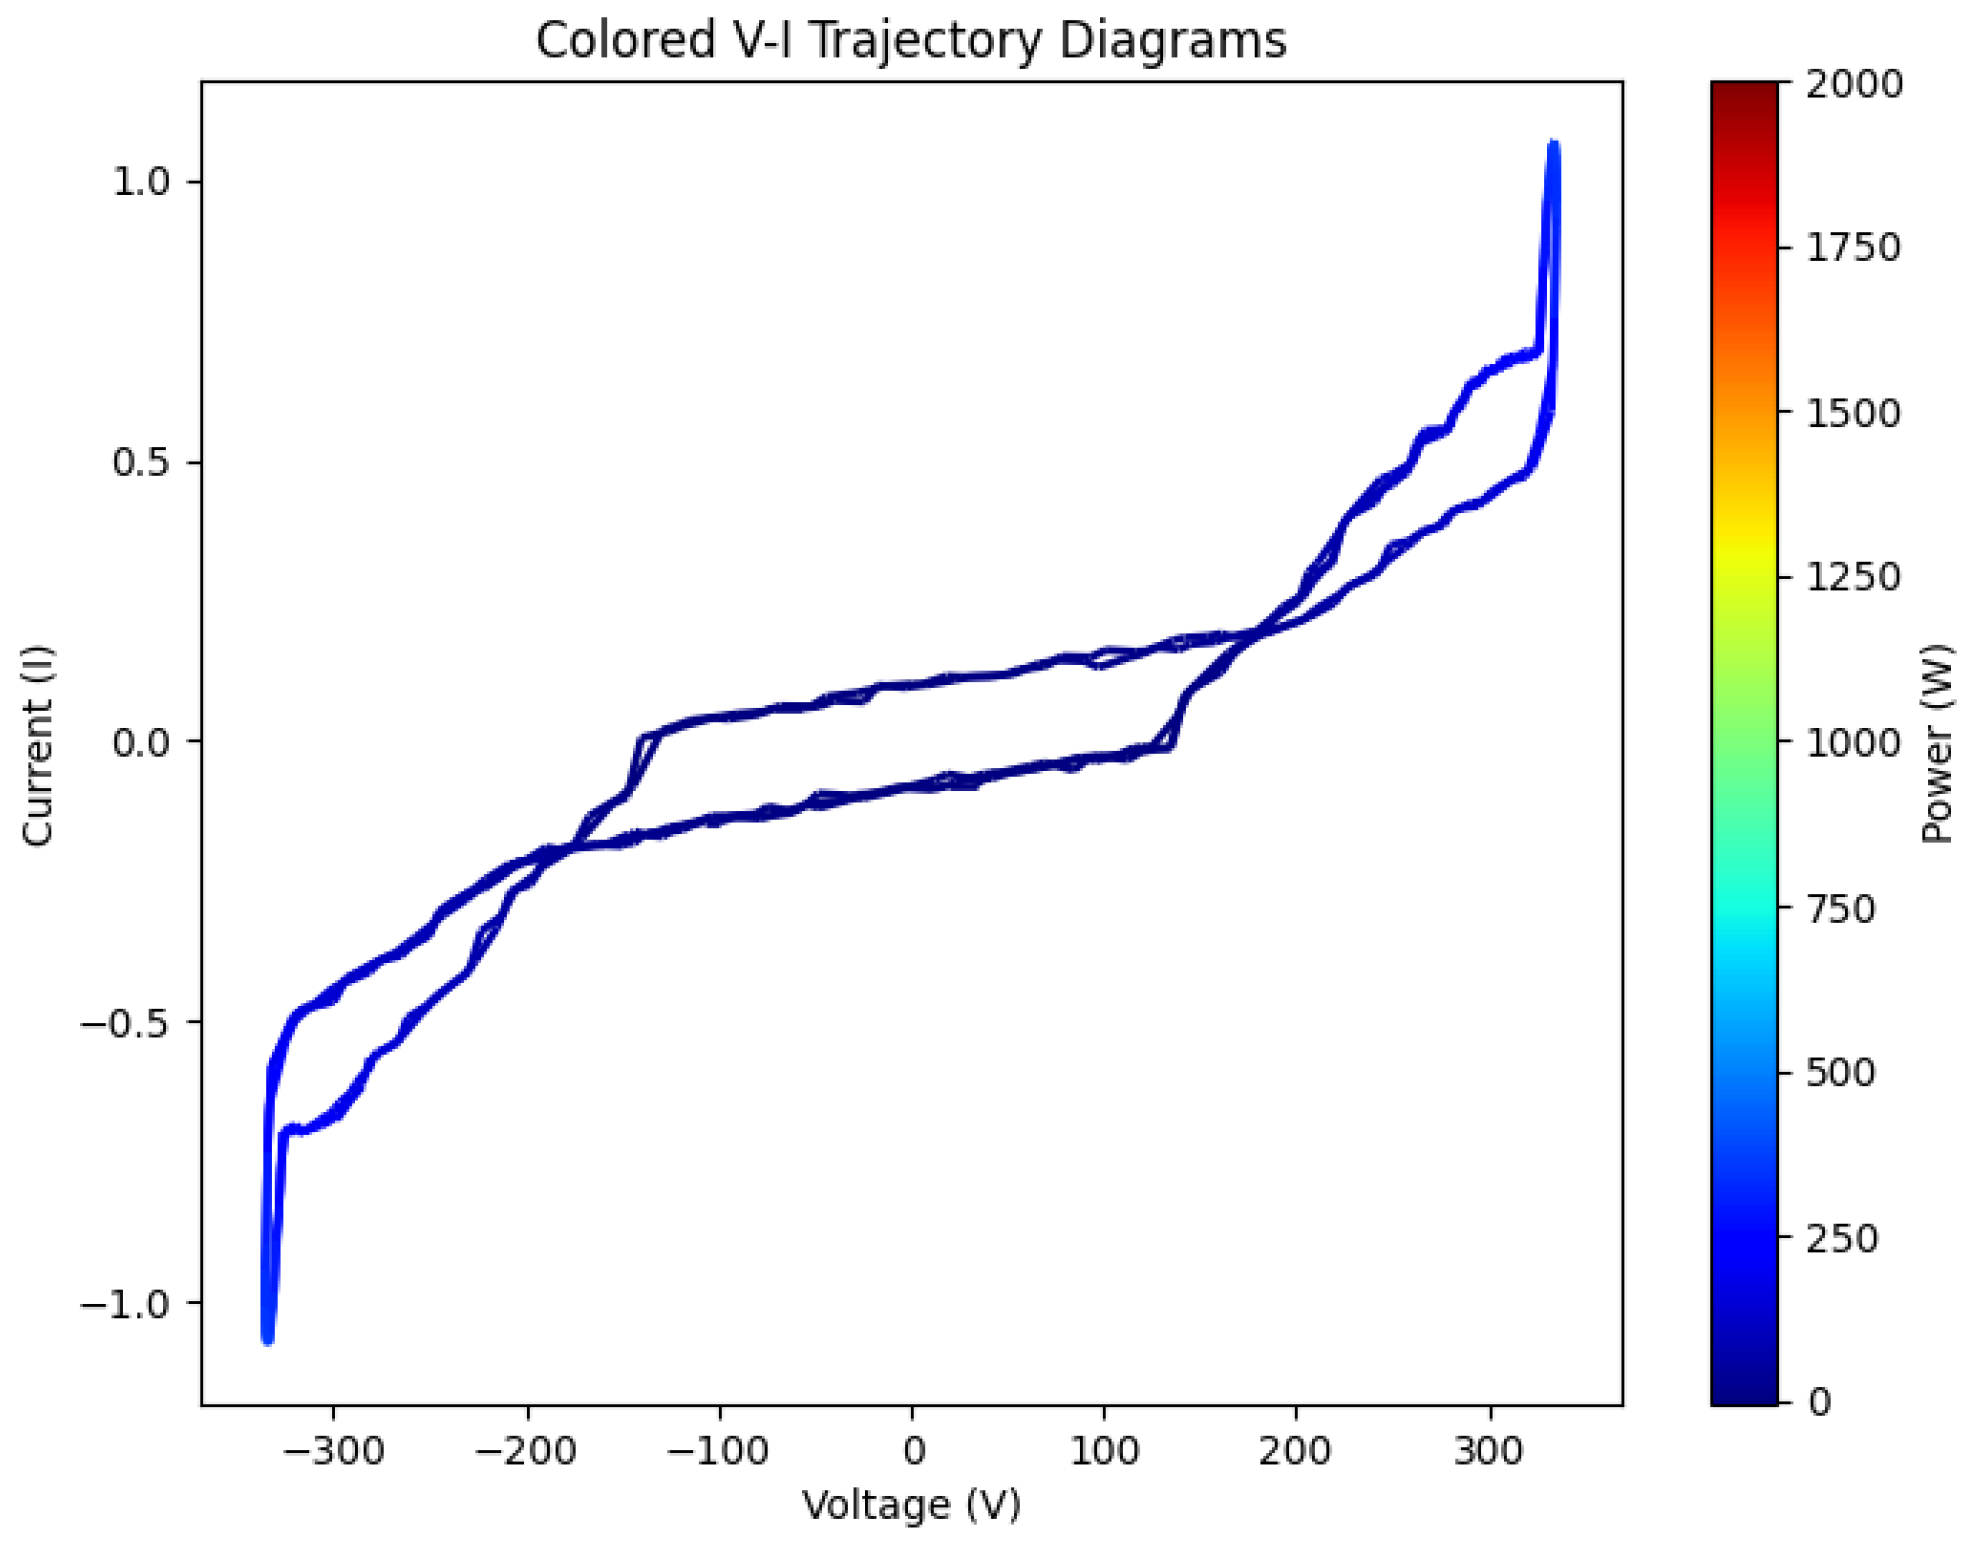
This chapter proposes a non-intrusive load monitoring method based on power-mapped colored voltage–current (V–I) trajectory diagrams. By adding a method of color mapping based on the magnitude of instantaneous power to the traditional V–I trajectory diagrams, the feature expression is enhanced. Additionally, spectrum diagrams and channel attention mechanisms are incorporated to further improve the richness and expression of features, thereby enhancing recognition performance. In response to the shortcomings of existing public datasets, a high-frequency household appliance current voltage dataset was constructed, and experiments were conducted on this dataset, verifying the method’s advantage in classifying appliances with similar load characteristics.
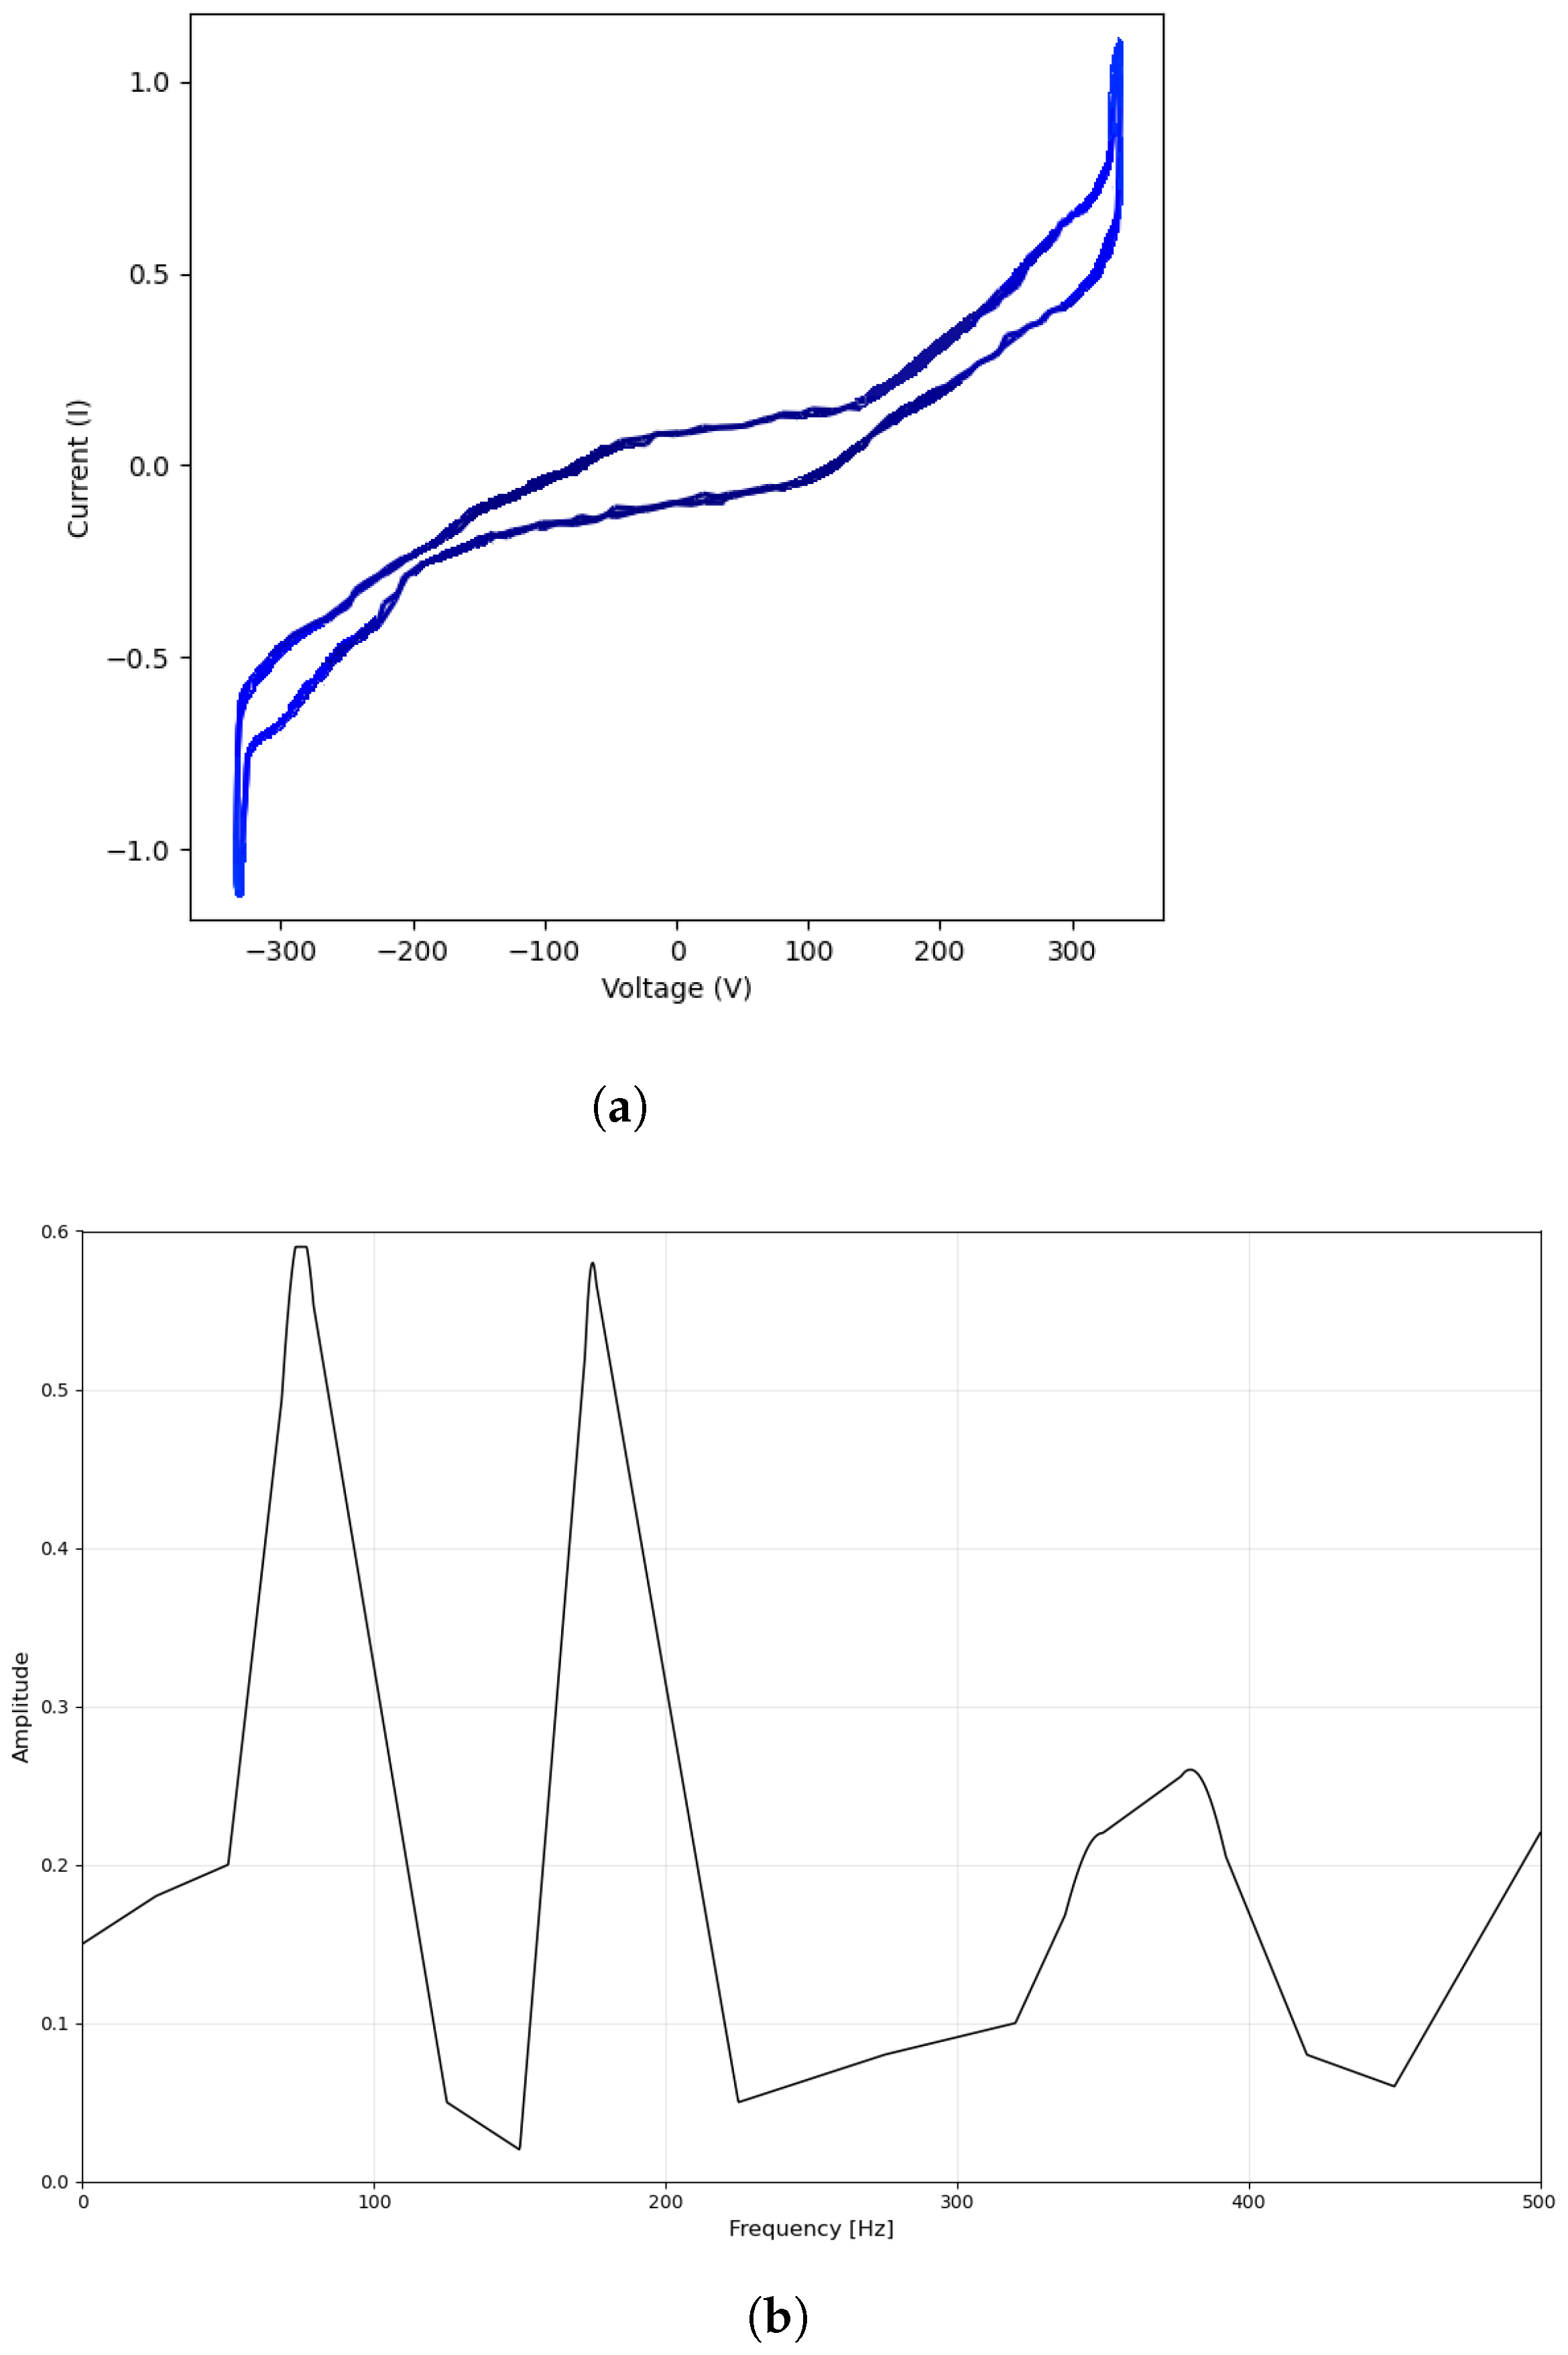
The FD-2DCNN model demonstrates outstanding performance in 15 appliance classification tasks, achieving an F1 score of 99.67%, significantly outperforming the general image classification performance of ResNet and GoogLeNet in the literature. The reasons for this are as follows: first, it employs dual-modal inputs (128 × 128 × 3 color V–I trajectory images and 128 × 128 × 1 spectrograms), integrating both time-domain and frequency-domain features. Compared to the single-image inputs used by ResNet and GoogLeNet, this approach enables a more comprehensive capture of the electrical characteristics of appliances. Second, the channel attention mechanism (SE module) dynamically adjusts the weights of time-domain and frequency-domain features, optimizing feature fusion. In contrast, the residual connections ResNet and the Inception module of GoogLeNet are primarily designed for general image features and lack targeted optimization for NILM-specific electrical features. Finally, FD-2DCNN, combined with bilinear interpolation preprocessing to ensure high-quality inputs, strikes a balance between computational efficiency and performance. Therefore, through customized dual-modal feature extraction and attention mechanisms, FD-2DCNN significantly enhances classification accuracy and robustness in NILM tasks, surpassing traditional models such as ResNet and GoogLeNet.
