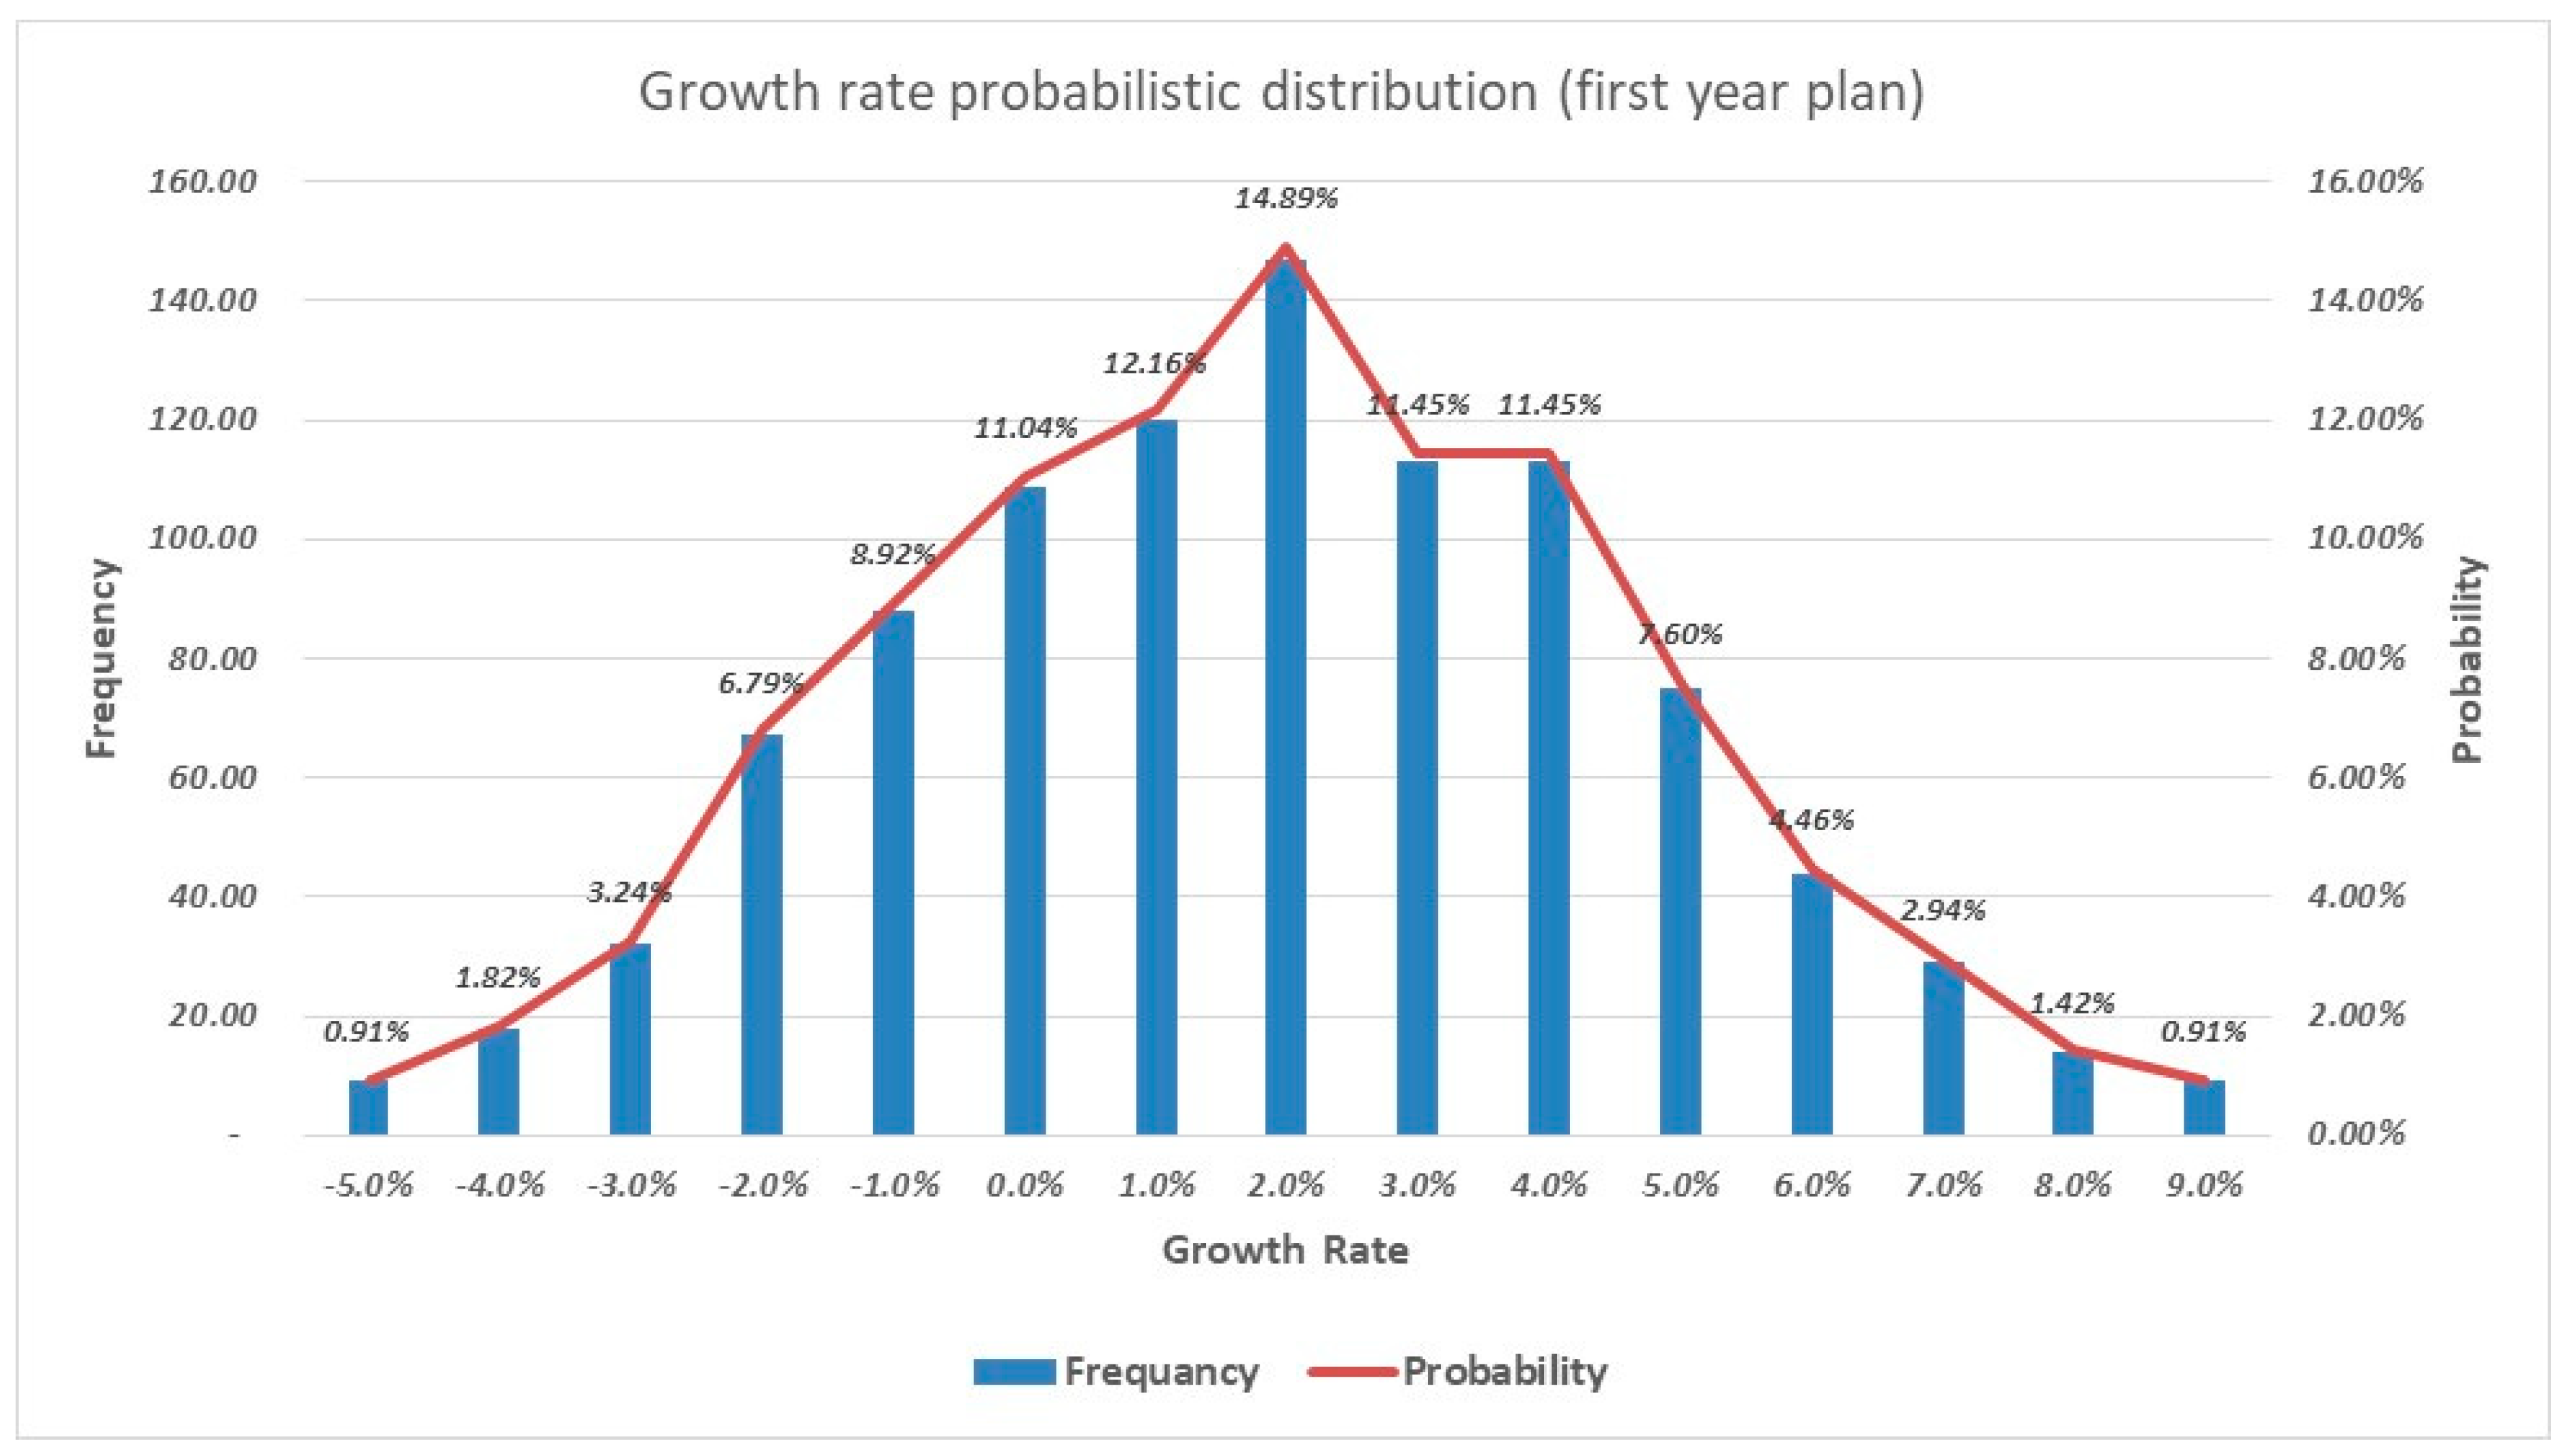
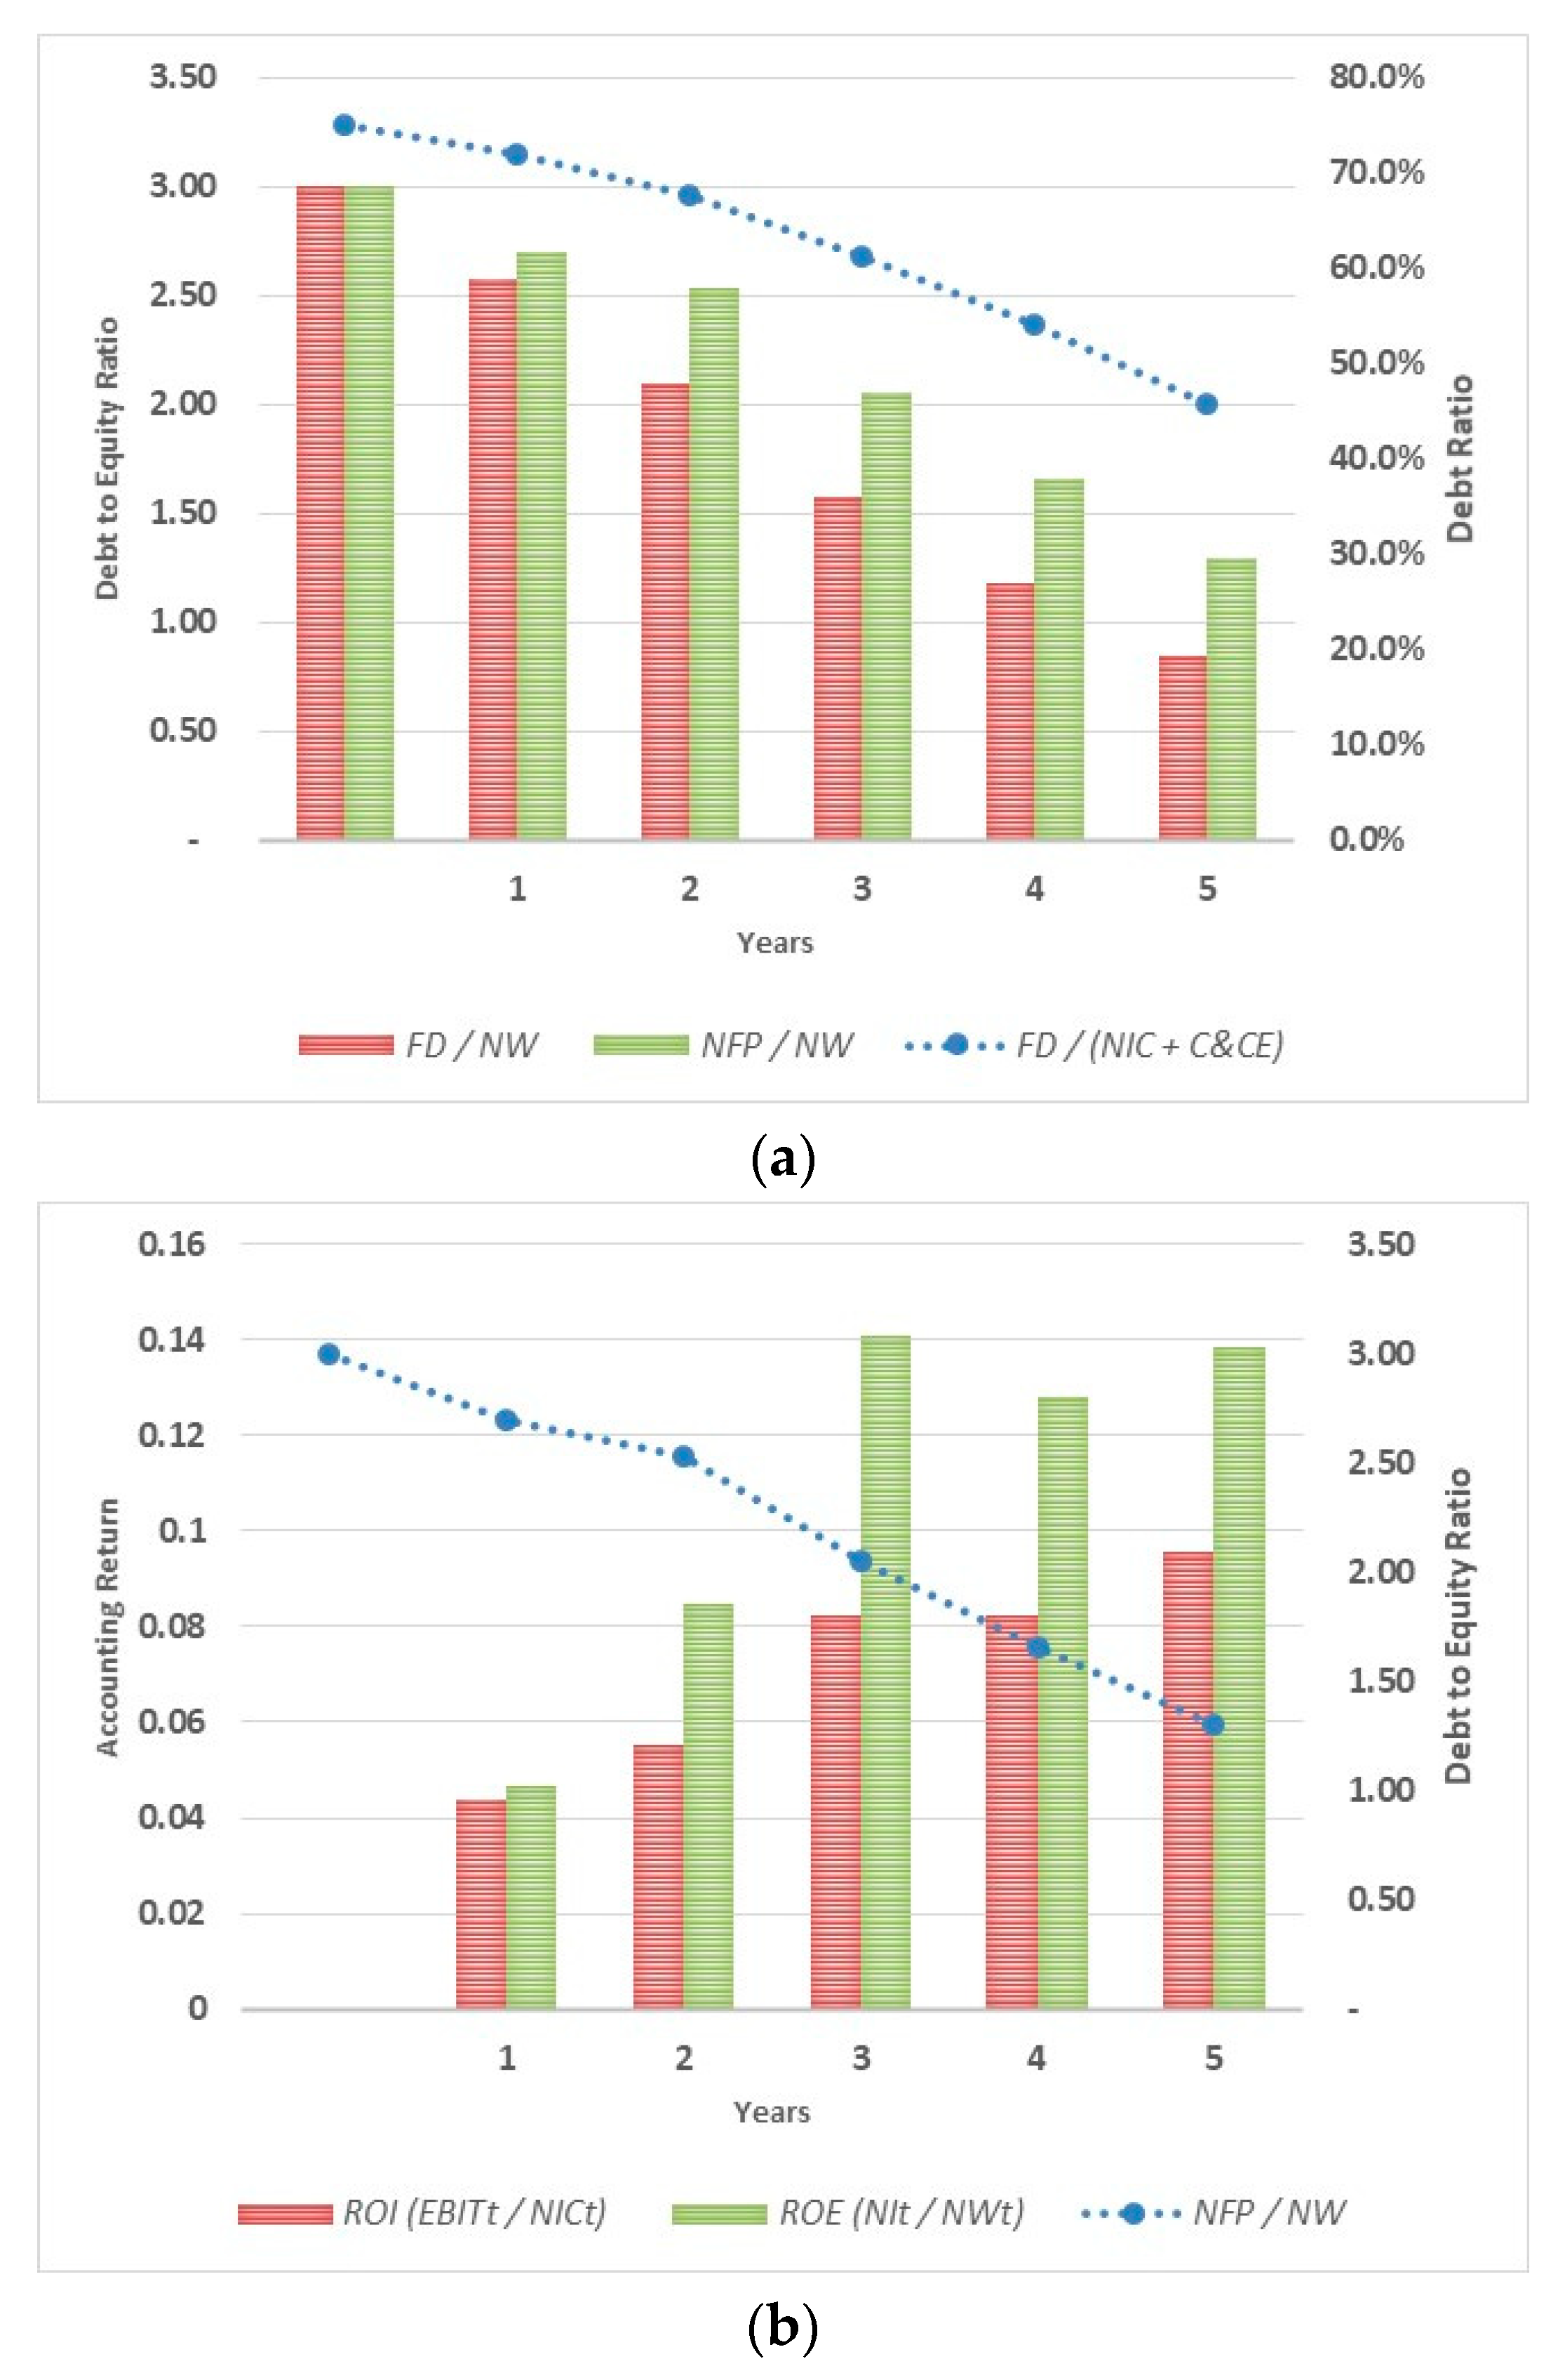
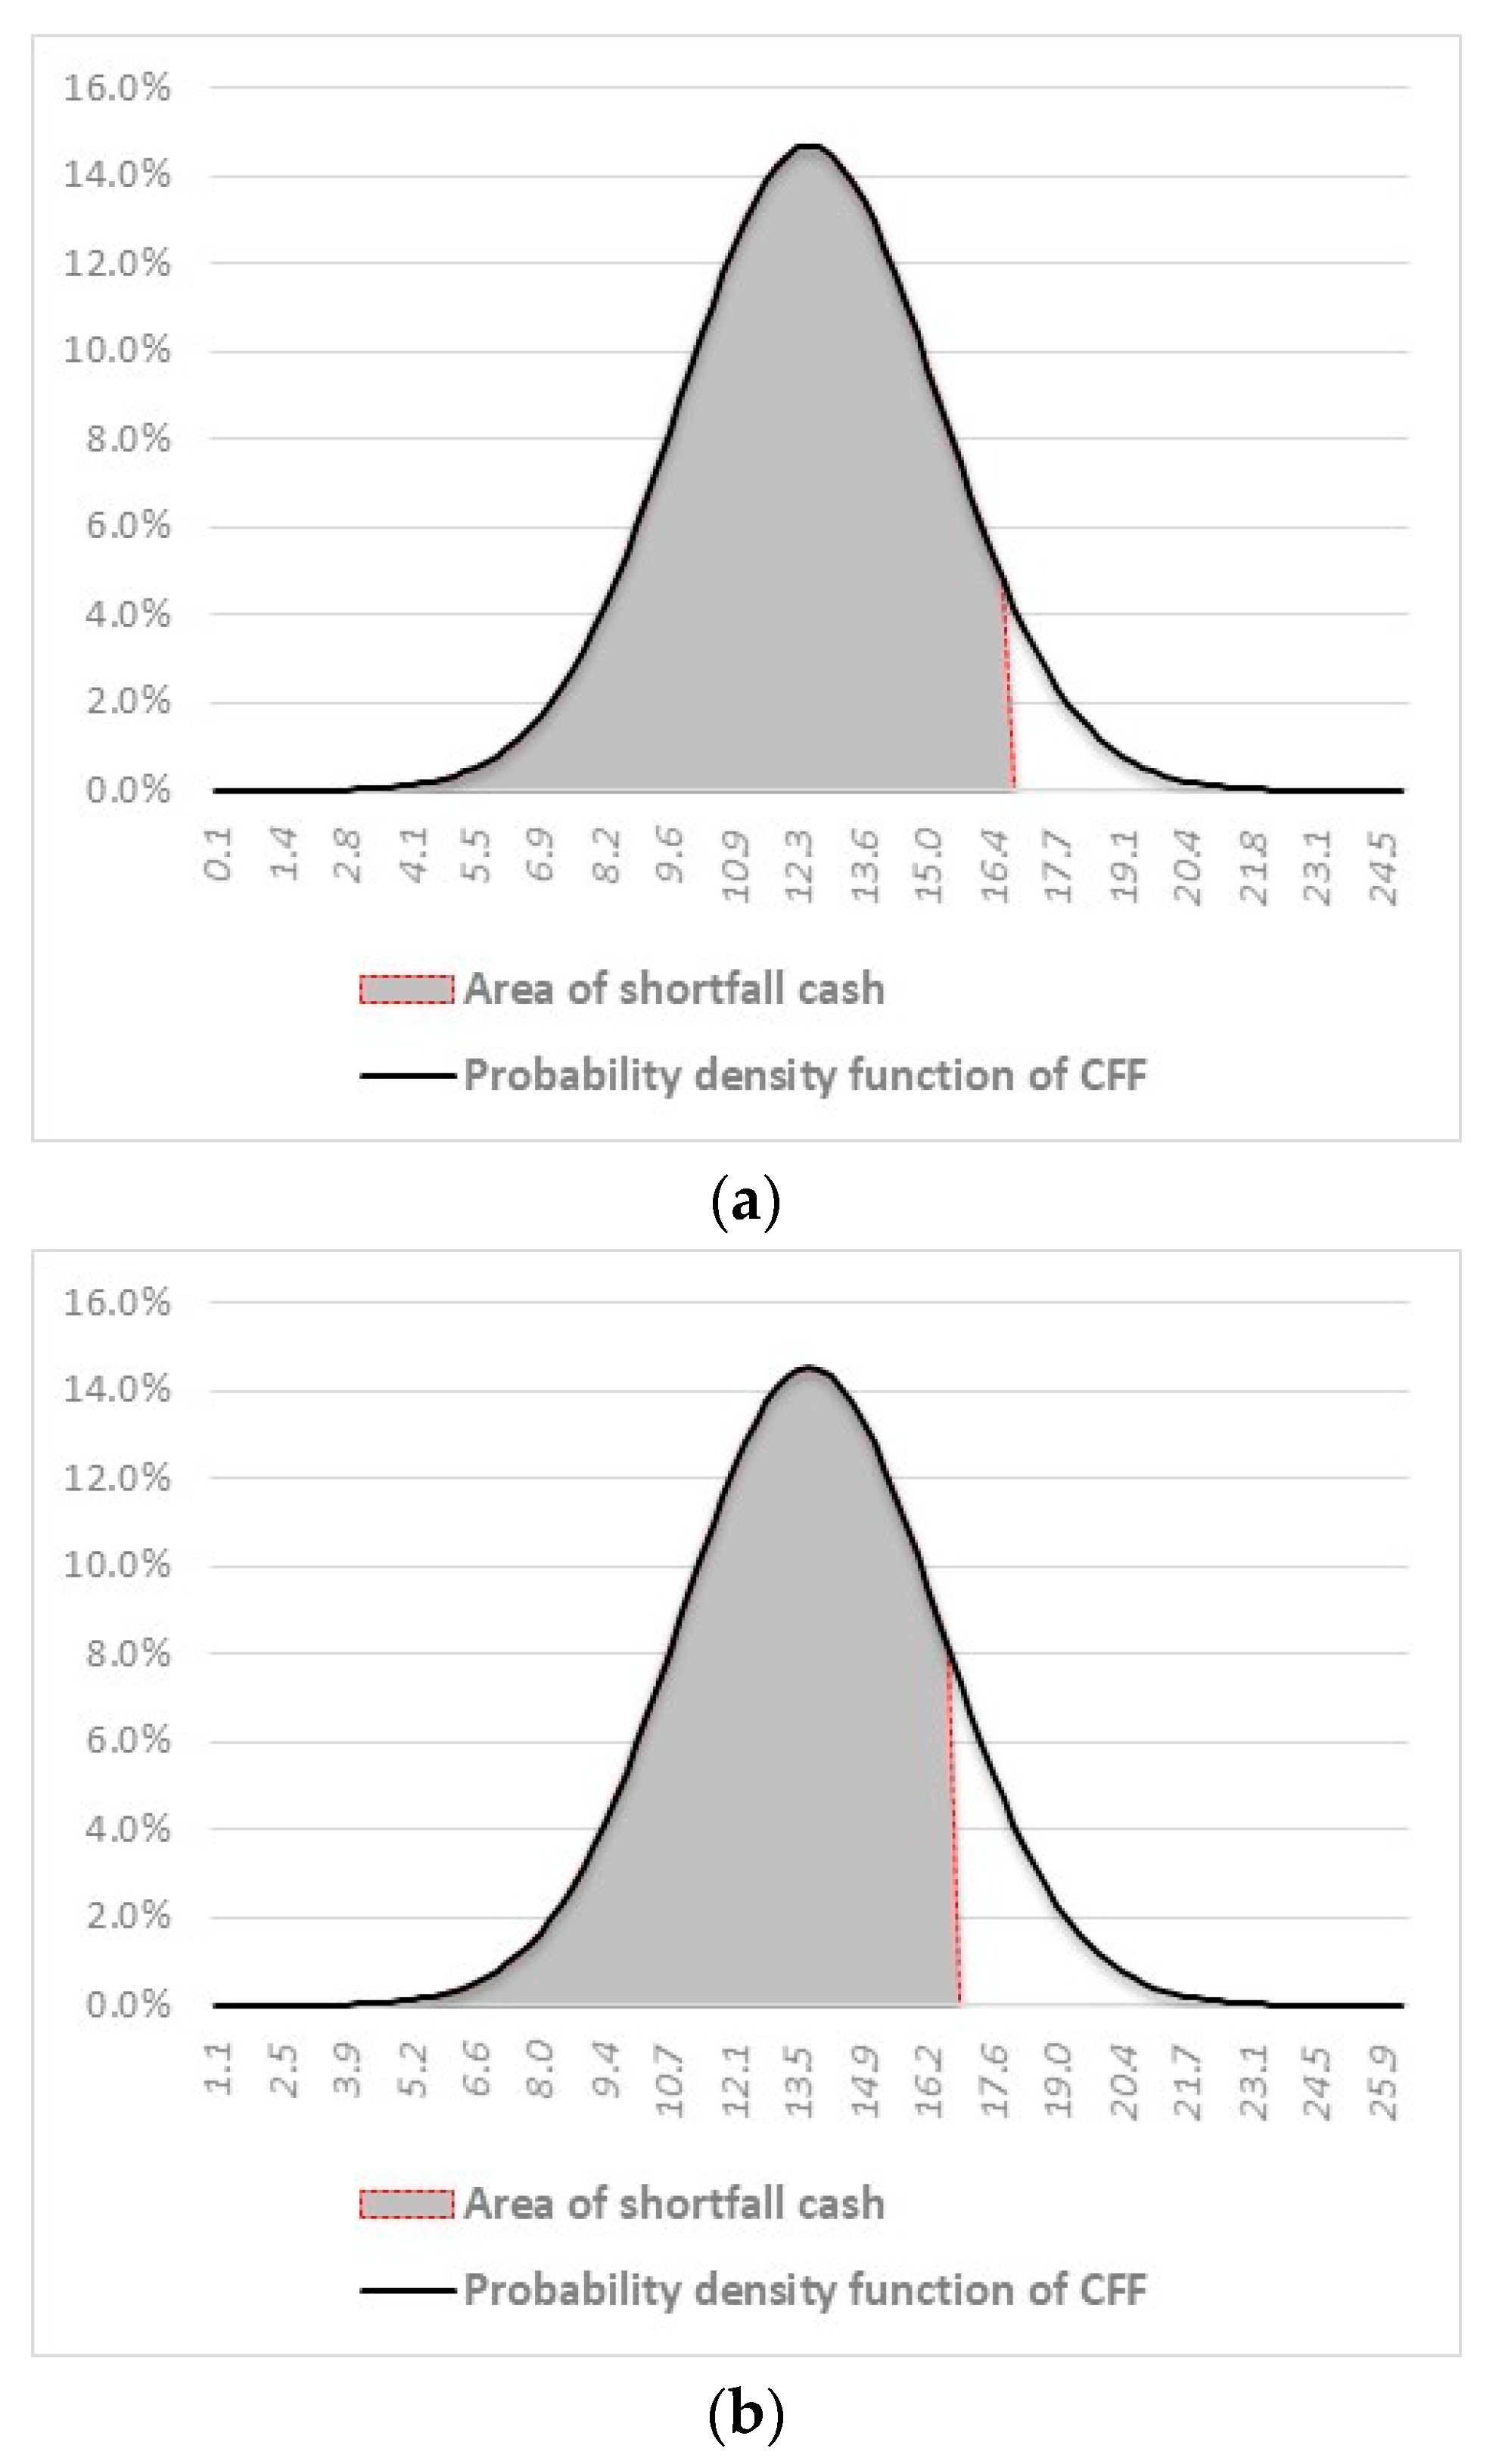
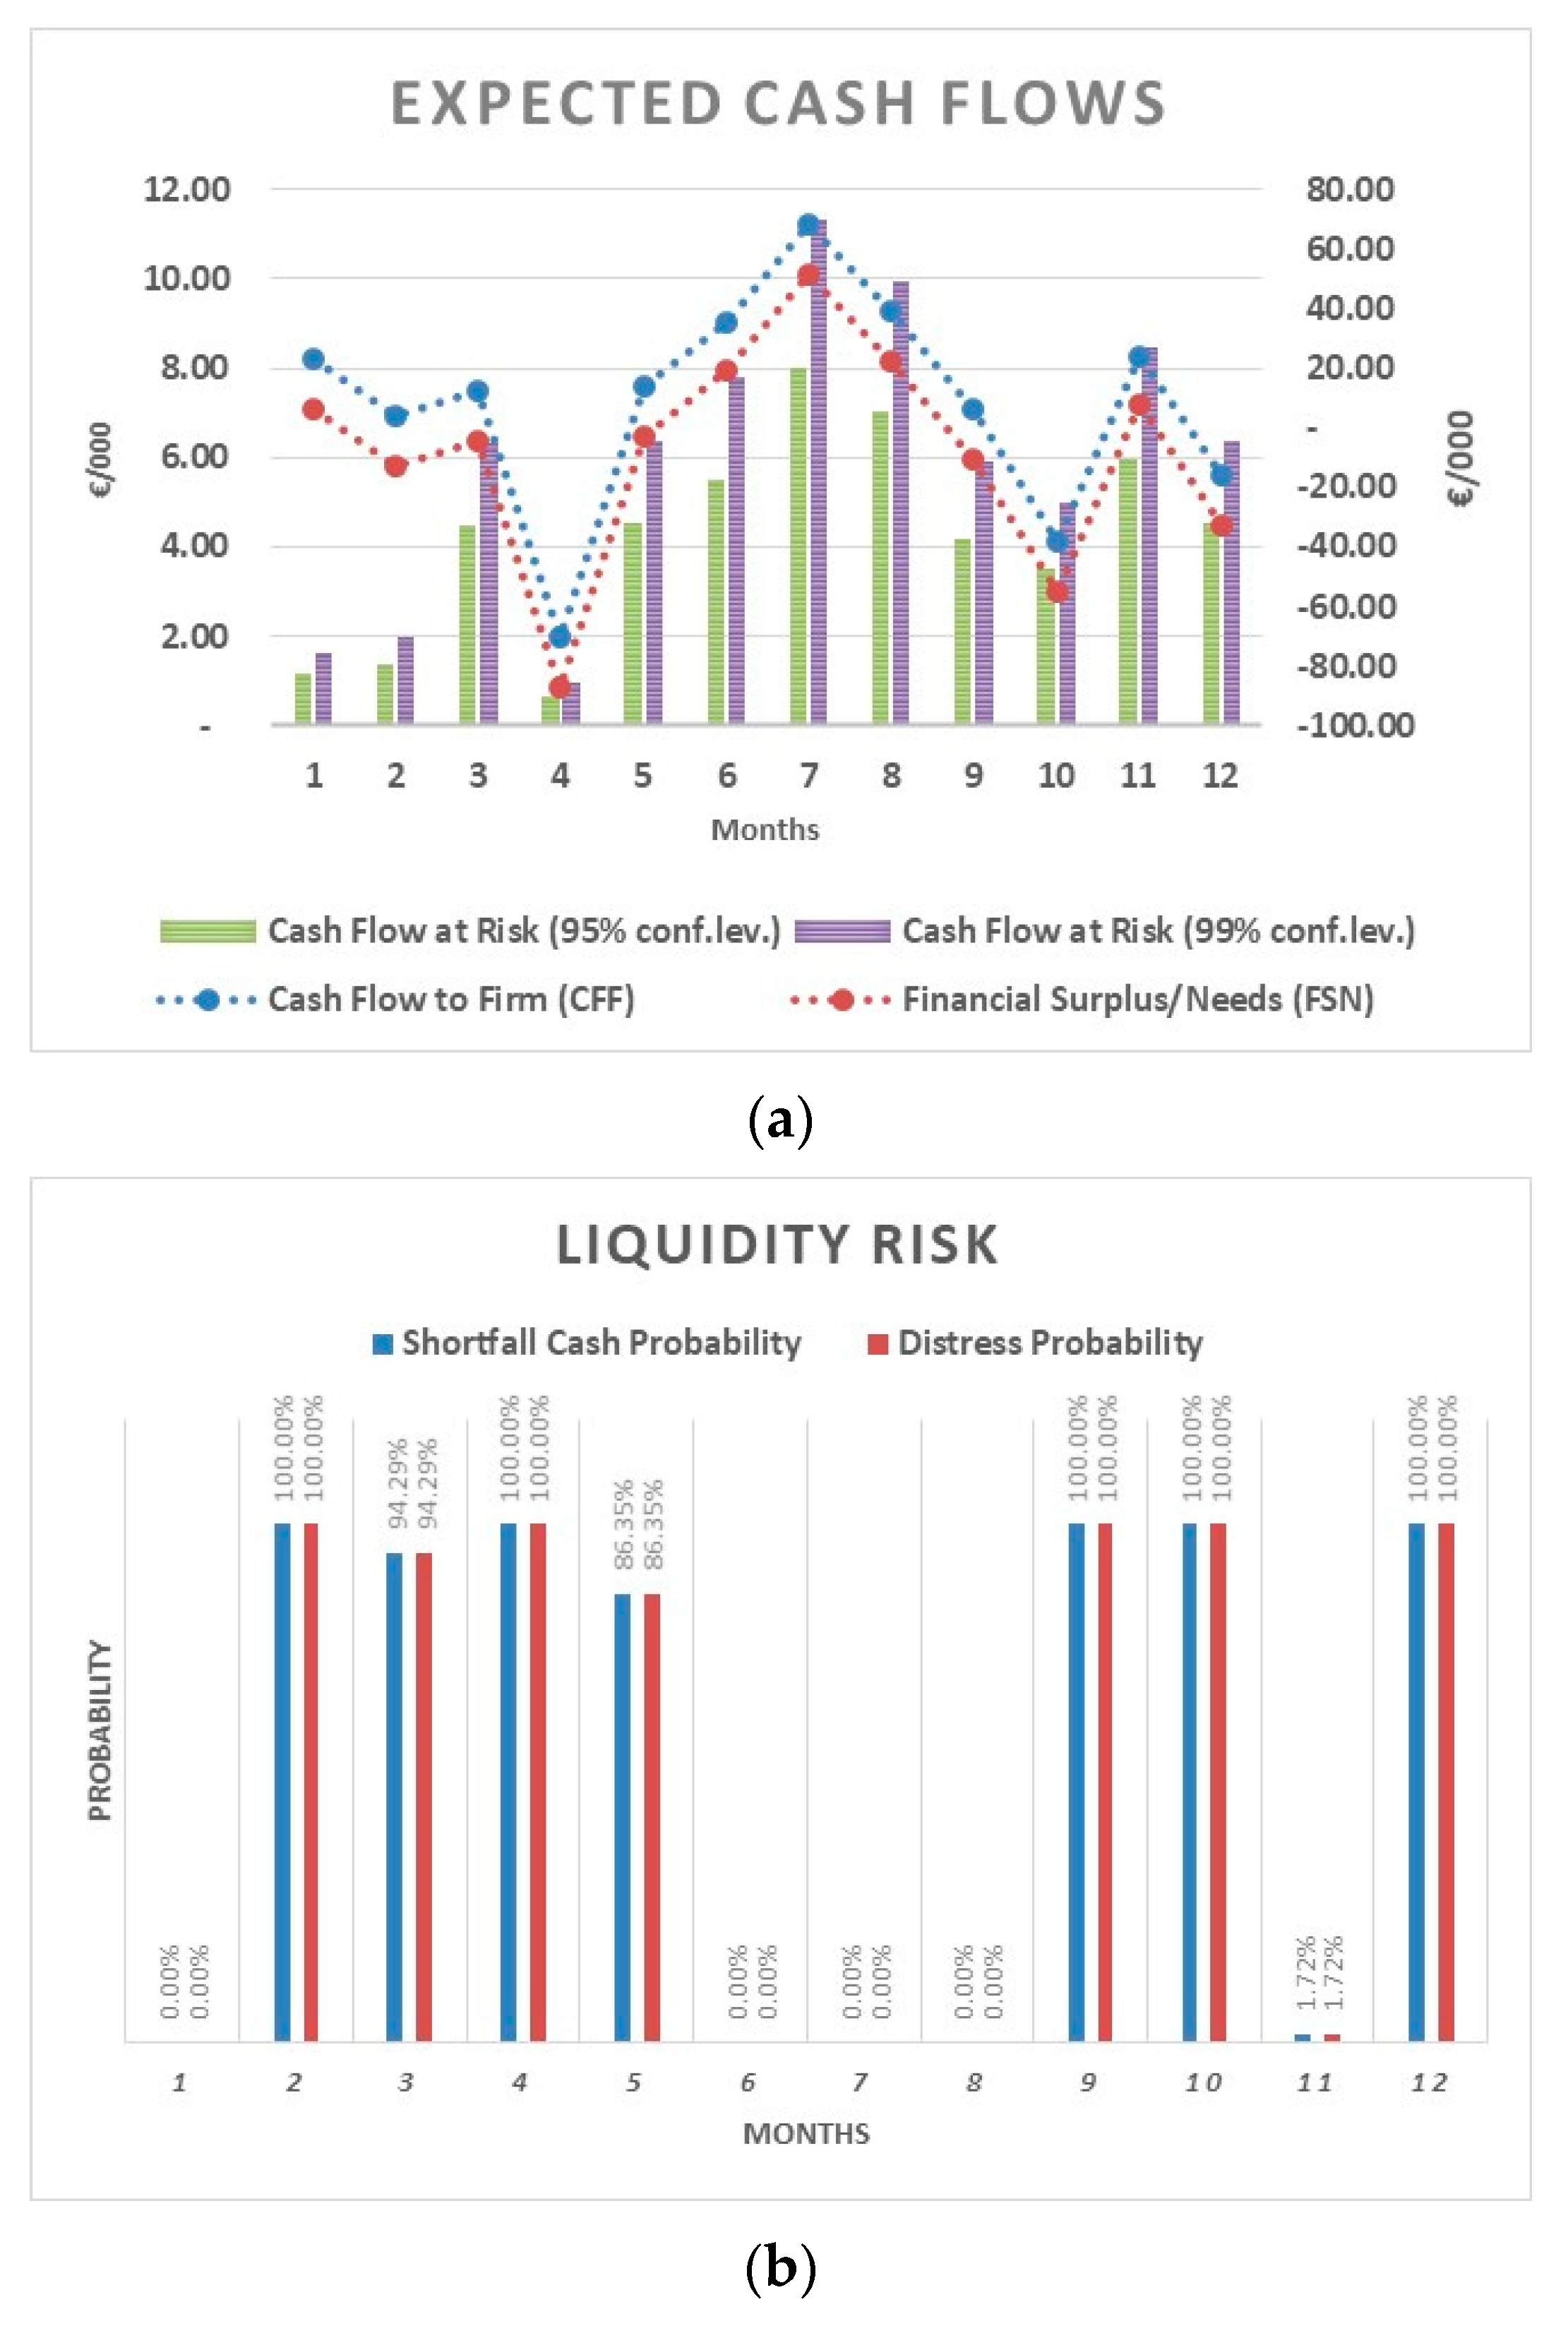
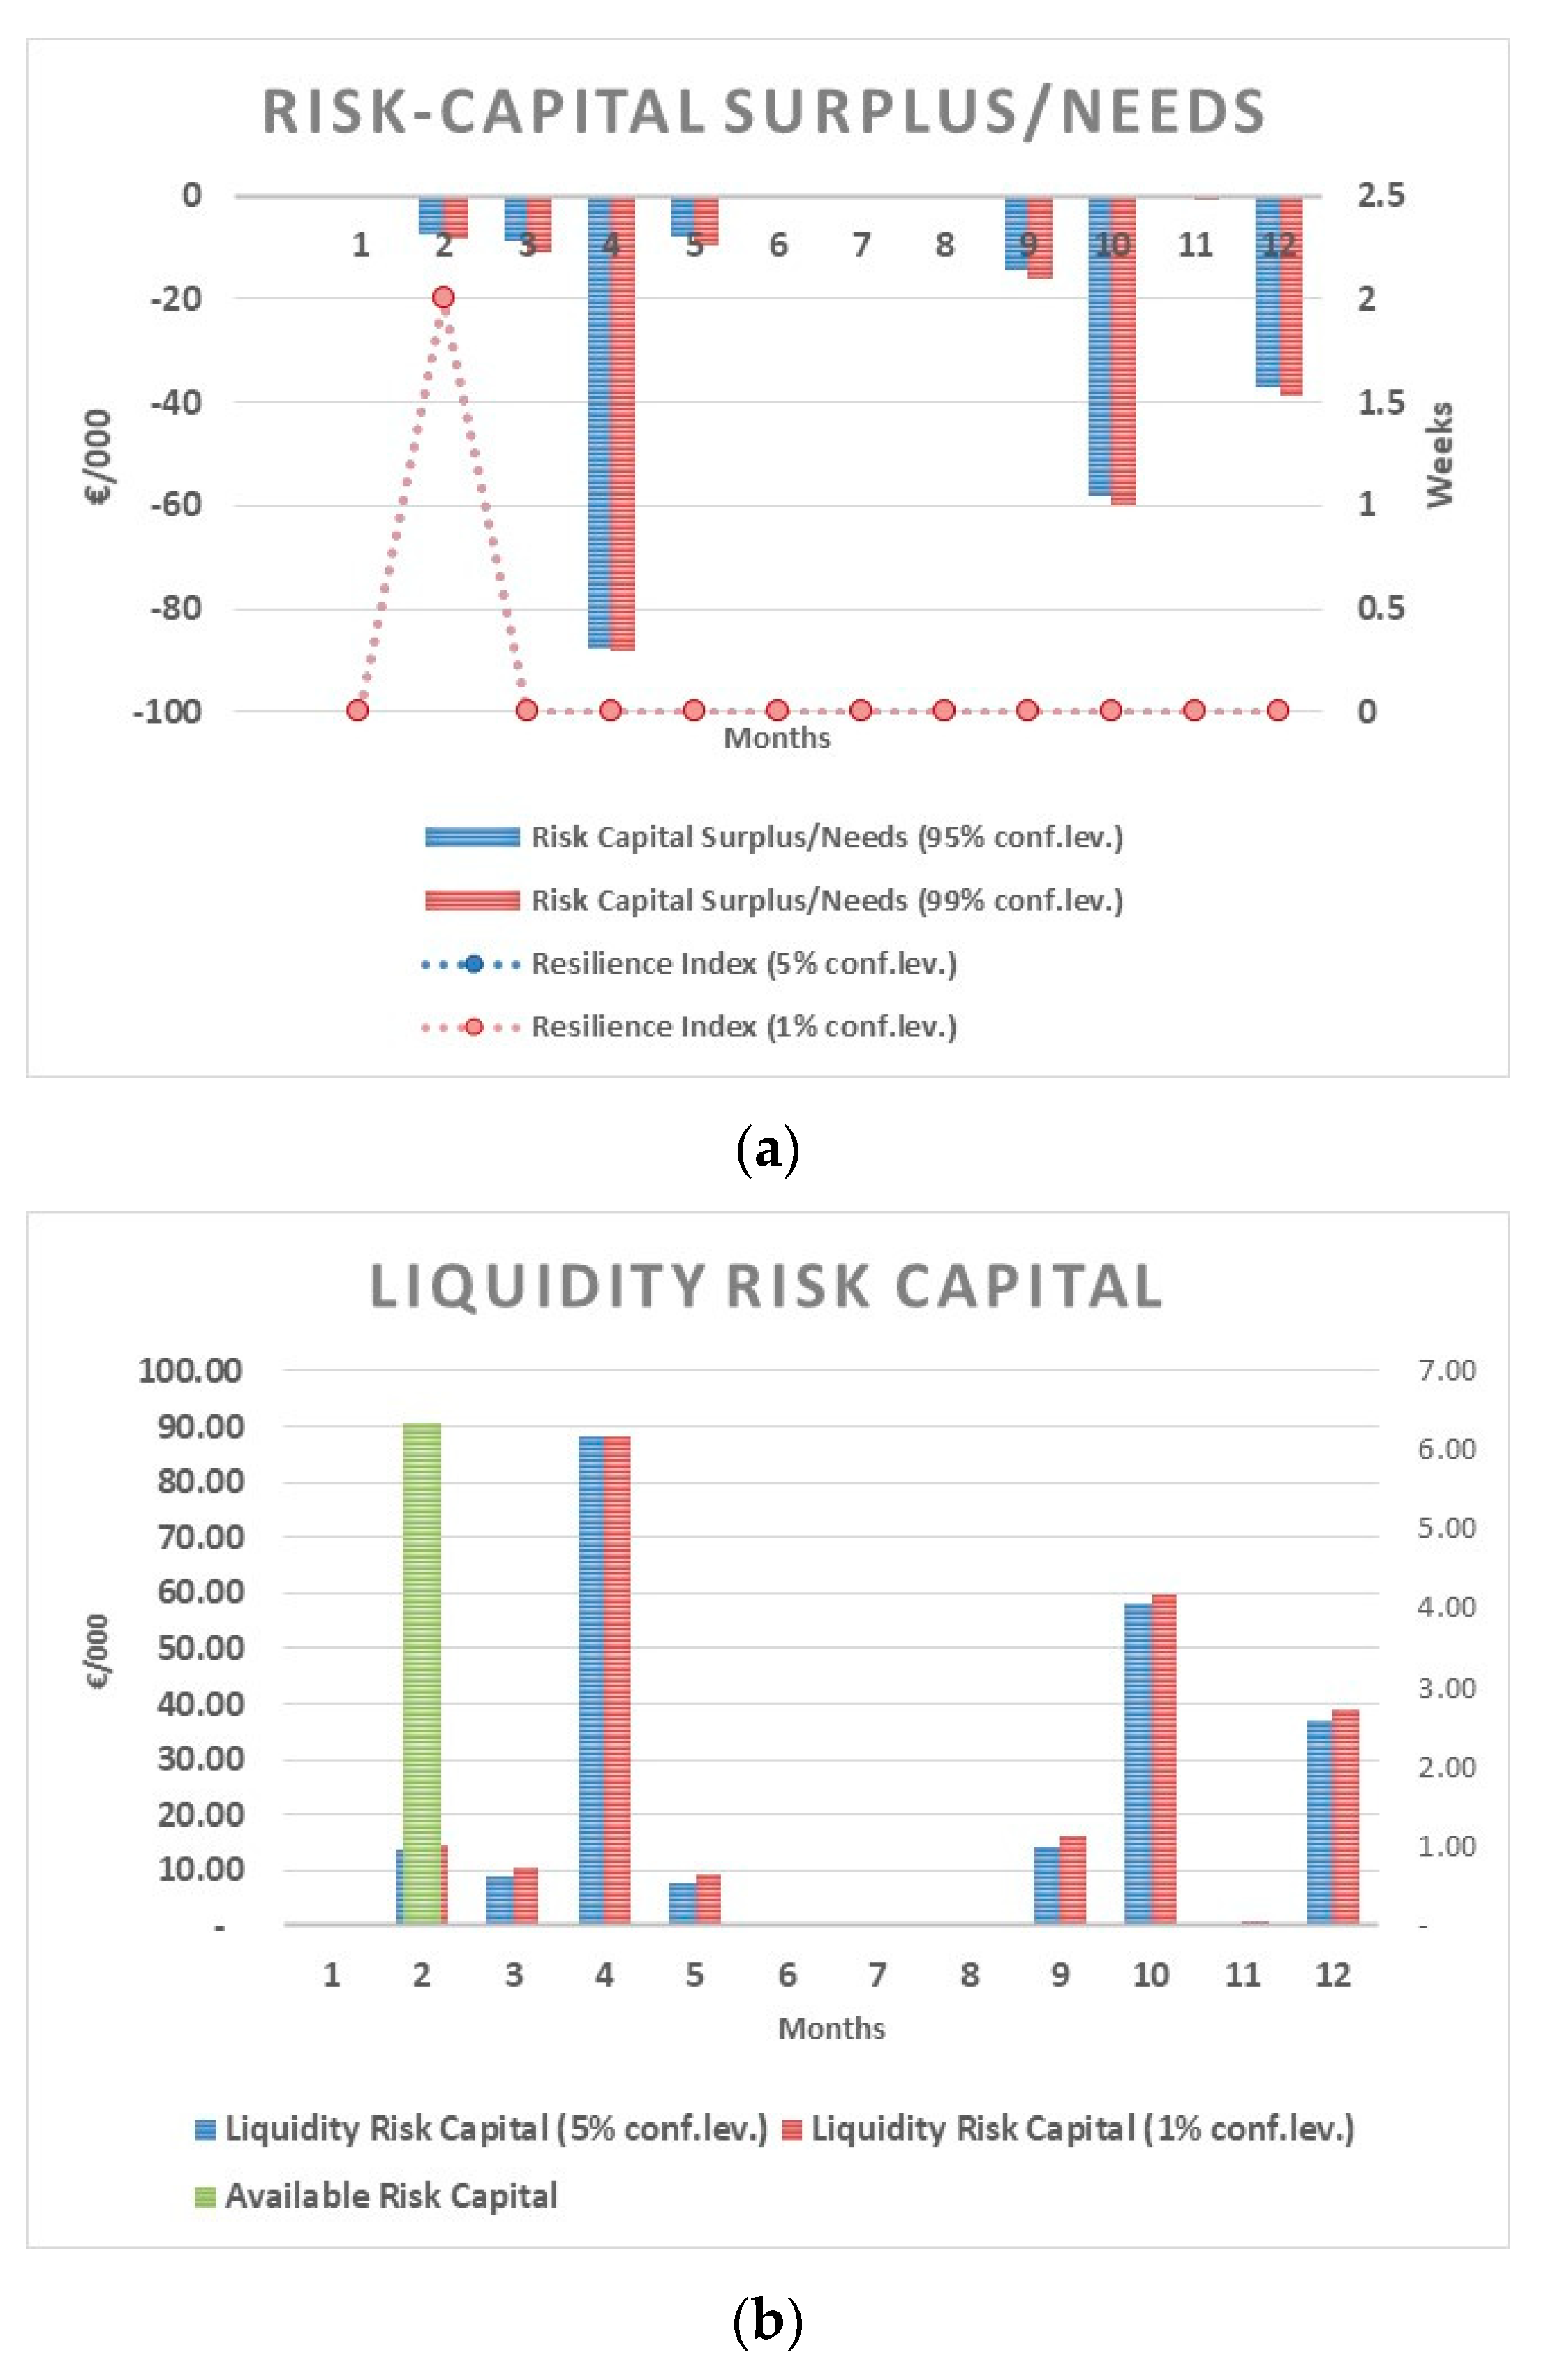
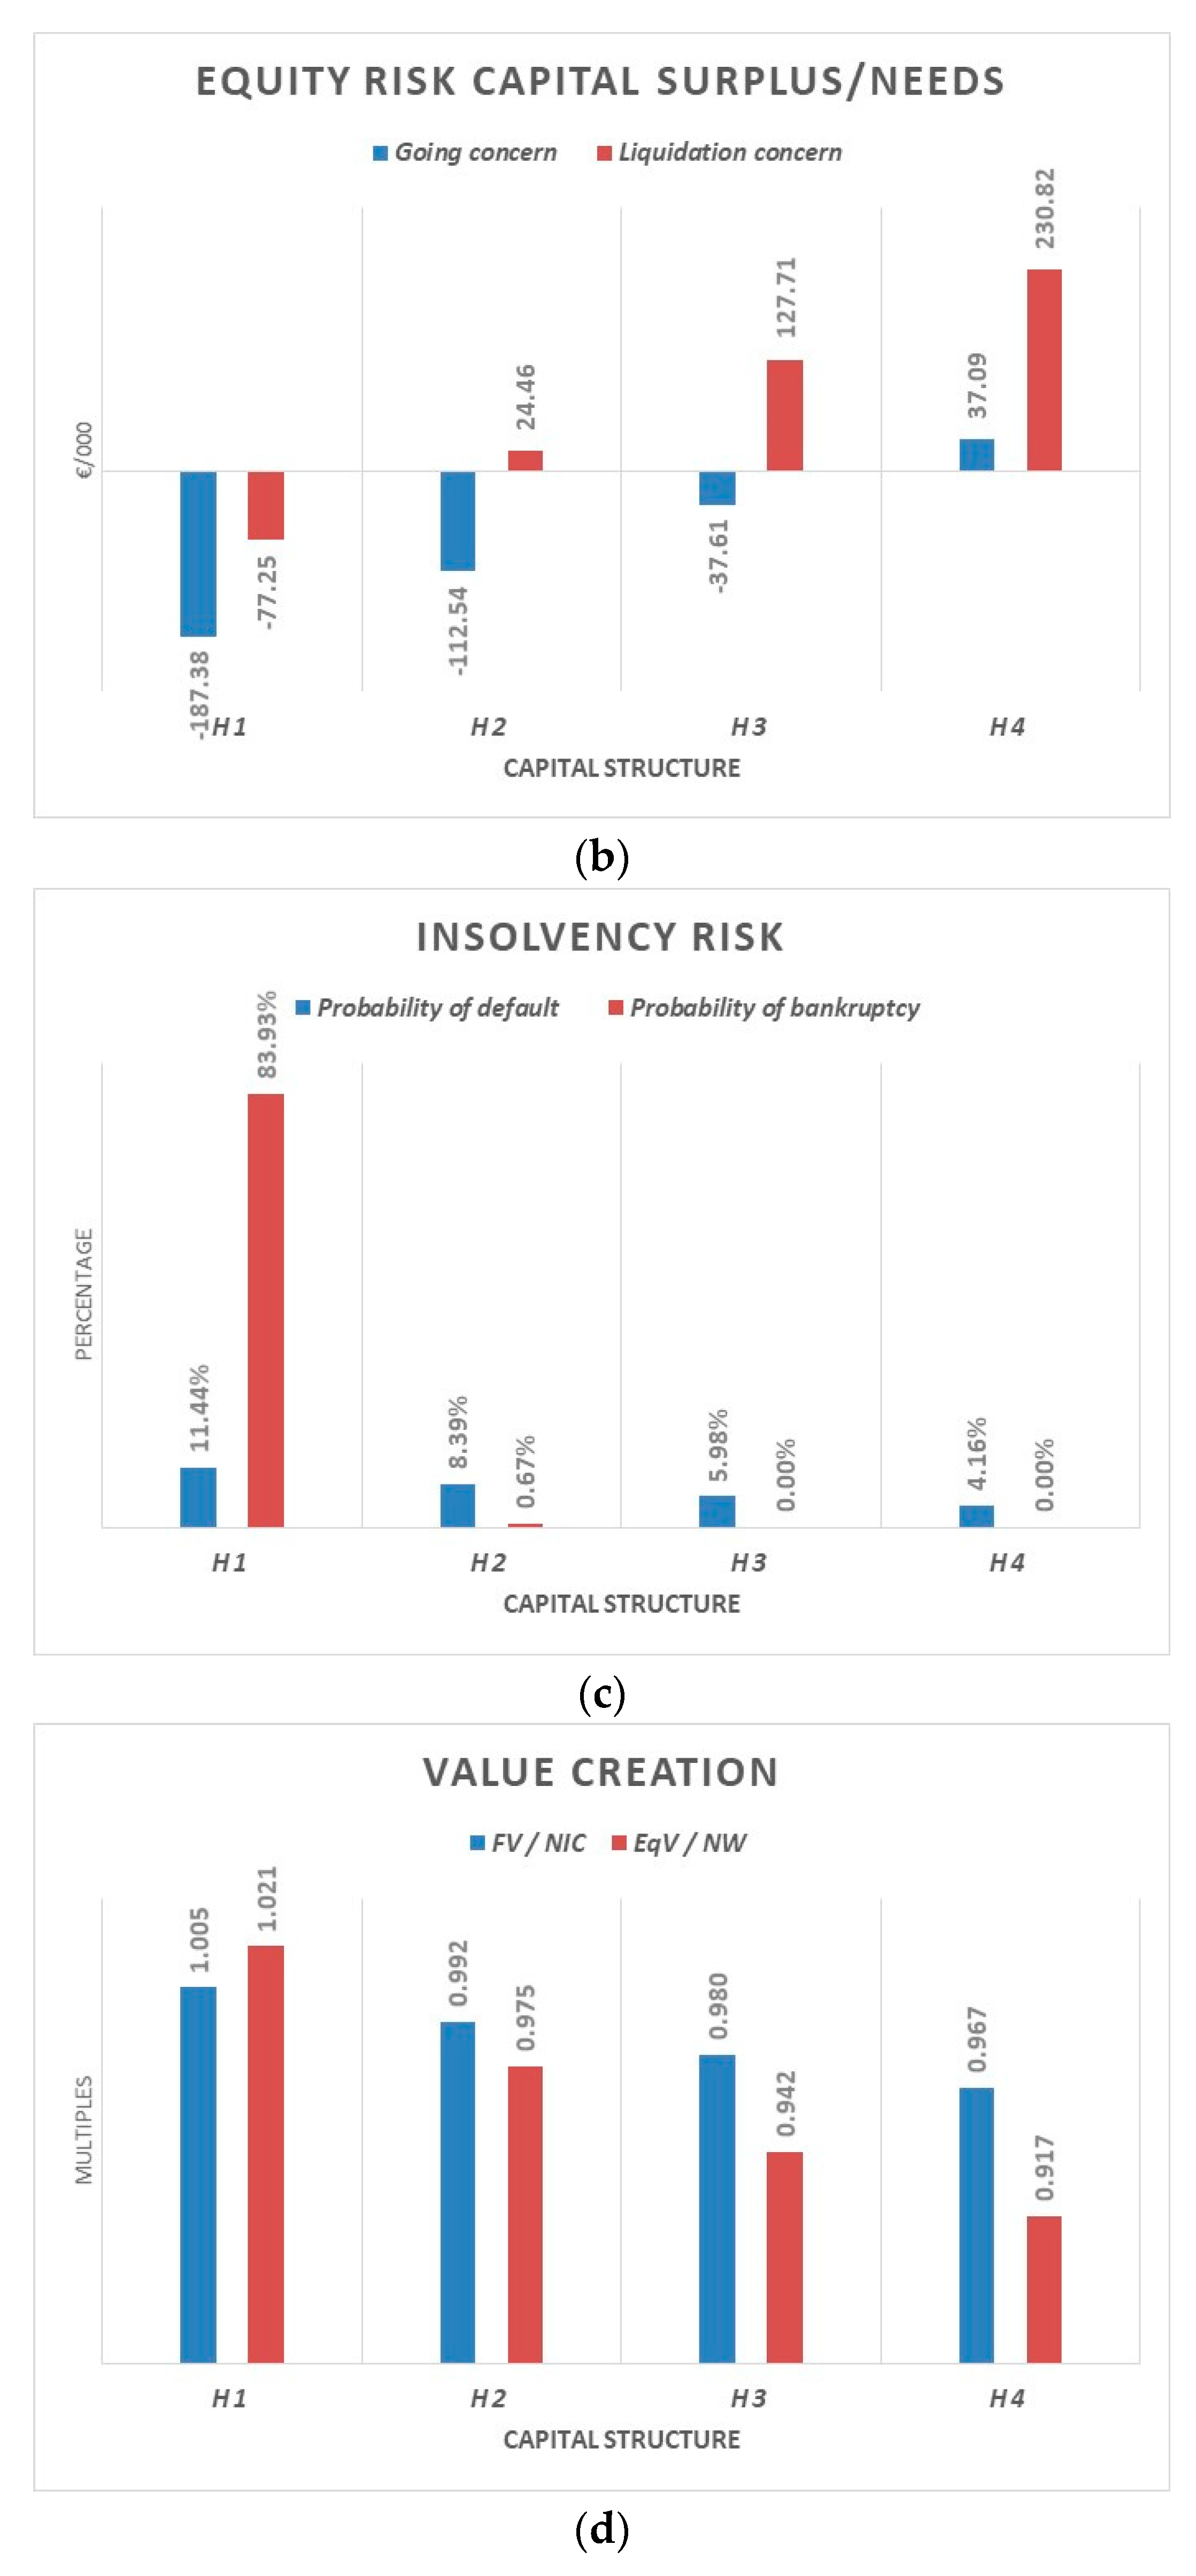
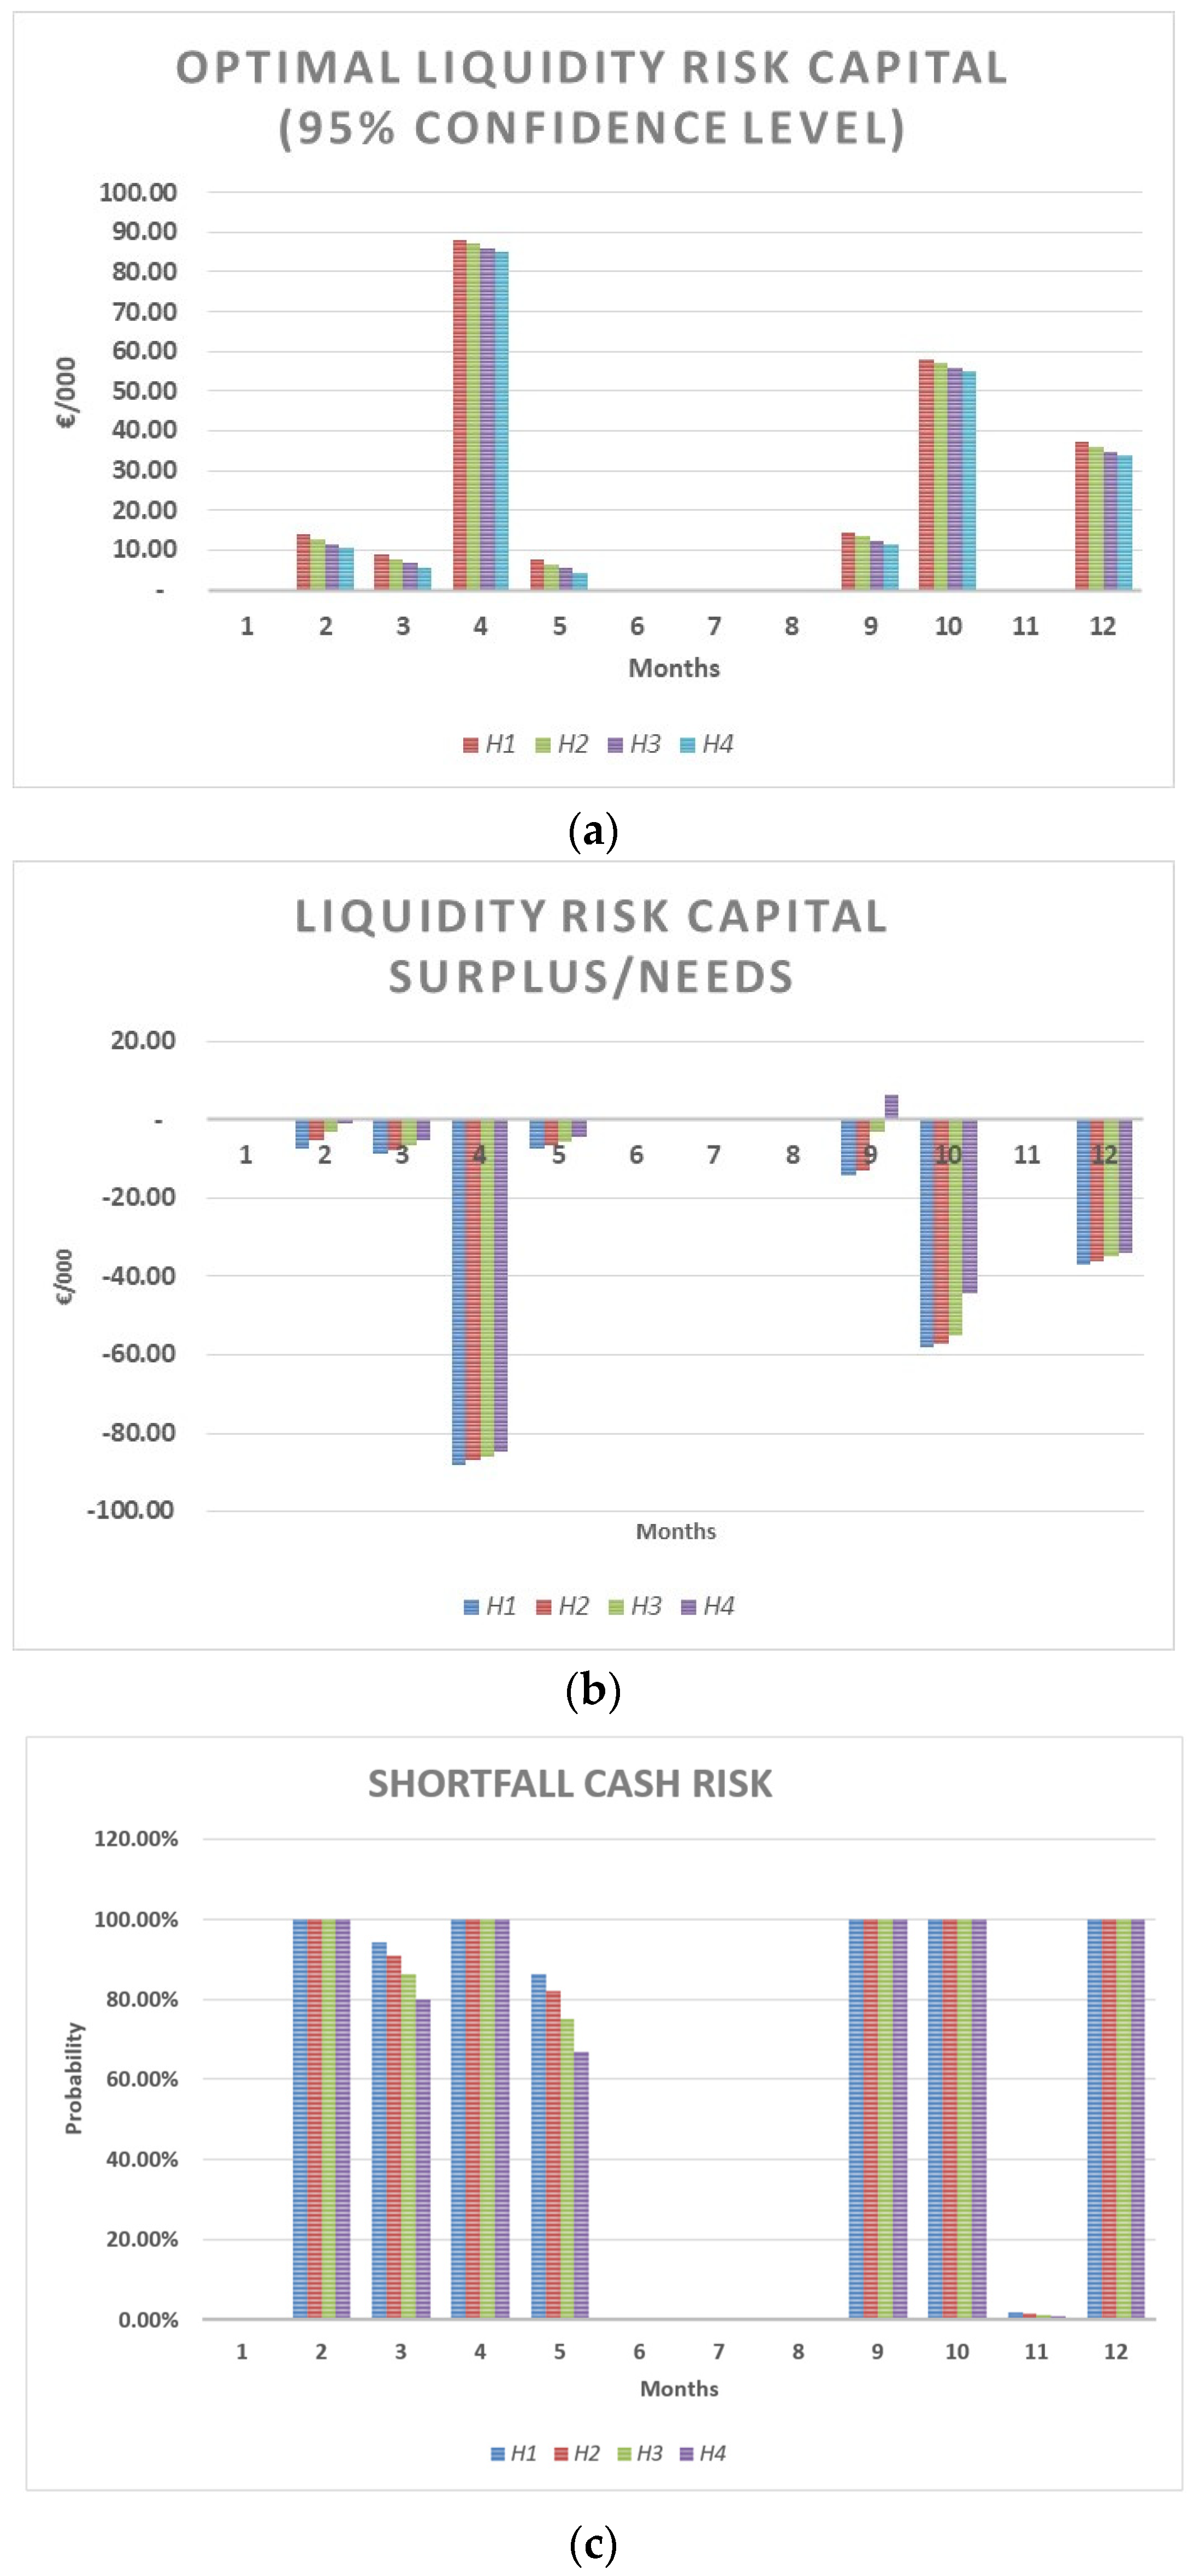
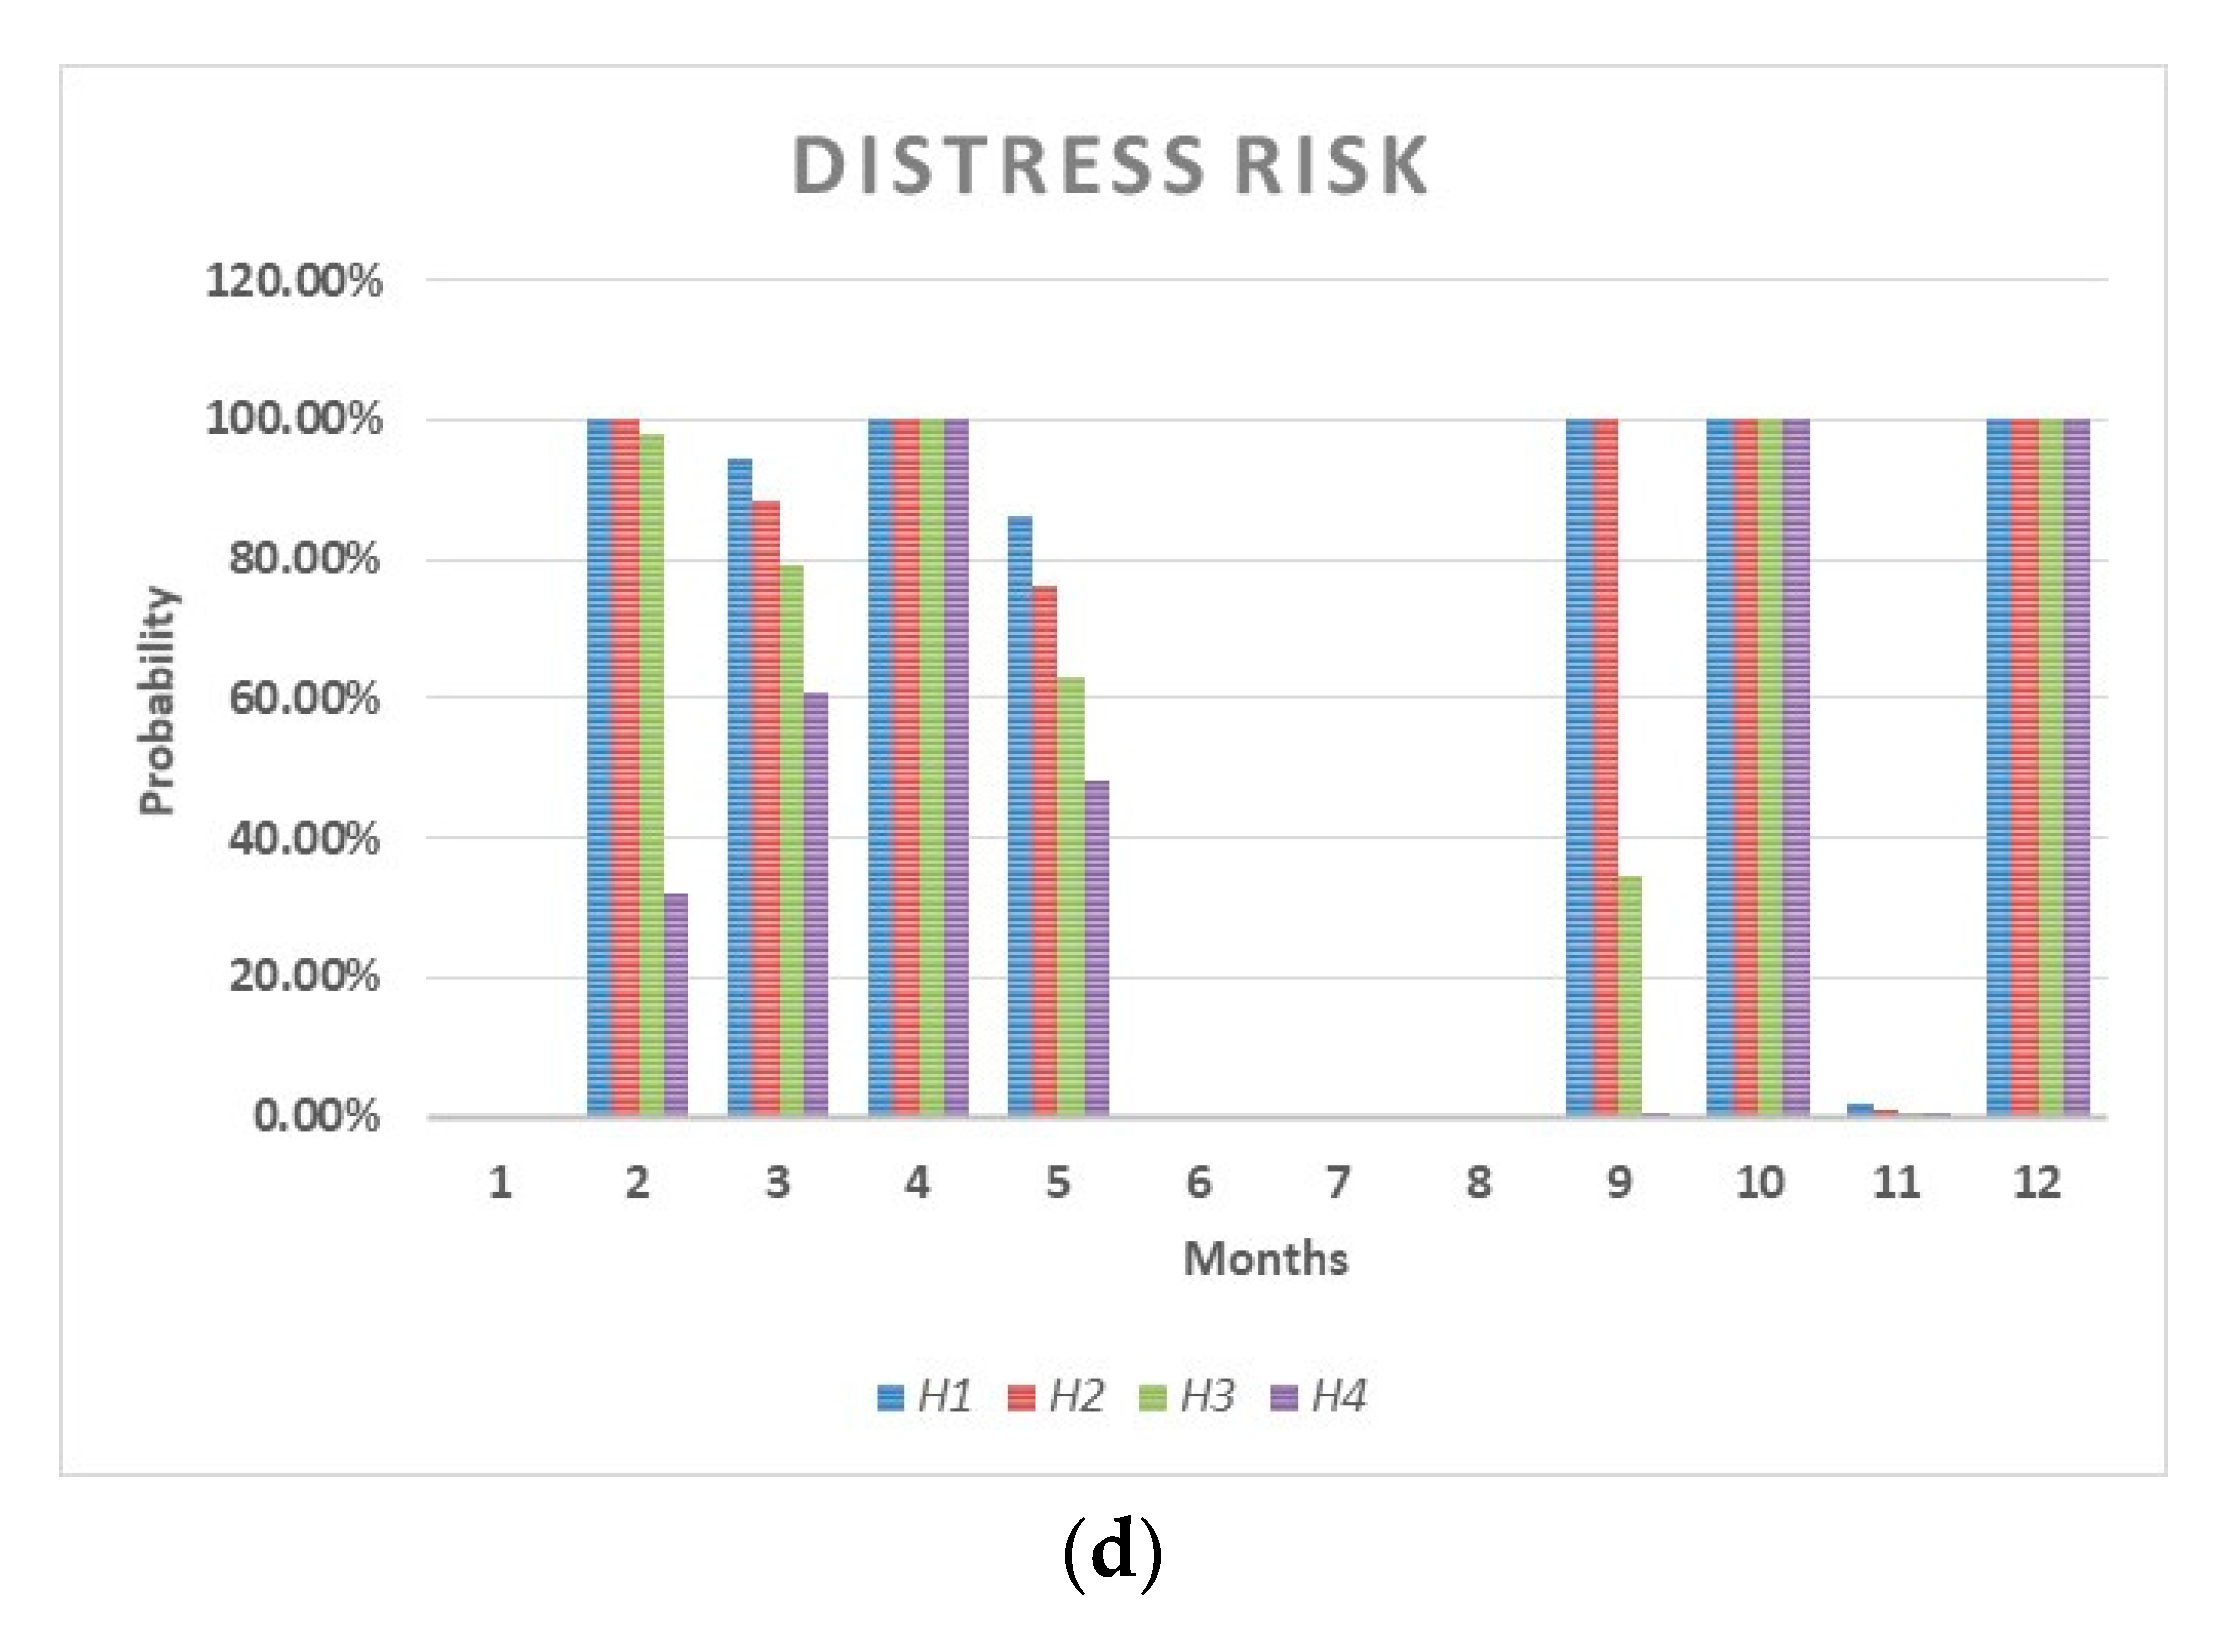
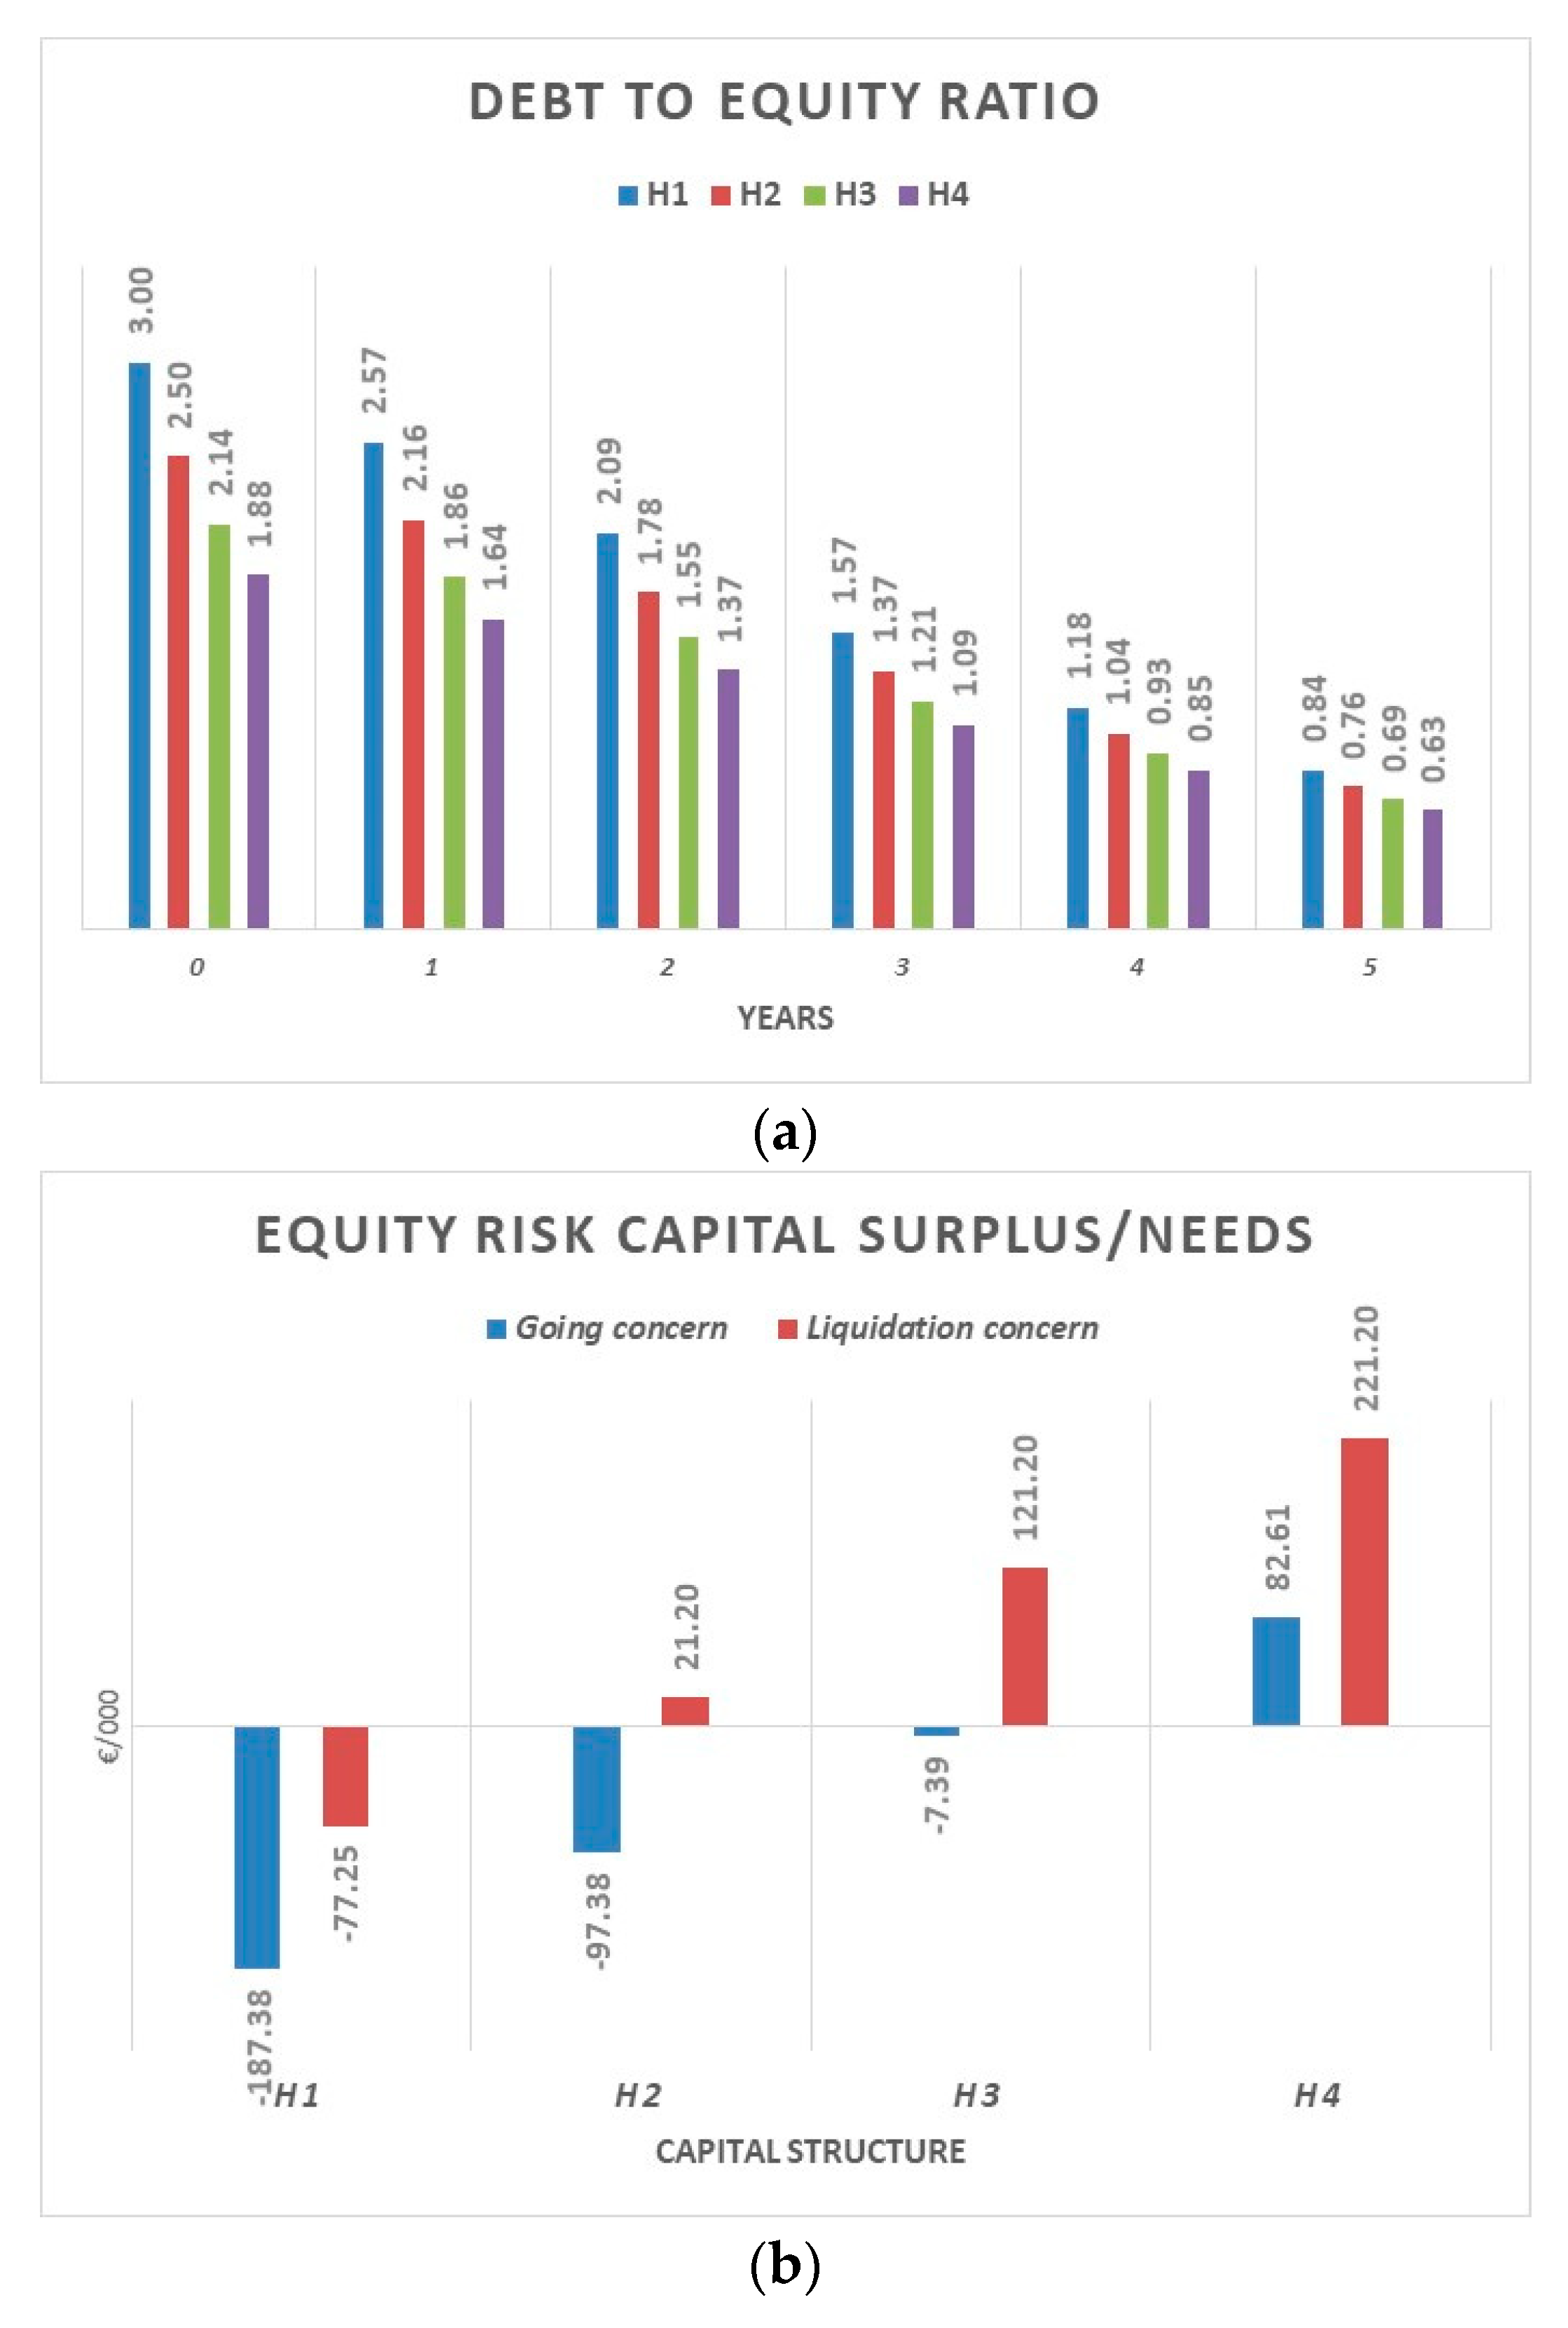
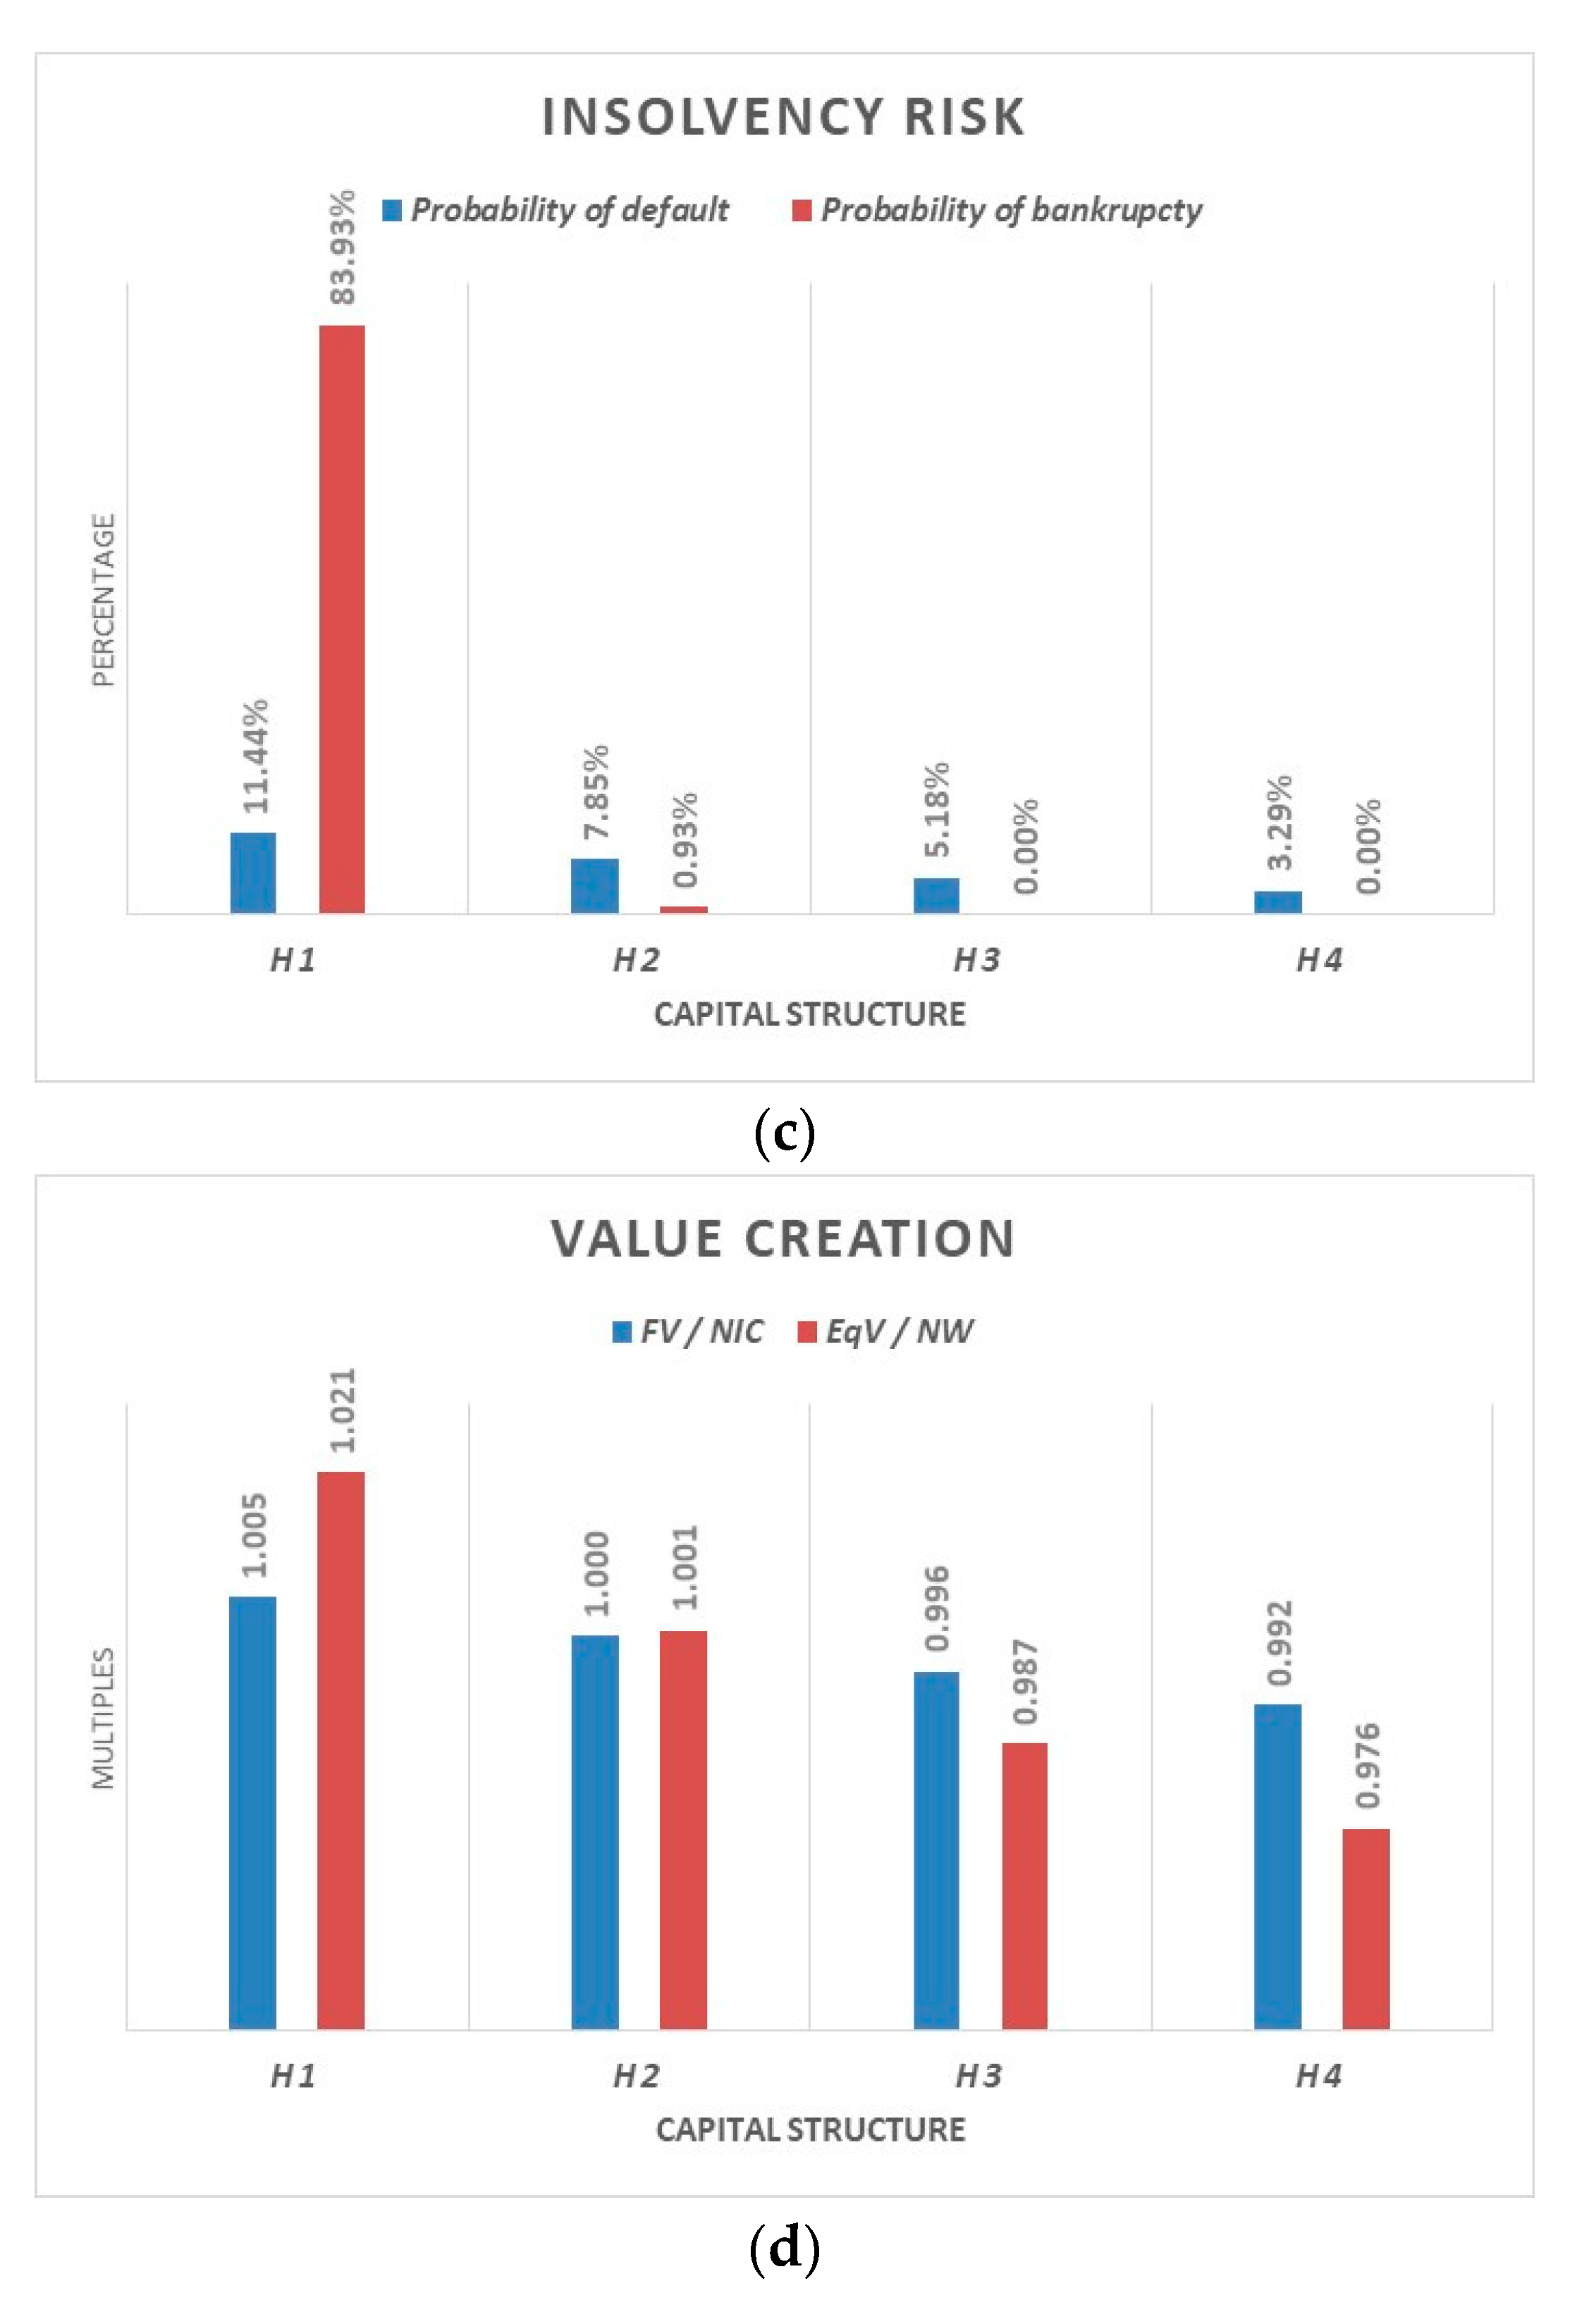
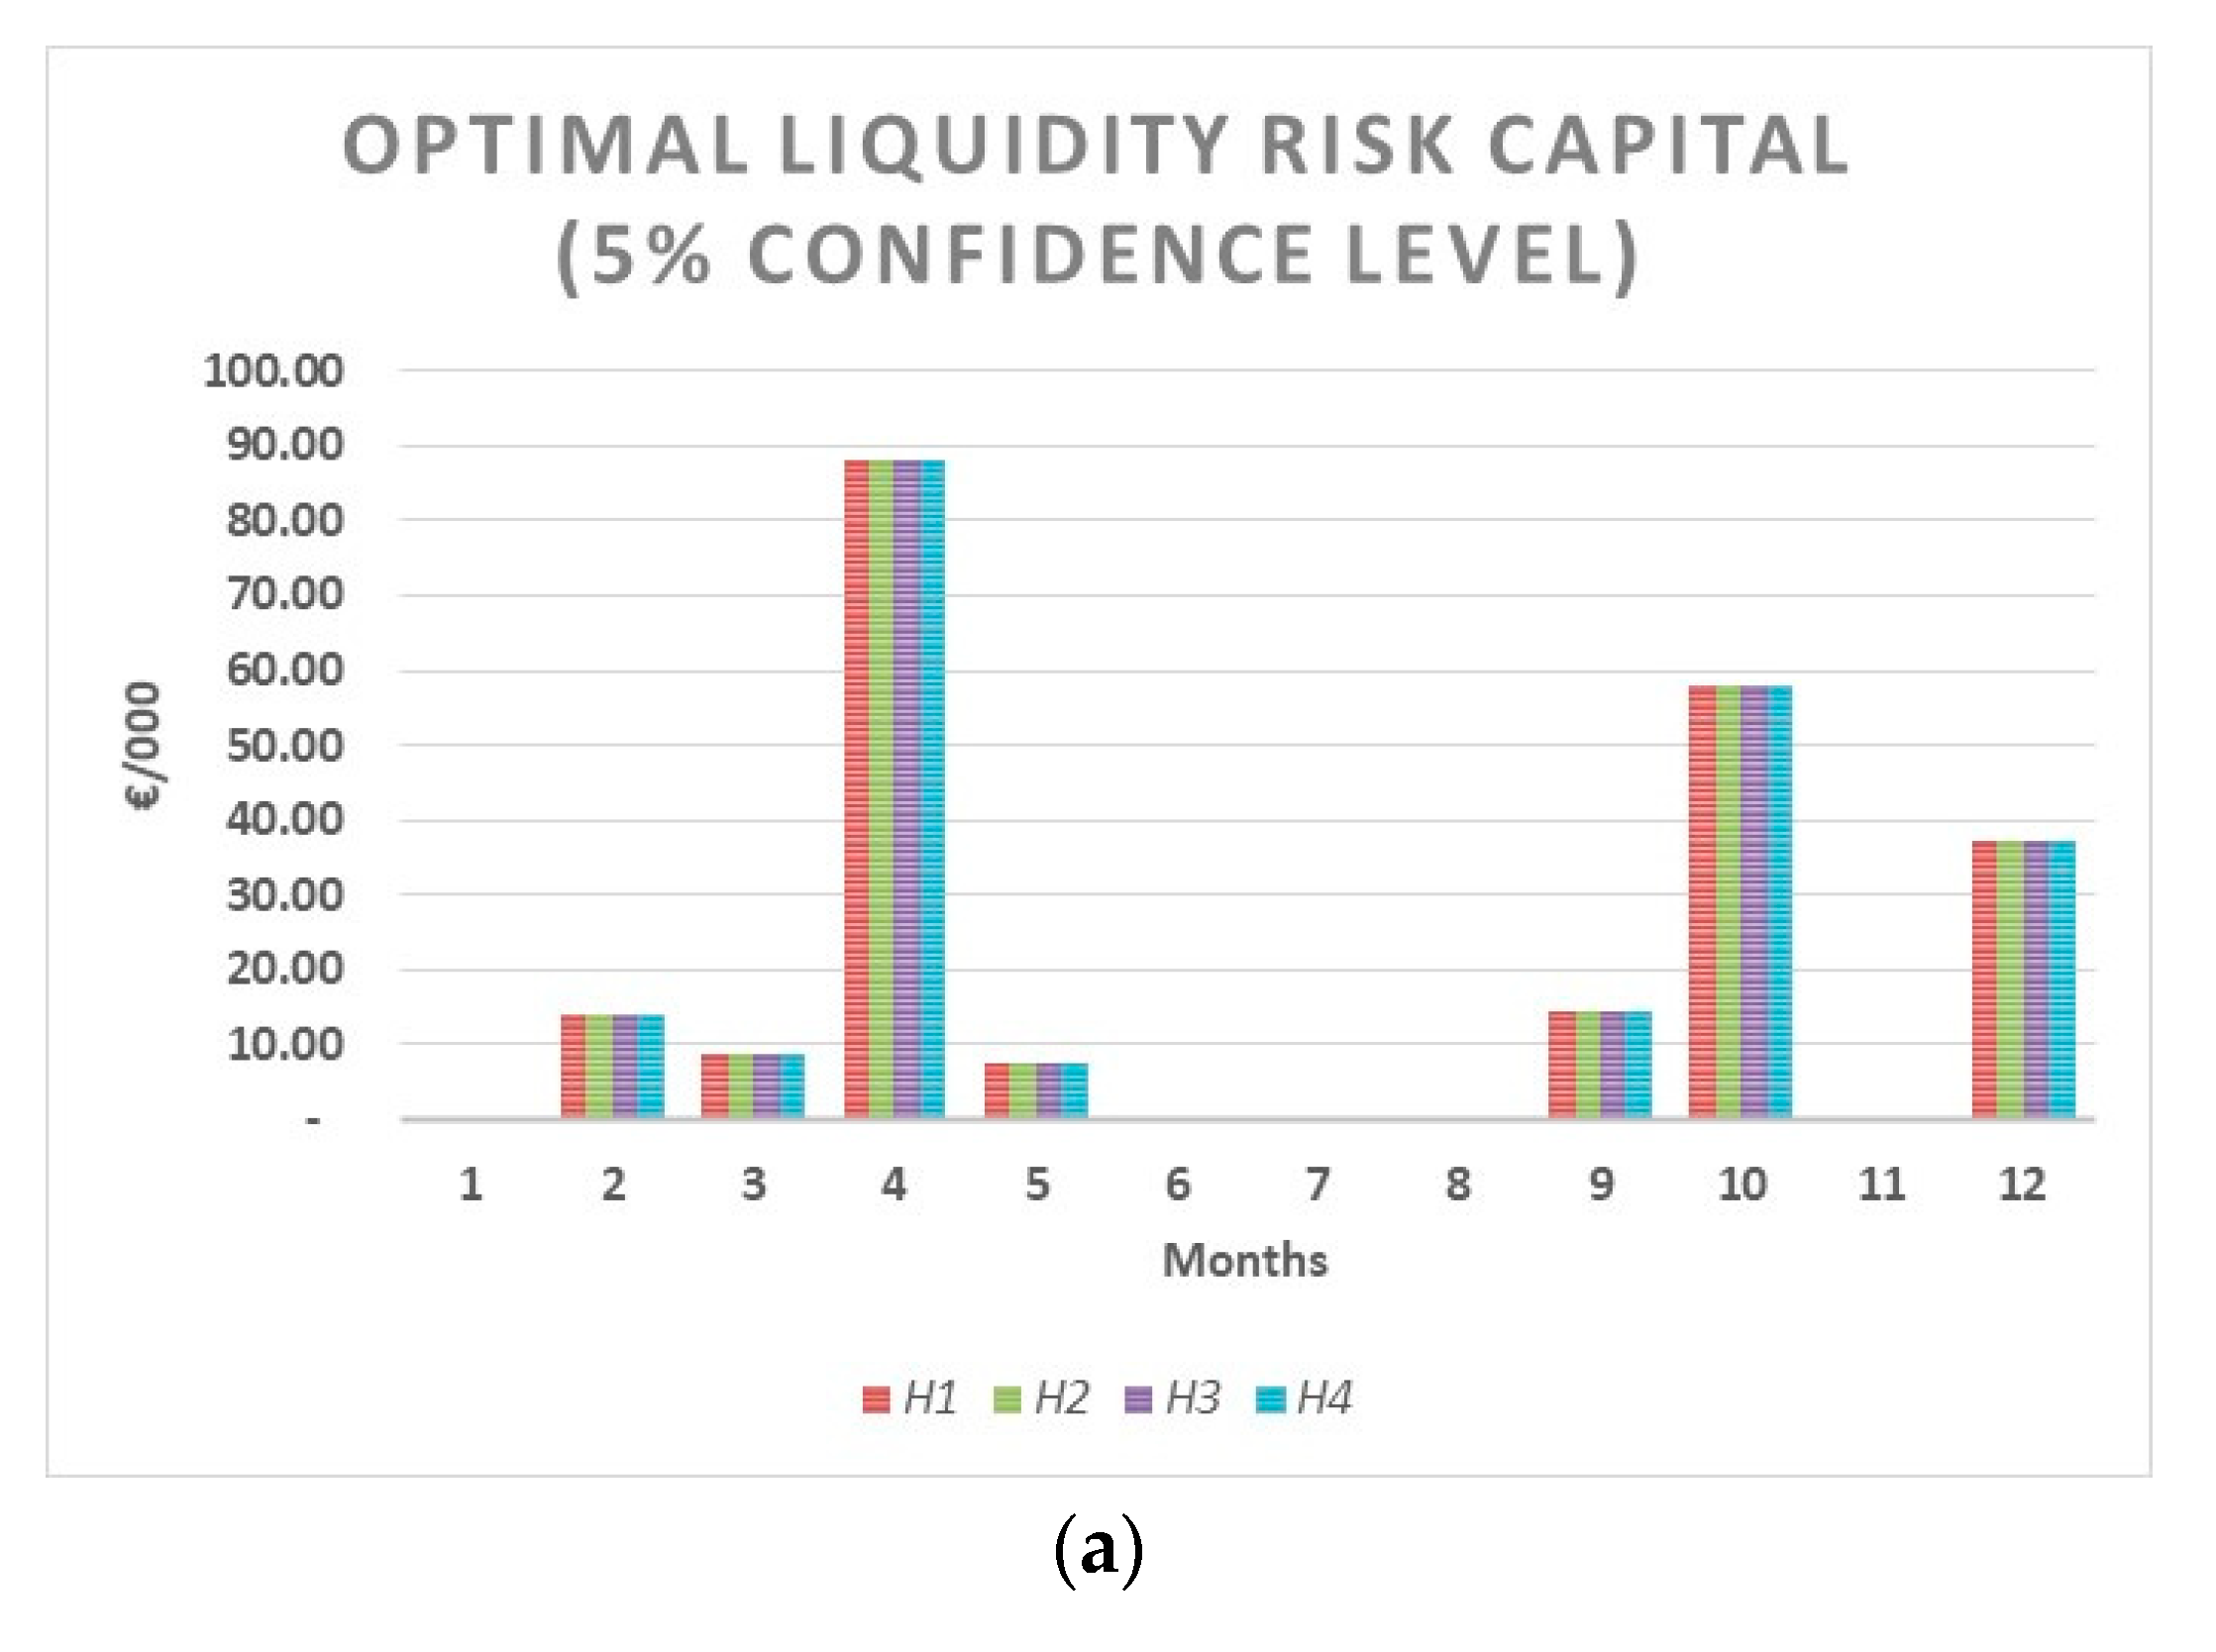
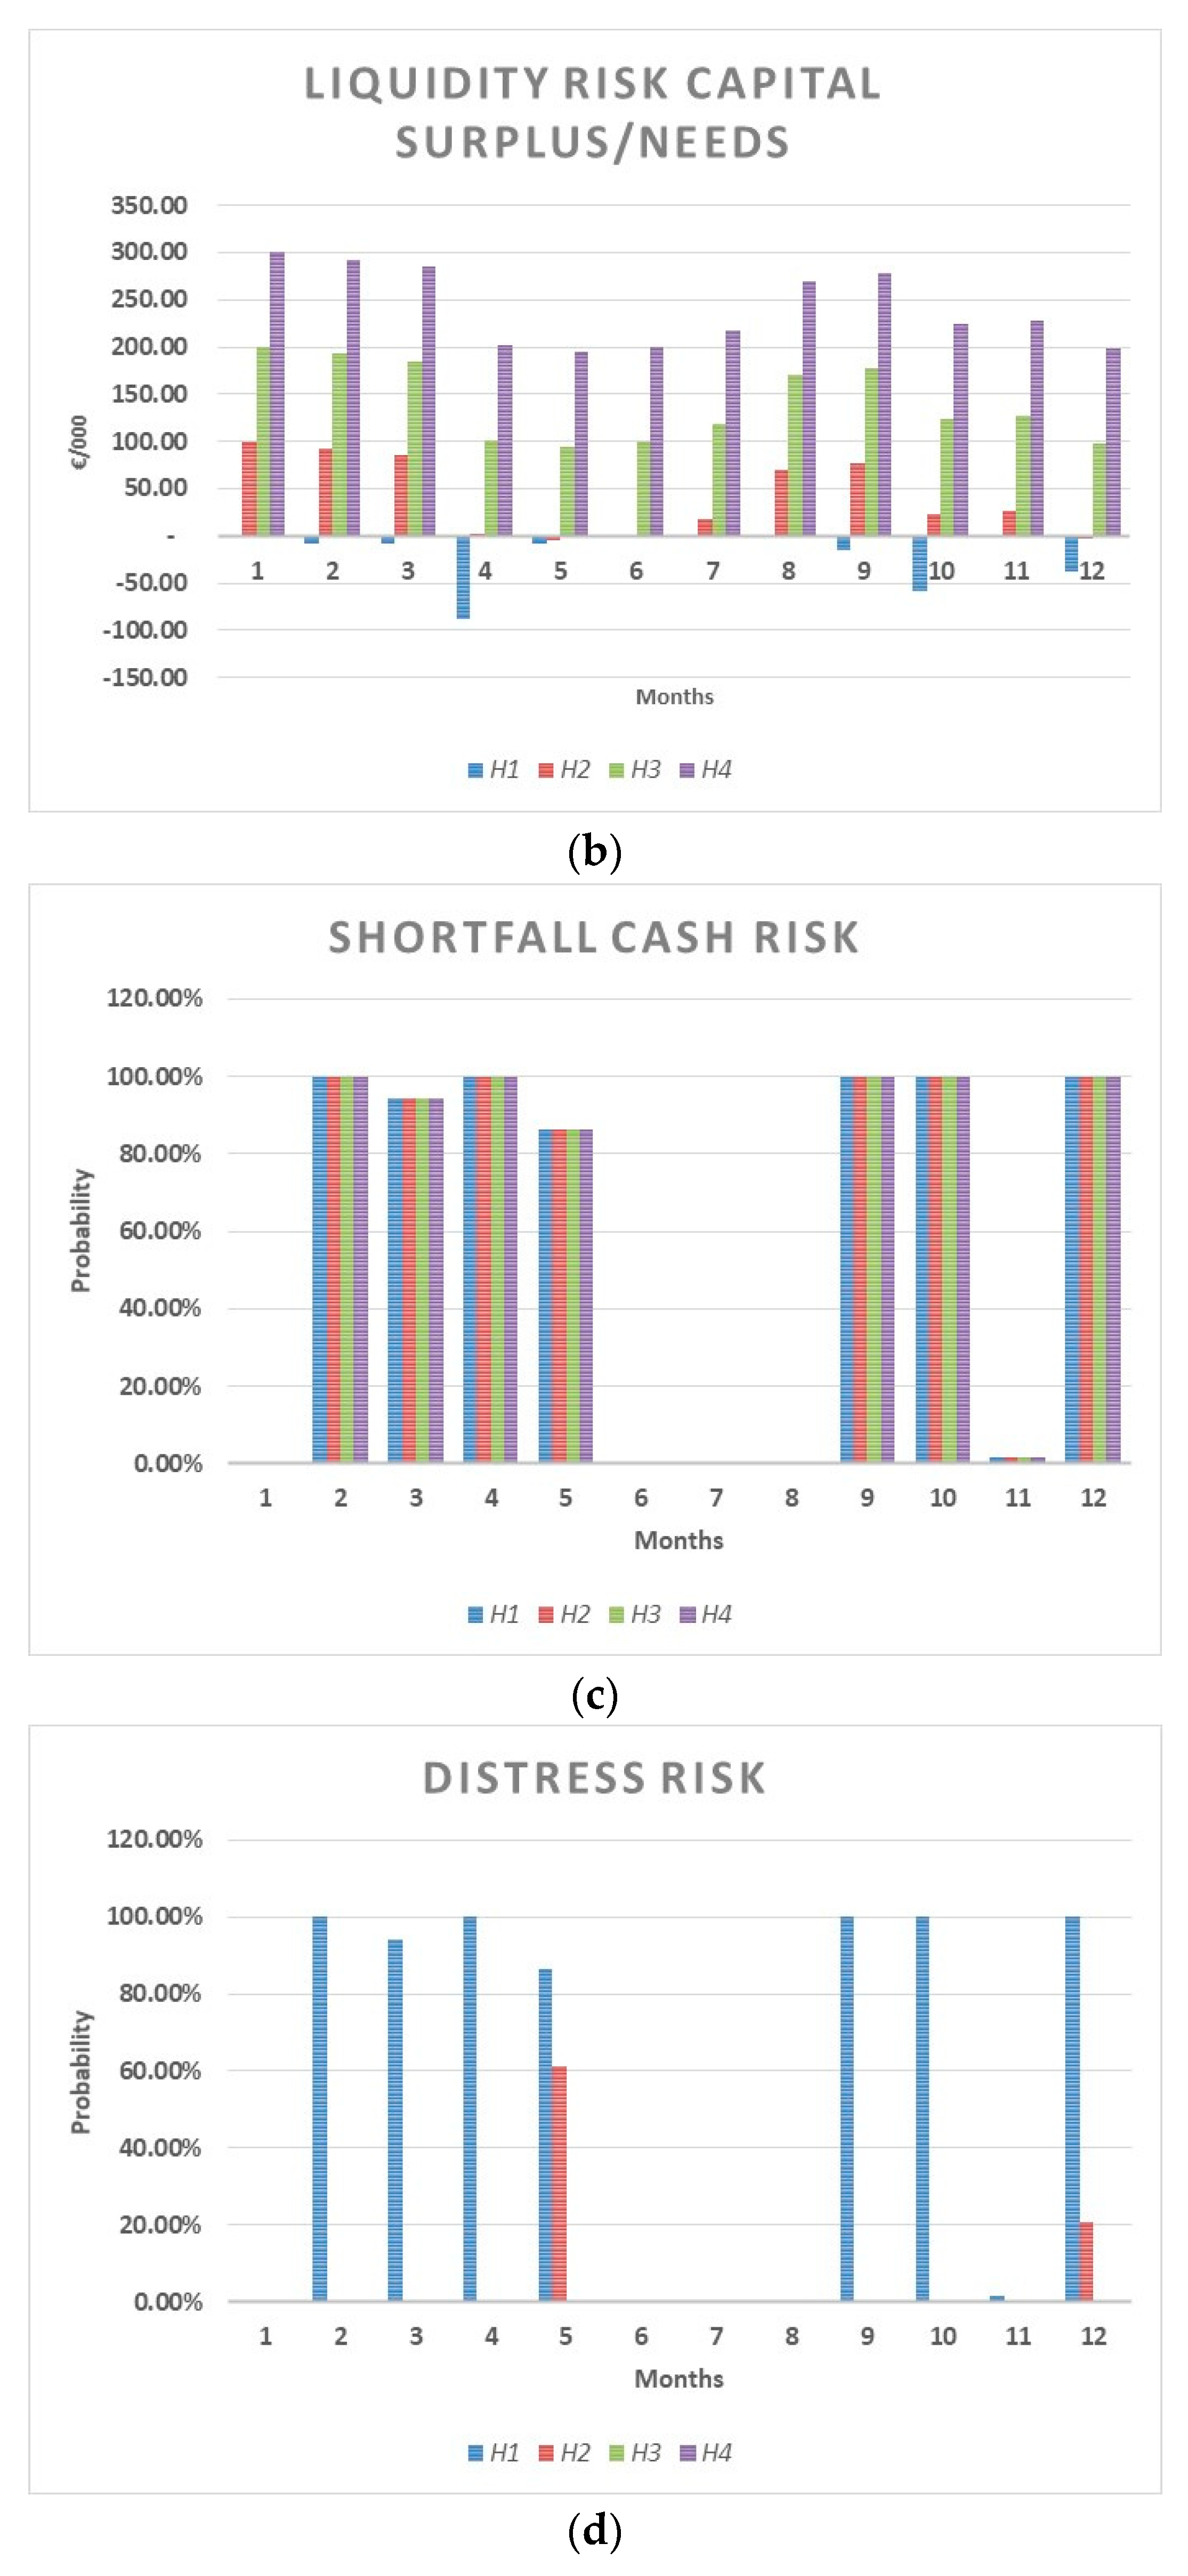
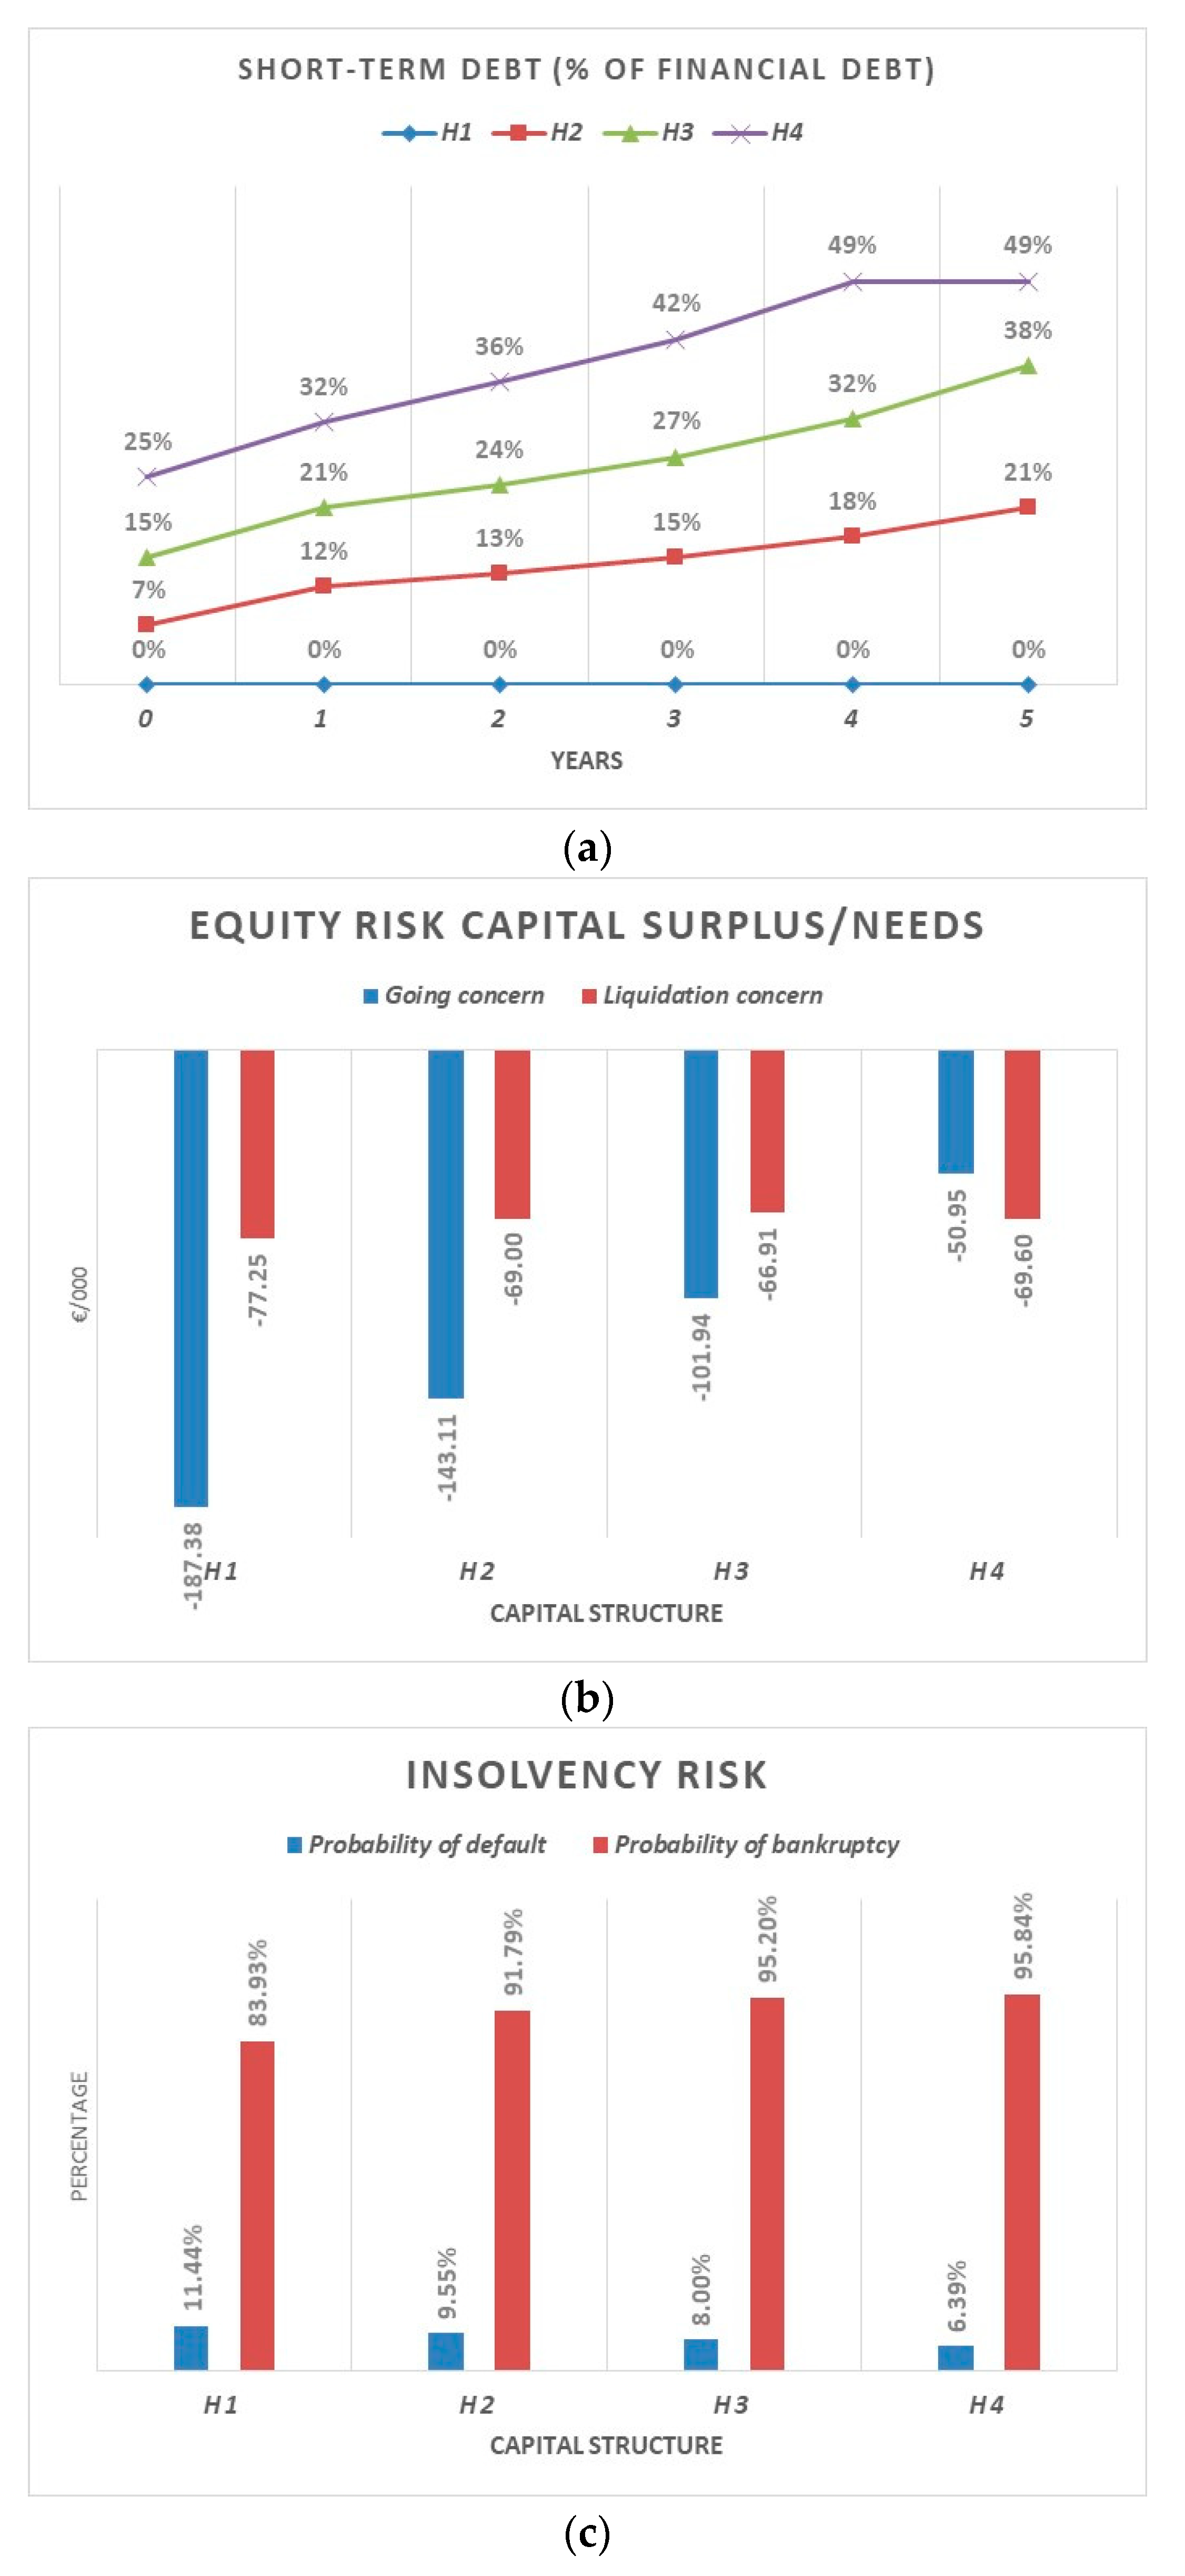
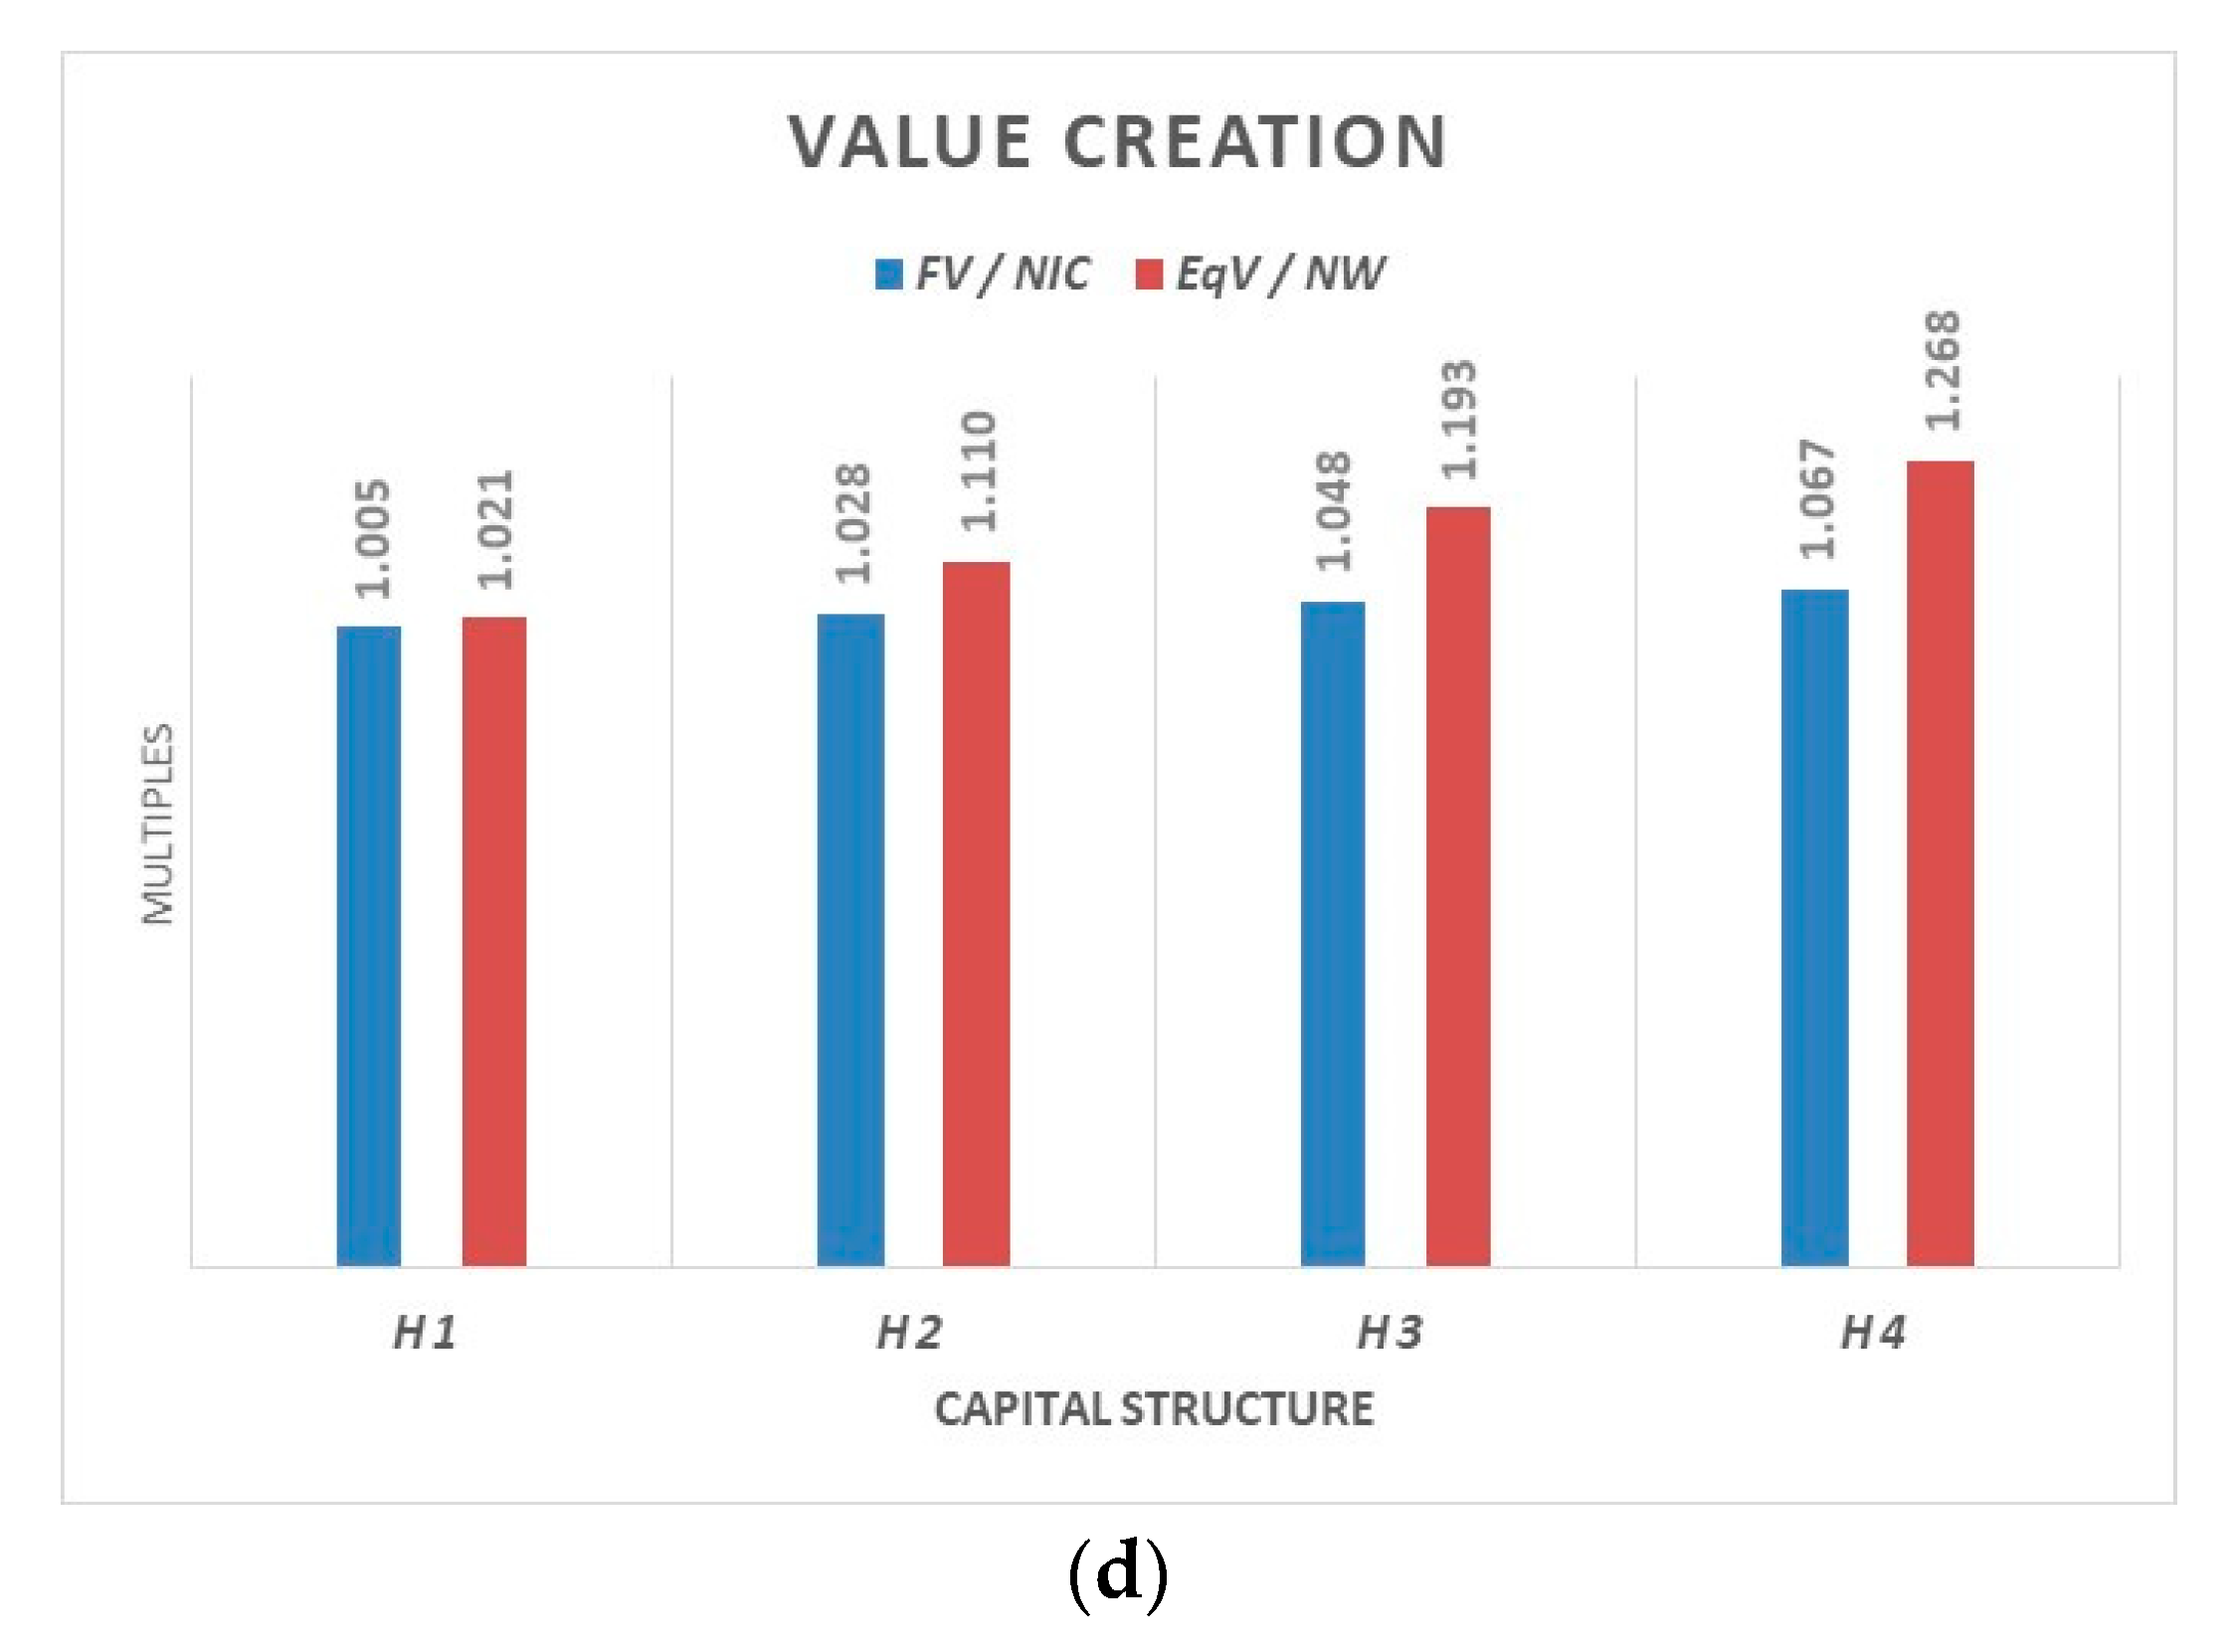
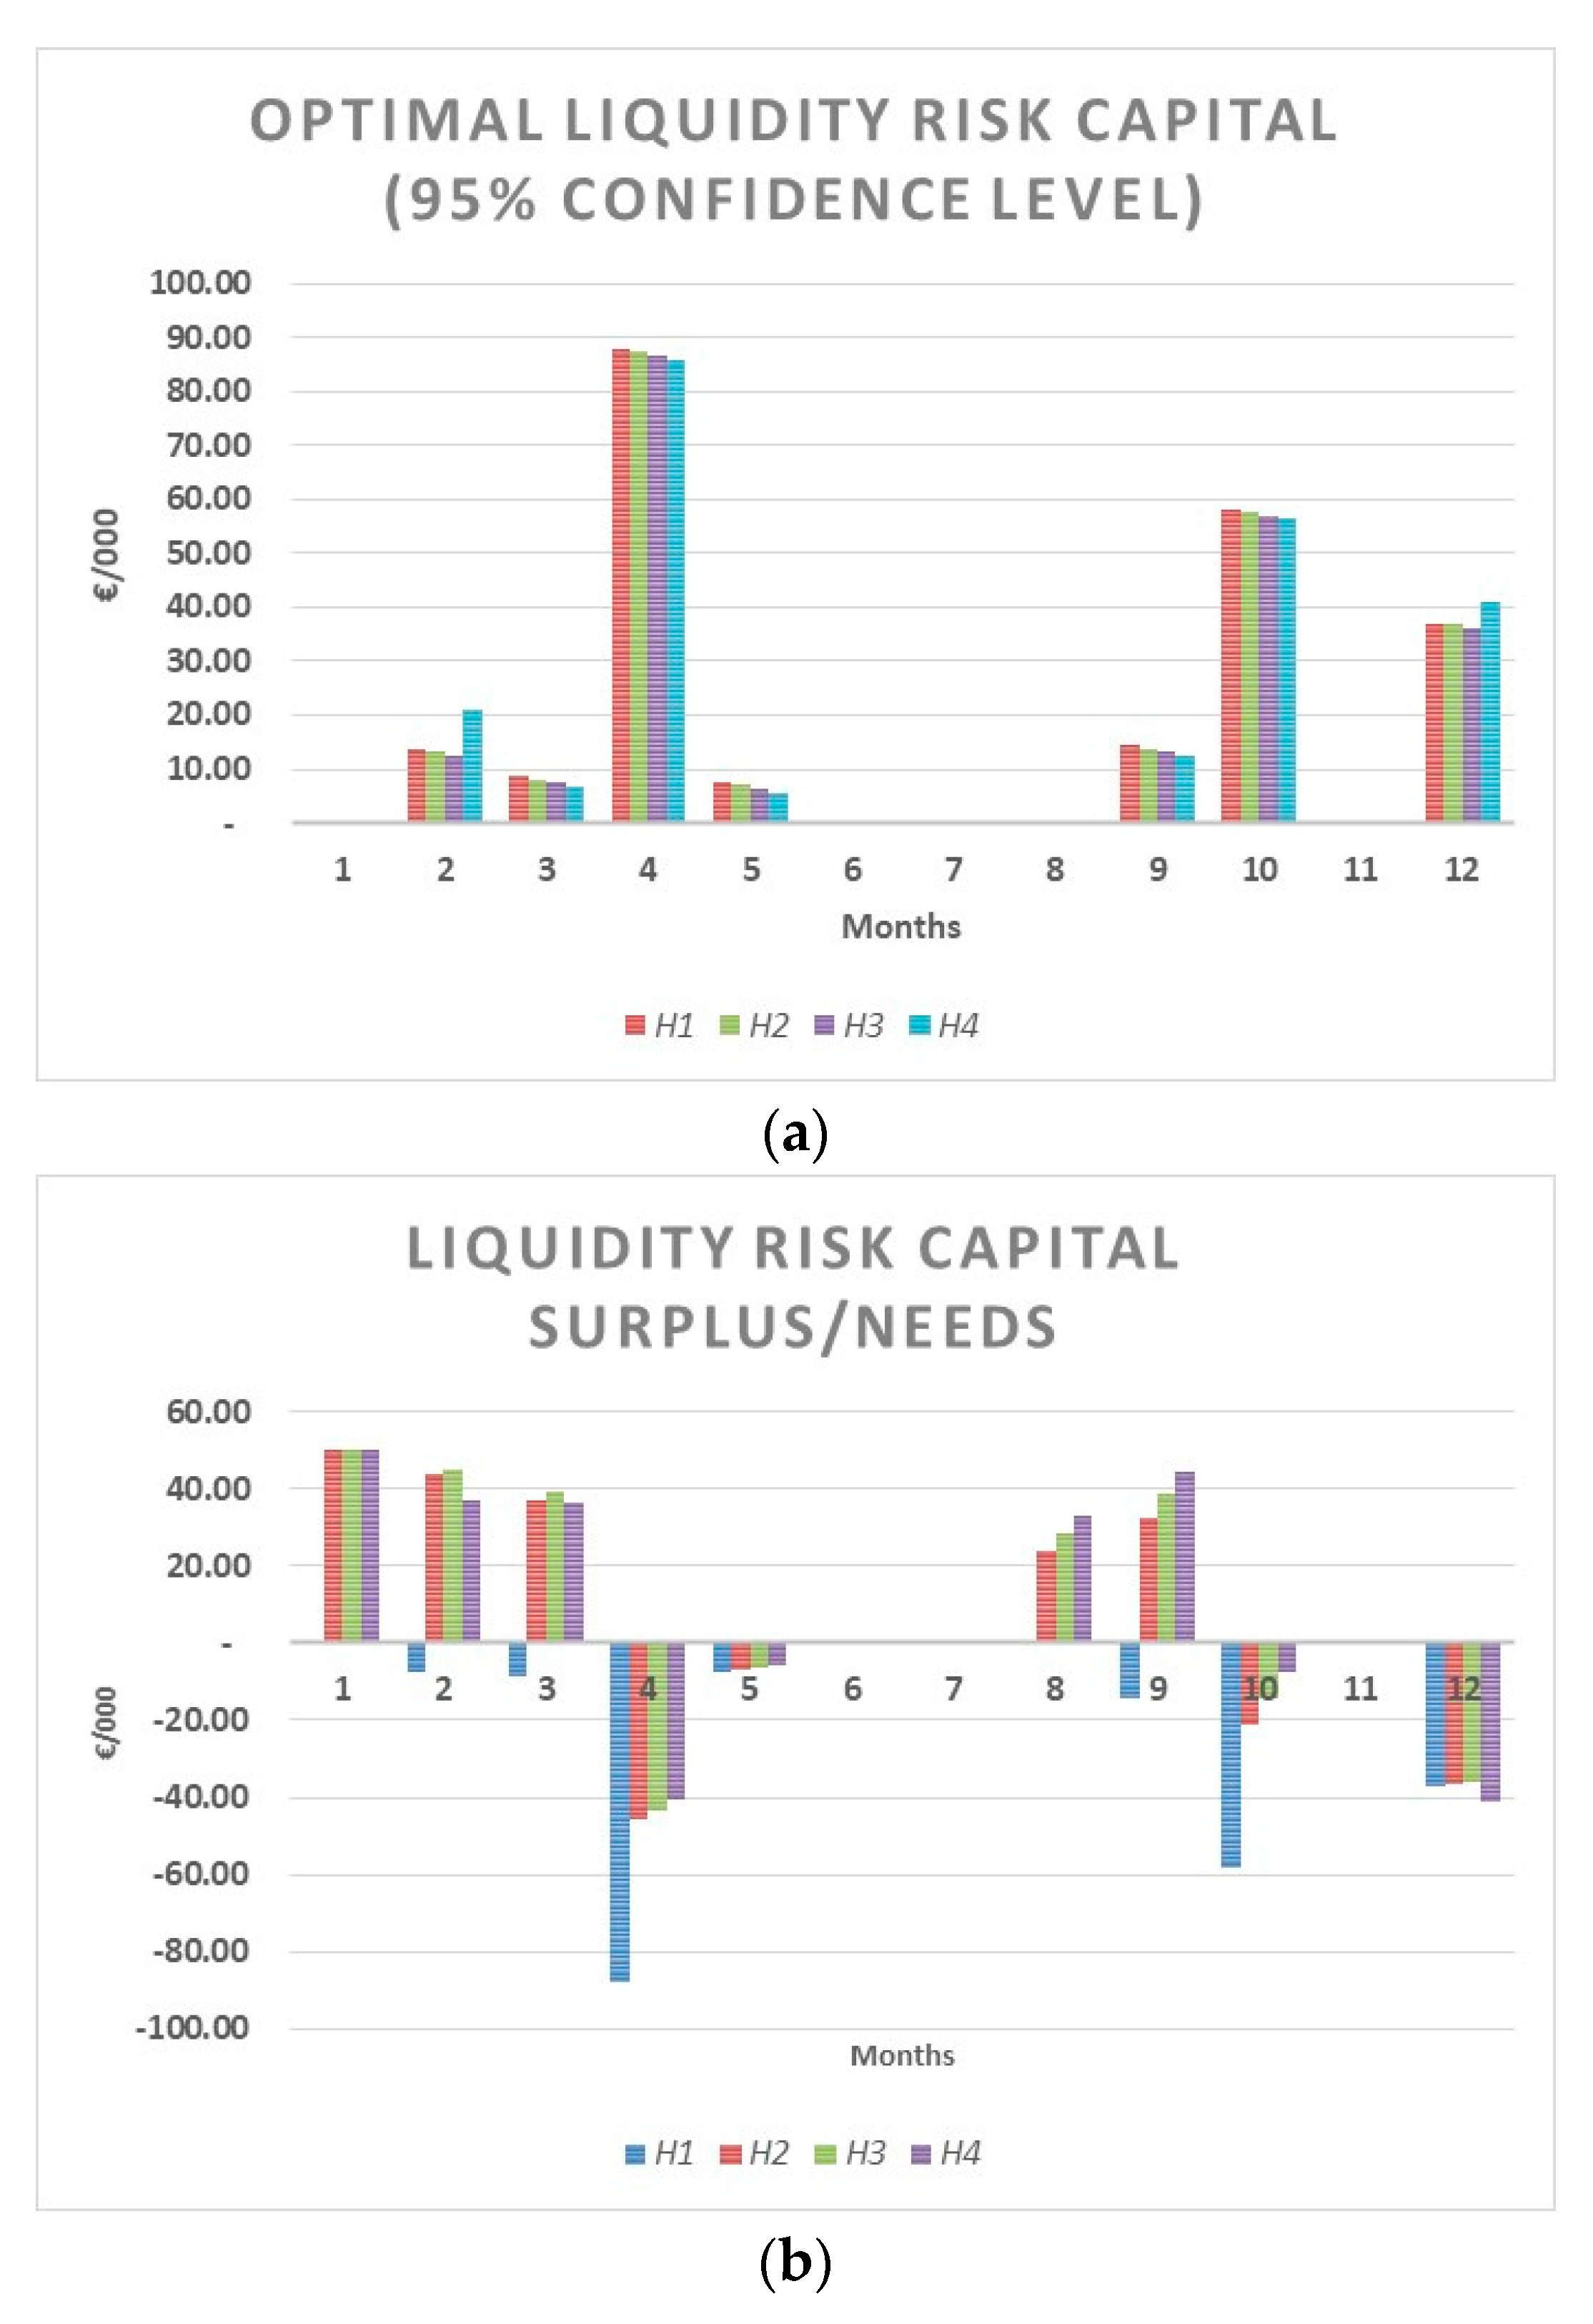
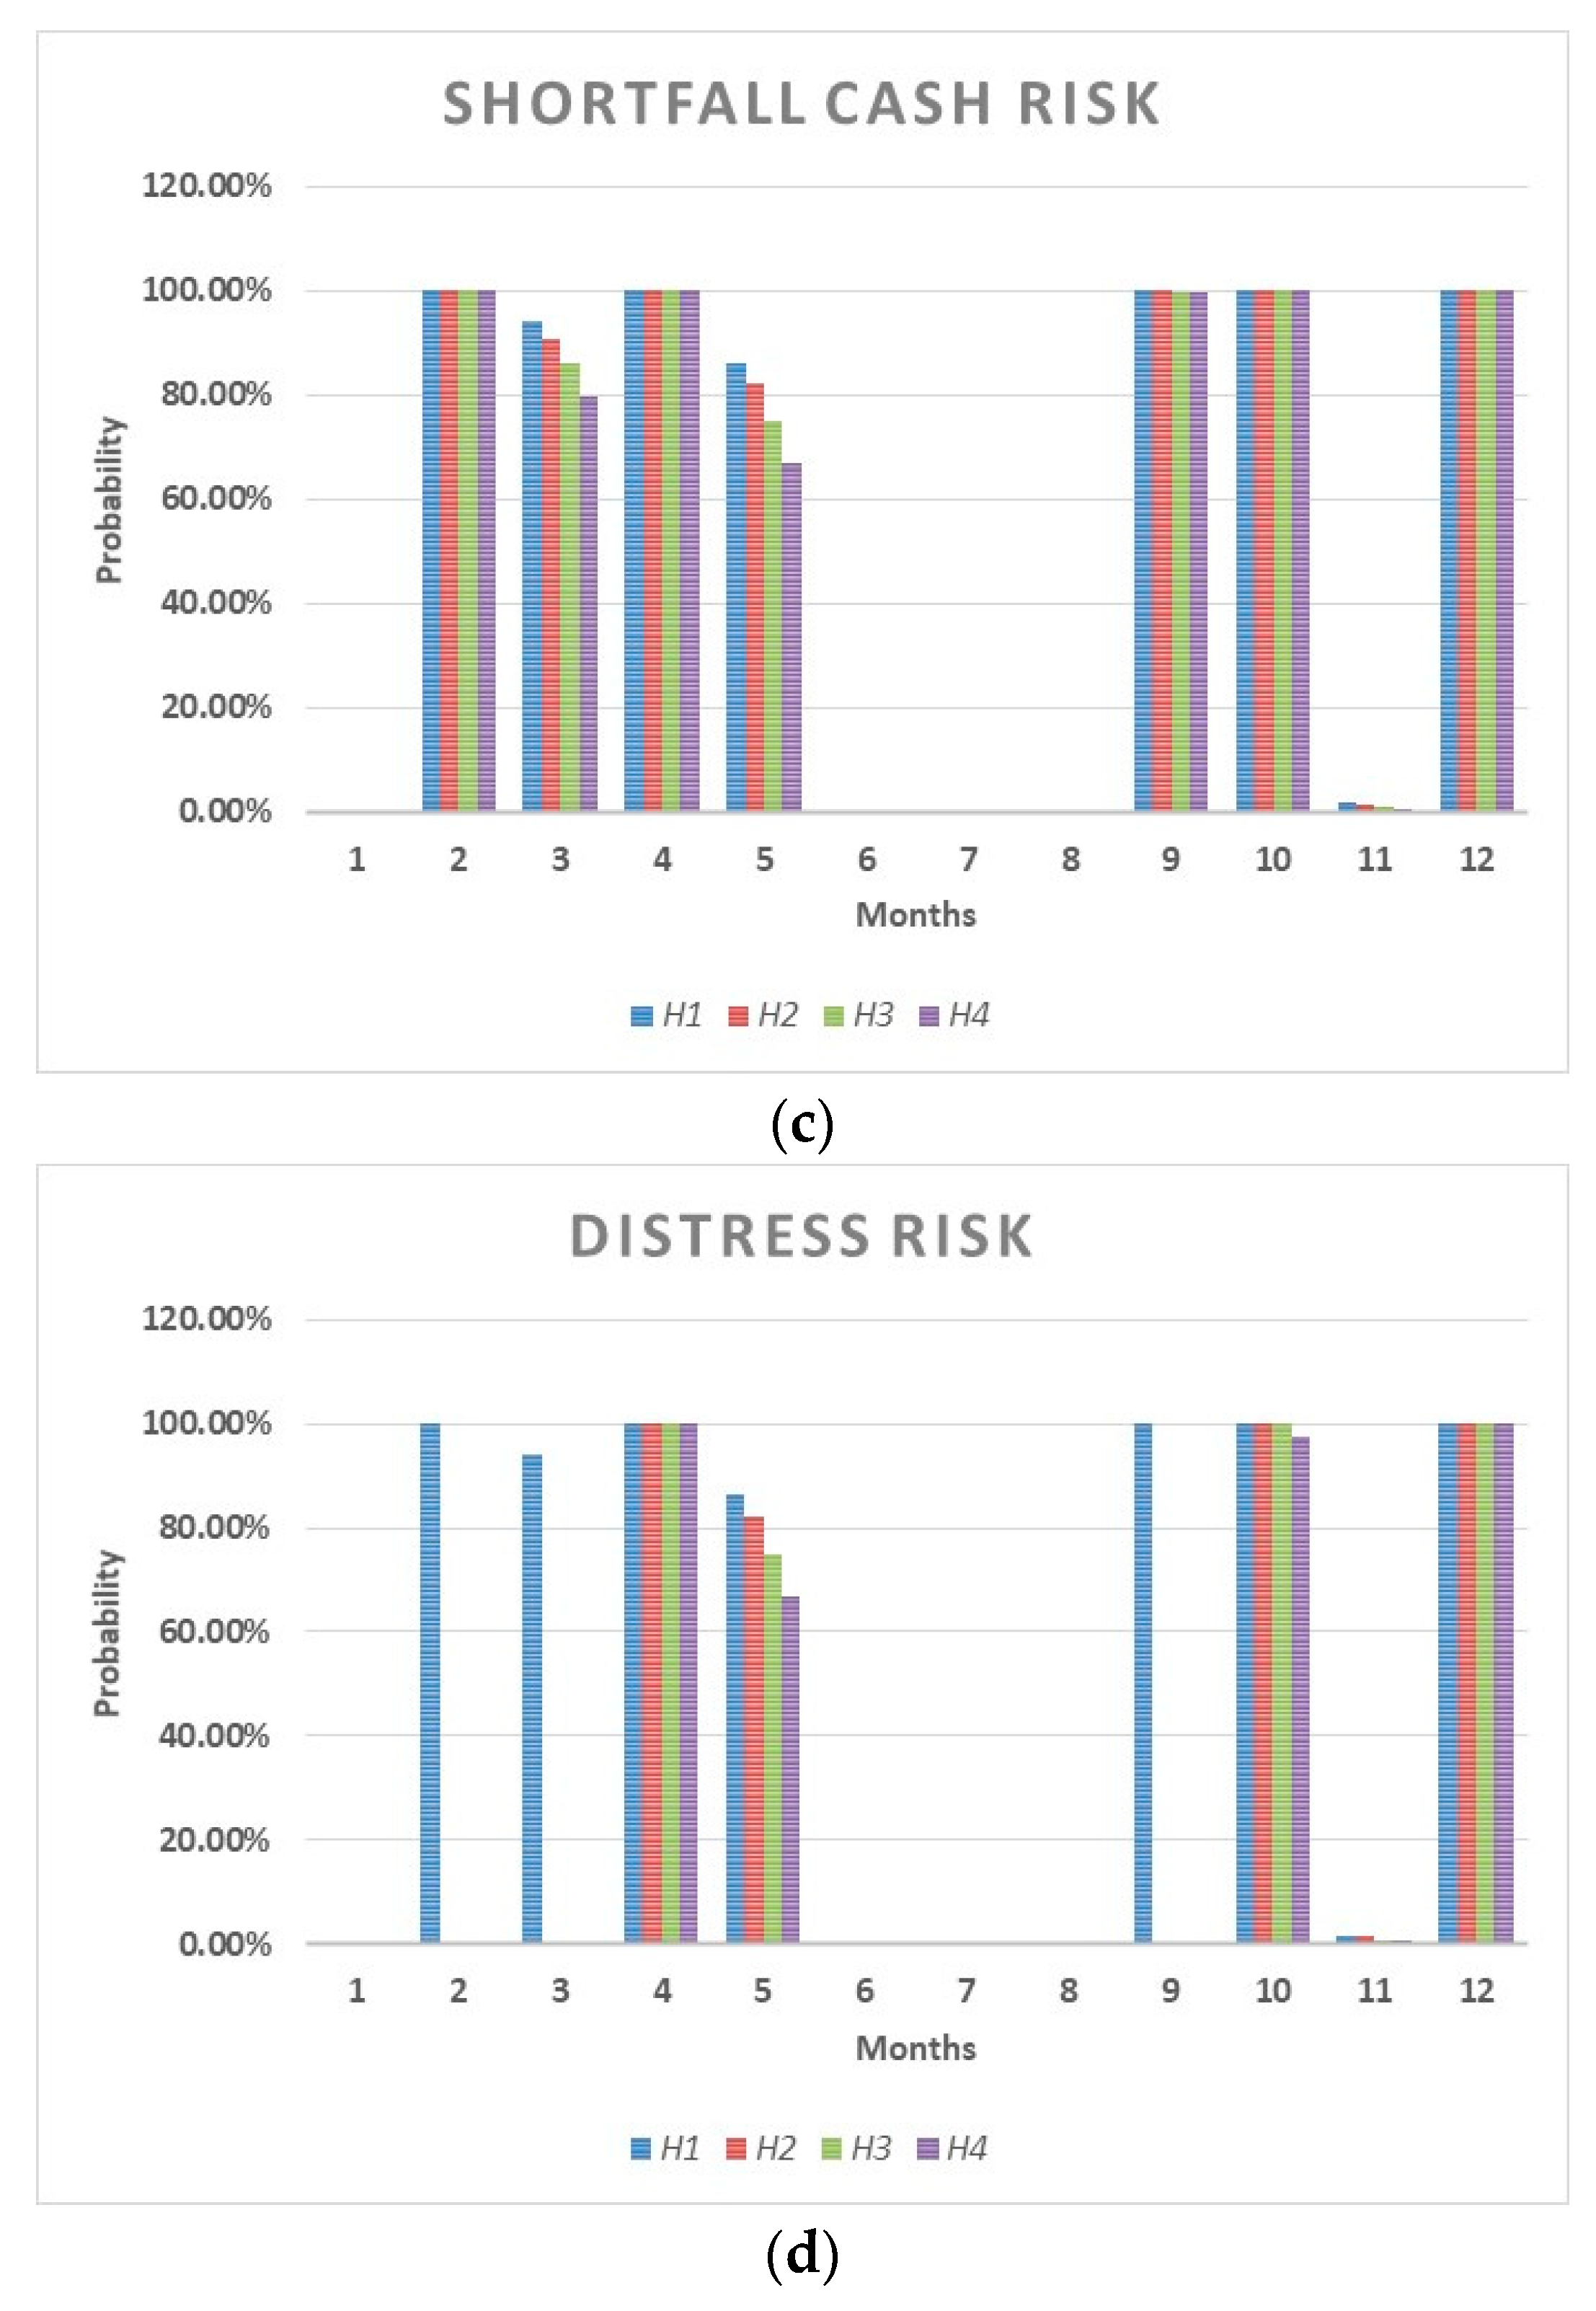
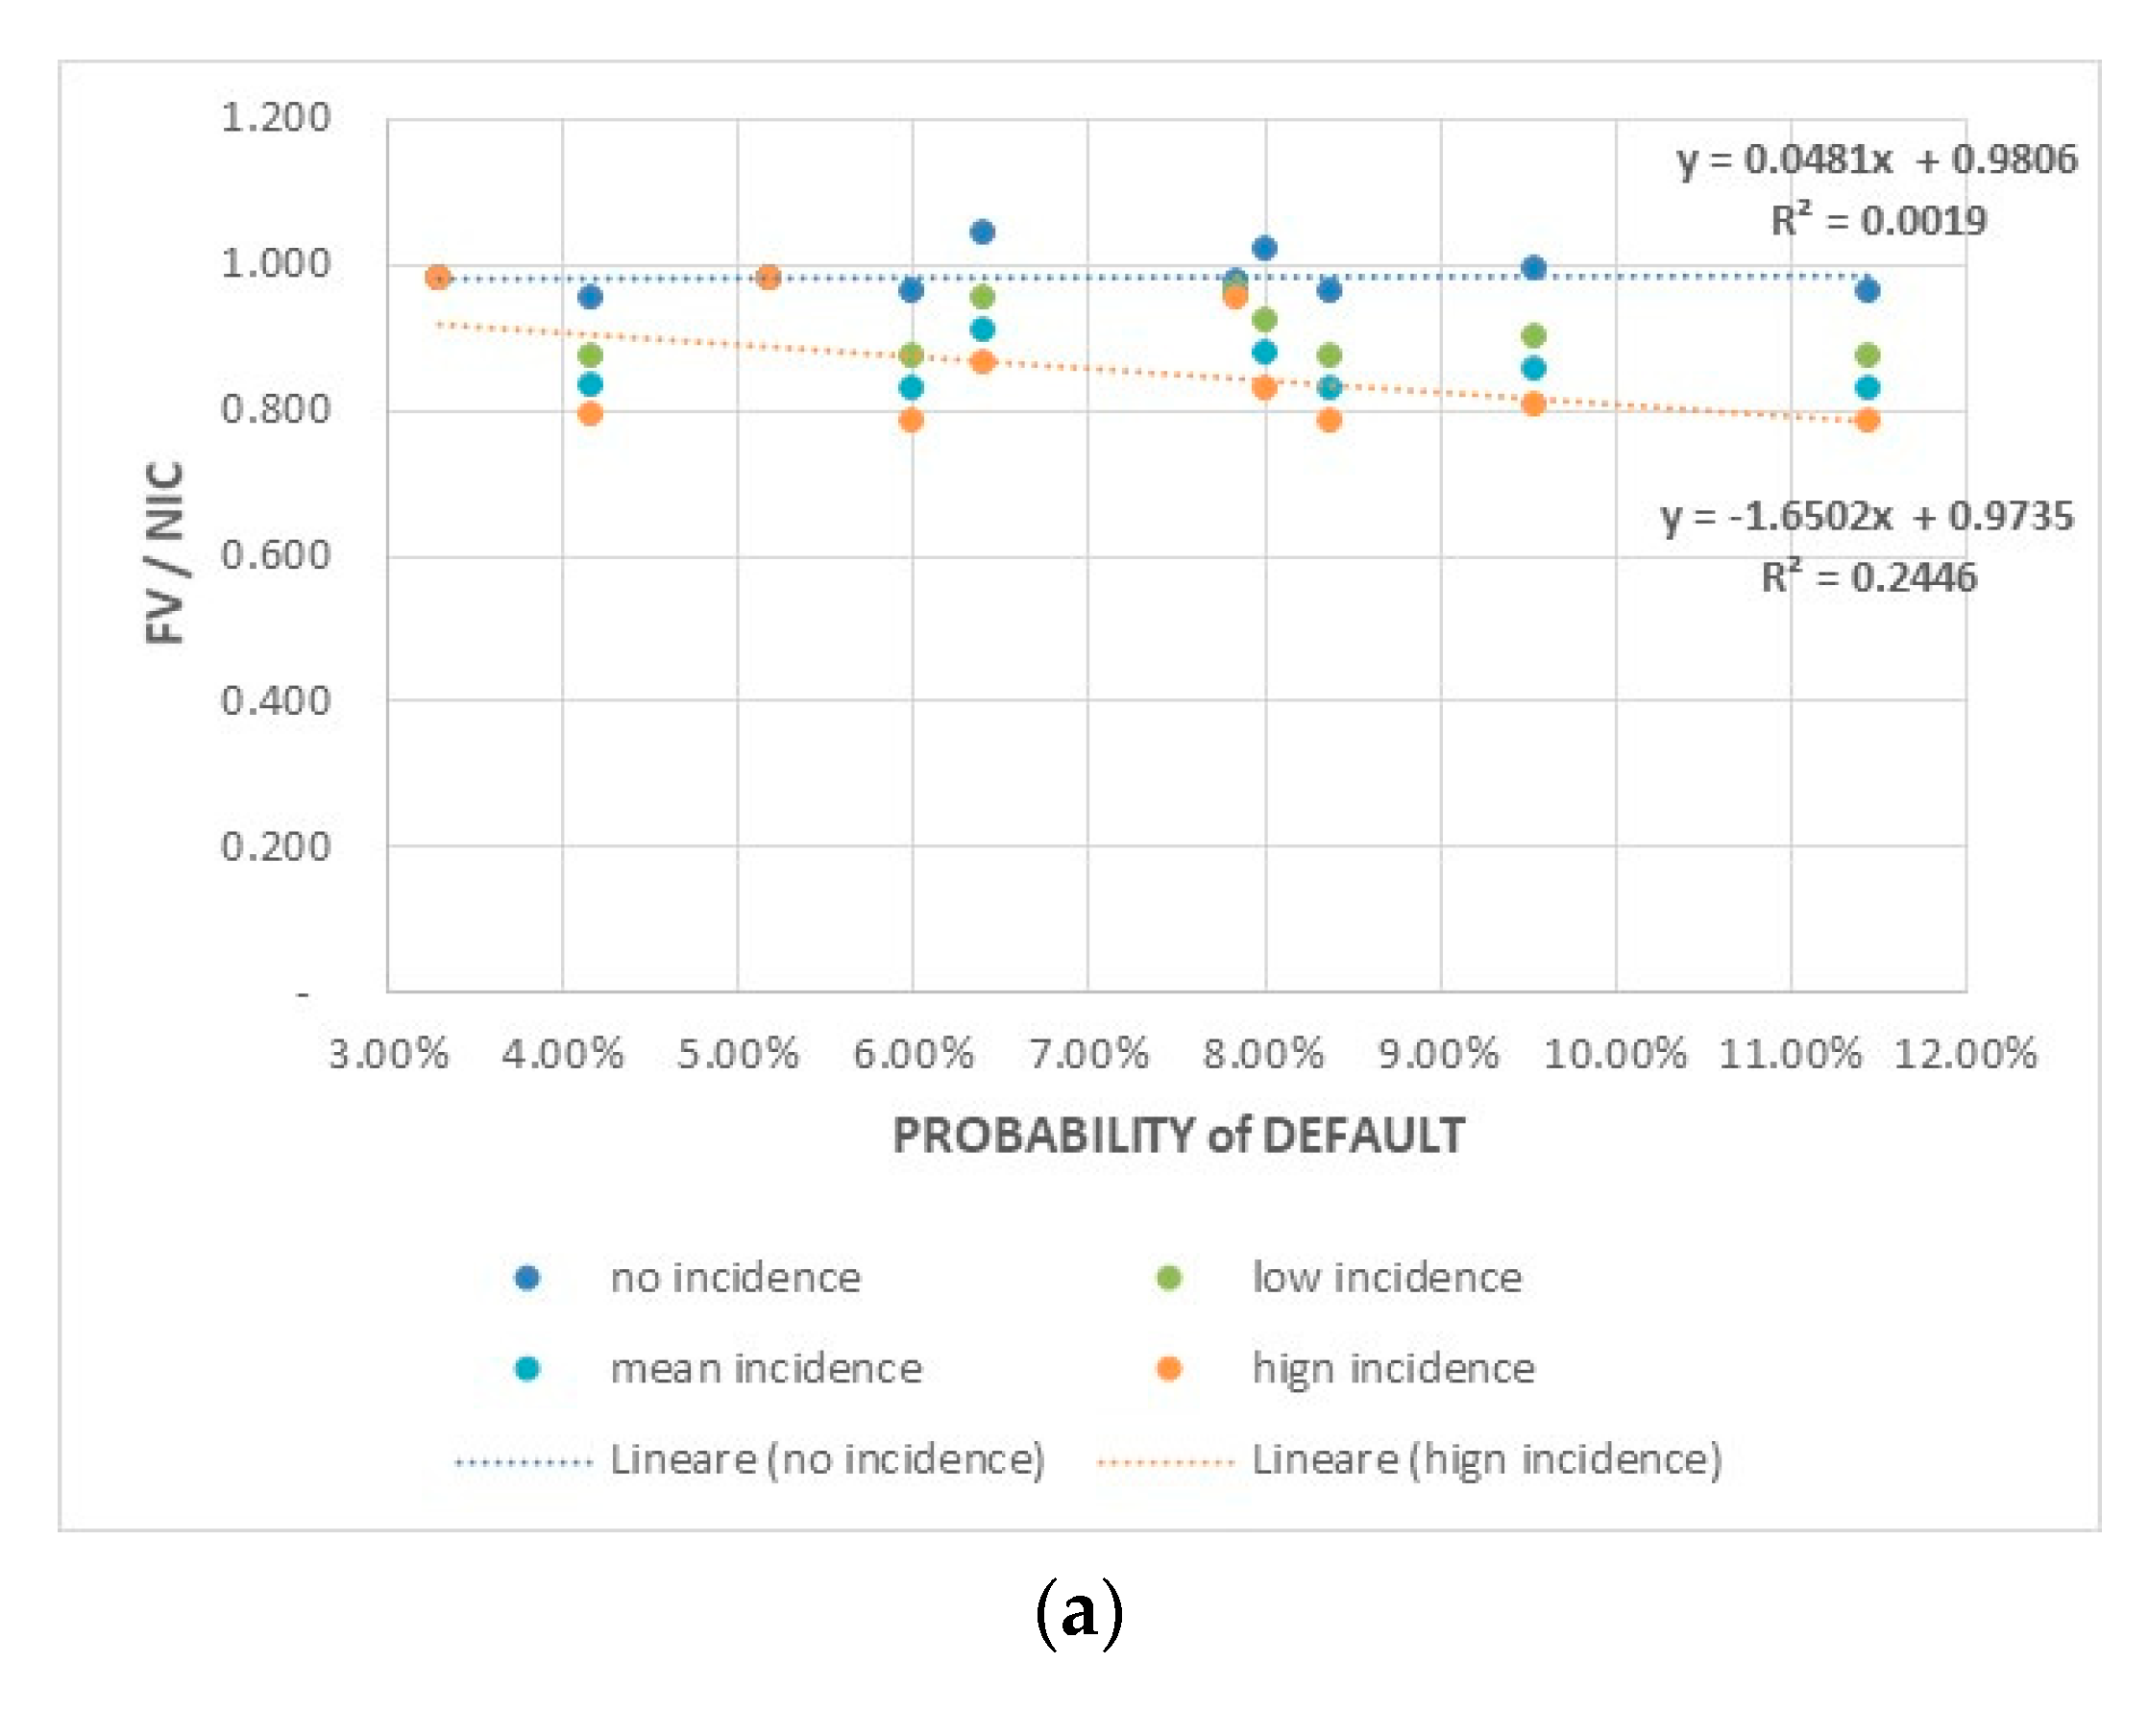
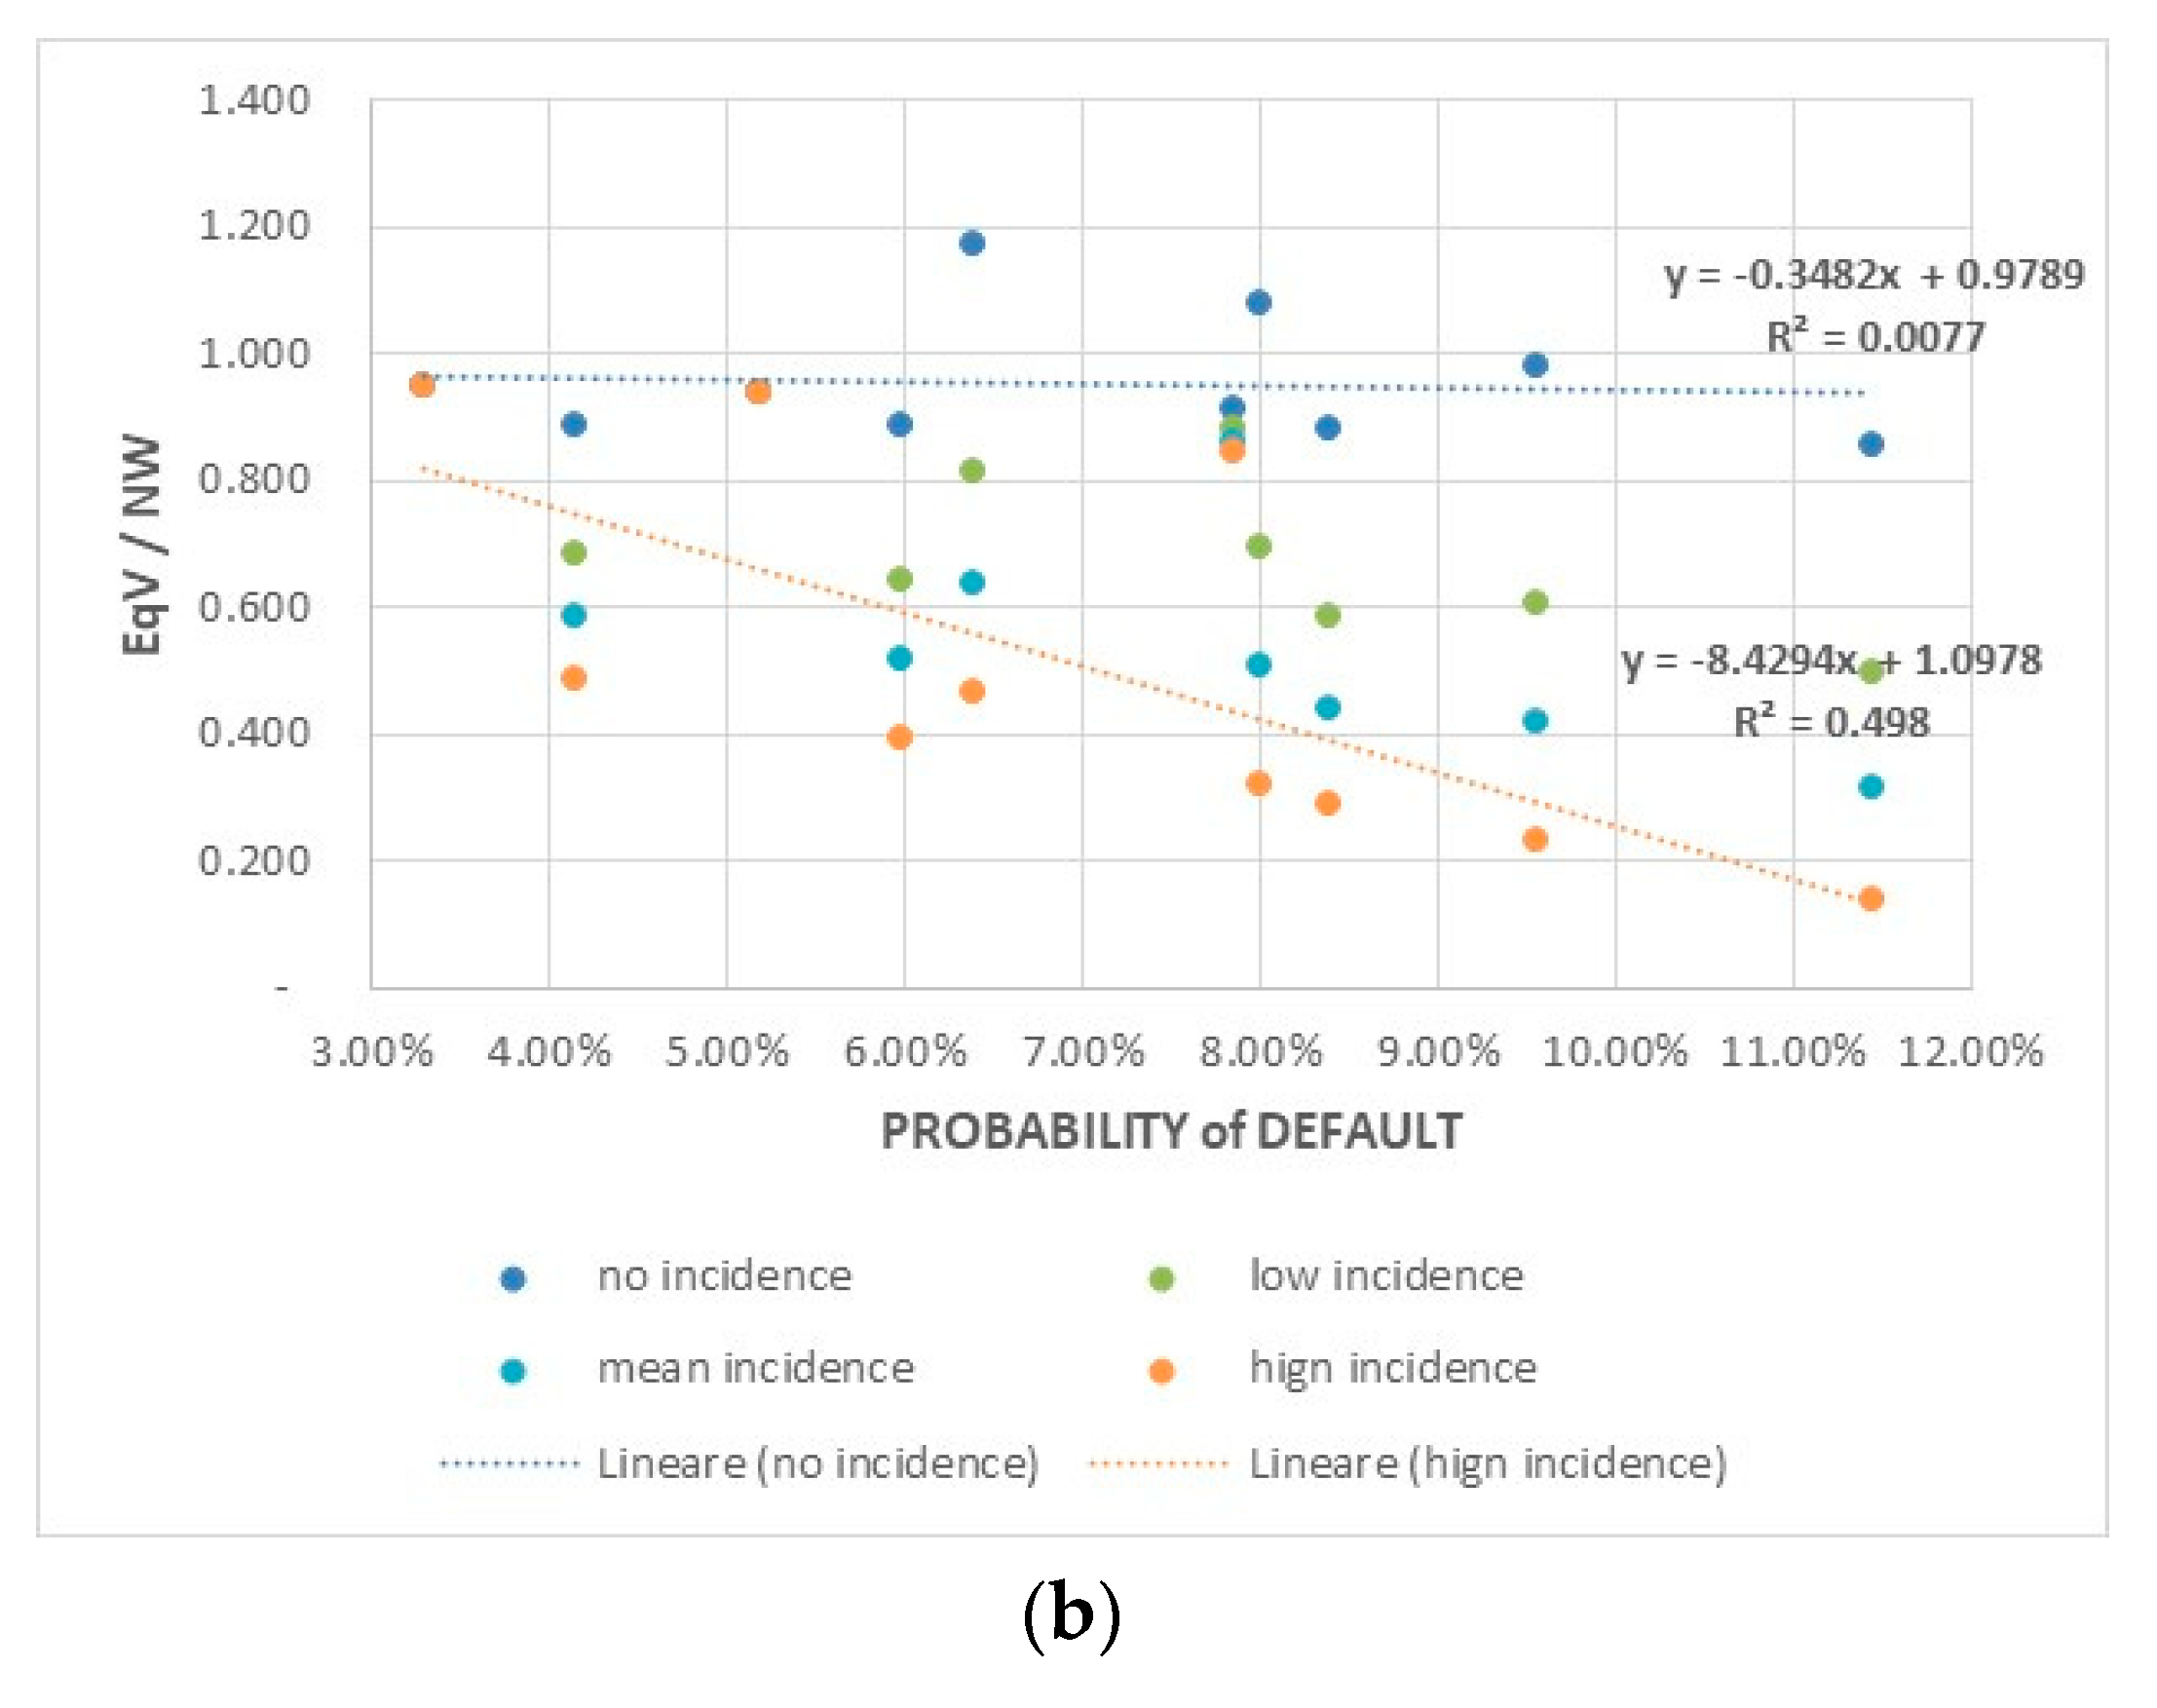
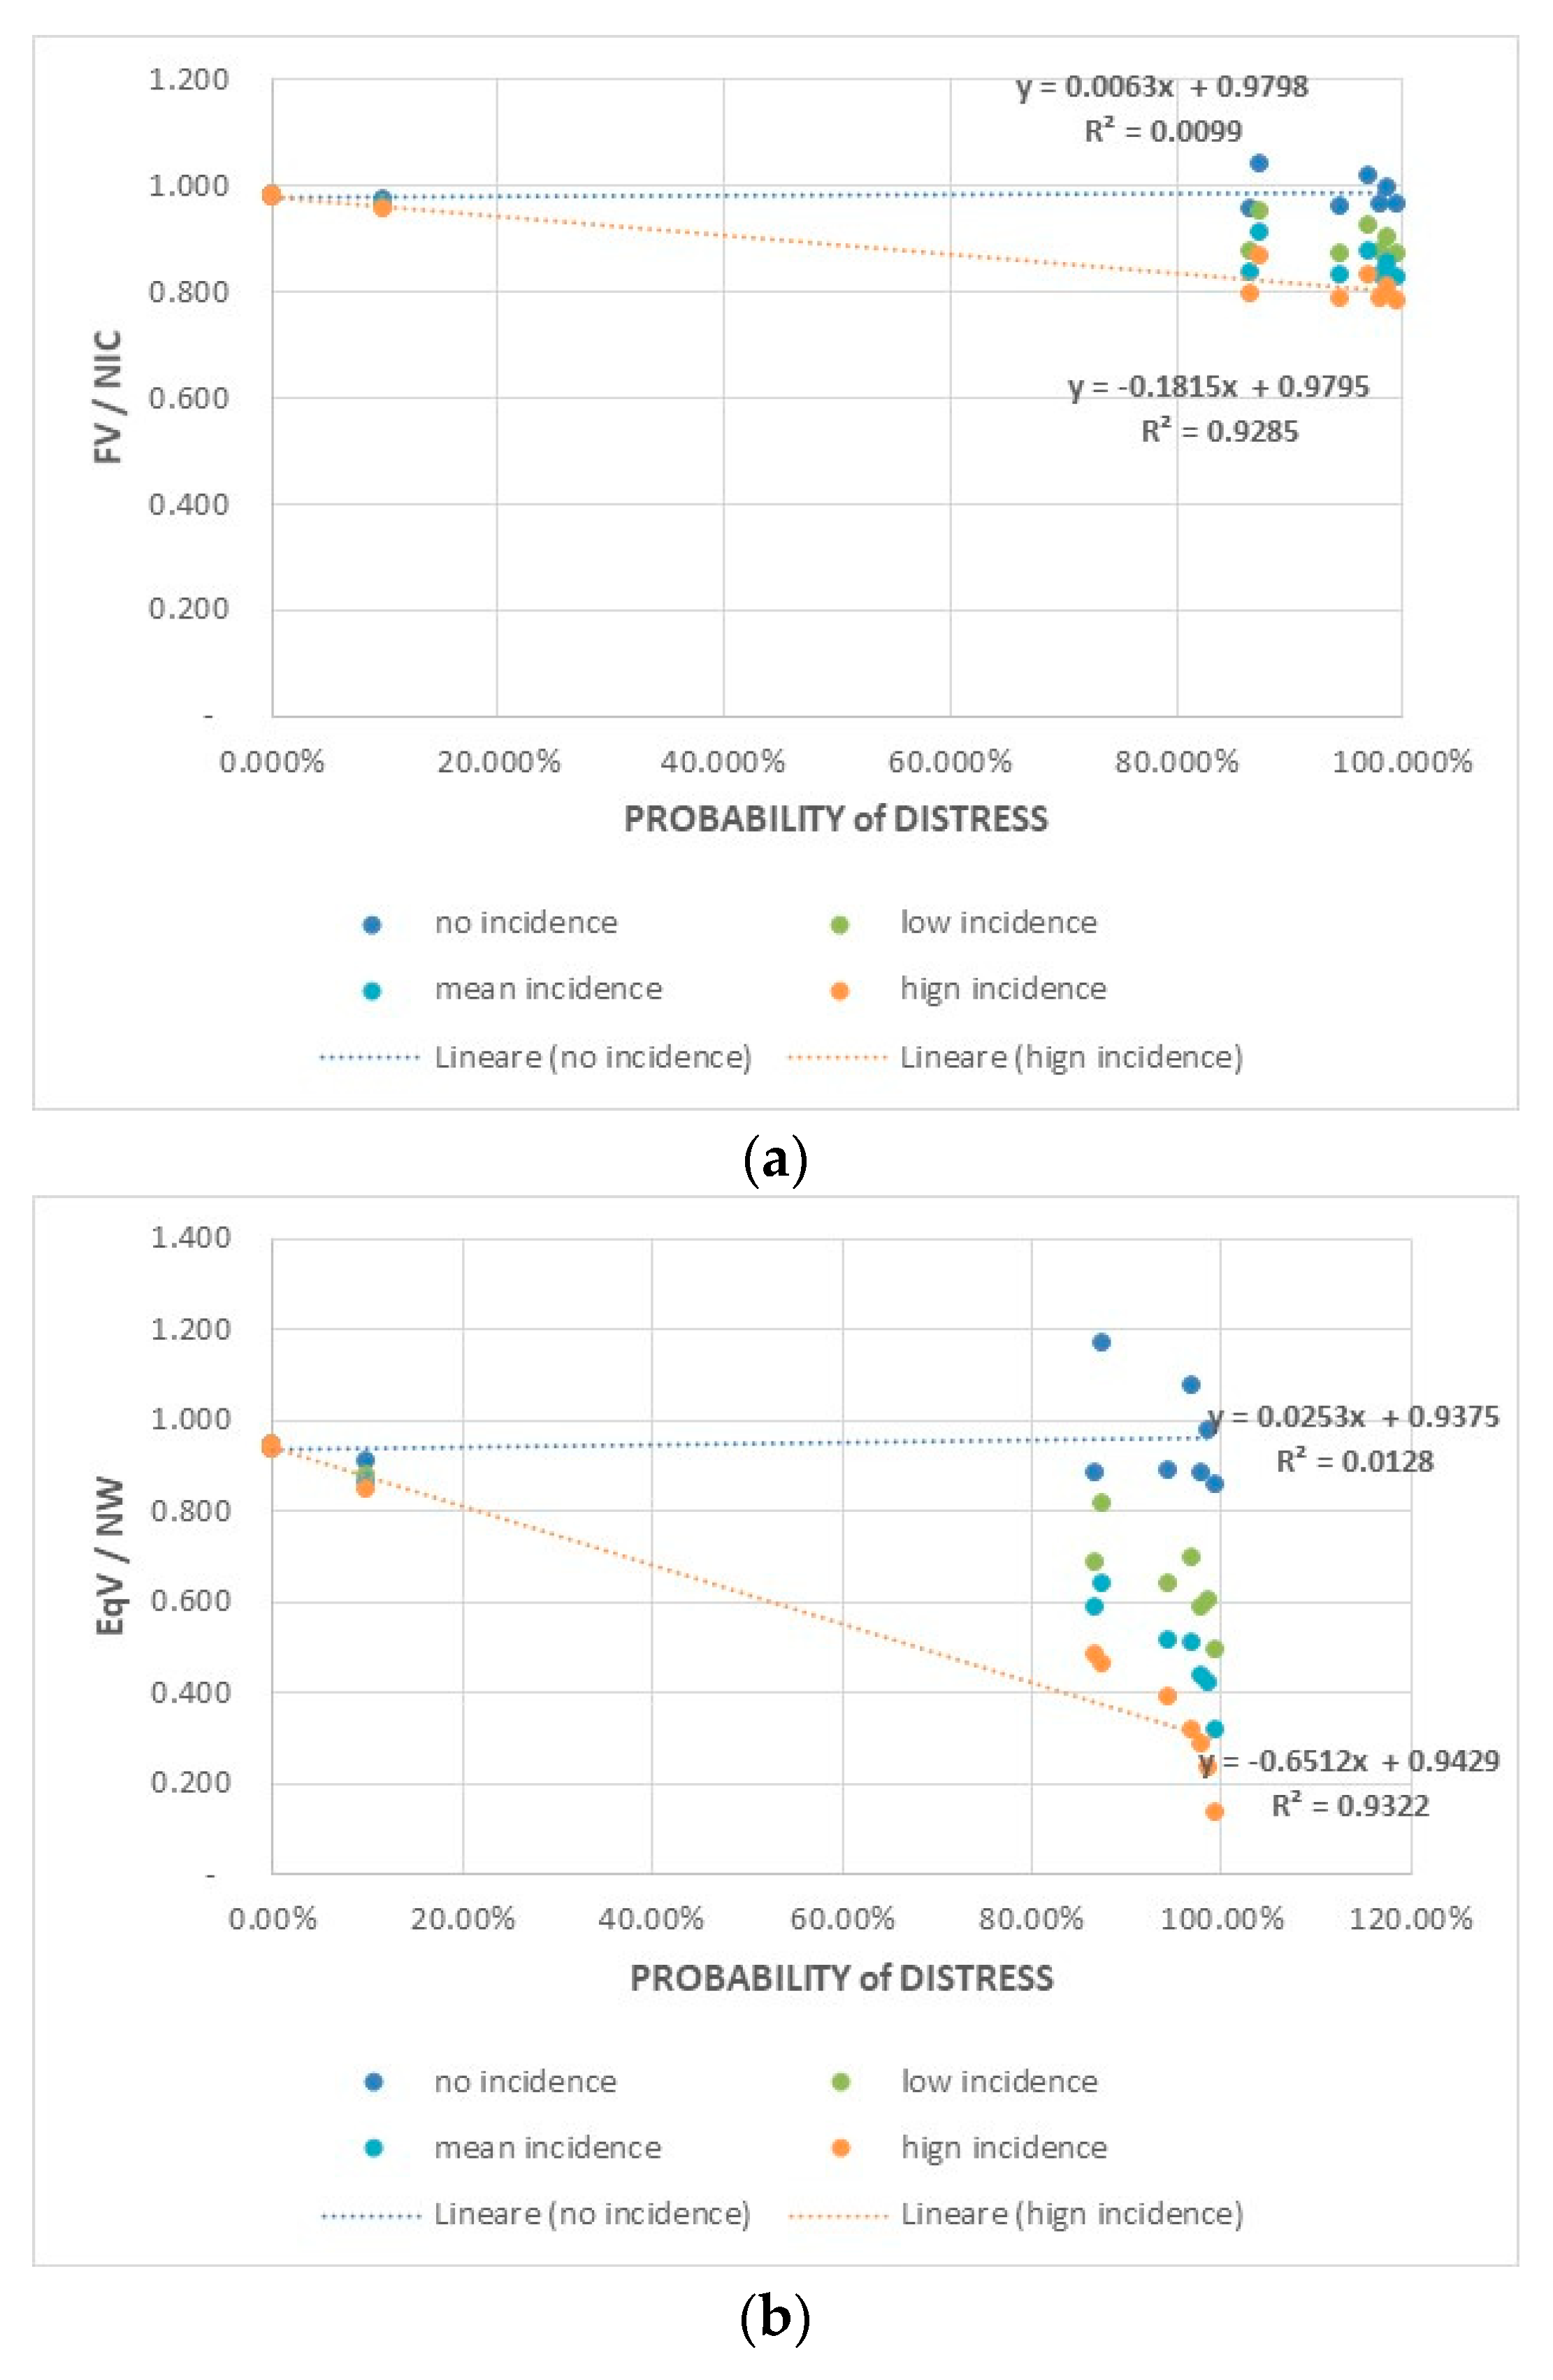
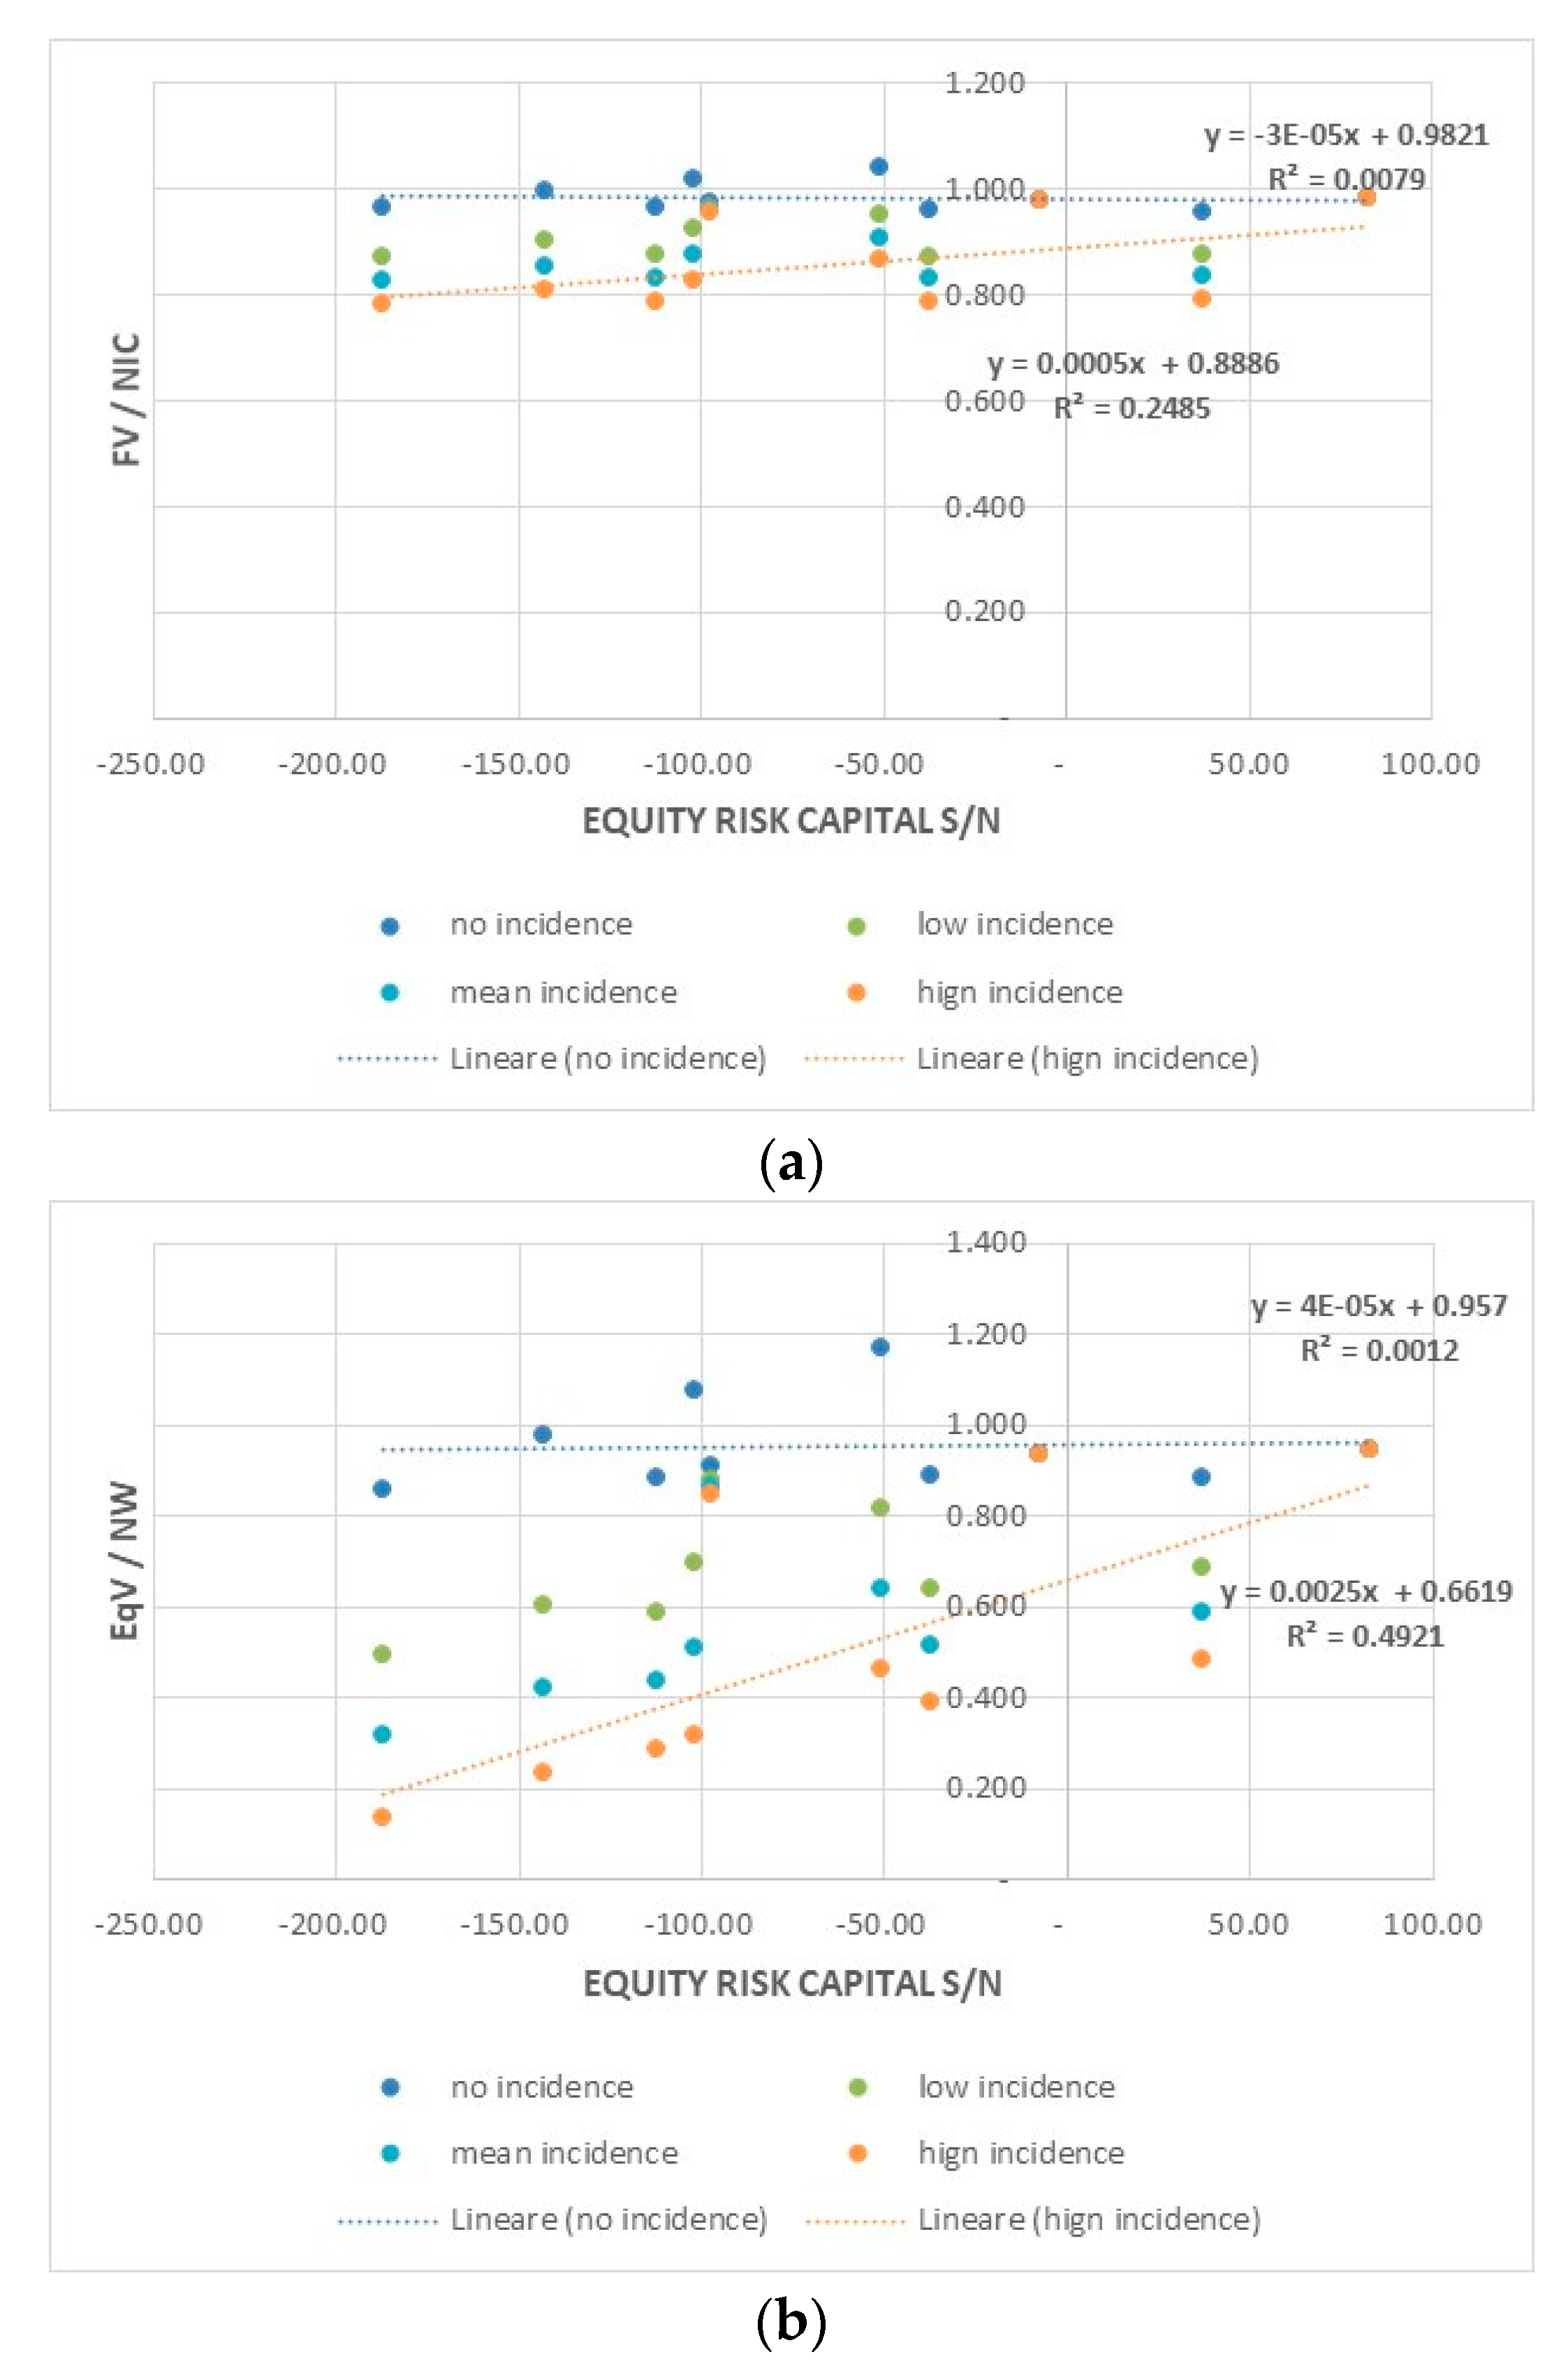
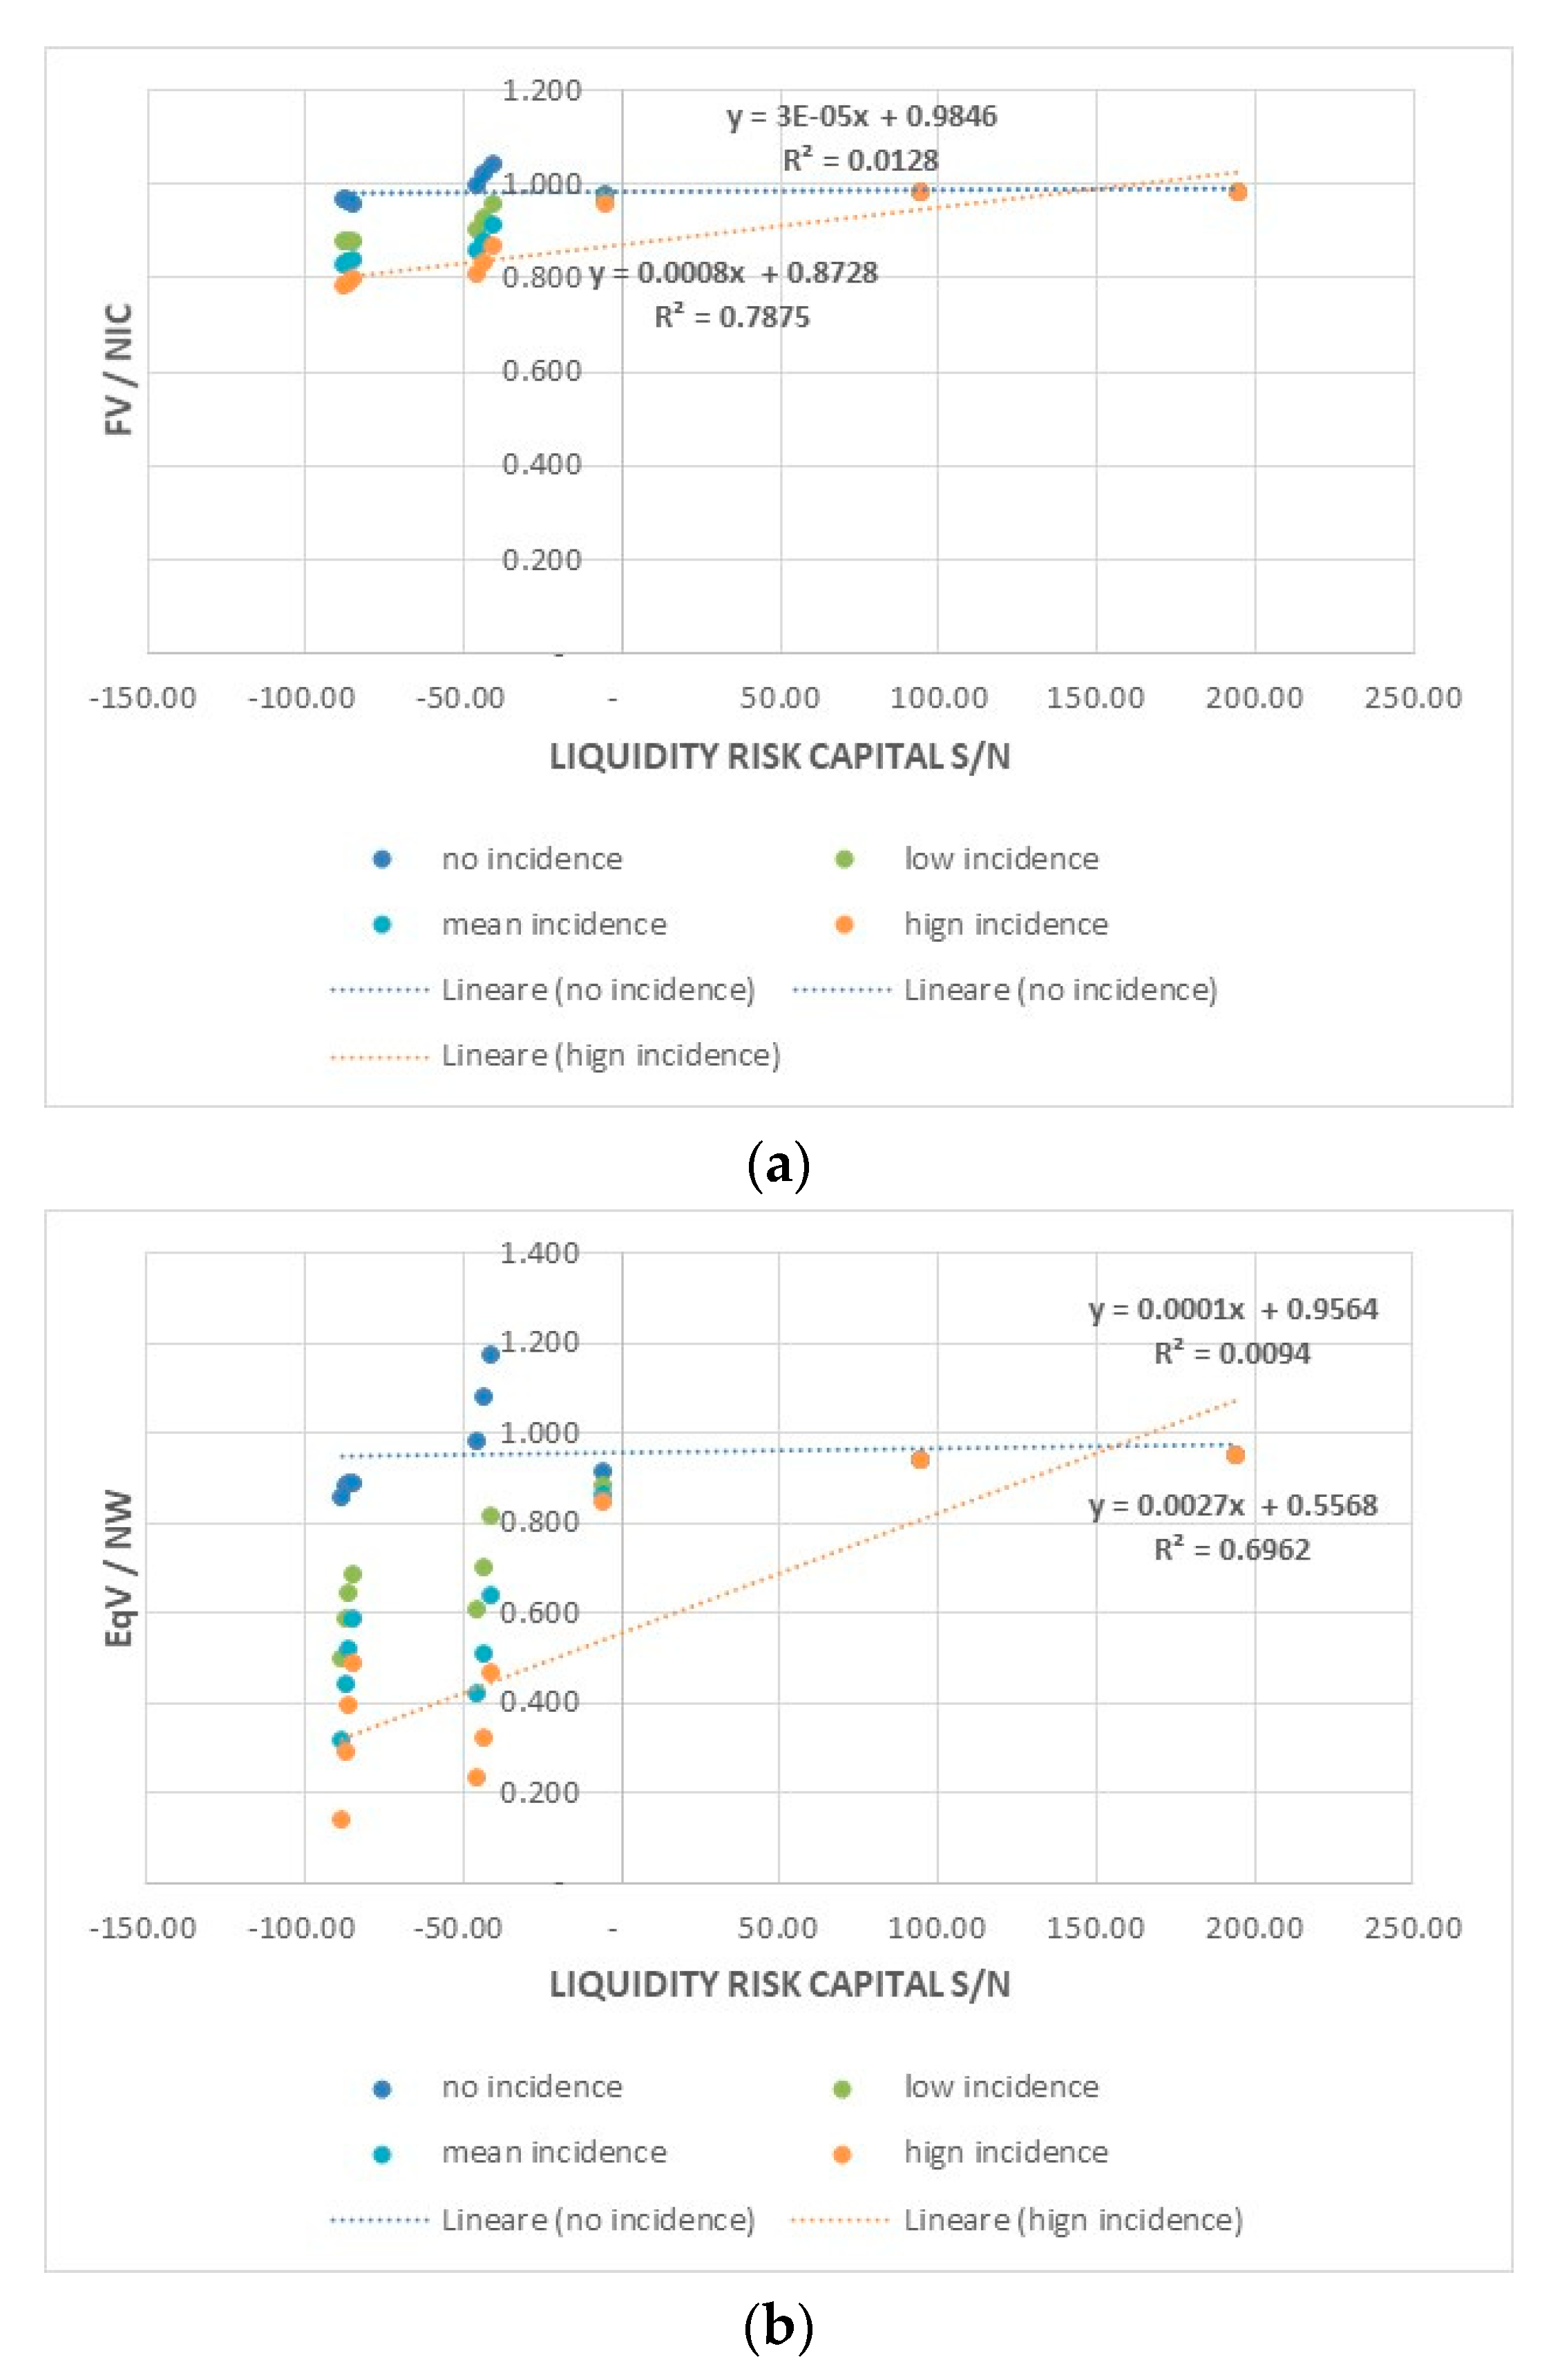
We model two measures of risk capital, the Liquidity Risk Capital and the Equity Risk Capital, considering specific definitions for distress risk and default risk, and focusing on the variability in operational cash flows in the short and medium to long term. To apply the VaR logic, a normal distribution of the expected cash flows is assumed, in order to link the risk capital measures and the firm’s risk tolerance through predefined confidence levels. The probabilities of financial distress and financial default deriving from the model are then used to adapt the firm value estimation to the insolvency risks and costs.
3.3. Risk-Based Capital Measures
Optimizing the capital structure then requires peculiar configurations of Risk Capital to cover the distress risk and the default risk defined above.
To quantify the financial resources a company needs to absorb a financial distress, we consider that corporate solvency is guaranteed when the following two conditions are steadily met:
- -
the operating cash flow generated by the company in a given period and available to lenders (cash flow to firm, CFF) is equal to, or higher than, the cash flow to service the debt in the same period (cash flow on debt, CFD);
- -
if the previous condition is not met, the firm’s solvency is still guaranteed when liquid assets (cash and cash equivalents), increased by the contingent capital (mainly debt reserves), are equal to, or higher than, the lack of CFF, which does not allow the firm to fully cover the CFD in a given period.
The first condition deals with the risk of a cash shortfall, which is normally addressed by optimizing the equilibrium between operating inflows and outflows; the second one deals with the liquidity risk. Both can be treated in a probabilistic way, coherent with the ERM, considering the future cash flow of a given period as the expected value of random variables with a certain probabilistic distribution.
To quantify how much capital should be allocated to cover the liquidity risk, the VaR logic could be applied to estimate the Liquidity Risk Capital (LRC)—i.e., the optimal level of liquidity—on the basis of a certain level of confidence. Two basic choices must be made:
- -
firstly, whether to consider negative CFF (financial operating losses) or results lower than certain safety thresholds (negative deviations);
- -
secondly, how to consider the probability distributions for the expected cash flows.
Since
CFF is a random variable, the
CFaR is defined as the difference between the expected cash flow, for which a normal distribution is assumed, and the cash flow associated with a chosen confidence level:
The
CFaR is not a measure of distress risk because it actually does not indicate the ability to remunerate or repay loans. It is therefore necessary to define a risk measure according to a specific threshold. The Liquidity Risk Capital,
LRCtα, is defined as the difference between the cash flows serving the debt,
CFDt, and the minimal expected cash flows with a given confidence level
α,
Eα(CFFt):
with
If the CFD is also a random variable (Normally, a relevant portion of financial debt, especially if short-term, is of the contingent capital type, as in the case of credit lines or advances on commercial invoices. In this case, the flows of repayments and interests for a given period are random variables, because they are related to operating cash flows.), a measure of the LRC based only on the variability of CFF may be incorrect; it is necessary to consider the expected surplus/needs of financial resources (FSN) for a given period, equal to the difference between the expected CFF and the mandatory payments (interest expense accrued, amortization plans, repayments of conditional loans) in the same period. A negative difference means that the business does not produce sufficient cash, and contingent financial resources are needed.
Therefore, by setting the threshold equal to zero, the optimal
LRC will be equal to:
with
Optimal
LRC is a function of the variability of
FSN and the chosen confidence level:
The surplus or financial needs in a given period
t (month or year) depend on
Ebitda,
taxes, changes in net working capital, capital expenditures, and mandatory repayments on financial debt:
Indicating with
Ebitda* the
Ebitda after
taxes, the variance in
FSN could be expressed in this way:
Definitely, LRC depends on:
- -
market dynamics, the operating leverage degree, fiscal policies;
- -
working capital management and commercial policies;
- -
investment policies;
- -
financing policies; and
- -
the correlation degree between investing and financing policies and operating margin.
The available
LRC is instead defined as the sum of the cash and cash equivalents at the beginning of a given period,
C&CEt−1, and the debt reserves available during the same period,
DR:
An open question is whether the financing facilities linked to a firm’s revenues or margins (e.g., advance financing of invoices (For example, an advance financing of invoices requires new revenues, and in the event of a reduction in turnover it involves financial needs (i.e., repayments on invoices advanced in previous periods exceed the advances of new invoices).)) should be included among the debt reserves. A prudential approach to the estimation of LCR would suggest a negative answer; however, this would lead to a quite systematic over-estimation of the liquidity risk, and to a LRC exceeding the actual operating needs.
Needs or surplus of risk capital to face the liquidity risk are determined by the difference between available
LCR and optimal
LRC (with respect to a certain confidence level):
A
LRCs/n less than 0 denotes a deficit of liquidity not sufficient to entirely cover the financial repayments related to a certain percentile (95th or 99th) of financial needs in a given period. Conversely, if
LRCs/n is positive, it denotes a surplus of liquidity with respect to the financial repayments related to a certain percentile (95th or 99th) of financial needs in a given period. Furthermore,
LRCs/n implicitly provides information on the probability of financial distress of a given period (see
Table 1).
The ratio between the available and optimal
LRC is a “resilience index” and measures the ability of a firm to withstand periods of a shortfall in cash. Being a ratio between a stock and a flow, the resilience index measures the number of periods in which a firm can use its liquidity (cash and debt reserves) to cover financial needs for debt repayments:
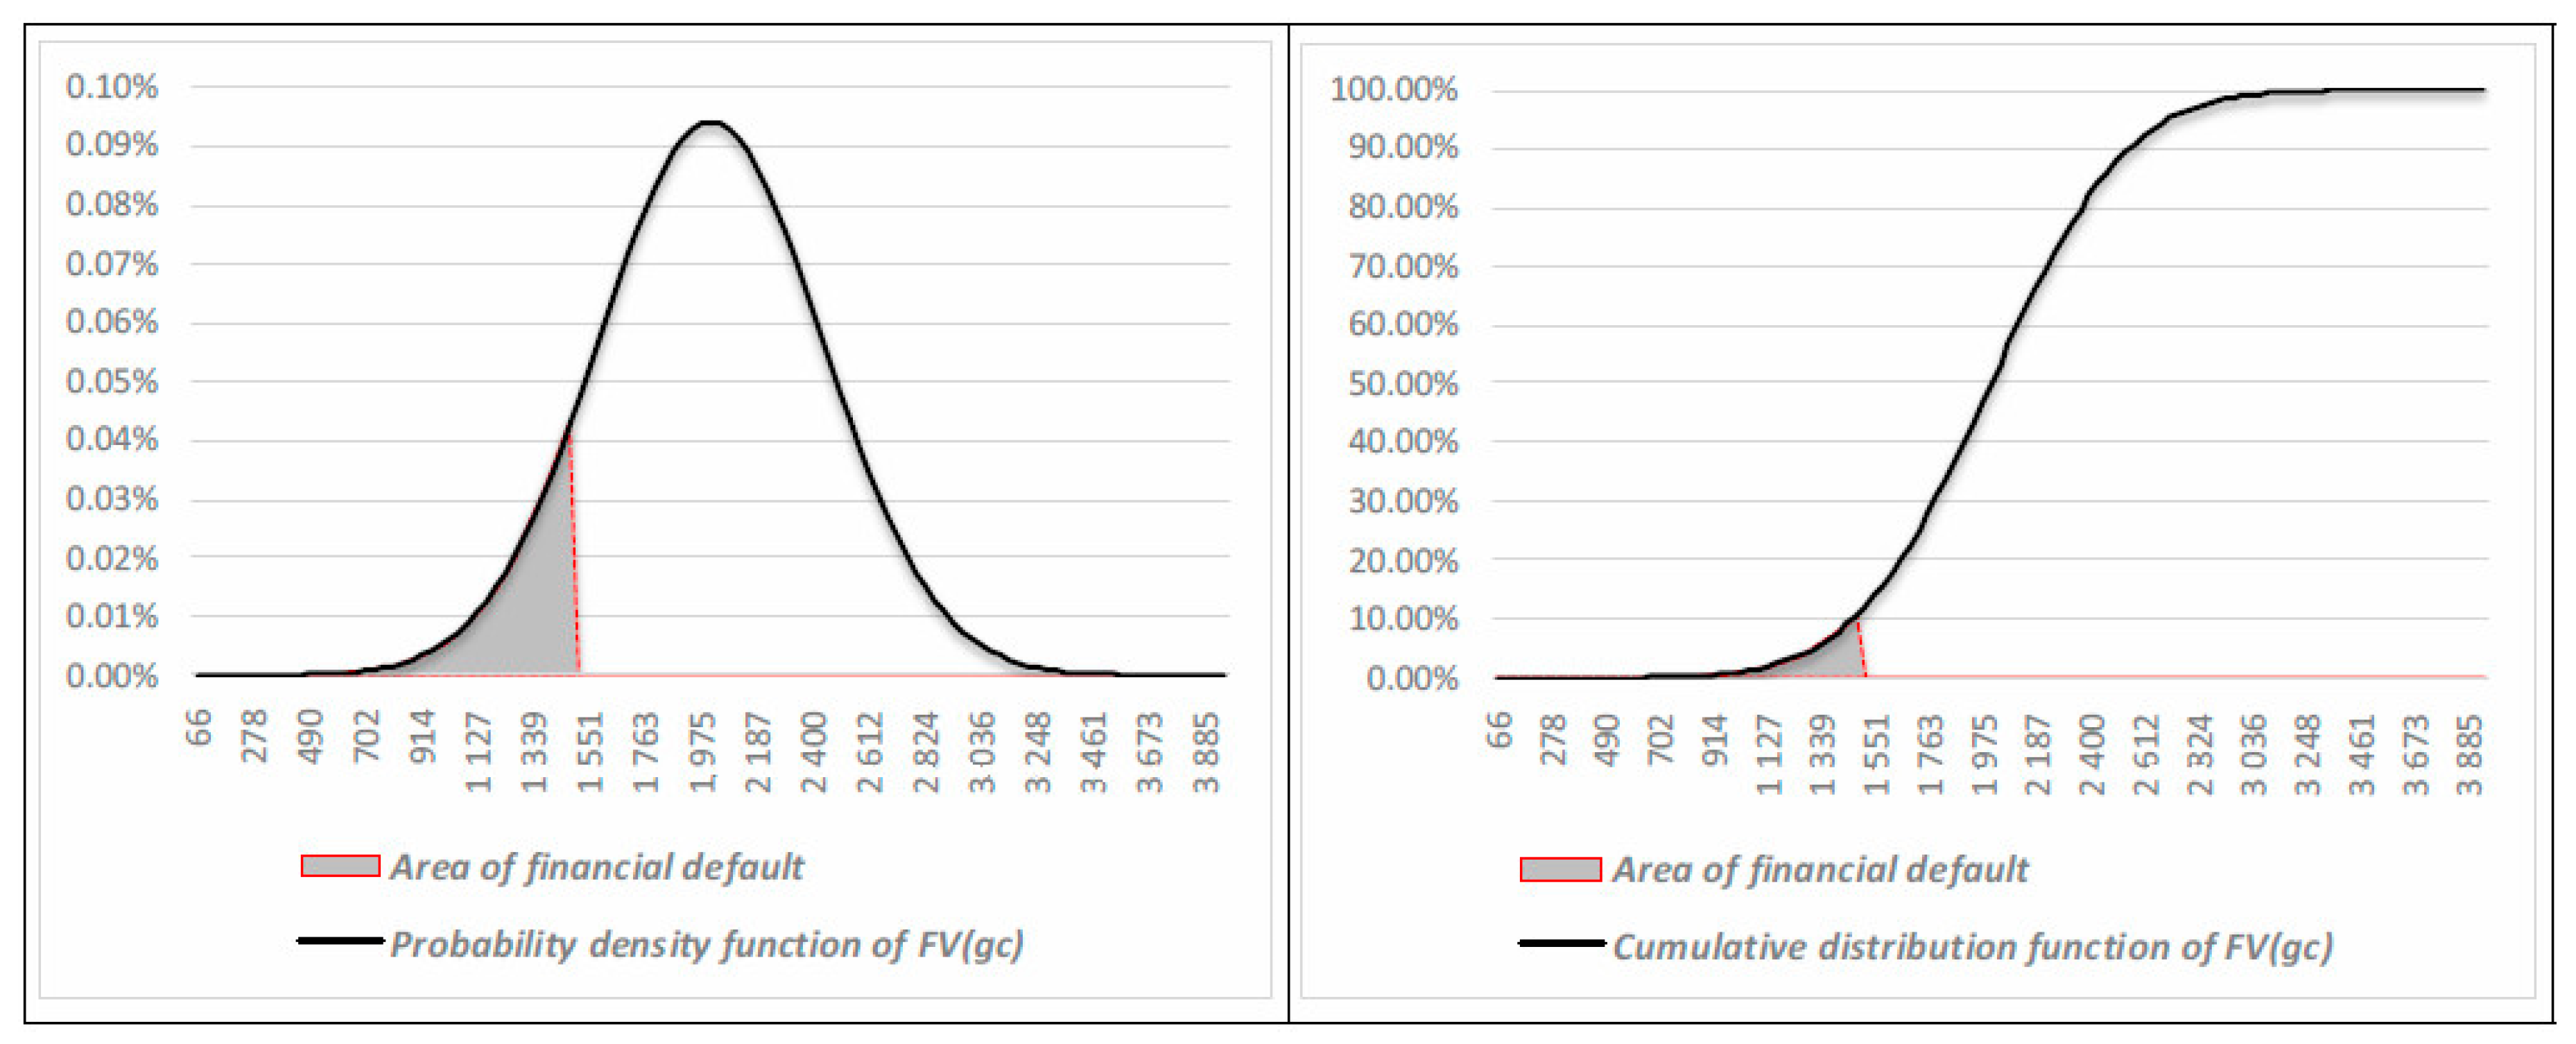
The default risk emerges by considering whether the operating results are sufficient over time to repay and remunerate financial debts. This condition could be analyzed in terms of present values of assets and debts: the going concern is economically and financially sustainable when the economic value of firm assets (The “economic value” corresponds to the present value of future cash flows generated by the asset in place and growth opportunities, considering an “ongoing concern” hypothesis.) (FVgc) is equal to, or higher than, the face value of the financial debt (FD). A lower FVgc than FD indicates an excess of debt, which absorbs much more cash flow than that the core business can structurally generate.
The assessment of the economic values’ dispersion, in a going concern hypothesis, allows for the measurement of default risk. A stochastic approach requires us to consider
FV as a random variable for which a probabilistic distribution is assumed. In this way, the
CaR can be calculated as the difference between the estimated value of a firm (the expected value of a probabilistic distribution of alternative values), and its economic value corresponding to a given confidence level:
The CaR indicates the expected loss of the firm’s economic value due to the fact that competitive scenarios may arise in which the firm, while maintaining the going concern, will generate unsatisfactory financial performances. If the residual firm value is lower than the outstanding financial debt, both shareholders and creditors would have no interest (except in the case of a moral hazard) in the going concern; they could then take action to put the company into a restructuring process or a liquidation process (A firm value lower than financial debt indicates, in a going concern scenario, returns on equity lower than the cost of equity. This could lead the shareholders to opt for a business interruption and a corporate liquidation.).
The equity capital that should be allocated to cover the risk of restructuring or a business interruption should be quantified by moving from the
CaR to a peculiar measure of Economic Risk Capital (
ERC). Assuming that
FV, in a going concern scenario, cannot be less than zero, an optimal level of equity risk capital,
ERCα, given a certain confidence level, will be:
Optimal
ERC is a function of the financial leverage and the variability in
FV, which depends on the variability of
CFF, the cost of capital, and the company lifetime:
Annual cash flows to firm depend on
Ebitda,
taxes, changes in net working capital, and capital expenditures:
Indicating the
Ebitda after
taxes as
Ebitda*, the variance in
CFF could be expressed as follows:
Definitely, ERC also depends on:
- -
market dynamics, the operating leverage degree, fiscal policies;
- -
working capital management and commercial policies;
- -
investment policies;
- -
financing policies; and
- -
the degree of independence of investment and financing policies with respect to operational and working capital management choices.
Therefore, since the available equity risk capital is the net worth, the needs (or surplus) of equity risk capital,
ERCts/n, will be:
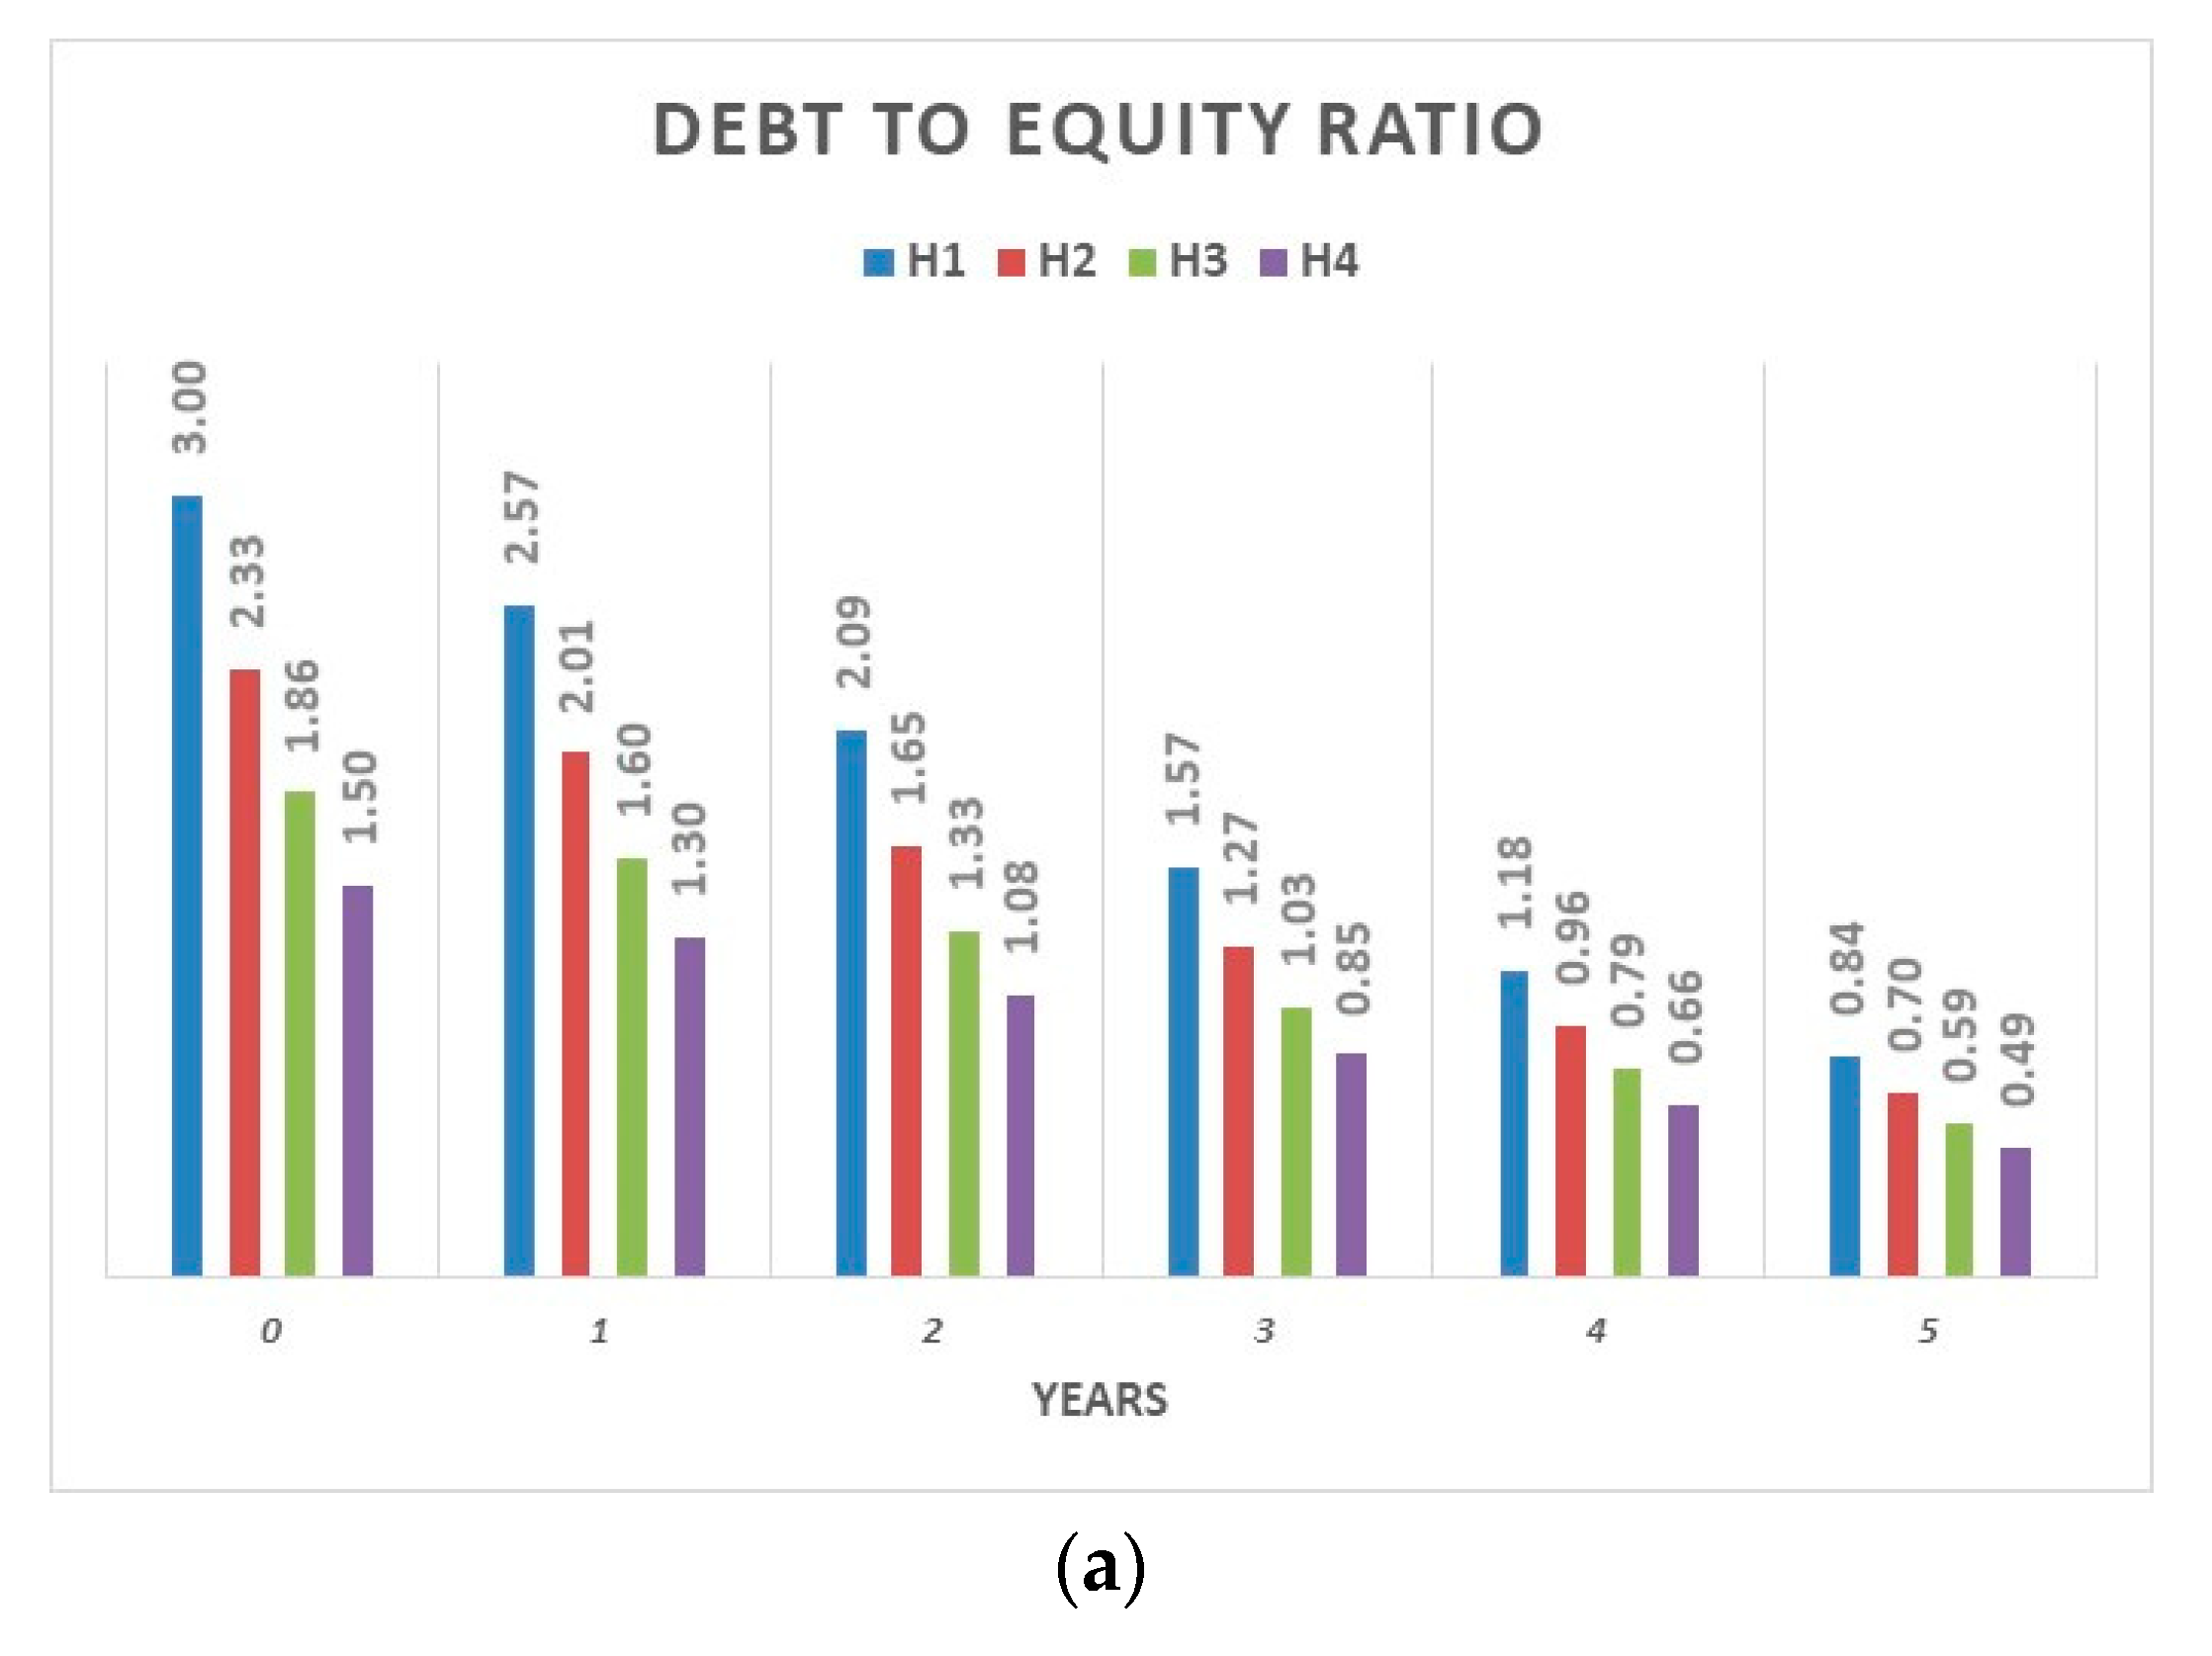
Notice that a risk capital lack may not require a corresponding equity capital increase. If the net invested capital remains flat, a full coverage of the business interruption risk requires approximately additional equity—to replace debt—equal to half of the estimated risk-capital needs.
Similarly,
ERCs/n implicitly provides information on the probability of financial default in a going concern scenario (see
Table 2).
Given a certain likelihood of business interruption, the firm’s solvency in a liquidation process is still guaranteed when the current value of assets (
FVlc), reduced by potential liabilities, is overall equal to, or higher than, the
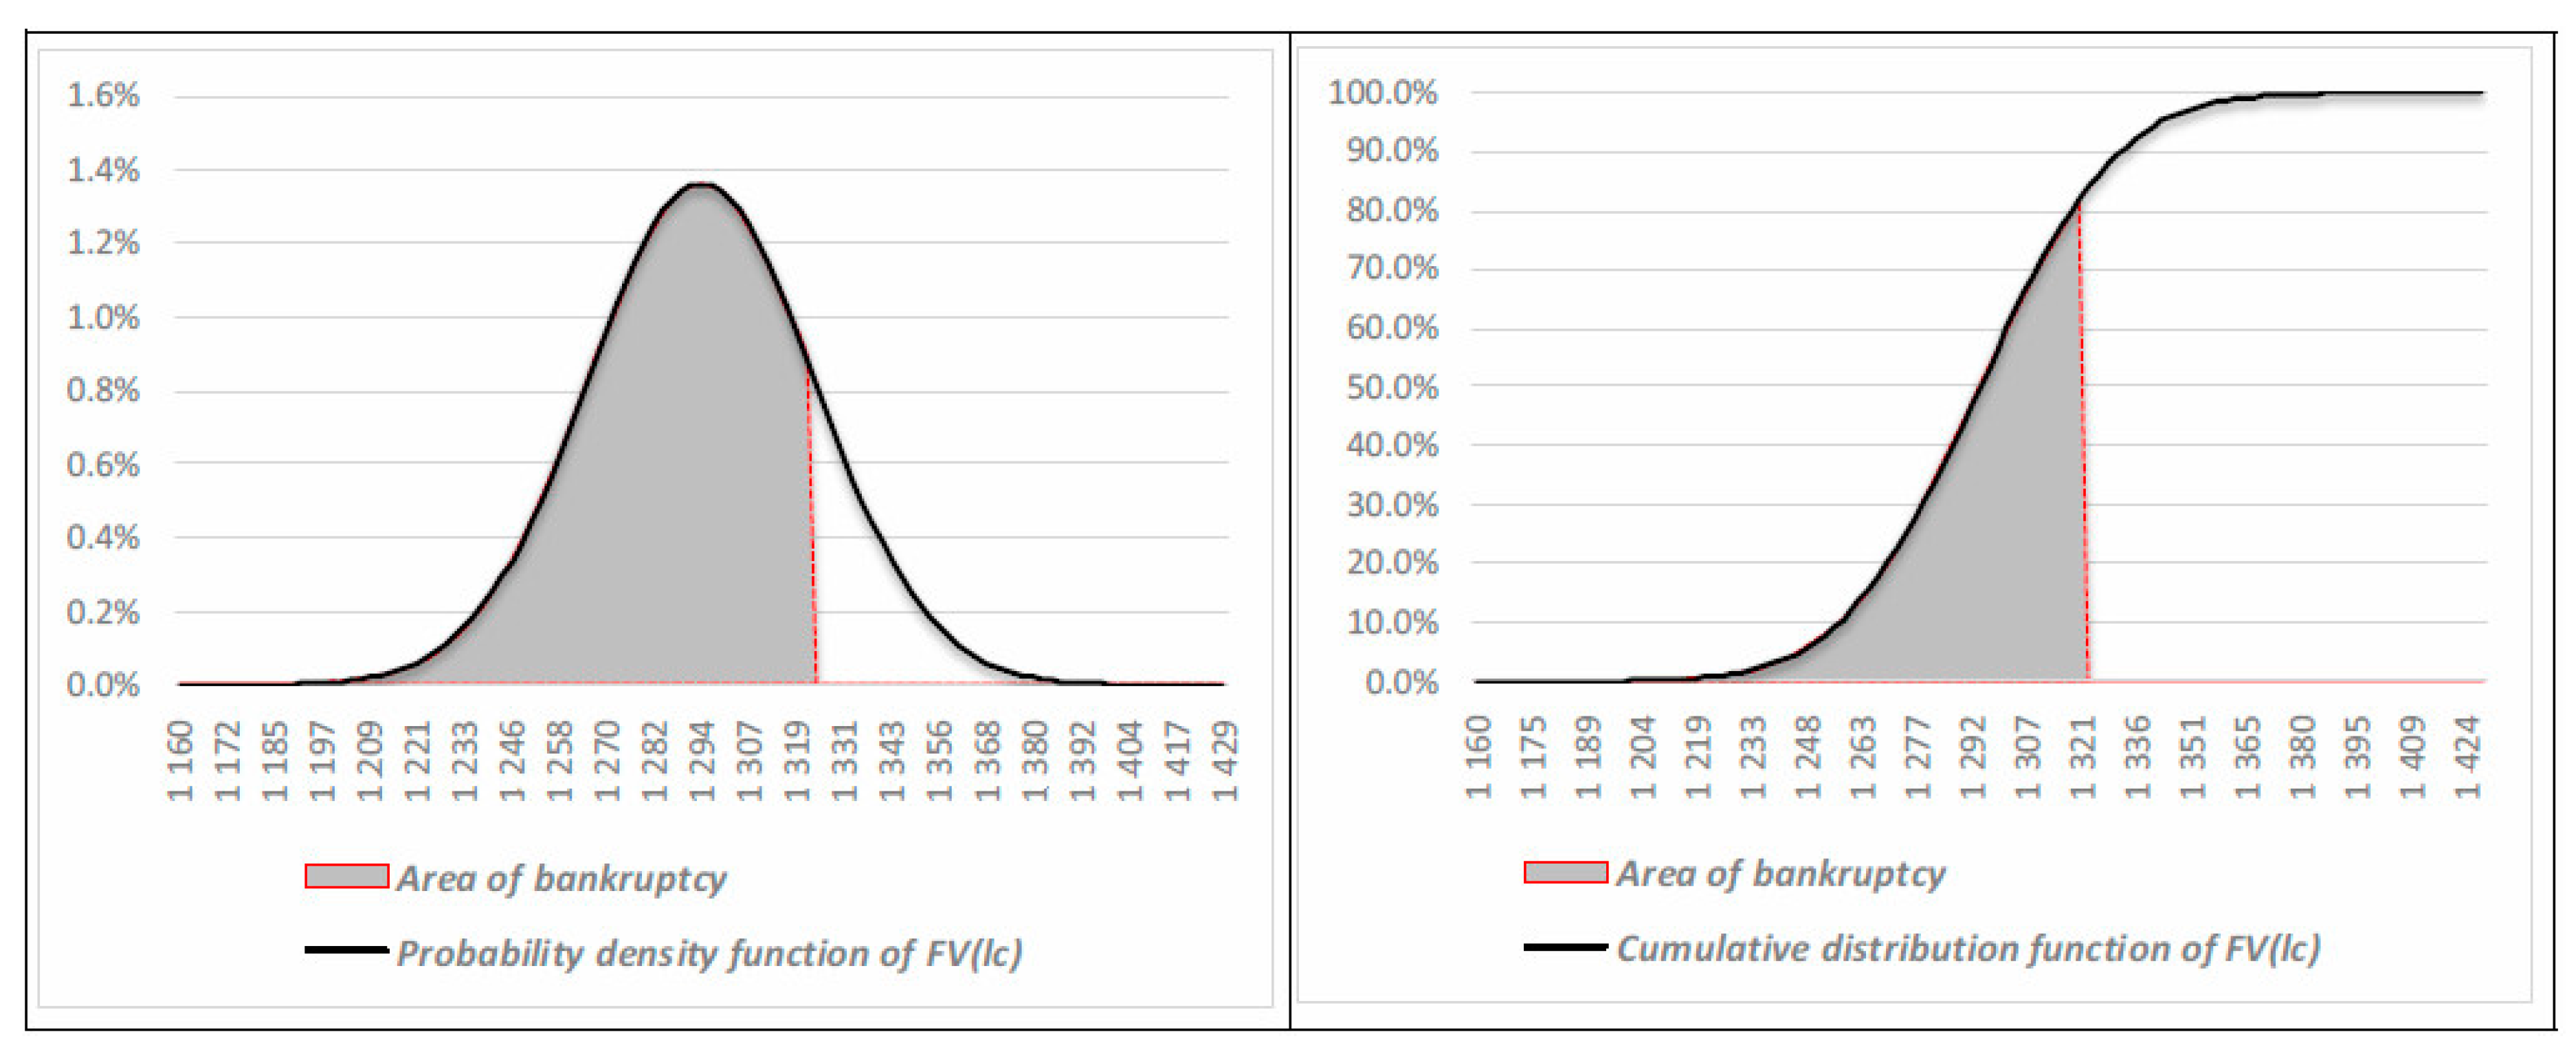
FD. The current value corresponds to the sum of market value, obtained through “fire sales”, of each asset in place considering a “liquidation” hypothesis. In such a scenario, a risk capital measure must indicate the equity necessary to guarantee the repayment of financial debts through a total asset liquidation. This explains why
FV must be also estimated in a liquidation hypothesis. In this case, the
CaR is defined as the difference between the estimated value of a firm (the expected value of a probabilistic distribution of alternative liquidation values) and its liquidation value corresponding to a given confidence level:
In this case,
CaR indicates the expected loss of the firm’s value due to the liquidation process. If the loss in asset value is such that the residual firm value is lower than the outstanding financial debt, a risk of potential bankruptcy emerges. To quantify the capital that should be allocated to cover this risk, the specific measure of Economic Risk Capital (
ERC) will become the following:
Since the equity capital is the right buffer to cover the expected economic losses in a liquidation process, the surplus or needs of
ERC will be:
Once again,
ERCs/n implicitly provides information on the probability of bankruptcy in a liquidation scenario (see
Table 3).
In order for risk-based capital measures to be useful in setting up decision-making models for corporate financing policies, a firm should adopt:
- (1)
forecasting methodologies (for budgeting and planning) coherent and connected with the VaR logic; and
- (2)
valuation methods that explicitly consider the risks and costs of insolvency.
(1) When the VaR logic is applied to calculate LRC and ERC, two main choices are needed: the approach to the expected losses (parametric or non-parametric); and the form of probability distribution (normal, log-normal, binomial, etc.). Such choices affect (even significantly) the measure of risk-capitals and must be consistent with the forecasting procedures (Monte Carlo or scenario; build-up or pure probabilistic) adopted by the firm. The build-up approach requires us firstly to calculate the mean expected values of the elementary variables (revenues, costs, BCC, etc.), and then to determine the financial results by composing those expected values. The pure probabilistic approach requires us firstly to calculate the alternative financial results in each scenario, and then to determine the mean expected values.
Financial planning and budgeting must clearly consider the variability in the expected flows in each period within the forecasting horizon (short-term, medium to long term). To depict the probabilistic distribution of expected cash flows, different approaches are available. The “scenario approach” is normally associated with a representation of alternative cash flows in a limited number of scenarios (normally the triad “pessimistic–expected–optimistic”), each of which is attributed a (subjective) probability of occurrence. In this case, the results are affected by the decision maker’s discretion in assessing the company’s ability to adapt to various contexts (alternative scenarios) and to achieve the planned results. The “Monte Carlo approach” is instead based on random generation procedures that give lots of values for each of the elementary variables that determine the expected cash flows. In this case, the results depend on how either the behavior of the input variables (normal or non-normal; subjectivist or frequentist probability distribution), the correlations between the input variables, and the cause–effect relationships (linear or non-linear) are defined. Although the “Monte Carlo approach” allows us to better simulate the continuity of a firm’s variables and values, the “scenario approach” allows us to better represent the firm’s flexibility and resilience within unfavorable competitive conditions.
The VaR methodology allows for both a parametric and a non-parametric approach. The first one has the limit of approximating with linear relationships the real (non-linear) relationships between financial figures and risk factors. However, it also has the advantage of simplicity: the average and standard deviation of expected results are sufficient to describe the shape of the probability distribution of the variables considered. Therefore, the parametric approach allows us to apply the VaR methodology in a subjectivist perspective; that is, through: the construction of alternative scenarios, the assignment of subjective probabilities of occurrence, and the calculation of variability indexes of relevant results and values.
(2) Any deficit or surplus in risk capital should guide the firm’s financial policies and suggest to the Chief Financial Officer proper adjustments to the capital structure. However, the resulting optimization process cannot only consider the minimization of the insolvency risk but also the related effects in terms of firm value. Indeed, variations in the liquidity degree of assets change the risk and profitability of the net invested capital, and variations in financial leverage change the cost–benefit tradeoff of financial debts. Therefore, the search for an optimal capital structure is a problem of a continuous search for balance between the insolvency risk consistent with the expectations of lenders and the value creation prospects consistent with the expectations of shareholders.
