1. Introduction
The interplay between the banking system and the state through banks’ holding of government debt, still comes at the forefront of public and academic concerns, particularly now in the context of the current global pandemic. The results from previous (before the pandemic crisis) analyses showed that commercial banks invest in debt securities issued by governments (bills and bonds) in order to meet liquid asset requirements, to obtain a stable interest income to offset other more volatile investments, to manage their short-term liquidity, and to take positions on the future movement of interest rates. Commercial banks also use their government debt holdings to hedge their interest rate positions for repo transactions (in interbank money market and central bank operations). But, on the other hand, commercial banks should not be forced to hold government securities because investments in government securities by commercial banks may impact on their major function, which is lending (
Gros 2017;
Saka 2019;
Becker and Ivashina 2018;
Altavilla et al. 2016). A paper published by the European Central Bank (
Cooper and Nikolov 2018) explores even the “diabolic loop” established between the government and the banking system and warns about potential bank solvency vulnerabilities.
The sovereign–bank nexus defines therefore the relationship between government debt and banks’ assets, playing a special role in times of crisis. It can also reflect the interconnectedness between the health of the sovereign and the banking system, whereby stress in one sector may create and amplify stress in the other (
Feyen and Zuccardi 2019). In other words, banks’ ownership of large sovereign debt represents a direct risk for them. In the event that a country is unable or unwilling to repay its sovereign debt, due to country-specific or systematic shocks, the banks that hold that debt will be in financial distress, and hence the sovereign risk can further translate into bank risk (
Li and Zinna 2018).
The COVID-19 pandemic, the outbreak of which was confirmed by the World Health Organization on 11 March 2020, triggered unprecedented actions taken by almost all countries worldwide. The scale of public interventions at the domestic and supranational levels with the application of government market debt instruments is most likely to further bolster the sovereign–bank nexus. Banks in the European Union will be the dominant group of investors not only on the domestic debt markets but also on the EU market. This will be a consequence of the growing domestic debt being further increased with European bonds issuance by the EU and the
European Commission (
2020a,
2020b) agendas under the newly launched EU programmes and funds (e.g., Support to Mitigate Unemployment Risks in an Emergency Programme—SURE, and Recovery and Resilience Facility). Banks will also be encouraged to acquire government securities by having the redemption schemes expanded by central banks, including the
European Central Bank (
2020) Pandemic Emergency Purchase Programme. Therefore, since its very outbreak, the pandemic crisis requires carrying out an analysis into the position of the banking sector and its interconnectedness with the public sector, including the risks and effects on the economy and the possibilities of giving credit.
The paper’s main focus is on the role played by banks on the sovereign debt market in the period following the pandemic crisis outbreak. The specific research goal is to find out whether the strengthening of banks’ position on the government debt market (due to a recent and persistent increase in banks’ holding of sovereign debt) is a direct consequence of the COVID-19 pandemic or whether it overlaps the existing structural domestic weaknesses of a country’s fiscal policy, which were exacerbated by the current health crisis. The research questions we investigate in this paper are: (i) What was the change in banking assets’ structure (loan vs. government debt securities) during the crisis outbreak, which can indicate that banks are more willing to excessively turn to financing public debt to the detriment of lending to the private sector in pandemic times? (ii) Is there a convergence pattern among EU countries in terms of their exposure to the sovereign? (iii) Which is the specific impact exerted by pandemic-related variables on banks’ holding of sovereign debt and what kind of pandemic-related information (positive or negative) drives more influence?
In order to achieve this goal, we combine a series of complementary research approaches, such as desk research, comparative statistical analysis, exploratory learning algorithm, and a deterministic panel regression framework.
The novelty brought by our paper resides in: (i) a comprehensive European cross-country analysis; (ii) adapting the gap method, in order to measure the changes between banking assets major items (government securities vs. loans) and uncovering the preference for holding a specific type of asset; (iii) identifying clusters of countries showing similar exposure to the sovereign through a hierarchical clustering algorithm; (iv) the use of four alternative sovereign measures in the empirical panel analysis as a proxy for banks’ sovereign risk exposure; (v) augmenting the statistical model with several proxy variables capturing the influence of the COVID-19 pandemic; and (vi) delineation between positive and negative COVID-19 proxy variables.
To the best of our knowledge, there exists no other study that investigates the issue of how the pandemic crisis may alter this role on the sovereign debt market, as an incentive of the interplay between banks and the state. The remainder of the paper is structured as follows:
Section 2 summarizes existing research on the sovereign–bank interplay as well as the recently emerged debate regarding the impact of COVID-19 pandemic on this relationship and positions our paper within this new research strand.
Section 3 presents the dataset and the particularities of the three methods employed in the paper.
Section 4 describes the results of the comparative statistical analysis based on the computation of the loans–government debt gap.
Section 5 presents and discusses the clustering solution generated for two representative time periods.
Section 6 employs a dynamic panel regression framework and investigated the extent to which the strengthening of banks’ position on the government debt market may represent a direct consequence of the COVID-19 pandemic. The last section concludes.
2. Literature Review
Research on the sovereign–bank nexus shows many motives behind maintaining government debt in banks’ balance sheets, including (
Dell’Ariccia et al. 2018): liquidity management, credit exposure, and return, as well as financial repression in countries with growing public debt (
Reinhart 2012;
Reinhart and Sbrancia 2015). Similarly, when assessing the results of this linkage, both positive and negative effects should be distinguished. Depending on national circumstances, the sovereign–bank nexus can act as a shock absorber or amplifier, but it can also induce the “doom loops” effect (
Farhi and Tirole 2016). One of the most important results of the above-mentioned relationship can also be the specific effect of "loans crowding-out" on the banking asset side.
The World Bank and International Monetary Fund (
2001), in the Handbook of Developing Government Debt Market, indicated that “heavy investments in government securities by commercial banks may reflect weaknesses in their primary function which is lending.”
Looking back, the European sovereign debt crisis, which followed the 2008 global financial crisis, bolstered the tight nexus between banks and sovereigns. However, as the
IMF (
2010) and
Dotz and Fischer (
2010) research findings show, the initial cause of that sovereign debt crisis was the transformation of the banking risk into
sovereign risk.
Abad et al. (
2009) demonstrate that the German securities market was additionally more vulnerable to
external risk factors, while other states were mainly facing the
Eurozone risk factors. The ECB points to the fact that the 2008 financial crisis and the ensuing sovereign debt crisis revealed a progressive intertwining of risks amongst euro area sovereigns and their domestic banking sectors. Three empirical findings seem to confirm the nexus: bank failures, which led to government interventions in the financial sectors of several euro area countries, putting significant pressure on public finances; banks’ sovereign credit risk exposures, which remained biased towards their domestic sovereign across the euro area; and the fact that sovereigns from the EMU saw hikes in their default risk, which correlated with the hikes in the default risk of domestic banks (
Bell et al. 2019). Additionally, the financial crisis gave rise to the now renewed discussions on the common European bond and indebtness (
Gros and Micossi 2009;
Favero and Missale 2012;
Leandro and Zettelmeyer 2018), which resulted from the economic–political ties and the presumption that many domestic financial institutions are
too big to fail and pose threat to the markets and economies of the countries concerned. The tool for achieving this goal by financial institutions was the safe market and balance-sheet asset, within the European Stability Mechanism among others.
As argued in a great number of publications, the current pandemic crisis can have much more significant financial implications, both in developed countries and emerging markets. As
Bulow et al. (
2020) point out, so far, the pandemic shock has been limited to the poorest countries and has not morphed into a full-blown middle-income emerging market debt crisis. Thanks in part to favorable global liquidity conditions, conferred by massive central bank support in advanced economies, private capital outflows have been moderated, and many middle-income countries have been able to continue to borrow in global capital markets. However, EU states (mainly in the euro area) are already taking due measures to prepare for the new post-pandemic situation in which national public debts will increase by some 15–30% of GDP. A larger than before proportion of these debts will be held by the ECB. It is very likely that the post-crisis rebound will not be followed automatically by a sustainable recovery (
Wyplosz 2020). Under such circumstances, it is proposed to remove a considerable amount of sovereign assets from the Eurosystem’s balance sheet by means of the creation of a peer supranational fiscal authority as the aggregator and manager of the EU sovereign debt created for certified pandemic necessities, endowed with political legitimacy and financial capacity (
Bonatti et al. 2020).
Despite the ongoing policy debate regarding the drivers of bank exposures to sovereign risk, the impact of COVID-19 on the interplay between banks and the sovereigns is scarcely addressed by existing studies, and if so—only from a theoretical, general standpoint.
Lazard Financial Advisory (
2020) notices two persistent upward trends triggered by the COVID-19 pandemic, namely, increased sovereign debt distress that has reached unprecedented levels, and increased bank exposure to their sovereign through the holding of domestic public debt by the Euro area banking systems.
Schularick et al. (
2020) document that a European strategy for the precautionary recapitalization of banks will contribute to the re-launch of lending to the real economy and to the weakening of the sovereign–bank nexus. A few other studies focus their attention on the features of sovereign securities during the pandemic, without placing a direct emphasis on the sovereign–bank nexus.
Sène et al. (
2020) investigate the changes in the volatility of sovereign securities’ yields determined by the pandemic onset and by the official announcements of financial support from international bodies such as the IMF or the World Bank.
Cevik and Öztürkkal (
2020) reveal that the COVID-19 pandemic has had a significant impact on market-implied sovereign default risk, especially in developed economies.
Against this background, our paper aims at filling a literature gap by assessing the contemporaneous relationship between commercial bank loans and holdings of sovereign debt, as key bank assets, identifying the specific exposure to the sovereign and revealing how the pandemic crisis has impacted it.
3. Data and Methodology
Our analysis is focused on the initial phase of the pandemic crisis, i.e., the second quarter of 2020, and the data for the two preceding years, to reveal the changes occurred in the role played by banks on the sovereign debt market. This choice is due to the fact that historical data extracted from Eurostat and the European Central Bank indicates a persistently increasing trend of banks’ holding of sovereign debt in the last few years and the research aim is to highlight the impact exerted by the pandemic outbreak on this noticeable recent trend. The data sample includes 250 quarterly observations covering the period 2018–2020, for 25 European countries (data from banking balance sheets were unavailable for Latvia, Malta, and the Netherlands).
The quantitative approach developed in this paper combines the comparative statistical analysis with descriptive analysis, exploratory learning algorithm, and deterministic regression framework. The list of variables considered for the threefold analysis is summarized in
Table 1.
The first part of the study presents a comparative statistical analysis based on fiscal data and banks’ balance sheet data to reveal the trends following the pandemic crisis outbreak. The research utilizes a method of assessing the government debt securities and loans relationships, i.e.,
the loan–
debt gap = loans to residents − government debt held by banks. The loan–debt gap is generally based on the gap method used to manage interest rate risk in commercial banks as the measure of mismatch of assets and liabilities in balance sheet (
Fabozzi and Konishi 1990). In turn, the specific loan–debt gap used in the study is defined as the gap resulting from asset management, which induces changes in the scale of granting bank loans resulting from the decisions on the purchase of government securities. This means that the bigger the loan–debt gap, the potentially higher credit capacities of banks with concurrent change in the government debt securities exposure.
In the second part of our study, we implement an exploratory algorithm called cluster analysis or taxonomy analysis in order to identify existing patterns in the collected dataset and classify the initial sample of European countries into homogenous, similar groups. This type of analysis belongs to the category of data mining techniques due to the feature of pattern recognition into large amounts of data. Clustering methods are widely considered unsupervised learning methods (
Hastie et al. 2009) as they follow the principle of “let the data speak for themselves” (
Farnè and Vouldis 2017).
We chose a hierarchical agglomerative clustering that follows a bottom-up approach in the process of cluster identification. More specifically, each country is first considered an individual cluster, then pairs of clusters are successively merged based on similarity features. Two computational steps have to be applied, namely, (i) measuring the proximity or distance between individual countries, and (ii) measuring the proximity between groups of countries with a linkage rule.
As the first step, the Euclidean distance is used to measure the proximity between each pair of observations belonging to particular countries.
As the second step, in order to combine the most similar groups, the distance between clusters is recomputed by means of the Ward linkage method. The existing literature advocates for this method as a robust algorithm, based on minimizing within-cluster contribution to the overall variance of a given variable, or alternatively on maximizing the between-cluster contribution (
Irac and Lopez 2015). According to
Murtagh and Legendre (
2014), Ward’s is the only agglomerative clustering method that is based on the sum-of-squares criterion and generates groups that minimize within-group dispersion at each binary fusion.
To sum up, by following the line of reasoning of
Farnè and Vouldis (
2017), we can define the statistical clustering problem as follows: given a C × V data matrix, where C is the number of countries and V is the number of input variables, we intend to classify the initial sample of countries into distinct clusters which contain countries that are deemed to be similar or ”close”, by using several statistical measures of distance. Therefore, each cluster would consist of countries showing a specific but similar exposure to the sovereign debt market. The clustering solution is represented by a graphical hierarchical tree (also called dendrogram) which illustrates the order in which clusters are formed and their composition.
The exploratory analysis is performed for two moments of time: the second quarter of 2019 to account for banks’ presence on the sovereign debt market in normal times, and the second quarter of 2020 for the situation following the pandemic outbreak. The three uncorrelated indicators which are proxy for banks’ exposure on the sovereign debt market are: the loan–government debt gap; the share of government debt held by banks in total loans; and the share of government debt held by banks in total assets. They have different means and standard deviations; therefore, the clustering methodology requires the smoothing of the presence of extreme values. Thus, each input variable is standardized by applying the z-score method: the mean of the overall sample is subtracted from each individual value, and then it is divided by the standard deviation of the overall sample for a given variable.
The third part of the study investigates the relationship between the outbreak and severity of the COVID-19 pandemic and banks’ financial behavior, represented by their holdings of government debt securities, by using a dynamic panel regression analysis with cross-section random effects. To discriminate between fixed effects and random effects models, we relied on the econometric fundamentals stated by
Greene (
2002): based on the LR test, which is decisive whether there are fixed effects, and the Hausman test, which assesses whether random effects are uncorrelated with the other variables in the model, one could conclude which of the two alternatives have to be considered. In our case, the random effects model is the better choice. The Redundant Fixed Effects LR Test rejected the null hypothesis (thus fixed effects are redundant). The Hausman Test for Correlated Random Effects is then used to detect endogenous regressors in the model. The null hypothesis can be accepted, random effects being uncorrelated with the explanatory variables, and thus there is no model misspecification.
Several other studies advocate for the use of the random-effects method due to its specific methodological assumptions, namely, focus on the sample’s features rather than on unobserved country-specific features, variability of random effects across countries, whereas fixed effects are constant (
Gelman 2005;
Barili et al. 2018), but also the fact that under this approach the estimation of country-specific intercepts is not required, and hence we can preserve the number of degrees of freedom to improve estimates’ reliability. In addition,
Bell et al. (
2019) explain that a well-specified random-effects model is superior to fixed-effects.
Deeks et al. (
2021) suggest that when there is heterogeneity that cannot readily be explained, one analytical approach is to incorporate it into a random-effects model. A random-effects model is built on the assumption that the effects being estimated are not identical but follow some distribution. Thus, the model represents a lack of knowledge about why real or apparent effects differ by considering these differences as if they were random.
We define two alternative dependent variables, represented by the growth rate of government debt securities held by banks (to account for the trend recorded by this specific item) and the ratio of government debt held by banks/total bank assets (bank preference for holding sovereign debt, as a component of total bank assets).
The set of independent variables comprises a series of control variables, a COVID-19 dummy for the occurrence of the pandemic (it assumes value one for the period starting March 2020, and value zero, otherwise), and several alternative proxy variables to account for the severity of the COVID-19 pandemic (the average number of new cases, the total number of new cases, the Government Response Index, the Economic Support Index). The COVID-19 dummy and the number of new cases (both as average and total number for each quarter) have the potential to bring negative information, while the Government Response Index and the Economic Support Index represent the positive side of the pandemic.
Real GDP growth rate is used to control cyclical economic conditions;
public debt/GDP is a control variable that captures potential non-banking determinants of the sovereign risk (
Bruha and Kocenda 2018) and shows increased public financing needs (
Bouis 2019); while
budget deficit/GDP is used to assess particular countries’ fiscal weaknesses. All control variables enter the dynamic panel regression analysis with first-order lagged value to reflect that banks’ decision to invest on the sovereign debt market is normally delayed due to the economic cycle and fiscal policies. The interaction term between public debt/GDP and the COVID-19 dummy provides information on the combined impact of the COVID-19 pandemic and the evolving public financing needs on the size of banks’ portfolios of sovereign debt, identifying whether the effect of public debt/GDP in normal times is different from that in times of crisis.
The above-mentioned specification of the regression model allows handling the potential endogeneity problem that may arise from the existence of omitted variables, and/or simultaneity between the dependent and independent variables. We controlled for the endogeneity due to omitted variables by including a series of control variables in the regression model. According to
Barros et al. (
2020), making use of control variables is a preferential way of avoiding possible endogeneity problems in the empirical studies conducted for the financial field of research. In order to alleviate the endogeneity caused by the possible simultaneity between the dependent and independent variables, it is employed a dynamic panel data model that includes lags of the regressors.
4. Comparative Analysis of the Sovereign-Bank Nexus during the COVID-19 Outbreak
In the wake of the COVID-19 pandemic outbreak, many EU member states introduced partial or total lockdowns. The governments of EU member states, as well as the European Commission, began work on launching public stimulation programmes, aimed at providing support to the economies and the societies (detailed information on the intervention measures planned by the governments of EU member states are in the Stability and Convergence Programmes, among others, submitted with the European Commission in April 2020 for assessment). In March 2020, the
European Commission (
2020c) published the Communication on
Coordinated Economic Response to the COVID-19 Outbreak, in which it highlighted that “the banking sector has a key role to play in dealing with the effects of the COVID-19 outbreak, by maintaining the flow of credit to the economy…; banks must have adequate liquidity to lend to their customers…; banks must be able to use this additional liquidity to provide new credit to businesses and households as appropriate” (COM(2020)112).
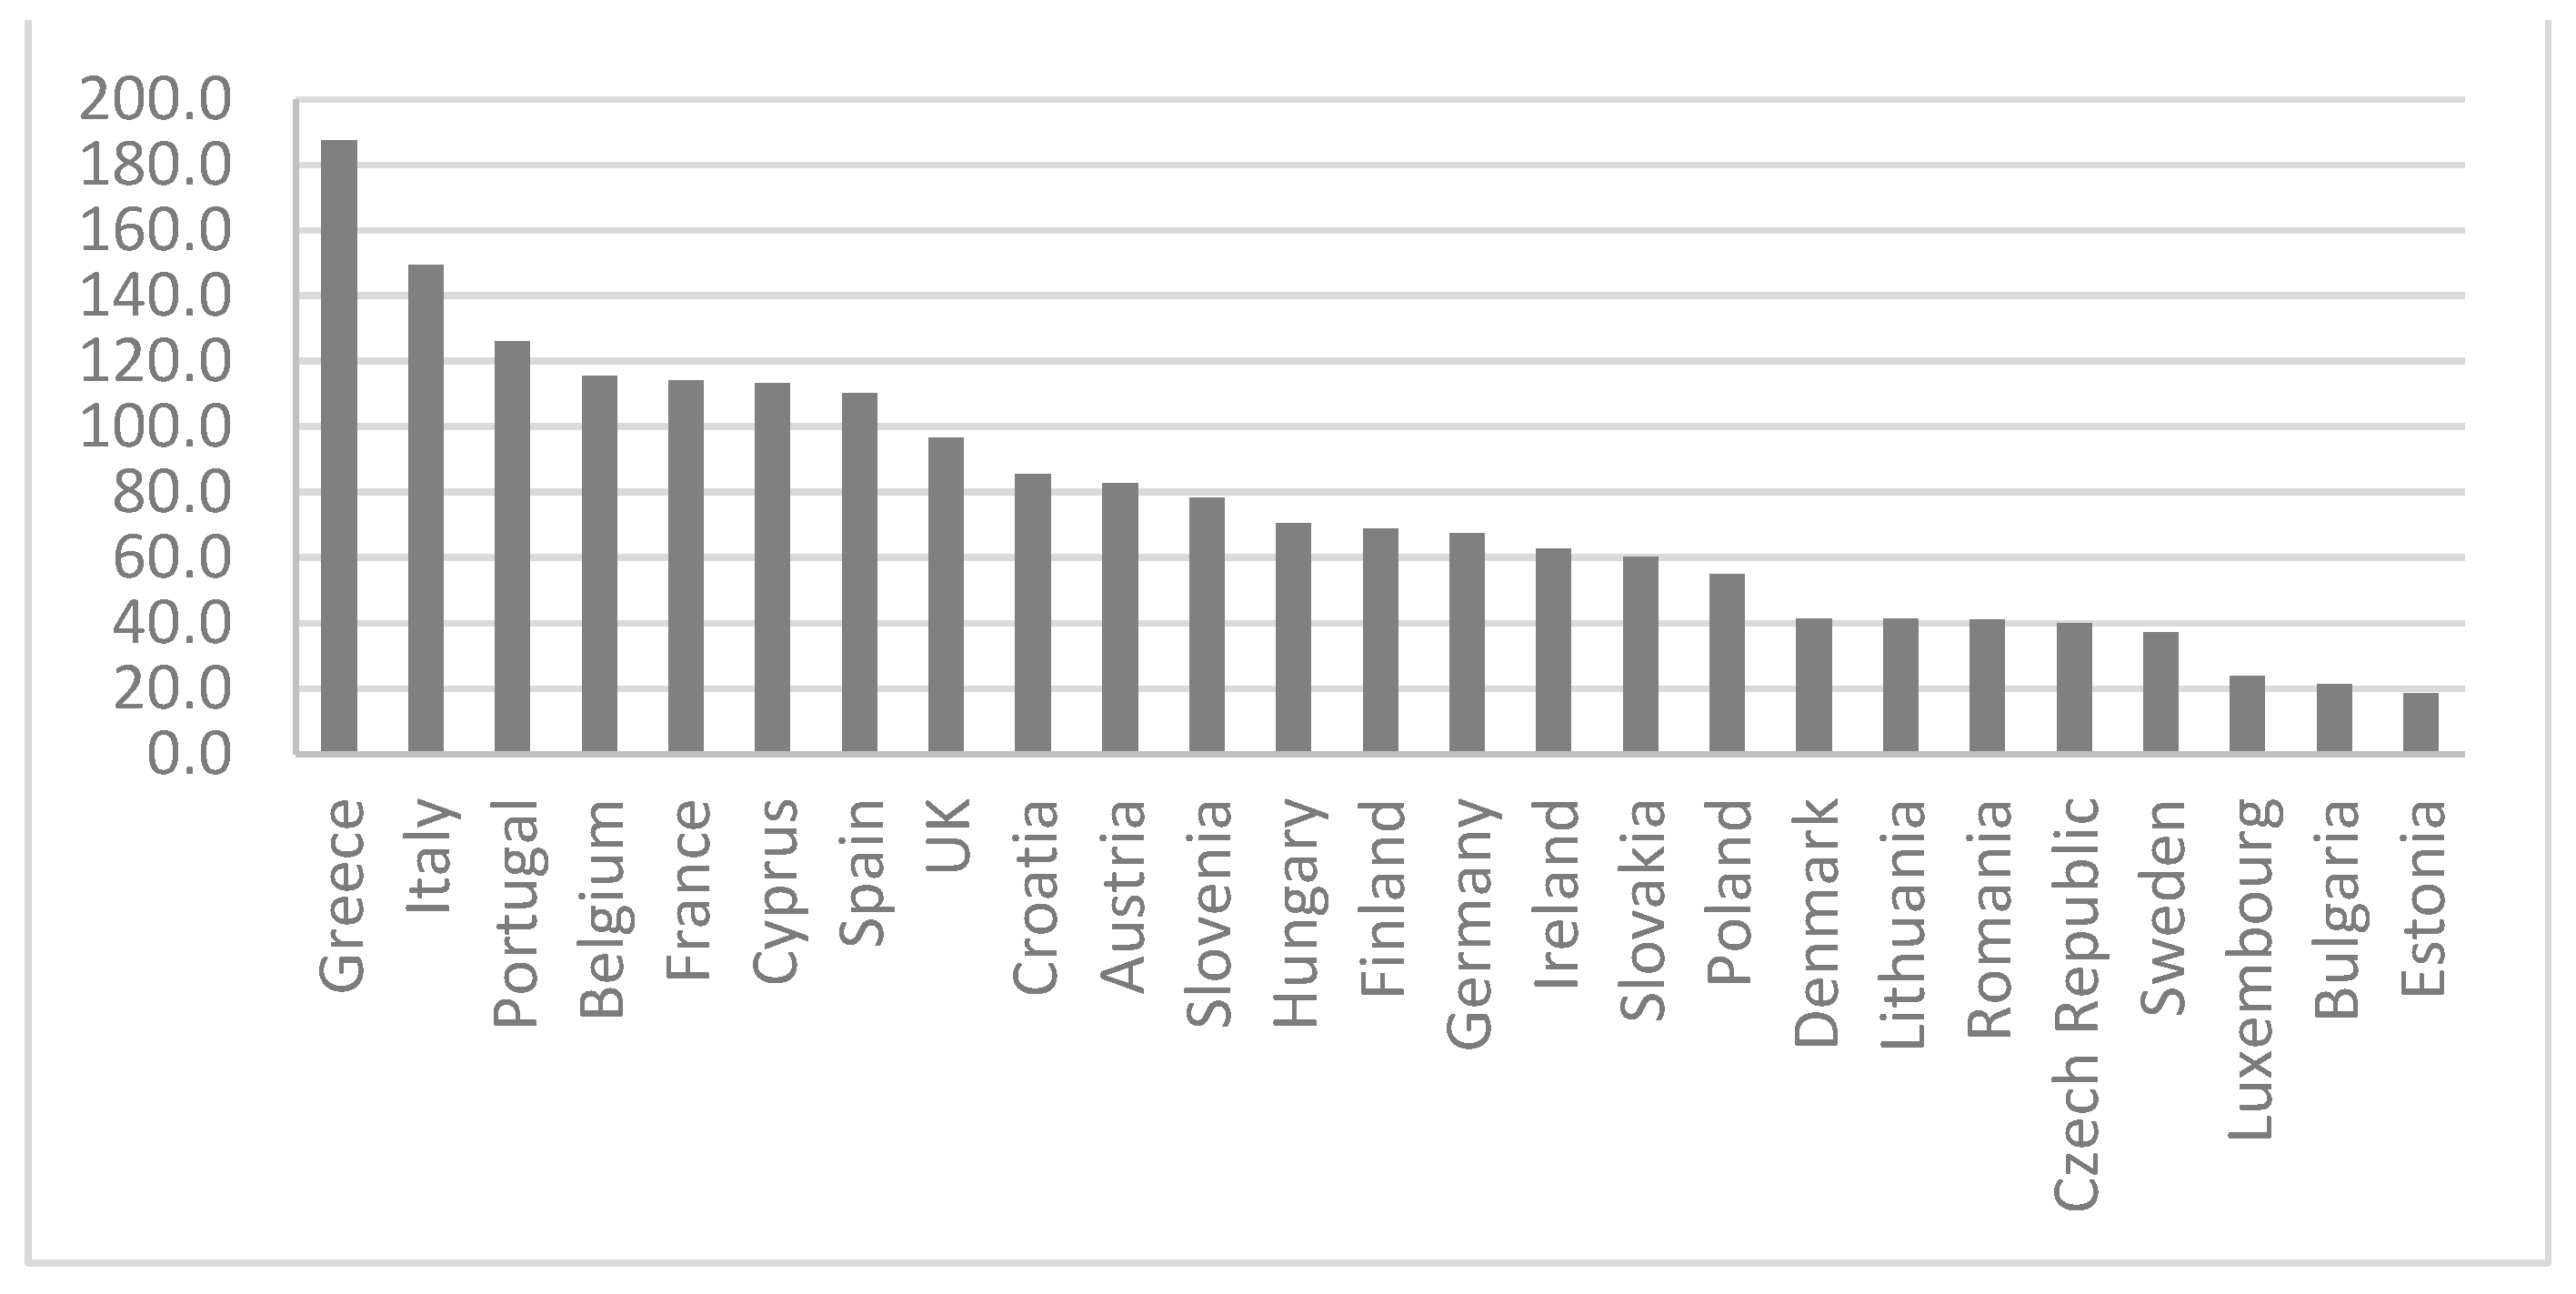
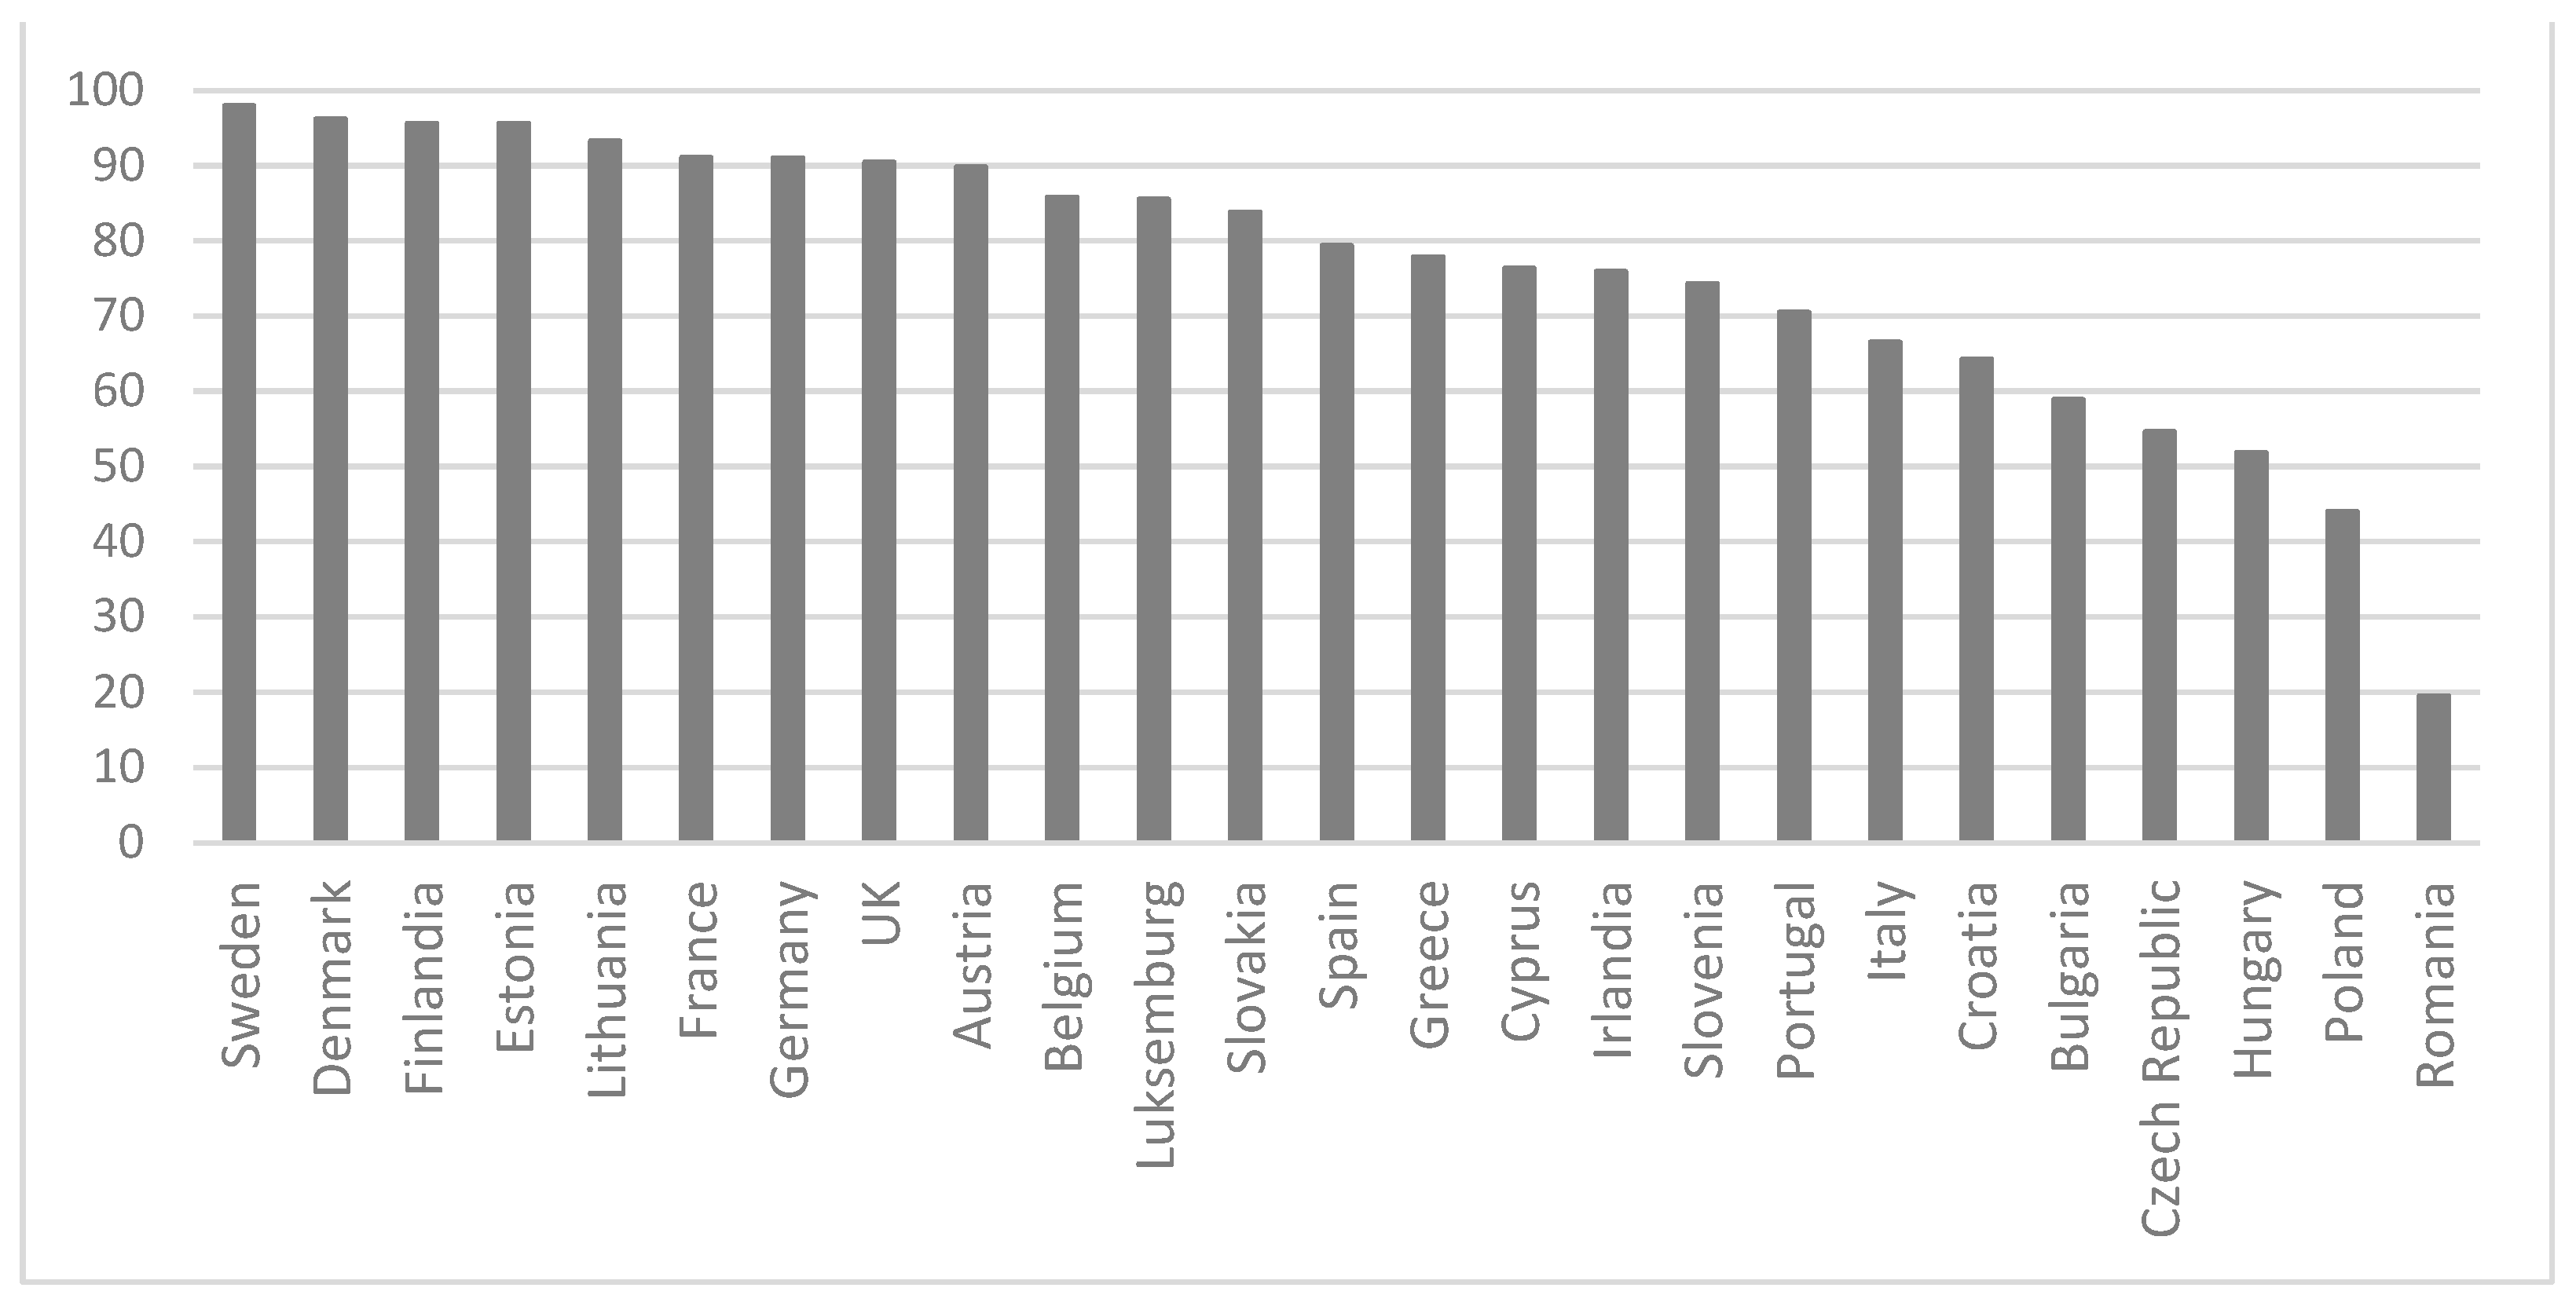
The fiscal effect of the actions taken by governments was the gradual growth of budget deficits financed with public debt. The data for the second quarter of 2020 shows that 16 in 25 analyzed states exceeded the EU public debt criterion, i.e., 60% of GDP (
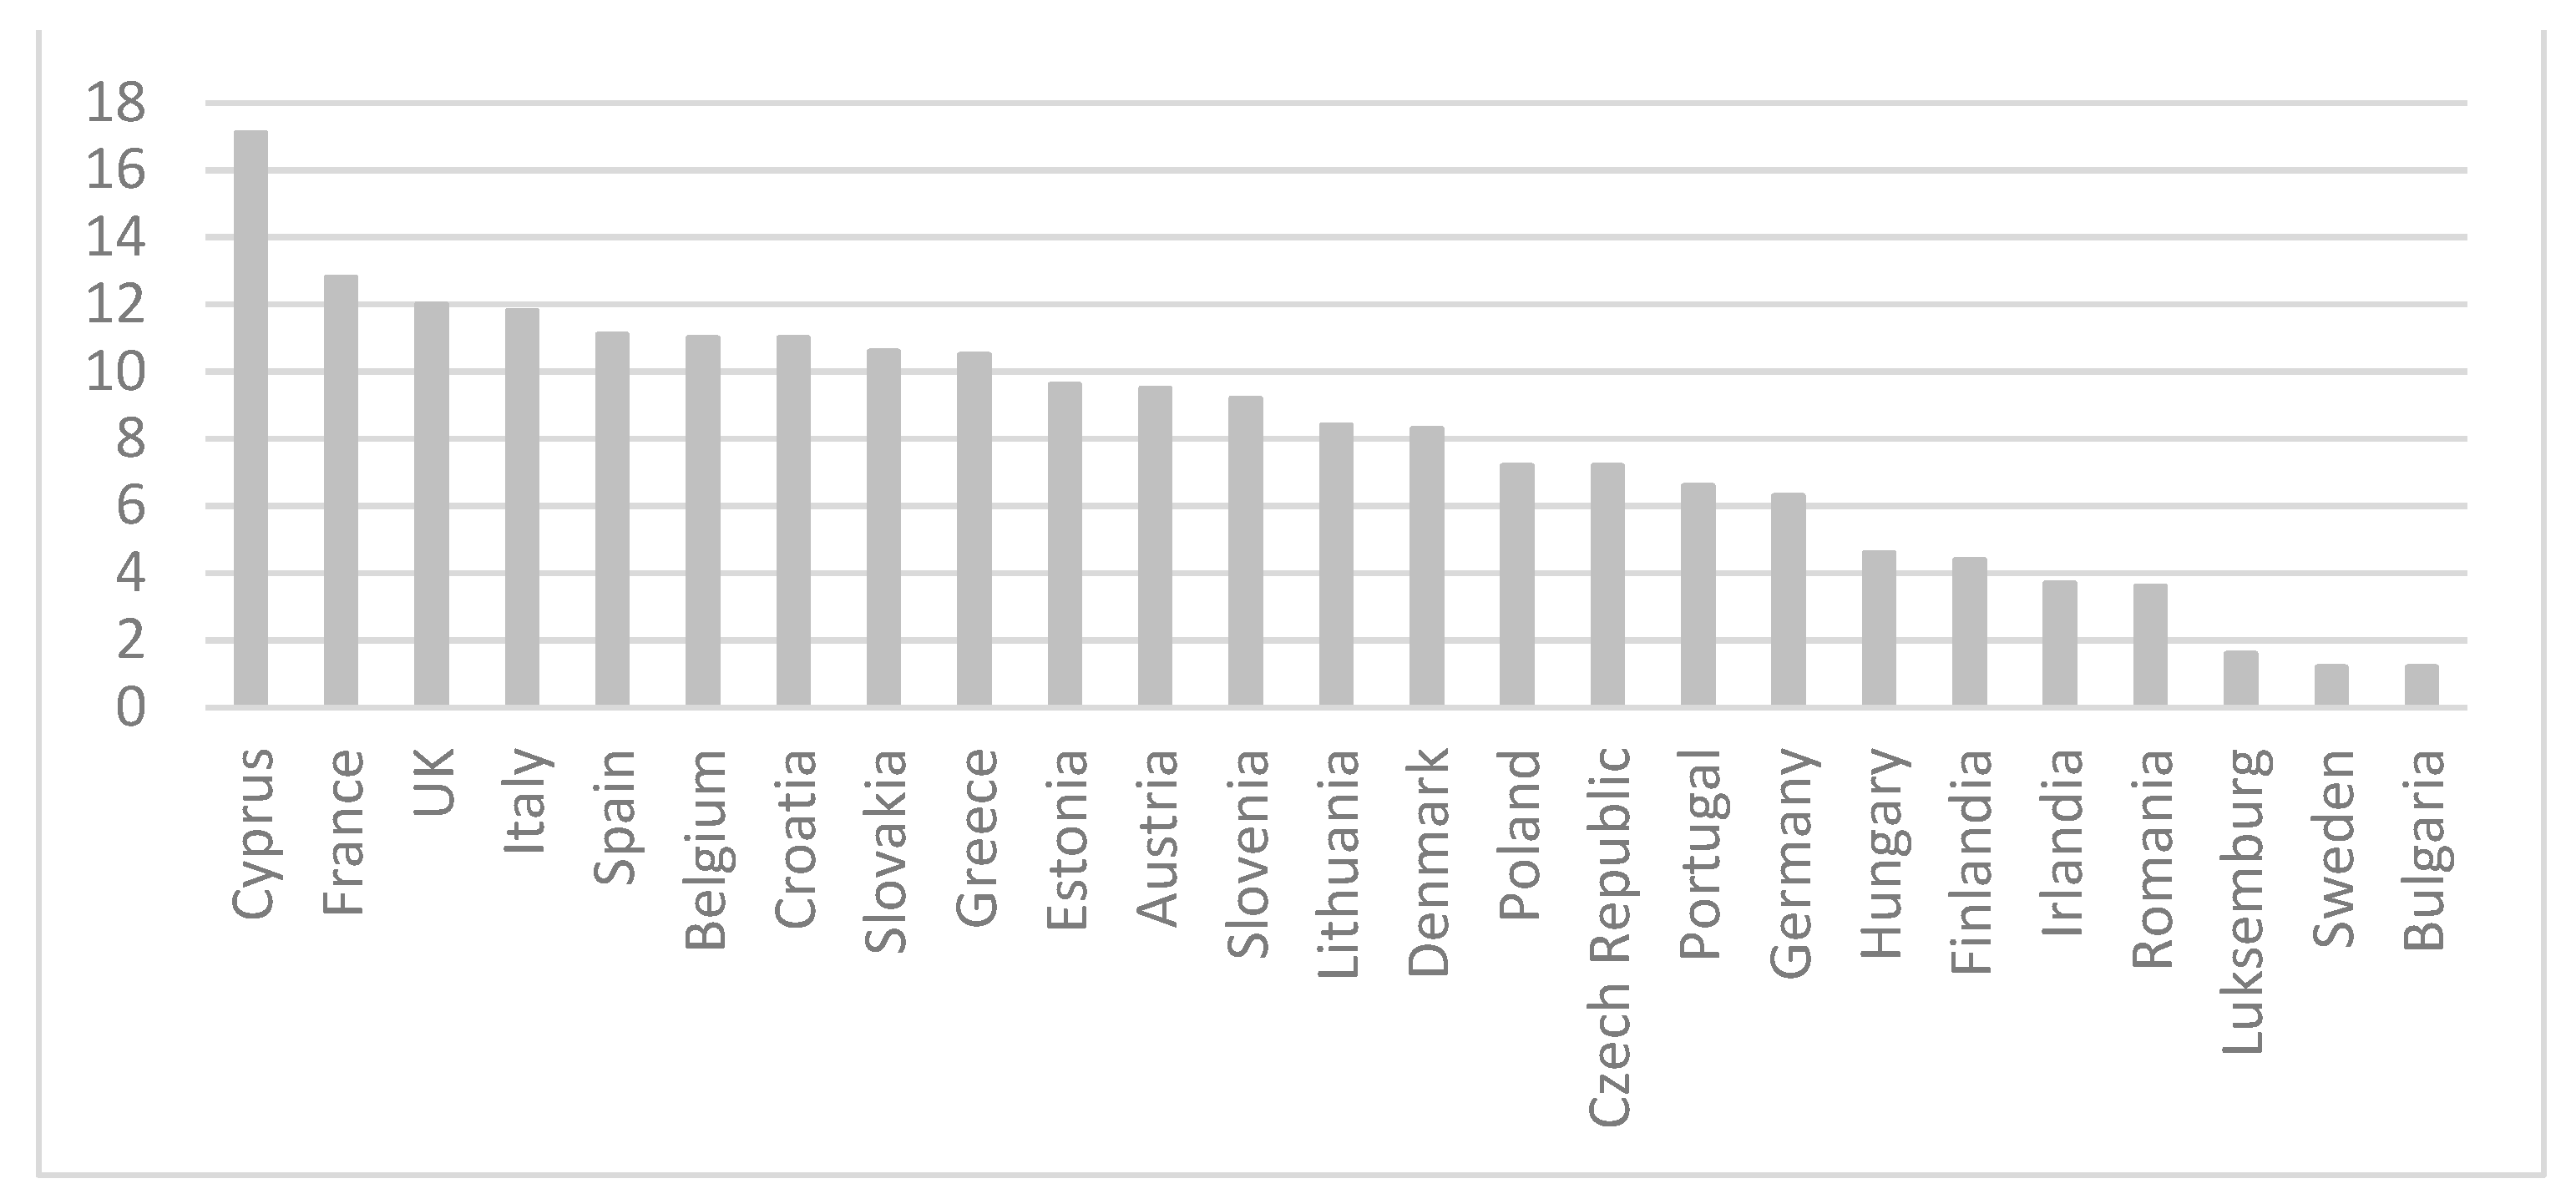
Figure 1). The growing levels of public debt at the outset of the pandemic were reported in all EU member states (avg 8% of GDP) ranging from 17.1% in Cyprus to 1.2% in Sweden and Bulgaria. However, it must be noted that this growth included the financing of pre-planned borrowing requirements and the borrowing needs ensuing from the time of launching anti-crisis measures by particular governments (
Figure 2). The conclusion is that most EU member states were not prepared for the shock induced by the pandemic and did not have in place any financial security buffers in case of another crisis wave.
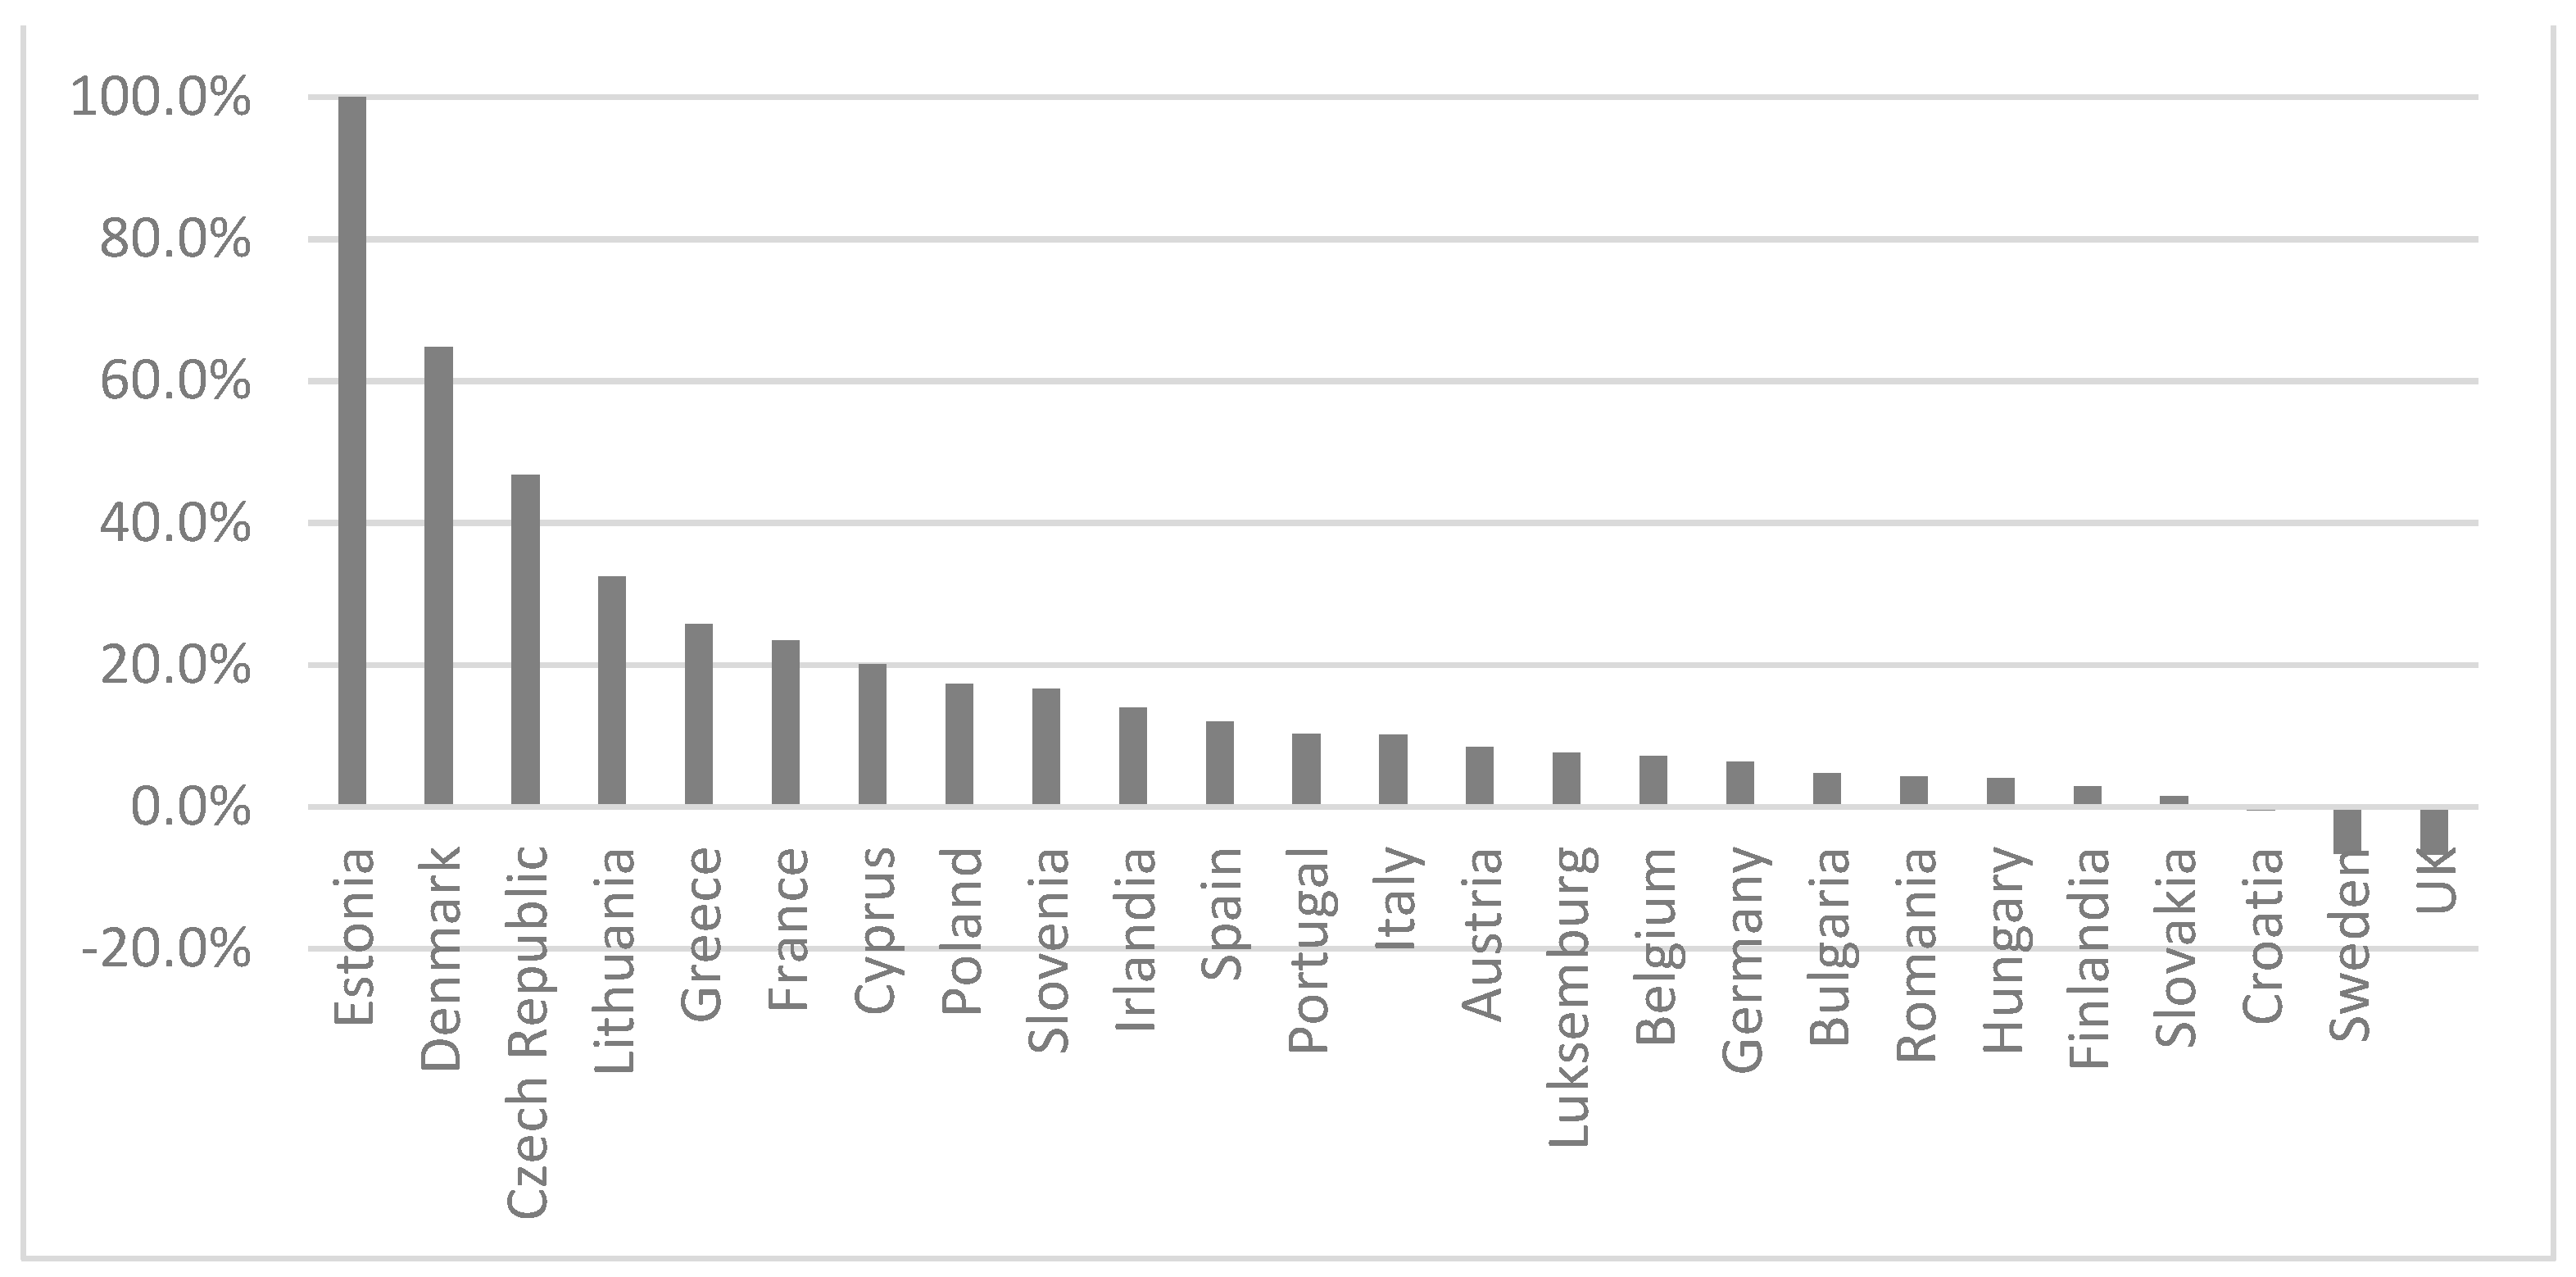
Considering the changes in banks’ balance sheets, most EU member states reported a positive change in the volume of government debt securities held by banks. In seven states, the quarterly growth of government debt securities in banks’ assets exceeded 20% (
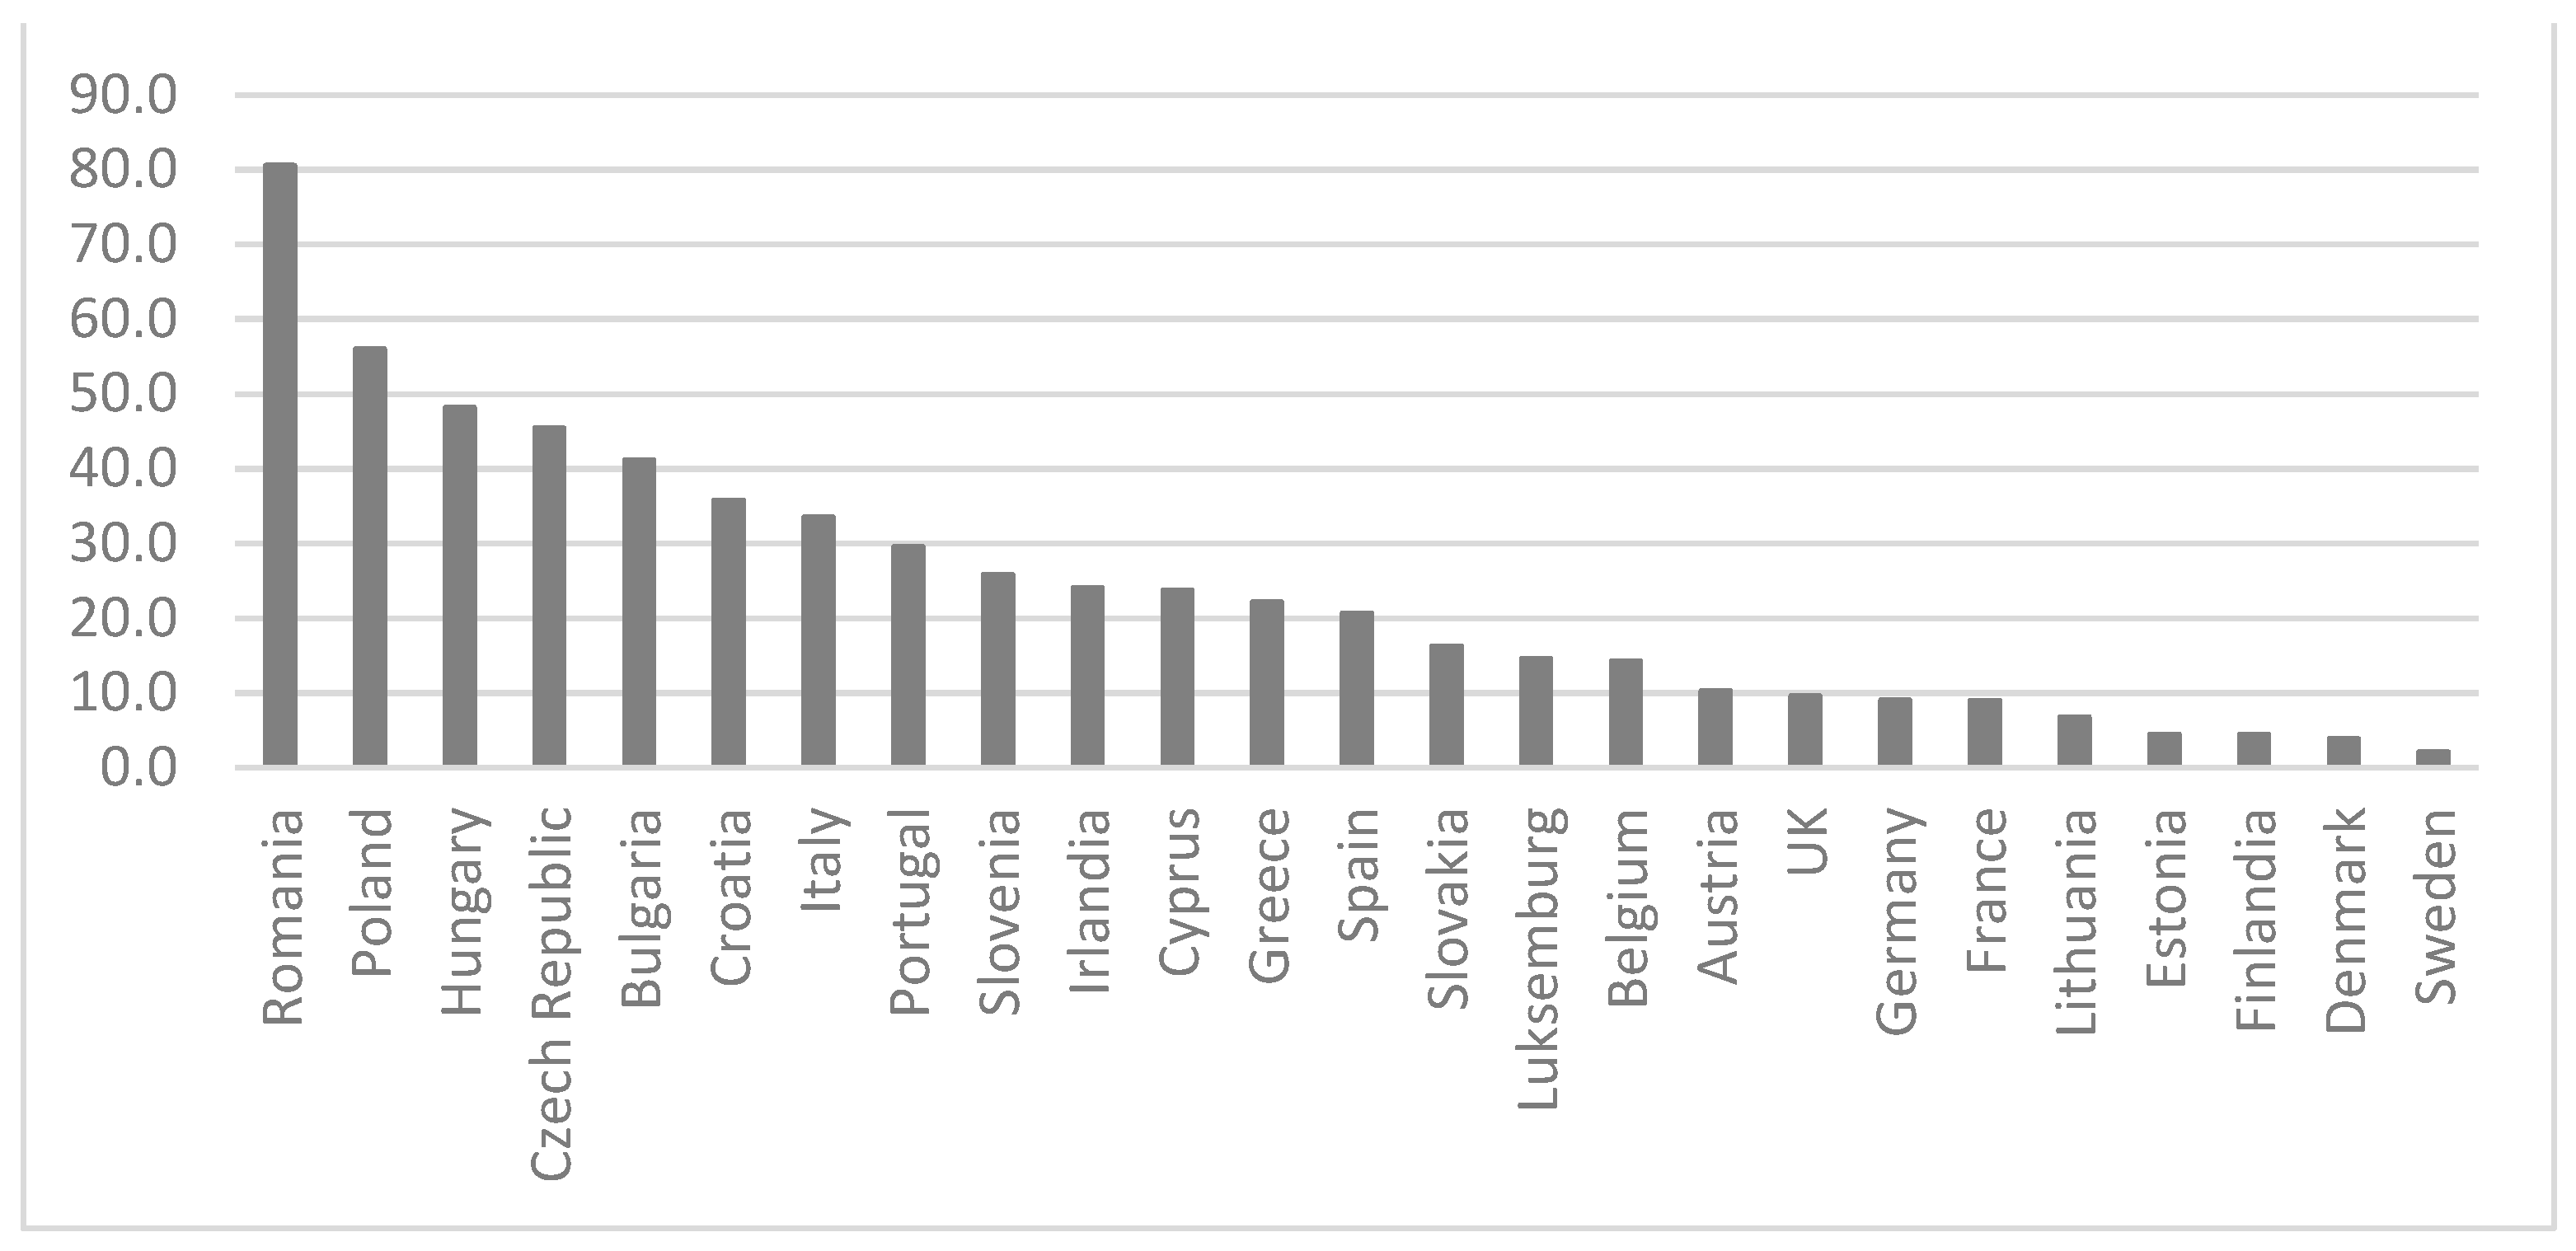
Figure 3). Only three states (Croatia, Sweden, and the UK) reported a drop in the position of banks’ balance sheets. Furthermore, at the onset of the pandemic the ratio government debt securities/loans to domestic residents widely varied across particular member states. The heavy strain on balance sheets exerted by government debt securities (ratio change from 80% to 45%) was particularly pronounced in Central and Eastern Europe (Romania, Poland, Hungary, the Czech Republic) (
Figure 4).
The above presented fiscal and balance sheet trends imply changes in assets management by some banks as a result of increasing exposure in government securities and decreasing the scale of the bread-and-butter credit activity while having limited access to clients due to lockdowns. In order to make the analysis more in-depth, more research was conducted, applying the loan–debt gap method.
The loan–debt gap for the second quarter of 2020 clearly indicates that, after taking account of government debt securities items, 23 in 25 states still maintained 50%-plus lending potential (in five states the figure exceeded 90%). However, on the other hand, the interpretation is also that in as many as 13 states the value of government securities was more than 20% of the total of loans granted by banks during that period (Poland—56%, Romania—81%) (
Figure 5).
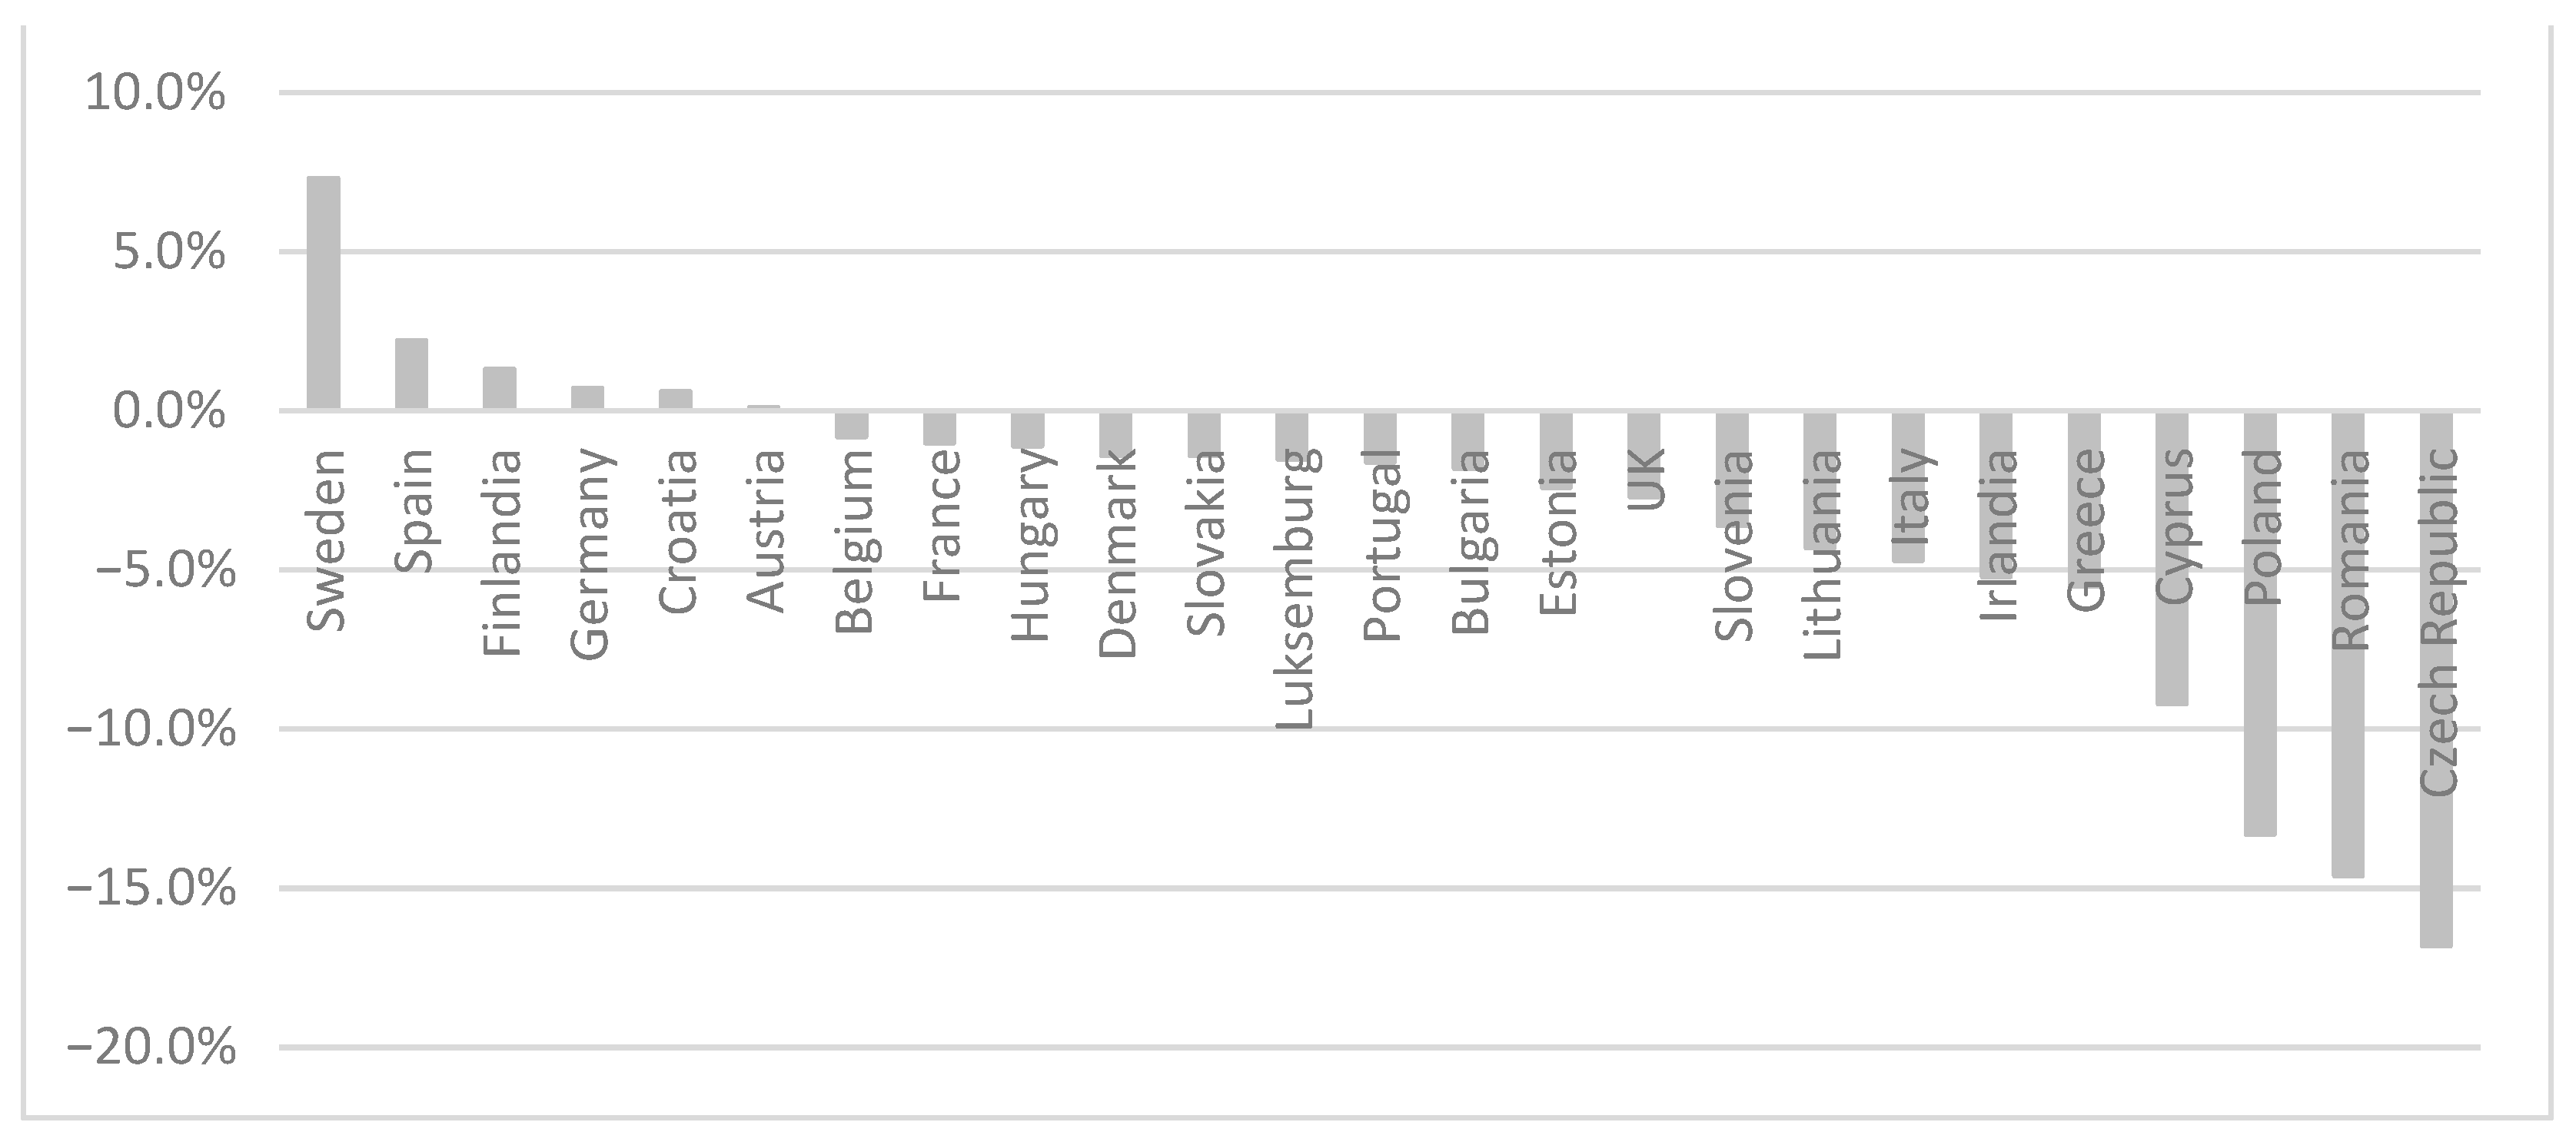
A dynamic analysis of the gap at the turn of the quarters (q1/q2), i.e., at the outset of the pandemic crisis, reveals that 19 member states reported a pronounced drop in the value of the ratio. These states were characterized by the positive change in holdings of government debt securities held by banks (yet at a moderate level), and were amongst the first states to introduce total lockdowns. In case of six states the gap change was positive, the highest being in Sweden, where the Swedish government was relatively slow in launching anti-crisis measures (
Figure 6).
The above presented data for the second quarter of 2020 was also compared against the maximum and minimum gap levels achieved over a broader time horizon covered by this article, i.e., q1 2018–q1 2020 (
Table 2).
Given the analysis findings, it is also interesting to note that in the case of 13 states the negative gap was notably deeper than the minimum gap reported during the two preceding years (pre-crisis years). Then, a comparison of the data from the pandemic times against the maximum gap changes over the last years reveals a pronounced negative change in the trend (e.g., in Romania, the maximum change was 14.3% for q2 2019, and −14.6% for q2 2020). Thus, the data on the gap in the initial phase of the COVID-19 pandemic can serve as a benchmark in analyzing the changes in government securities and banking loans relationships during the subsequent phases of the pandemic and post-pandemic period.
5. Outcomes of the Exploratory Learning Algorithm
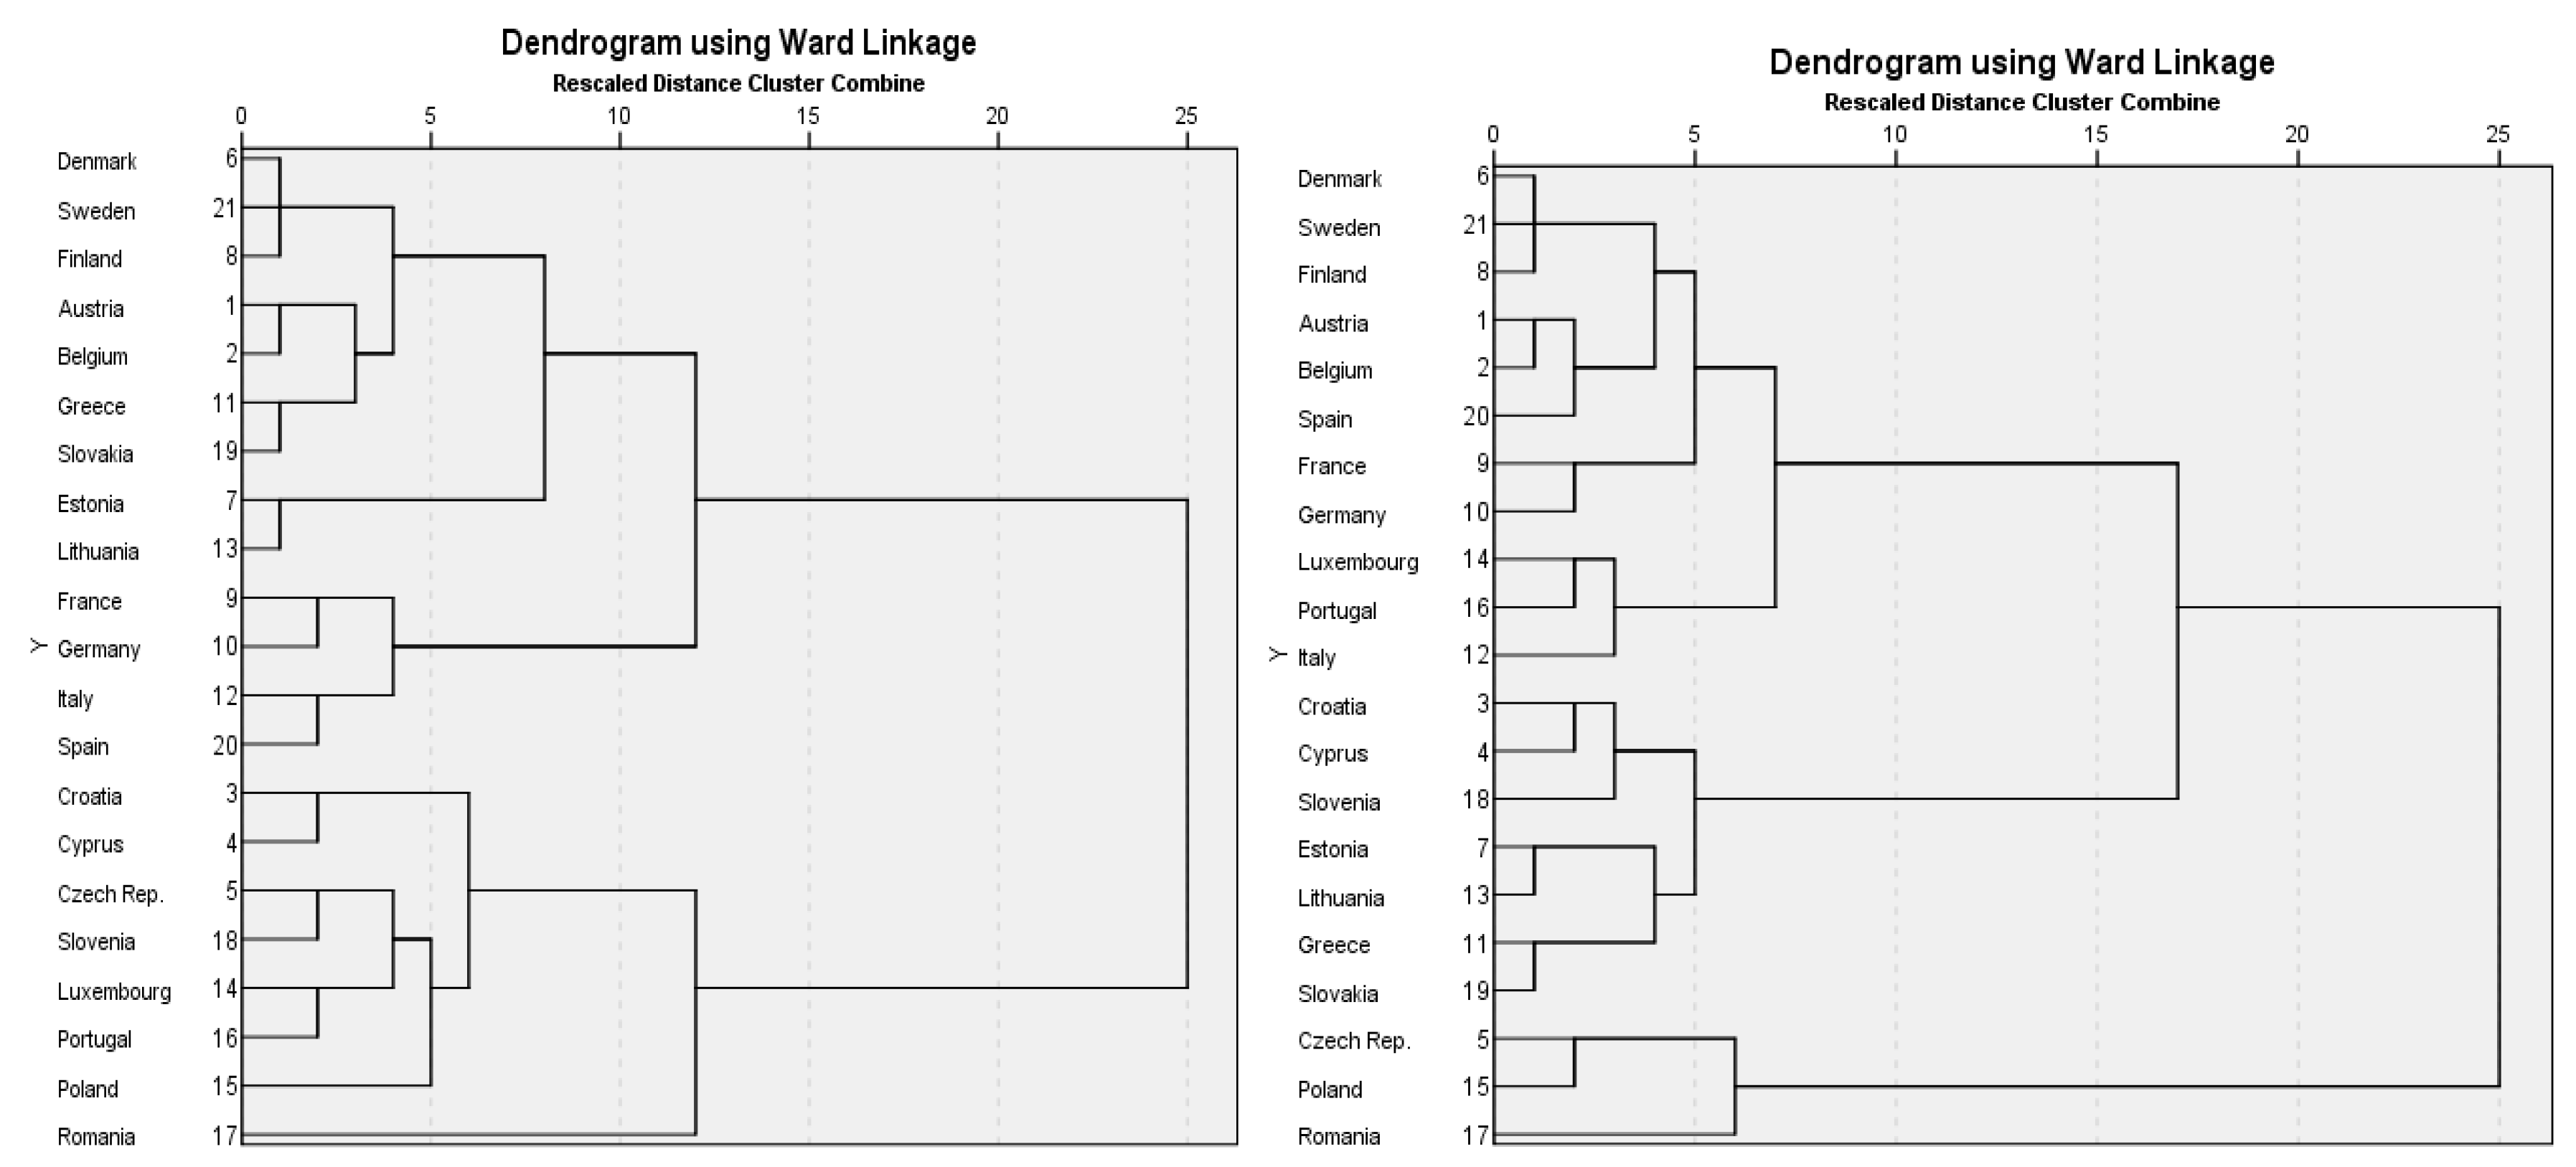
An overwhelming number of studies on various topics belonging to finance field choose the smallest distance range (0–5) for interpreting the clustering solution. It is also our case, as we intend to preserve the particularities of European countries and uncover which are the closest peers (included hence in the same group) and whether there is presence of heterogeneity or on the contrary, of homogeneity among countries given the three variables for banks’ exposure on the sovereign debt market. The clustering solution best describing the intrinsic informational content of the three sovereign debt exposure indicators belongs to a distance interval of 0–4. The hierarchical trees presented in
Figure 7 show the cluster each country had been assigned. The analysis reveals the existence of ten and nine similar groups, respectively. Baseline features of countries included in each cluster, from the standpoint of the sovereign–bank nexus, are detailed in
Table 3.
A first finding is related to the large number of groups generated by the clustering algorithm, suggesting increased cross-country heterogeneity in terms of the relationship with the sovereign. The clustering solution identifies six stable groups of countries, irrespective of the time period considered (Denmark, Sweden, Finland; France and Germany; Austria and Belgium; Estonia and Lithuania; Croatia and Cyprus; and Luxembourg and Portugal) and a persistent outlier country (Romania). Interestingly, all stable groups exhibit the same features both in the pre-crisis and during the COVID-19 crisis outbreak.
Evidence related to 2019 clustering indicates that the Romanian banking system is the one most involved in the sovereign debt market, and hence it is the most heavily exposed to adverse effects emerging from the potential occurrence of sovereign risk. The second place is taken by Poland, showing similar features. Both countries have been identified as outliers in 2019, their features being widely dissimilar from those of the other countries in the sample. Oppositely, countries included in two groups (Denmark, Sweden, Finland; and France and Germany, respectively) are the least exposed to risks from their sovereign.
As regards 2020 clustering, Romania preserves its first place in the hierarchy of the countries most exposed to the sovereign, followed by the Czech Republic and Poland. Still, the countries with the lowest exposure are Denmark, Sweden, Finland, France, and Germany, respectively.
By comparing the primary descriptive statistics (minimum, maximum and average values) related to input variables for the two time periods it can be noticed that the variability in clusters’ composition is mainly due to the changes in the share of government debt in total loans which increased, on average, by around 17 percentage points in Q2 2020 on Q2 2019.
As a robustness check we again conduct the clustering algorithm, by changing the linkage rule between clusters. We use the between-groups linkage (also called the unweighted pair-group method using arithmetic averages) that computes the distance between two clusters as the average distance of all data points within these groups. The new clustering solution highly resembles the initial one, so it can be concluded that we obtain a reliable classification into clusters.
6. Empirical Results Regarding the Impact of the COVID-19 Pandemic
This part of the study attempts to answer the question whether the above-mentioned strengthening of banks’ position on the government debt market is a direct consequence of the COVID-19 pandemic or whether it overlaps the existing structural domestic weaknesses of a country’s fiscal policy, which were exacerbated by the current health crisis.
To gain a preliminary insight into data features, we compute the main descriptive statistics parameters for the timeframe ranging from Q1 2018 to Q2 2020 (
Table 4).
The most striking statistical property exhibited by the data is related to its variability or spread around the sample’s average, reflected by the standard deviation. The highest levels are recorded by public debt/GDP and the interaction term between the COVID-19 dummy and public debt/GDP, indicating increased fiscal data heterogeneity and the presence of extreme values in the sample under analysis. Banks’ exposure to the sovereign, proxy by the share of government debt held by banks in total loans and by the growth rate of government debt securities also shows increased variability. As regards pandemic-related variables, the two indices synthesizing governmental support and involvement in pandemic containment depict the largest variability among countries, being a proof that economic and health measures have been applied with different timing, speed, and amplitude. The first conclusion to be drawn from this preliminary assessment is that the pandemic crisis overlapped a diverse environment characterized by various degrees of public indebtedness and bank exposures to the sovereign.
Further, it has been generated the correlations matrix to examine if there is presence of multicollinearity between the explanatory variables to be used in the panel regressions. Statistical theory states that multicollinearity becomes a problem when the value of the correlation coefficient is above 0.80. Spearman’s rank correlation illustrated in
Table 5 shows low correlation among candidate variables.
To check if data is stationary, we use, as panel unit root test, the Levin, Lin and Chu t method. The ratio of government debt held by banks/total bank assets and the budget deficit/GDP are stationary in first difference, while public debt/GDP, real GDP growth rate, and % change in nominal GDP are stationary in second difference.
Table 6 reports the results of the panel data regressions with random effects, under various model specifications, while
Table 7 summarizes the LR redundant fixed effects test and
Table 8 shows the robustness of the results to the use of alternative fixed effect specifications.
The findings confirm our research assumption: all of the five pandemic-related variables are statistically significant and exert an influence on each dependent variable defined. The value of the COVID-19 dummy coefficient is negative and statistically significant in relation to the growth rate of government debt securities held by banks and the ratio of government debt held by banks as a share in total bank assets. Therefore, the outbreak of the pandemic coincides with a decline in the level of both variables, compared with the preceding normal times. The pandemic impact is more visible in terms of sovereign debt holding size change than as a share of total bank assets.
The average number of new COVID-19 cases exerts a negative influence on the first model specification. However, increases in the quarterly average of new cases seem to lead to a contraction in the sovereign debt holding, as growth rate, banks’ financial behavior, and reactions are the least determined by this particular pandemic proxy.
An increase in government responsiveness to contain the pandemic effects on the overall economy results in a decline of both dependent variables, although the impact is more pronounced as regards the growth rate of government debt securities held by banks. This finding may be explained through the portfolio rebalancing hypothesis (
Tischer 2018;
Bouis 2019) which claims that in times of distress banks are tempted to excessively turn towards safer and more liquid public assets, as lending becomes less attractive. Prompt government interventions during crisis times (as signalled by the Government Response Index and the Economic Support Index) seem to alleviate the portfolio rebalancing response of banks and to trigger decreases in the sovereign debt held by banks. Our finding is confirmed by
Zaremba et al. (
2020) who uncover that states’ intervention in the economy during the COVID-19 onset exhibits a negative and statistically significant relationship with sovereign bonds’ volatility. Therefore, government rapid pace response and large-scale economic stimuli help stabilize the sovereign bond market and reduce the risk aversion of its participants.
The impact of the fiscal deficit as a share in GDP is found to be statistically insignificant for both model specifications—a result in line with the one reported by
Bouis (
2019). The effect of the real GDP growth rate on the growth rate of government debt securities is always negative and statistically significant, irrespective of the various COVID-19 pandemic proxies applied. In times of economic downturns, banks tend to increase the amount of sovereign debt held compared to its preceding levels. In terms of government debt securities share in total bank assets, the negative relation with the real GDP growth may be explained by the fact that during economic upturns the size of banks’ balance sheet increases at a faster pace than the increase in the level of sovereign debt portfolio as banks put heavier weight on lending activity.
Table 8 below shows the robustness of our results to the use of alternative fixed effect specifications.
To endorse the validity of our findings, we perform further robustness checks by applying the following changes to the initial baseline specification:
- -
Two alternative specifications of the dependent variable, namely, (i) the ratio of government debt held by banks/total loans to residents, and (ii) loan–debt gap (as natural logarithm);
- -
An interaction term between public debt/GDP and the COVID-19 dummy;
- -
As an additional control variable, we include the % change in the nominal GDP, and eliminate from the regression the real GDP growth rate and the budget deficit/GDP, as they are highly correlated.
The new results confirm the impact exerted by the COVID-19 pandemic-related variables on the alternative dependent variables (
Table 9).
None of these additional changes plays a major role in our overall conclusions. In all the robustness checks, the coefficients of the pandemic-related variables remain statistically significant and hence maintain their role in determining the interplay between banks and the public sector (models 2 and 4 in
Table 9).
The interaction term is statistically significant, confirming that in normal times as well as during pandemic times public debt/GDP determines banks’ holding of sovereign debt as percentage of total assets. There is a positive relation between public debt/GDP and the dependent variable, meanwhile when interacting with the pandemic occurrence, the estimated coefficient keeps its positive value, suggesting that the impact of public financing needs on bank holding of public debt does not change. Therefore, higher public financing needs expressed through an increasing value of the public debt to GDP has a positive impact on banks’ holdings of government debt, both in times of stability and when overlapped on a severe distress such as the pandemic.
7. Conclusions
The paper investigates whether the COVID-19 pandemic crisis has the potential to influence bank holdings of government debt and what may be the impact of it on lending activity in the post-pandemic period. First of all, the comparative statistical analysis based on the computation of the loans–government debt gap revealed that most EU member states were not prepared to handle the pandemic crisis due to the lack of financial security buffers and high public debt level (average for EU countries was over 72% of GDP in quarter 2 of 2020). What is more, at the beginning of 2020, the balance sheets of banks, particularly in some CEE countries, were facing a relatively high government debt securities exposure in relation to the value of loans to domestic residents, further exacerbated in the wake of the pandemic outbreak. What is obvious, at the beginning of pandemic crisis, the lending activity of banks was diminished by government lockdowns, but on the other hand banks in most EU countries (19 out of 25) increased the government debt exposure. It would be the signal that banks, trying to help the government in borrowing needs financing, can decrease their lending potential for private creditors in the post-pandemic period. Therefore, there is a necessity to stronger monitor balance sheet risks and security buffers for banks.
Subsequently, the exploratory cluster analysis performs the classification of EU countries at two moments of time, namely, in normal times, and on the pandemic onset according to several sovereign debt exposure indicators. The clustering solution reveals the presence of several stable groups of countries that exhibit the same features both in the pre-crisis and during the COVID-19 crisis outbreak. The classification of countries into homogenous, resembling clusters has the purpose to signal to practitioners and policy makers those countries that are the least exposed to risks from their sovereign, those with moderate exposure as well as highly exposed countries. In this respect, the algorithm has identified two outlier countries (Romania and Poland) whose banking systems are heavily involved on the sovereign debt market, and hence are highly exposed to adverse effects emerging from the potential occurrence of a sovereign risk.
The panel regression complements the previous research approaches, by assessing the impact exerted by the pandemic on the existing sovereign–bank nexus. Results indicate that the occurrence of the pandemic, and an increasing number of new confirmed cases, led to a contraction in the sovereign debt holding, both as growth rate and as share in total bank assets. An increase in government responsiveness and economic support to contain pandemic’s effects on the overall economy helps at stabilizing the market and at curbing banks’ flight-to-safety behavior; results show a decline of the sovereign debt holding, which suggests that banks are not risk averse in lending to real economy and keep fulfilling their traditional financial intermediation role. Therefore, an interesting conclusion is related to the potential crowding-out effect triggered by the pandemic. Although the public perception was that banks will prefer to lend to the sovereign through purchases of government debt securities instead of lending to households and businesses, our results show that banks did not proceed to a sharp portfolio rebalancing in favor of the sovereign.
By distinguishing between positive and negative COVID-19 information we discover that the dummy variable related to the pandemic outbreak exerts the biggest impact, followed by the Government Response Index. Consequently, it can be concluded that banks’ involvement on the sovereign debt market is sensitive mainly to negative information related to pandemic occurrence and, to a lower extent, to positive information reflected by governments’ reactions and economic stimulus measures.
In conclusion, the findings confirm the persistent sovereign–bank nexus at the beginning of the pandemic, which requires further monitoring activities during the next phases of the pandemic crisis.
The conclusions of the threefold statistical analyses developed in this paper are applicable to the initial phase of the COVID-19 pandemic and can serve as a benchmark in analyzing the further interplay between the sovereign and the banking system also during the subsequent phases of the pandemic and post-pandemic period. Although the short time period related to the pandemic outbreak which is included in the estimation may represent a potential limitation of the research, updated results will be validated when more data will become available.
