1. Introduction
Insurance plays an essential role in society since it enables the transfer of risks from individuals to insurers. Insurers accept this risk transfer in exchange for a fixed premium calculated before knowing the risk’s actual cost. The relationships between an insurance client’s information and his expected future claim are inferred using historical data in a process called rate-making (see, e.g.,
Parodi (
2014);
Blier-Wong et al. (
2020)). These historical data are curated so that only important predetermined factors are considered and observed. Curating data creates a division where new and emergent risk patterns have to be integrated into the rate-making process on a case-by-case basis. An actuary usually evaluates the relative importance of a risk factor through a statistical study.
Although actuaries are proficient at detecting generalized numerical patterns, their skills seldom extend to unstructured and massive data such as textual documents. Text is a rich source of knowledge that requires extraction from experts to be usable in predictive models. Textual documents are also abundant in insurance companies. For instance, one can think of claim notes that capture the information regarding a claim. Exploiting the textual content of the claim notes could enable the insurance company to understand shifts in claim importance and to detect leakage or fraud. Social media interaction is another plentiful source of textual data where one can capture customers’ intentions regarding renewal or marketing strategies effectiveness. These previous tasks demand that experts provide judgment to convert the data into actionable knowledge. The automation of such a process on large unstructured datasets requires data mining algorithms to locate salient information passages. Various authors proposed text data mining techniques in the actuarial field, such as
Francis (
2006) and
Tixier et al. (
2016). Albeit providing highly explainable models, these techniques suffer from potentially sub-optimal data representation due to hand made feature design (see
Kuhn and Johnson (
2019)) leading to sub-optimal models (see
Tang et al. (
2015)). Exploiting data to their full potential is crucial in a very competitive economic environment like the insurance sector. Companies in other sectors like
Google and
Facebook support this assumption as they differentiated themselves from their peers using state-of-the-art practices relying on data-driven processes.
One clear example of this data representation challenge is the experiment initially presented by
Borba (
2013) and enhanced in a follow-up work by
Zappa et al. (
2019) where word embeddings were incorporated in the analysis. While correctly assessing the impact of intoxicants on injury severity levels, their model’s effectiveness relies on iterative, heavily hand-crafted feature engineering. Their workflow requires an expert to annotate generalized textual patterns in the corpus. Such a workflow relying on manual expertise has four main drawbacks; (1) it takes time; (2) it creates a bias and pressure toward the author expertise; (3) it requires careful trial and error during features generation to capture every phenomenon depicted in the document; and, more importantly, (4) it creates models that scale poorly when new phenomena are observed, making them brittle to concept drifts.
This paper proposes an entirely data-driven method to automatically transform large textual corpora into usable knowledge regarding a labeled phenomenon. This knowledge can either generate features to feed actuarial models or enhance the insurance value chain by raising situation awareness about certain risks. Our method departs from the traditional data mining approach, as it completely removes the need for tedious and lengthy hand made feature engineering. It relies on the internal capacity of machine learning algorithms to generate features that model the phenomenon using raw data. It also relies on the exploitation of attention mechanisms to expose important model features to the analyst. Our method is simple and can be summarized as follows. We first identify and label a phenomenon we want to understand. We then engineer and we train a highly flexible recurrent neural model, like the Hierarchical Attention Network (HAN) proposed by
Yang et al. (
2016). We evaluate the capability of the model to predict the phenomenon using dense word vectors (as presented by
Mikolov et al. (
2013)). Finally, we extract the important features located by the model to obtain risk factors.
We illustrate the relevance of our method in an experiment reusing the dataset introduced by
Zappa et al. (
2019). This case study features a textual dataset describing road accidents. The authors tried to capture the impact of intoxicants (alcohol, medication, prescription drugs and narcotics) on injury severity using traditional natural language processing (NLP) techniques and laboriously crafted features engineering. In our work, feature engineering is driven by countable variables, such as the number of vehicles, the number of people and the number of injured people involved in the accident. It is accomplished as part of a Poisson count variable model, which is implemented using a version of HAN extended with a Poisson loss.
Although the focus of our work is text-based risk management, this research is relevant to other domains exploiting hierarchical data such as medicine or sentiment aspect modeling. Authors such as
Sha and Wang (
2017),
Wang et al. (
2018) and
Yu et al. (
2019) have already implemented versions of HAN models for those application fields. For actuarial science and actuarial practice, the added benefits of using our approach are:
The paper’s contribution is the presentation of a machine learning framework that uses a neural network to exploit text data in actuarial applications instead of the traditional feature engineering approach. Another contribution is the introduction of attention mechanisms in actuarial models, used for extracting critical features from the decision making process of a neural network.
2. Materials and Methods
In this section, we present the models used, evaluation strategy and experimental approach. We begin by describing the two compared models: the Generalized Linear Model (GLM) for Poisson regression that serves as a baseline and the proposed framework, a hierarchical recurrent neural network with attention mechanisms. We then present the evaluation scheme based on prediction performance and model interpretability. Finally, we report on the results of an end-to-end approach to extract risk factors from textual descriptions of accidents modeled as Poisson count variable distributions.
2.1. Generalized Linear Model
The GLM is a generalization of linear regression that allows a linear predictor to be related to the response variable via a link function
. The link function
is defined as
where
is the input vector and
the model weights. In this paper, we used a Poisson regression, which is a specialized form of GLM used to model count data. Poisson regression assumes that the response variable Y has a Poisson distribution with mean
equal to
which in turn assumes a logarithmic link function.
2.2. Hierarchical Attention Network
HAN is the state-of-the-art hierarchical neural network architecture for document classification. The architecture of a HAN model features two stacked recurrent cells. A multi-level model is justified by the intrinsic hierarchical nature of text, where words group into sentences and sentences into documents.
Neural networks are highly flexible models that have the reputation of being black box models. Although they achieve excellent performance when provided with large datasets, understanding their decision-making process is challenging compared to models relying on analyst-engineered features. To overcome this issue, we use attention mechanisms. Such mechanisms force neural networks to identify salient features prior to making a prediction, hence allowing their internals to be exposed to the analyst.
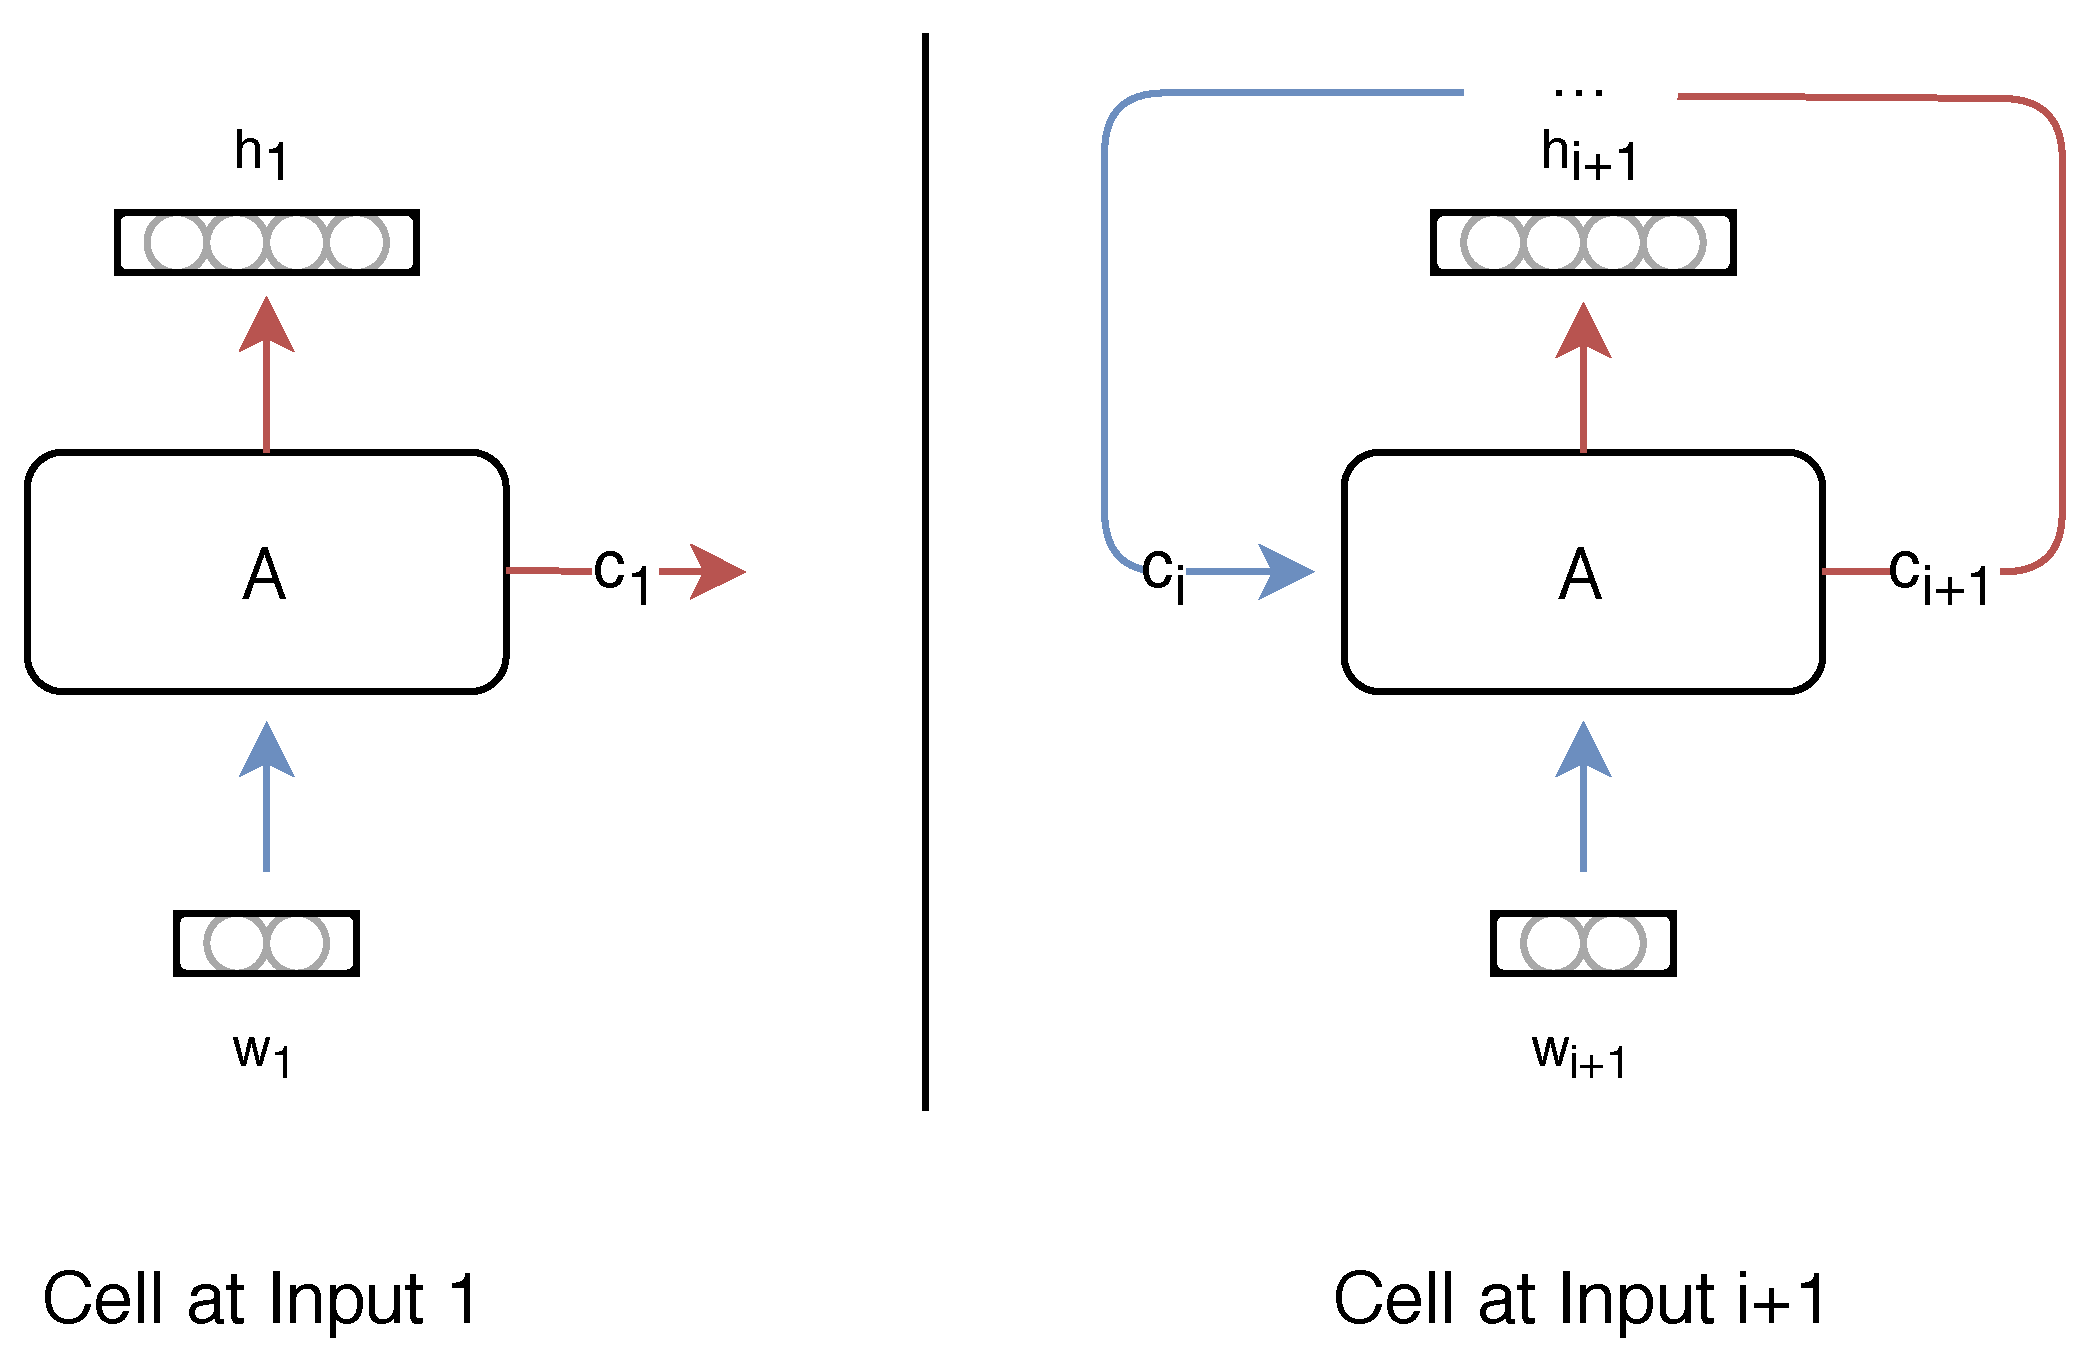
2.2.1. Recurrent Neural Network
Recurrent neural networks (RNN) are neural models that are designed to process sequential data. As their name suggests, the network is iteratively applied to each element of a sequence. As illustrated in
Figure 1, the inputs
are successively fed to the recurrent cell
A. The cell keeps track of past inputs using its hidden state vector
and outputs its current state with the vector
. Vectors
h and
c are of equal dimensions, and their difference resides in the implementation of the cell
A.
Recurrent cells have two relevant properties we wish to leverage in our work. They can handle variable-length inputs, and they are successful at capturing long term dependencies between sequence elements. In our work, these properties play an important role. First, the textual descriptions we use are of variable length. There is no maximum number of words in a sentence nor maximum number of sentences in a document. Secondly, the descriptions contain dependencies between words and between sentences that should be captured. We used Long Short Term Memory (LSTM) units presented by
Hochreiter and Schmidhuber (
1997) to implement the recurrent cells of our model.
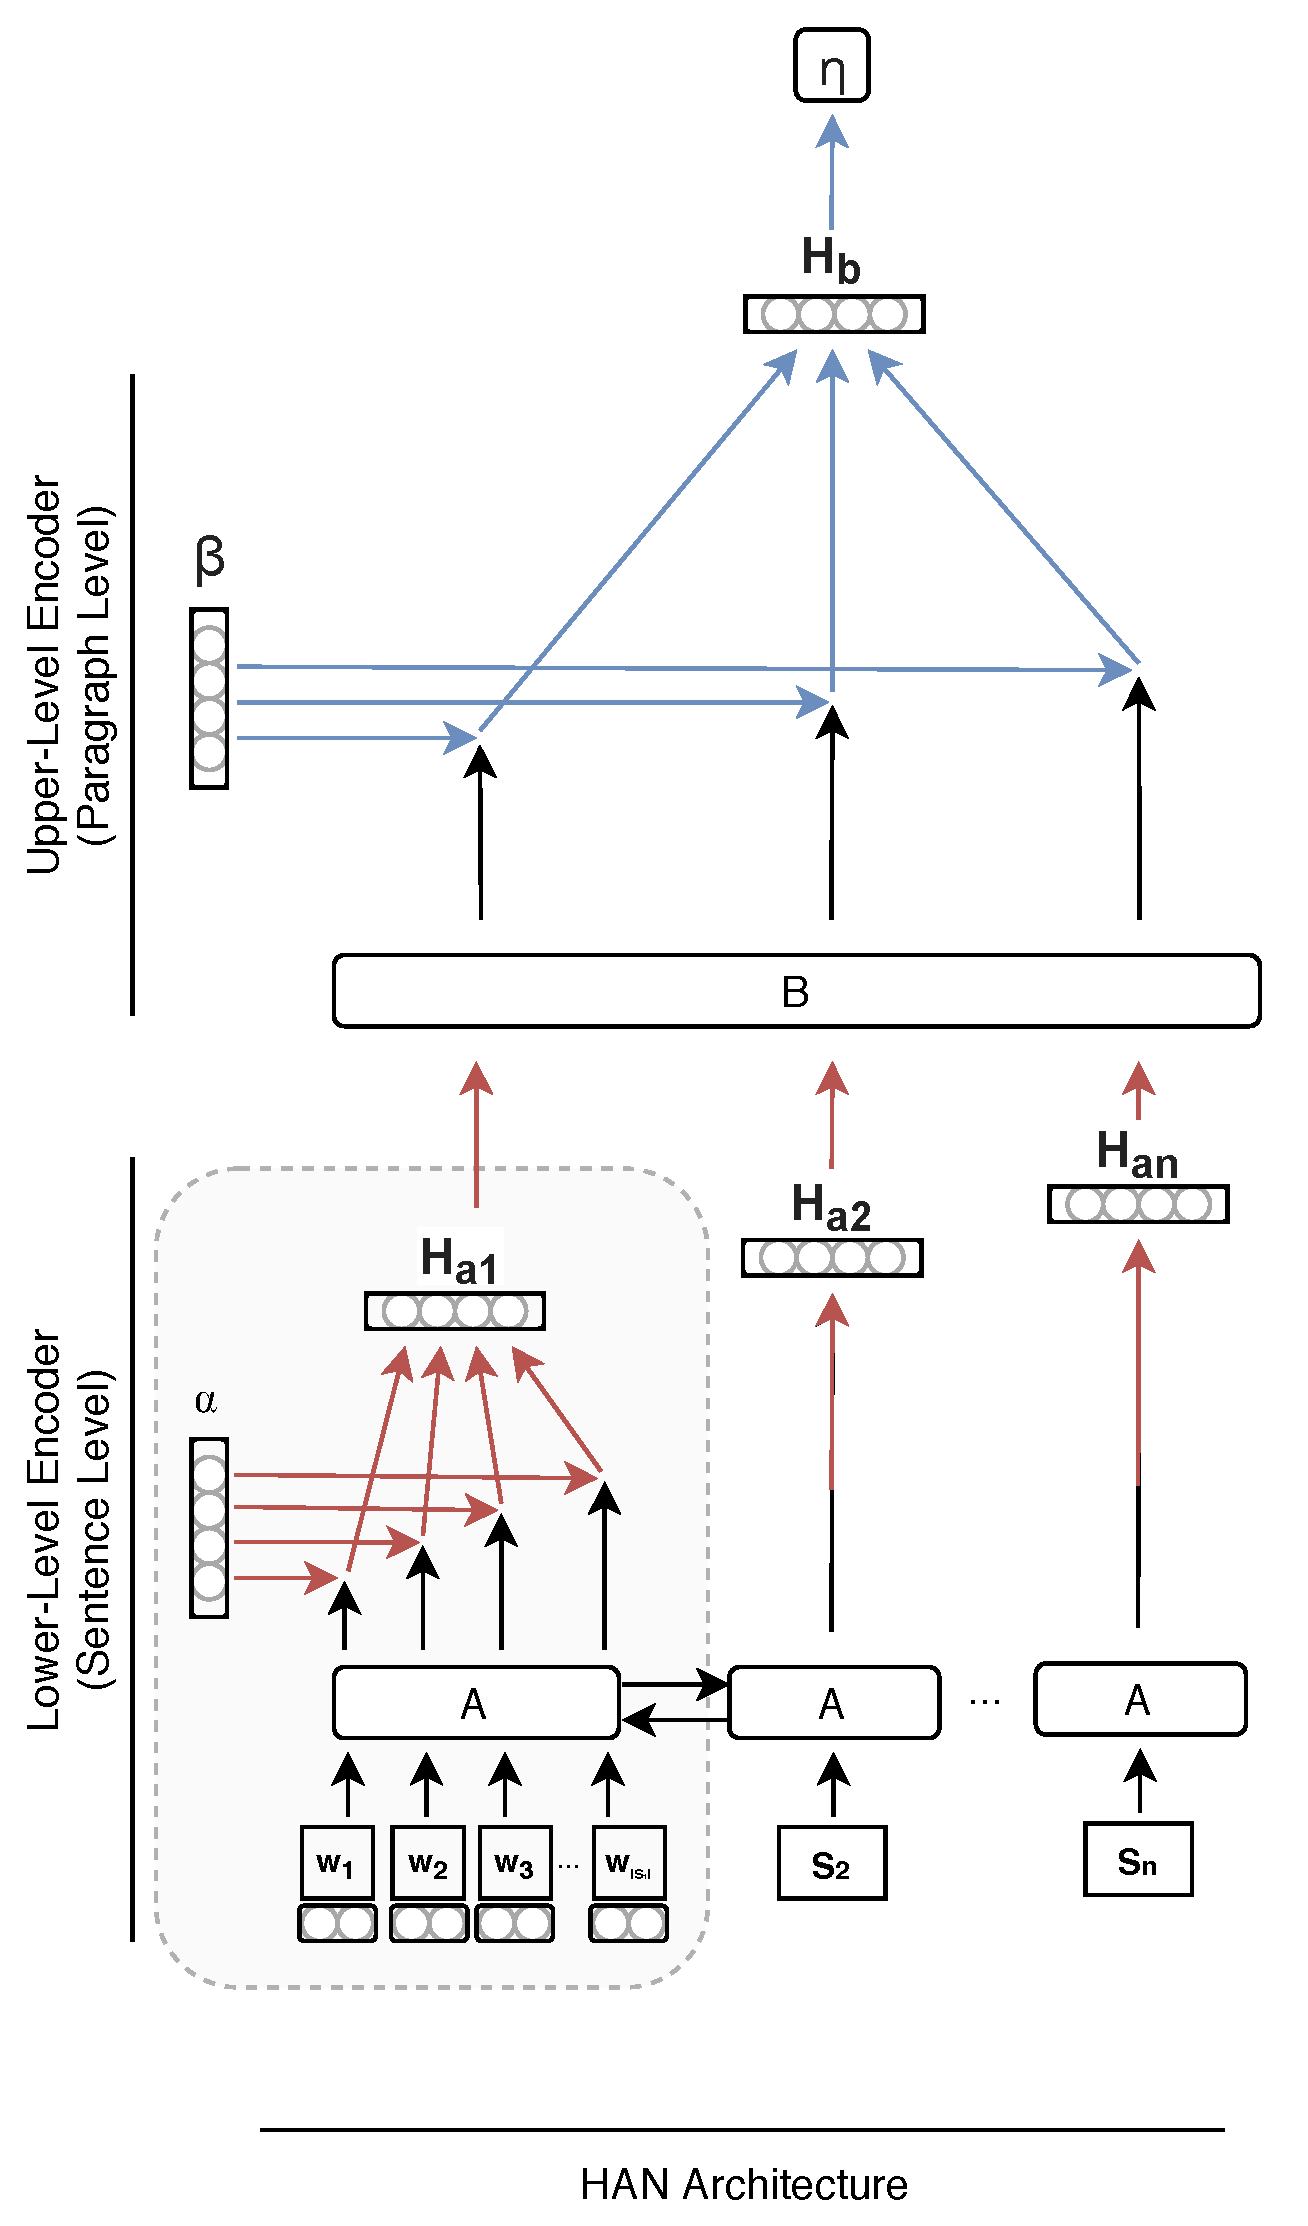
2.2.2. Hierarchical Topology
The hierarchical model presented in this work accommodates inputs that are aggregated twice. More specifically, the engineered architecture, presented in
Figure 2, allows for the conversion of multiple words into a document. The first level of the model uses recurrent cell
A to aggregate words into sentences, with the attention weights
highlighting the crucial terms within the sentence. The second level uses cell
B to aggregate sentences into paragraphs, with the attention weights
highlighting the most critical sentences within the document.
In more formal terms, data points for this architecture are aggregate units (document) that split into n sub units (sentences), each of them dividing again into inputs (words), with and . Note that corresponds to the number of elements in set A.
The first lower-level cell A takes inputs (words) from the text data to generate , an aggregated representation of the sub unit a representing a sentence. is given by , where is a vector of dimension , representing the hidden state associated with the ith word input and is the learned attention weight of the ith input. The process is repeated for the n sub units (sentences) of an aggregate unit (document).
Sequentially, the same process occurs at the upper-level where each sentence representation are iteratively inputted in the upper-level cell B. The final representation of the aggregate unit (document) , the upper-level equivalent of the vector , is calculated as , where is a vector of size , representing the hidden state of the cell after the jth sub unit (sentence) and is the attention weight of the jth sub unit input. Both and are model hyper-parameters, and and are scalar values.
2.2.3. Regression Model Using HAN
HAN is a generic function , where n is the number of sub units (sentences) in a document, is the maximum number of words in a sentence , and m is the number of covariates of the regression model. The output of the function is then passed through a fully connected layer with weight matrix and bias (intercept) term .
In this paper, we model the distribution of a Poisson counting variable and use the logarithmic function as the link function. It follows that
To achieve this, we alter the design of
Yang et al. (
2016) by adopting a Poisson loss instead of a cross-entropy loss, the latter being more suitable to classification tasks.
2.2.4. Attention Mechanism
Attention mechanisms are an essential part of the approach we are proposing. Their contribution is two-fold. First, this mechanism enhances the model’s performance, as presented in
Yang et al. (
2016). Secondly, attention weights make the model’s internals understandable by an analyst. Ultimately, an analyst can extract the knowledge captured by the learning algorithm using the attention weights assigned to each element of a document. In other words, the attention mechanism replaces feature-engineering in parts, hence reducing the analyst workload during data modeling phases.
Examples of attention weights are presented in
Table 1. Weights range from 0 (useless word) to 1 (very important word). Attention weights are visualized in shades of red; no color meaning 0, and solid red meaning 1. These were extracted from a HAN model trained as described in
Section 2.4. It is important to note that no other feature than raw text was used. Additional information about the preprocessing steps applied to obtain the raw text is presented in
Section 2.4.1.
In our work, we implemented the attention mechanism exactly as presented in the HAN architecture. The attention mechanism is illustrated in
Figure 3 and corresponds to the grayed zone in
Figure 2. A fully connected layer
, with trained parameter matrix
, takes the hidden representations
for each input
and assign a score
to each element of the sequence (each word of a sentence or each sentence of a paragraph). Each score
is normalized using a softmax function to obtain the attention weight defined as
The final representation of the sentence (
), or paragraph (
) is defined by
and is obtained by summing the product of each hidden state vector
with their associated scalar normalized weights
.
2.3. Model Evaluation
To assess that the model’s attention mechanisms extract useful knowledge, we must evaluate the prediction performance of the model. Obtaining satisfactory prediction performance implies that the data contains information relevant to the predicted risk. The interpretability of the model must also be evaluated. Interpretability is a desirable property of machine learning models that allows an analyst to understand the algorithm’s decision process. This property is often validated when an analyst generates features by hand. However, as our HAN model finds by itself the salient features of textual descriptions, we must ensure that an analyst can extract those.
2.3.1. Model Performance
Although the prediction performance of the model is not the end goal of the experiment, one needs to be confident that the proposed model does not under-perform compared to a baseline model and that the extracted features adequately predict the inquired risk. We evaluate the model performance using the Poisson divergence, since they are both estimating Poisson count processes. The Poisson divergence
is defined by
where
N is the number of observations in the standardized test dataset, and
and
are respectively the true value and model prediction of the
ith observation, with
.
2.3.2. Model Interpretability
We evaluate the interpretability of the model using a visual analysis. This analysis should help the reader understand that we can exploit the representation strength of deep learning models as an alternative to feature engineering while preserving the latter’s interpretable quality.
In this experiment, we consider the interpretability to be satisfactory if the extracted features are related to the associated risk factor. As specified in
Section 1, we aim to predict the number of cars in an accident. We expect the top 3 words used for regression to be associated with the concept of counting vehicles.
To obtain the top three words, we compute the average weight given by the model to each word for each case contained in the test dataset, with and V the vocabulary of the dataset.
The model interpretability analysis using attention weights is one of the contributions of this paper. It is used to extract the knowledge distilled from the unstructured data by the neural network model. It allows the analyst to explain the model decision and to exploit these factors in other related processes.
In the GLM model, we use the score
s defined by
where
is the
ith document from this dataset,
is the Term Frequency Inverse Document Frequency (TF-IDF) from
Salton and Buckley (
1987) of the
jth word and
is its fitted GLM weight.
In the HAN model, the score
s is defined by
where
is the
jth word of the
kth sentence of the
ith document from this dataset, and
is the attention weight of its associated hidden state vector
, as calculated in
Section 2.2.4, and
is the attention weight of the
kth sentence of the
ith document.
2.4. Experimental Dataset and Training Tasks
For this experiment, we used the National Motor Vehicle Crash Causation Study dataset by the
National Highway Traffic Safety Administration (
2006) (NHTSA). This dataset contains 6000 accident reports. Each of these reports includes a textual description of a car crash event. The textual documents have an average of 25 sentences. Each report also includes additional categorical information such as the accident severity level, the number of cars and the number of people involved in the accident. Ultimately, this experiment’s objective is to extract textual risk predictors from accident descriptions. The first step to achieve this goal is to train a model that effectively predicts the output variable we are interested in, which is, in this case, the number of vehicles involved in the accident.
2.4.1. Text Representation and Preprocessing
Each accident description was extracted from its corresponding XML file report using the NMVCCS/Crash/CRASH/XML_CASESUMMARY/SUMMARY tag. For the GLM, we generated a sparse vector representation of each accident description using a TF-IDF weighted bag of n-grams, a bag-of-words (BOW) variant that takes sequences of n words as features. We used n-grams up to , meaning every single word and each consecutive pair of words were taken into account in the model. We used the TF-IDF vectorizer of Scikit-Learn to generate the vector representation of documents.
Vectorizing documents with the BOW representation is often used as baseline (see e.g.,
Wang and Manning (
2012)). However, this technique has been shown by authors such as
Tang et al. (
2015) and
Collobert et al. (
2011) to yield models that are outperformed by models using dense representations of text in many NLP task.
The proposed model relies on dense word vector representations constructed by the GloVe algorithm (see
Pennington et al. (
2014)) with the
OntoNotes corpus provided by
Hovy et al. (
2006). These vectors are available in the
SpaCy library built by
Honnibal and Montani (
2017) and are adequate to use considering the nature of the accident dataset vocabulary. As proposed by
Rao et al. (
2018), we used HAN to generate document representations from word vectors. We split each description into individual word tokens using
SpaCy’s sentencer and tokenizer functionality. We then convert words into vectors using
SpaCy’s vectorizer.
No additional preprocessing, like part-of-speech tagging or lemmatization, was done to the textual data.
2.4.2. Dataset Labeling
To identify a phenomenon in the data, one needs to have labels indicating to the model which examples are from which group. In the context of a Poisson regression task, response variables are integer values. In the original dataset, there were already 2 out of 3 variables that were already present. The last one, the number of injured people in the accident, was inferred using the KABCOU rating of each vehicle’s occupant.
2.4.3. Training Algorithm
A training algorithm allows the model to find the weights that optimize a loss function between the model’s prediction
and their associated target values
. For the GLM, this weight calibration is achieved using the limited-memory Broyden–Fletcher–Goldfarb–Shanno (LBFGS) algorithm (see
Fletcher (
2013)) to minimize the Poisson divergence in (
1). For HAN models, this calibration is achieved using gradient descent and backpropagation to minimize the Poisson loss
defined by
Minimizing the loss
in (
2) is equivalent to maximizing the log-likelihood of the Poisson distribution for the dataset
and to minimizing the Poisson divergence in (
1) as well.
2.4.4. Hierarchical Training Task
Conceptually speaking, both levels of the HAN hierarchy are trained for different tasks. The lower-level (sentence) network learns words related to vehicles and people count. The upper-level (document) network is taught to distinguish between useful and useless sentences in the report.
We train HAN models to fit three distinct Poisson regression models at once. The three Poisson regression models are respectively taught to predict the parameter of the Poisson distribution for the number of:
This training scheme represents a departure from the traditional feature engineering paradigm as we input word vectors to the lower-level network instead of analyst’s crafted features. Furthermore, using a three-tasks model forces the training algorithm to exploit generic words for three regressions. This technique is considered implicit regularization. It is important to note that one cannot train a GLM on three tasks simultaneously.
2.5. Model Parameters
This section presents the details of the model architecture and training parameters for both models.
2.5.1. GLM Pipeline
We selected the model parameters using a training and validation dataset. The parameters were selected so that the training dataset model would minimize the Poisson divergence in (
1) on the validation dataset. Selected parameters are presented in
Table 2. The first four parameters pertain to the text processor, and the last parameter is the factor applied for the regularization of the Poisson regressor. Note that the
n-gram values of 1 and 2 mean that both single words and consecutive word pairs are considered as regression features.
2.5.2. HAN Architecture
The architecture parameters were selected to have sufficient capacity while preventing over-fitting. This selection is made using a training and validation dataset.
Table 3 presents the parameters used for the HAN model. The hidden state sizes for sentences and documents represent the dimensions of the information carried over inputs, which are respectively the values for
and
defined in
Section 2.2. The choice of
l is a compromise between the quantity of saved information and over-fitting risks. The dropout rate is the proportion of zeroed inputs during training, which acts as a regulation. There are two important remarks on the parameters presented. First the input size of the word vectors corresponds to
SpaCy’s word embeddings length. Second, the dropout rate is applied to each input value (as opposed to being applied to the whole word embedding).
2.5.3. HAN Training Hyper-Parameters
We selected the training hyper-parameters by using a validation dataset. The selected parameters are presented in
Table 4. Note that the real batch size is not fixed. A batch is a subdivision of the training dataset, and the batch size represents the number of observations per batch. However, as the number of sentences per document is not fixed, the real batch size is the number of sentences in the batch (which is variable and unknown.) The number of epoch is the number of iterations through the whole dataset when training the network. The learning rate is the rate at which the gradient modifies the weights of the parameters, and finally, the decrease on plateau parameters handles the trigger to reduce the learning rate. In this experiment, the learning rate is decreased by
whenever the target metric does not improve for at least three epochs.
3. Results
This section presents the results obtained for the different architectures and experimentation we conducted. First, we evaluate the performance of the regression tasks on the competing models. We then assess the interpretability of each model.
3.1. Performance Evaluation
The first criterion to explore is the performance of both models.
Table 5 presents the values for the GLM and HAN models in the context of a Poisson regression. The performance evaluation score corresponds to the Poisson divergence in (
1). For the GLM, we present the unique value obtained, and for the HAN model, we present the average value and the standard deviation calculated with seven different starting points (seeds). One must note that the Poisson divergence was estimated with the number of vehicles, even if HAN was trained to predict three values.
As one can see from these results, the HAN model statistically outperforms the GLM model more than 95% of the time. This conclusion is supported by a Student-t test using 7 values (giving a degree of freedom = 6), where the t statistic is 2.64. From this, we conclude that HAN manages to model textual documents more efficiently than its popular competitor from the actuarial field. This result is not surprising as we see two main reasons explaining why HAN is a superior model in this context.
First, the context of a word is limited by the
n-gram parameter. This parameter determines the number of adjacent words that can be joined together to form a single feature. Capturing long or disjoint word patterns would require levels of
n-gram much higher than those used in our experiments (
). Unfortunately, increasing
n produces a substantial number of useless and statistically insignificant features. Moreover, as it augments the dimensionality of the model, it significantly increases computing time and limits performance enhancements. Minimizing the value for
n and extracting by hand important patterns is the usual approach to circumvent the dimensionality problem. It, however, causes the problems mentioned in
Section 1. The recurrent nature of HAN solves this word context problem by maintaining an inner memory over longer sequences of words.
Second, using a BOW representation of documents results in sparse vectors that limit semantic weight-sharing among different words. In this setting, word representations based on one-hot encodings are perpendicular to each other. It implies that semantically similar terms like occupant and passenger do not share any information when a model is trained on examples containing these words. The main issue here is that a BOW document representation does not provide any lexical bridge between different words that might be semantically related. However, neural network models, such as HAN, overcome this problem by using word embeddings. A word embedding is a dense vector of numerical values that captures information about the context of a word. This representation forces similar words to share the same vector dimensions. Moreover, similar words tend to have similar vectors. Training a model with word embeddings increases its predictive power as similar word vectors will have a similar impact on the model’s predictions.
3.2. Interpretability Assessment
As mentioned in
Section 2.3, the second criterion to evaluate is the interpretability of the models using a visual analysis of the words used to infer the number of cars’ count variable
in an accident.
Table 6 and
Table 7 present on each line the car’s count variable
and the three most important features used to classify examples in that group. Furthermore, some sentences are presented in
Table 1 to help the reader understand the word usage context. One important note is that the HAN model did not correctly infer the number of cars when there were 6, hence the lack of words in row
of
Table 7.
Interpretability is complex to evaluate since there is no quantitative metric to determine which model is better. We discuss the words presented in
Table 6 and
Table 7, to ultimately prefer those associated to the HAN model.
The most common words present in both tables are V
x (
V1,
V2, ...). By analyzing the underlying text, we understand that those are the identifier given to vehicles within the description.
V1 refers to Vehicle 1,
V2 to Vehicle 2, etc. These words entirely fit in the concept of counting and enumerating vehicles, as defined in
Section 2.3.2.
The other words found in the GLM table do not seem to be linked to any form of counting:
the,
of,
was are useless words that should have been discounted significantly by the TF-IDF algorithm. At the opposite, we find words in the HAN table, such as
two and
three, which refer to the number of vehicles involved in an accident, like in the text passage
This two-vehicle crash depicted in
Table 1.
An important element regarding the usage of numeric word such as
two and
three in the models is the presence of ambiguous sentence segments such as
two occupants and
Vehicle two (see the 4th example of
Table 1). These segments may refer to the number of persons or the number of cars. In the GLM model, the analyst needs to explicitly model those bigrams (
n-grams with
) to distinguish them. However, the HAN model is capable of capturing the semantic difference of those text segments by design. To support this statement, one can see that HAN did not consider the word
two, used in the context of
two lanes, provided in the 5th sentence of
Table 1. This results is satisfactory since, in this example, the word
two did not refer to the inferred count variable.
Another noteworthy element from
Table 7 is the presence of words such as
passengers and
transported. One can easily hypothesize that those words are assigned high attention weights due to their importance in the other simultaneous regression tasks predicting “how many people” and “how many injured” were involved in the accidents.
4. Conclusions
This paper presented an approach to improve the usual actuarial workflow by using a state-of-the-art hierarchical attention recurrent network architecture to exploit the content of textual documents. Our results indicate that this model provides better performance, is more robust to concept drifts and is also more interpretable.
The proposed approach is also orthogonal to textual data mining techniques used by actuaries and data scientists. The method presented allowed us to predict the distribution of a counting variable more accurately and to extract risk predictors with reduced feature engineering efforts. These two enhancements make our data-driven method highly scalable while retaining the highly interpretable nature of feature-based models.
The approach described in this paper can be extended to any other response variable present in the NHTSA dataset used for our experiments. For instance, one could label the presence of drugs and alcohol in the accident description. Given enough examples, the model would learn by itself to differentiate between accidents that were caused by an intoxicant or not. In other words, with the proposed model and enough data, one would not limit the power of the algorithm by solely using features believed to be important by the experts. This technique would contrast with the approach adopted by
Zappa et al. (
2019) in their experiment.
Extensions could be envisaged for other actuarial problems where the exploitation of hierarchical textual data is problematic. For example, one could be interested in extreme claims. Using claim notes, one could extract the features prioritized by the algorithm to model the phenomenon. Downstream exploration such as claim causation shift or extreme claim early detection can be done at ease, without being forced to perform feature engineer on an enormous dataset.
As neural networks can handle multiple tasks, an interesting addition to the model would be to simultaneously determine the topic or sentiment of a specific note. During training, backpropagation would intertwine together information from the different tasks into the intermediate representations. One could also be interested in enhancing claim detection by adding the raw payments data to the model. Once again, a neural network can easily be engineered to combine multimodal data without requiring expert interventions. As long as some attention mechanism exposes the internal decisions of the model, the analyst can extract valuable knowledge from the model.
Ultimately, using the proposed model relieves the analyst from the extensive work to model every phenomenon present in the data. This allows an analyst to leverage his strength, namely the analysis, instead of spending valuable time on data engineering and representation. More importantly, this model frees the analyst from expertise biases and helps him discover a phenomenon that he might not have considered in the first place. These are two valuable assets in a data mining value chain that are lacking in current practices and which could benefit from the ideas brought up in this paper.
Author Contributions
Conceptualization, J.-T.B., L.L. and E.M.; Formal analysis, J.-T.B.; Funding acquisition, E.M.; Methodology, J.-T.B., Luc Lamontagne and E.M.; Project administration, L.L.; Resources, J.-T.B.; Software, J.-T.B.; Supervision, L.L. and E.M.; Validation, L.L. and E.M.; Visualization, J.-T.B.; Writing—original draft, J.-T.B.; Writin—review & editing, J.-T.B., L.L. and E.M. All authors have read and agreed to the published version of the manuscript.
Funding
This research was funded by the Society of Actuaries’ James C. Hickman doctoral scholarship and by the Chaire en actuariat de l’Université Laval (Baillargeon and Marceau: FO502320).
Institutional Review Board Statement
Not applicable
Informed Consent Statement
Not applicable
Data Availability Statement
Conflicts of Interest
The authors declare no conflict of interest.
Abbreviations
The following abbreviations are used in this manuscript:
| HAN | Hierarchical Attention Network |
| GLM | Generalized Linear Models |
| NLP | Natural language processing |
| LSTM | Long Short Term Memory |
| GRU | Gated Recurrent Unit |
| NHTSA | National Motor Vehicle Crash Causation Study |
| BOW | Bag-of-words |
| TF-IDF | Term Frequency Inverse Document Frequency |
References
- Bahdanau, Dzmitry, Kyunghyun Cho, and Yoshua Bengio. 2015. Neural machine translation by jointly learning to align and translate. Paper presented at the 3rd International Conference on Learning Representations, (ICLR 2015), San Diego, CA, USA, May 7–9. [Google Scholar]
- Baker, Henrietta, Matthew Hallowell, and Antoine Jean-Pierre Tixier. 2019. Automatically learning construction injury precursors from text. arXiv, arXiv:1907.11769. [Google Scholar]
- Blier-Wong, Christopher, Hélène Cossette, Luc Lamontagne, and Etienne Marceau. 2020. Machine Learning in P&C Insurance: A Review for Pricing and Reserving. Risks 9: 4. [Google Scholar]
- Borba, Philippe. 2013. Predictive Analytics, Text Mining, and Drug-Impaired Driving in Automobile Accidents. Available online: http://us.milliman.com/ (accessed on 1 June 2019).
- Choi, Edward, Mohammad Taha Bahadori, Jimeng Sun, Joshua Kulas, Andy Schuetz, and Walter Stewart. 2016. Retain: An interpretable predictive model for healthcare using reverse time attention mechanism. Paper presented at the 29th conference on Advances in Neural Information Processing Systems (NIPS), Barcelona, Spain, December 5–10; pp. 3504–12. [Google Scholar]
- Collobert, Ronan, Jason Weston, Léon Bottou, Michael Karlen, Koray Kavukcuoglu, and Pavel Kuksa. 2011. Natural language processing (almost) from scratch. Journal of Machine Learning Research 12: 2493–537. [Google Scholar]
- Fletcher, Roger. 2013. Practical Methods of Optimization. Hoboken: John Wiley & Sons. [Google Scholar]
- Francis, Louise. 2006. Taming text: An introduction to text mining. Paper presented at the 2006 Ratemaking Seminar of the Casualty Actuarial Society Forum, Salt Lake City, UT, USA, March 13–14; pp. 51–88. [Google Scholar]
- Hochreiter, Sepp, and Jürgen Schmidhuber. 1997. Long short-term memory. Neural Computation 9: 1735–80. [Google Scholar] [CrossRef] [PubMed]
- Honnibal, Matthew, and Ines Montani. 2017. spaCy 2: Natural language understanding with Bloom embeddings, convolutional neural networks and incremental parsing. To appear. [Google Scholar]
- Hovy, Eduard, Mitch Marcus, Martha Palmer, Lance Ramshaw, and Ralph Weischedel. 2006. Ontonotes: The 90% solution. Paper presented at the 15th Conference on Human Language Technology Conference of the NAACL, Companion Volume: Short Papers, San Diego, CA, USA, June 12–17; pp. 57–60. [Google Scholar]
- Jain, Sarthak, and Byron Wallace. 2019. Attention is not explanation. arXiv, arXiv:1902.10186. [Google Scholar]
- Kuhn, Max, and Kjell Johnson. 2019. Feature Engineering and Selection: A Practical Approach for Predictive Models. Boca Raton: CRC Press. [Google Scholar]
- Mikolov, Tomas, Ilya Sutskever, Kai Chen, Greg Corrado, and Jeff Dean. 2013. Distributed representations of words and phrases and their compositionality. Paper presented at the 26th Conference on Advances in Neural Information Processing Systems (NIPS), Lake Tahoe, CA, USA, December 5–10; pp. 3111–19. [Google Scholar]
- National Highway Traffic Safety Administration. 2006. National Motor Vehicle Crash Causation Study. Available online: https://crashviewer.nhtsa.dot.gov/LegacyNMVCCS/Search (accessed on 1 June 2019).
- Parodi, Pietro. 2014. Pricing in General Insurance. Boca Raton: CRC Press. [Google Scholar]
- Pennington, Jeffrey, Richard Socher, and Christopher Manning. 2014. Glove: Global vectors for word representation. Paper presented at the 2014 Conference on Empirical Methods in Natural Language Processing (EMNLP), Doha, Qatar, October 25–29; pp. 1532–43. [Google Scholar]
- Qin, Yao, Dongjin Song, Haifeng Cheng, Wei Cheng, Guofei Jiang, and Garrison Cottrell. 2017. A dual-stage attention-based recurrent neural network for time series prediction. Paper presented at the 26th International Joint Conference on Artificial Intelligence (IJCAI), Melbourne, Australia, August 19–25; pp. 2627–33. [Google Scholar]
- Rao, Guozheng, Weihang Huang, Zhiyong Feng, and Qiong Cong. 2018. Lstm with sentence representations for document-level sentiment classification. Neurocomputing 308: 49–57. [Google Scholar] [CrossRef]
- Remy, Jean-Baptiste, Antoine Jean-Pierre Tixier, and Michalis Vazirgiannis. 2019. Bidirectional context-aware hierarchical attention network for document understanding. arXiv, arXiv:1908.06006. [Google Scholar]
- Salton, Gerard, and Chris Buckley. 1987. Term Weighting Approaches in Automatic Text Retrieval. Information Processing & Management 24: 513–23. [Google Scholar]
- Serrano, Sofia, and Noah Smith. 2019. Is attention interpretable? Paper presented at the 57th Annual Meeting of the Association for Computational Linguistics, Florence, Italy, July 28–August 2; pp. 2391–51. [Google Scholar]
- Sha, Ying, and May Wang. 2017. Interpretable predictions of clinical outcomes with an attention-based recurrent neural network. Paper presented at the 8th ACM International Conference on Bioinformatics, Computational Biology, and Health Informatics, Boston, MA, USA, August 20–23; pp. 233–240. [Google Scholar]
- Tang, Duyu, Bing Qin, and Ting Liu. 2015. Document modeling with gated recurrent neural network for sentiment classification. Paper presented at the 2015 Conference on Empirical Methods In Natural Language Processing, Lisbon, Portugal, September 17–21; pp. 1422–32. [Google Scholar]
- Tixier, Antoine Jean-Pierre, Matthew Hallowell, Balaji Rajagopalan, and Dean Bowman. 2016. Automated content analysis for construction safety: A natural language processing system to extract precursors and outcomes from unstructured injury reports. Automation in Construction 62: 45–56. [Google Scholar] [CrossRef]
- Wang, Jingjing, Jie Li, Shoushan Li, Yangyang Kang, Min Zhang, Luo Si, and Guodong Zhou. 2018. Aspect sentiment classification with both word-level and clause-level attention networks. Paper presented at the Twenty-Seventh International Joint Conference on Artificial Intelligence (IJCAI), Stockholm, Sweden, July 13–18, vol. 2018, pp. 4439–45. [Google Scholar]
- Wang, Sida, and Christopher Manning. 2012. Baselines and bigrams: Simple, good sentiment and topic classification. Paper presented at the 50th Annual Meeting of the Association for Computational Linguistics (Volume 2: Short Papers), Jeju Island, Korea, July 8–14; pp. 90–94. [Google Scholar]
- Wiegreffe, Sarah, and Yuval Pinter. 2019. Attention is not not explanation. Paper presented at the 2019 Conference on Empirical Methods in Natural Language Processing and the 9th International Joint Conference on Natural Language Processing (EMNLP-IJCNLP), Hong Kong, China, November 3–7; pp. 11–20. [Google Scholar]
- Yang, Zichao, Diyi Yang, Chris Dyer, Xiaodong He, Alex Smola, and Eduard Hovy. 2016. Hierarchical attention networks for document classification. Paper presented at the 2016 Conference of the North American Chapter of the Association for Computational Linguistics: Human Language Technologies, San Diego, CA, USA, June 12–17; pp. 1480–89. [Google Scholar]
- Yu, Xinyi, Wenge Rong, Zhuo Zhang, Yuanxin Ouyang, and Zhang Xiong. 2019. Multiple level hierarchical network-based clause selection for emotion cause extraction. IEEE Access 7: 9071–79. [Google Scholar] [CrossRef]
- Zappa, Diego, Mattia Borrelli, Gian Paolo Clemente, and Nino Savelli. 2019. Text mining in insurance: From unstructured data to meaning. Variance. In press. Available online: https://www.variancejournal.org/articlespress/ (accessed on 1 June 2019).
| Publisher’s Note: MDPI stays neutral with regard to jurisdictional claims in published maps and institutional affiliations. |
© 2020 by the authors. Licensee MDPI, Basel, Switzerland. This article is an open access article distributed under the terms and conditions of the Creative Commons Attribution (CC BY) license (http://creativecommons.org/licenses/by/4.0/).


