Article

Credit Valuation Adjustment Compression by Genetic Optimization

LaMME, Univ Evry, CNRS, Université Paris-Saclay, CEDEX, 91037 Évry, France
*
Author to whom correspondence should be addressed.
Risks 2019, 7(4), 100; https://doi.org/10.3390/risks7040100
Submission received: 4 August 2019 / Revised: 21 September 2019 / Accepted: 23 September 2019 / Published: 29 September 2019
(This article belongs to the Special Issue Advances in Credit Risk Modeling and Management)

Abstract

:
Since the 2008–2009 financial crisis, banks have introduced a family of X-valuation adjustments (XVAs) to quantify the cost of counterparty risk and of its capital and funding implications. XVAs represent a switch of paradigm in derivative management, from hedging to balance sheet optimization. They reflect market inefficiencies that should be compressed as much as possible. In this work, we present a genetic algorithm applied to the compression of credit valuation adjustment (CVA), the expected cost of client defaults to a bank. The design of the algorithm is fine-tuned to the hybrid structure, both discrete and continuous parameter, of the corresponding high-dimensional and nonconvex optimization problem. To make intensive trade incremental XVA computations practical in real-time as required for XVA compression purposes, we propose an approach that circumvents portfolio revaluation at the cost of disk memory, storing the portfolio exposure of the night so that the exposure of the portfolio augmented by a new deal can be obtained at the cost of computing the exposure of the new deal only. This is illustrated by a CVA compression case study on real swap portfolios.
MSC:
91B30; 91G20; 91G40; 91G60
JEL Classifications:
D52; D53; G01; G13; G24

1. Introduction

XVAs, where VA stands for valuation adjustment and X is a catch-all letter to be replaced by C for credit, F for funding, M for margin, or K for capital, have been implemented by banks in reaction to the regulatory changes aroused by 2008 financial turmoils. They monetize counterparty risk and its funding and capital consequences by add-ons to derivative entry prices sourced from clients. According to the cost-of-capital XVA approach of Albanese and Crépey (2019), accounting for the impossibility for a bank to replicate the jump-to-default related cash flows, the final, all-inclusive XVA formula reads
CVA + FVA + MVA + KVA ,
to be sourced by the bank from clients on an incremental run-off basis at every new deal.
As stated by the Basel Committee on Banking Supervision (2015), major counterparty credit losses on OTC (Over-the-counter) derivative portfolios in 2008 arose from XVA accounting losses rather than from actual client defaults. In particular, a bank incurs a CVA loss when the market perceives a deterioration of the credit risk of a client. This has motivated the creation of XVA desks for dealing with these risks.
In this paper, we deal with CVA compression, i.e., the minimization of the CVA of a client portfolio by the introduction of an incremental trade, subject to the constraint of not altering too much the market risk of the portfolio. In the financial derivative industry, the term compression term is generally applied in the context of “trade compression”, i.e., the reduction of the gross notional of positions in the market. Trade compression aims notably at reducing certain capital requirements, the number of transactions, and their amount (see Section 5.3 of (Gregory 2015)). As reflected by the proliferation of related industry presentations1, this kind of balance sheet optimization is very active in top tier banks at the moment.
XVAs reflect market inefficiencies that should be compressed as much as possible. Here, we focus on CVA compression for concreteness and simplicity, but the developed XVA compression methodology is generic. It could and should be applied to further XVA metrics, as soon as these are available with sufficient speed, for computation at the portfolio level, and accuracy, for numerical significance of the results at the incremental trade level (see Section 5 in (Albanese et al. 2018), which emphasizes the XVA compression perspective on the pricing and risk management of financial derivatives in the post-2008–2009 global financial crisis era, and cf. (Kondratyev and Giorgidze 2017), which uses a genetic algorithm for determining an optimal trade-off between MVA compression and transaction costs).
The complexity of XVA compression problems stems, in particular, from the hybrid nature of the state space of the corresponding optimization problems. Indeed, a new trade (financial derivative) is described by a combination of continuous and discrete parameters. This rules out the use of standard convex optimization schemes for such problems. Instead, we are lead to the use of metaheuristic algorithms. In this paper, we show how a genetic algorithm with penalization can efficiently find a CVA offsetting trade, while limiting the impact of the trade on the market exposure profile. The latter is necessary for staying in line with the separation of mandates between the XVA desks, in charge of managing counterparty risk, and the other, dubbed “clean”, trading desks of the bank, in charge of hedging the market risk of the bank positions.
The other XVA compression challenge is execution time, with intensive valuation of the involved XVA metrics as a bottleneck. The XVA metrics are primarily defined at the portfolio level: Time-0 XVAs can be formulated as expectations of nonlinear functionals of the bank derivative portfolio exposure, i.e., “clean” valuation (or “mark-to-market” (MtM) ignoring counterparty risk) of the bank portfolio, assessed at randomly sampled times and scenarios. Each new deal gives rise to XVA add-ons computed as the corresponding trade incremental XVA amounts, i.e., the differences between the XVAs of the portfolios including and excluding the new deal. To make intensive trade incremental XVA computations practical in real-time as required for XVA compression purposes, our proposed MtM store-and-reuse approach circumvents clean revaluation at the cost of disk memory, storing the portfolio exposure of the night so that the exposure of the portfolio augmented by a new deal can be obtained at the cost of computing the exposure of the new deal only.

Outline and Contributions

The paper is outlined as follows. Section 2 formulates the penalized CVA compression problem and introduces the related genetic optimization algorithm. Section 3 is about two key acceleration techniques in this regard. Section 4 presents a numerical case study on real swap portfolios. Section 5 concludes.
The main contributions of the paper are the design of a parallelized genetic algorithm for the CVA compression task, the MtM store-and-reuse acceleration technique for trade incremental XVA computations, and the numerical CVA compression case study on real swap portfolios.
More broadly, this paper enriches the literature on the use of genetic (also called evolutionary) optimization algorithms in finance. Cont and Hamida (2005) applied evolutionary algorithms to investigate a set of co-calibrated model parameterizations in order to assess the associated model risk. Kroha and Friedrich (2014) compared different genetic algorithms for automatic trading. Jin et al. (2019) applied evolutionary algorithms to optimal investment and consumption stochastic control problems. For wider reviews of genetic algorithms in finance, we refer the readers to (Chen 2012; Drake and Marks 2002).
We refer the reader to the end of the paper for a list of the main abbreviations.

2. CVA Compression Modeling

2.1. Credit Valuation Adjustment

We consider a complete stochastic basis ( Ω , F , P ) , for a reference market filtration (ignoring the default of the bank itself) F = ( F t ) t R + , satisfying the usual conditions, and a risk-neutral pricing measure P , calibrated to market quotes of fully collateralized transactions. All the processes of interest are F adapted and all the random times of interest are F stopping times. This holds at least after so-called reduction of all the data to F , starting from a larger filtration G including the default of the bank itself as a stopping time, assuming immersion from F into G for simplicity (see (Albanese and Crépey 2019) for details). The P expectation and ( F t , P ) conditional expectation are denoted by E and E t , respectively.
In developed markets, the overnight indexed swap (OIS) rate is together the reference remuneration rate for posted collateral and the best market proxy for a risk-free rate. We denote by r = ( r t ) t R + an F progressive OIS rate process and we write β = e 0 · r s d s for the corresponding risk-neutral discount factor.
By clean valuation or mark-to-market of a contract (or portfolio), we mean the (trade additive) risk-neutral conditional expectation of its OIS discounted future promised cash flows, ignoring counterparty risk and its capital and funding implications.
We consider a bank engaged in bilateral trading with a single corporate counterparty (client) with default time and recovery rate τ c and R c , respectively. This setup, which is chosen for simplicity, is consistent with a common situation where credit risk budget is assigned at each counterparty level within the bank. We denote by MtM the corresponding mark-to-market process of the client portfolio to the bank.
The (time 0) CVA of the bank is its expected discounted loss in case of client default, i.e.,
CVA = E 𝟙 { τ c T } β t 1 β τ c ( 1 R c ) MtM τ c + .
Assuming deterministic interest rates, this can be rewritten as
CVA = ( 1 R c ) 0 T β t EPE ( t ) P ( τ c d t ) ,
where the expected positive exposure (EPE) is defined as
EPE ( t ) = E ( MtM s + | s = τ c ) | τ c = t .
Equation (3) is popular with practitioners because it allows obtaining the CVA as the integral of the EPE against the client CDS (Credit default swap) curve. However, it is only really practical in simplistic models where the market and credit sides of the problem are independent, so that EPE ( t ) = E ( MtM t + ) . However, a key CVA modeling issue is wrong-way risk, i.e., the risk of adverse dependence between market and credit (see (Brigo and Vrins 2018; Crépey and Song 2016, 2017; Glasserman and Yang 2018; Hull and White 2012; Iben Taarit 2018; Li and Mercurio 2015; Pykhtin 2012)).
Assuming the client default time endowed with an intensity γ c , a more flexible formula is
CVA = ( 1 R c ) E 0 T β s e 0 s γ u c d u γ s c MtM s + d s .
Under a credit support agreement (CSA), MtM should be replaced by ( MtM C ) in all equations above, where C is the collateral posted by the counterparty. Obviously, collateral can mitigate the EPE and the CVA considerably. In the data of our case study there is no CSA, i.e., C = 0 .
Non-linearity of MtM + with respect to the portfolio payoff components imposes CVA calculations at the counterparty portfolio (netting set) level.
Similar approaches apply to FVA computations, with analogous comments, whereas the MVA can be computed based on quantile regression for the embedded dynamic initial margin calculations (see (Crépey et al. 2019)). In any case, the numerical bottleneck of XVA computations lies in intensive MtM calculations.

2.2. Fitness Criterion

By the augmented and initial portfolios, respectively, we mean the portfolio of the bank inclusive and exclusive of a newly considered deal with the client. The aim of an XVA compression problem is to find a new trade that minimizes the corresponding XVA metric of the augmented portfolio. This is equivalent to minimize the incremental CVA, which we denote by
Δ CVA = ( 1 R c ) E 0 T β s e 0 s γ u c d u γ s c ( MtM s a u g m ) + d s ( 1 R c ) E 0 T β s e 0 s γ u c d u γ s c ( MtM s i n i t ) + d s = ( 1 R c ) E 0 T β s e 0 s γ u c d u γ s c ( ( MtM s a u g m ) + ( MtM s i n i t ) + ) d s ,
where the indices init and augm refer to the initial portfolio and augmented portfolio, respectively. We emphasize that trade incremental CVA computations require two portfolio-wide calculations: one without the new trade and another one including it.
Minimizing an XVA metric is most easily obtained through a significant deformation of the portfolio exposure process (especially in the context of this work of a portfolio with a single counterparty). However, an XVA compression procedure should not affect too much the market risk of the portfolio, because market risk is the mandate of the clean desks of the bank, who, in particular, are subject to trading limits.
This motivates the addition of a penalization to the incremental XVA criterion. In our case study, the incremental deal will consist of an interest rate swap. As such product is mostly sensitive to interest rate moves, a natural penalization is then in terms of its DV01 (dollar value of an 01), i.e., the variation of its mark-to-market (at time 0) under a parallel shift of the yield curve by one basis point (= 10 4 ).
More precisely, an interest rate swap exchanges one leg indexed on a floating interest rate against one leg paying a fixed interest rate, called swap rate. The swap is said to be payer (respectively, receiver) for the party that pays (respectively, receives) the floating payments. A monocurrency swap exchanges both legs in the same currency. It is mainly sensitive to the fluctuations of the corresponding floating interest rate term structure. DV01 measures the associated risk as the difference between the prices of the swap under the baseline (actual market data observed in the real market) and for a bumped yield curve defined as the concatenation of the money market rates, forward rates, and swap rates, on the relevant (successive) time segments. Bumping the yield curve typically means adding 10 4 to each tenor of this curve and updating the other reference curves (zero coupon rates, forward rates, etc.) accordingly.
Focusing on the CVA metric in this paper, we obtain the following fitness minimization problem:
minimize x A f ( x ) = Δ CVA ( x ) + α | DV 01 ( x ) | ,
where x parameterizes a new deal (swap) to be found in a suitable search space A (see Section 4.1), Δ CVA ( x ) is its incremental CVA (cf. Equation (6)), DV 01 ( x ) is its DV01, and α is a penalization parameter controlling the trade-off between CVA reduction and market risk profile preservation. By solving Equation (7), we aim at identifying a new deal which, if added to the current client portfolio of the bank, would diminish its counterparty risk without impacting too much its market risk. Note that, for scaling reasons (with, in particular, market penalization), we address the XVA compression problem in terms of trade incremental (as opposed to augmented portfolio) XVA numbers.
A new deal is determined by a combination of quantitative (e.g., notional, maturity, etc.) and qualitative (e.g., currency, long or short direction, etc.) parameters, so that no gradient or Hessian is available for the fitness function f in Equation (7). Moreover, one is interested in exploring a variety of local minima of f, to see different trading opportunities emerge from the optimization procedure. Furthermore, we can guess that some (crucial) parameters need be learned first, such as currency or maturity; other parameters, such as notional, can be refined in a second stage. All these features lead us to addressing Equation (7) by means of a genetic optimization algorithm.

2.3. Genetic Optimization Algorithm

Genetic optimization algorithms belong to the class of derivative-free optimizers, which is surveyed and benchmarked numerically in (Rios and Sahinidis 2013) (including the CMA-ES and DAKOTA/EA genetic algorithms).
The idea of genetic (or evolutionary) optimization algorithms is to evolve a population of individuals through cycles of modification (mutation) and selection in order to improve the performance of its individuals, as measured by a given fitness function. In addition, so-called crossover is used to enhance the search in parameter space. To the best of our knowledge, evolutionary algorithms were first explicitly introduced in (Turing 1950, chp. 7 Learning Machines, p. 456). See the classical monographs by the authors of (Back 1996; Goldberg 1989; Holland 1975). They then experienced the general artificial intelligence disgrace and comeback before and after the 2000s. However, they always stayed an active field of research, seen from different perspectives, such as particle filtering, MCMC, or sequential monte carlo methods (see (Del Moral 2004)). Beyond its financial applications reviewed at the end of Section 1, genetic optimization has been used in many different fields, such as mechanics (Verma and Lakshminiarayanan 2006), calibration of neural networks hyperparameters (Young et al. 2015), or operational research (Larranaga et al. 1999).
Genetic optimization offers no theoretically guaranteed rate of convergence, but it is often found the most efficient approach in practice for dealing with hybrid (partly continuous, partly discrete/combinatorial, hence without well defined gradient and Hessian), nonconvex (in the sense of one local minimum, at least, for each set of values of the discrete parameters), and high-dimensional optimization problems such as Equation (7).
At each iteration, the fitness f ( x ) is computed for each individual (also named chromosome) x of an initial population (a set of chromosomes). The values returned by the objective function are used for selecting chromosomes from the population. Among numerous selection methods (see (Blickle and Thiele 1995)), we can quote fitness proportionate selection, ranking proportionate selection (in order to avoid the overrepresentation of the chromosomes with the highest fitness values), and tournament selection (selection of the best among randomly drawn chromosomes). The common intention of these selection methods is to sample in priority individuals with the best fitness values. A genetic algorithm is dubbed elitist if the selection operator always keeps the chromosome with the best fitness value. Otherwise (as in our case), there is no guarantee that the best visited chromosome is contained in the population corresponding to the final iteration.
The mutation stage is intended to maintain some diversity inside the population, in order to avoid the algorithm being trapped by local minima. A mutation randomly changes one gene, i.e., one component (e.g., in our case, the notional of a new swap) of a chromosome.
Selection and mutation play opposite roles: a focus on fitness leads to a quicker convergence toward a local minimum; conversely, a too heavily mutated population results in a slow random research.
In addition, a crossover operator plays the role of a reproduction inside the algorithm. The principle of crossover is to build two children chromosomes from parent chromosomes. A distribution (often the same as the one used for selection) is chosen for picking chromosomes from a population of the previous iteration and for recombining pairs of selected chromosomes. Children share gene values of their parents but a gene value from one parent cannot be inherited by both children. A crossover mask decides for each gene in which parent a child can copy the gene version. One of the most popular crossover masks is single point crossover (see Appendix A).
The role of the crossover operator is paradoxical, as crossover can be seen as a combination of mutations, which increase the genetic diversity, while crossover also promotes chromosomes with higher fitnesses. Crossover aims at benefiting of a presupposed proximity of best solutions.
The above operators are applied iteratively until a suitable stopping condition is satisfied. The most basic one is a fixed number of iteration, but customized criteria may also be used to limit further the number of iterations. For instance, the algorithm can be interrupted when the minimum (or sometimes even the maximum) fitness value within the population at the beginning of an iteration is below a predefined threshold.
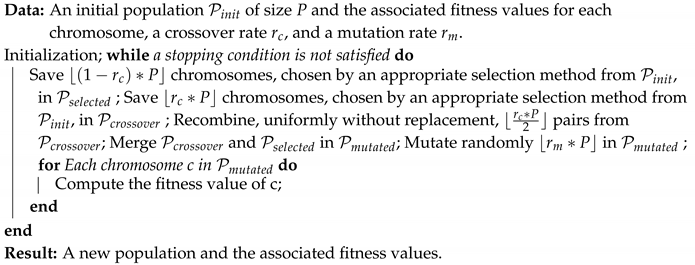
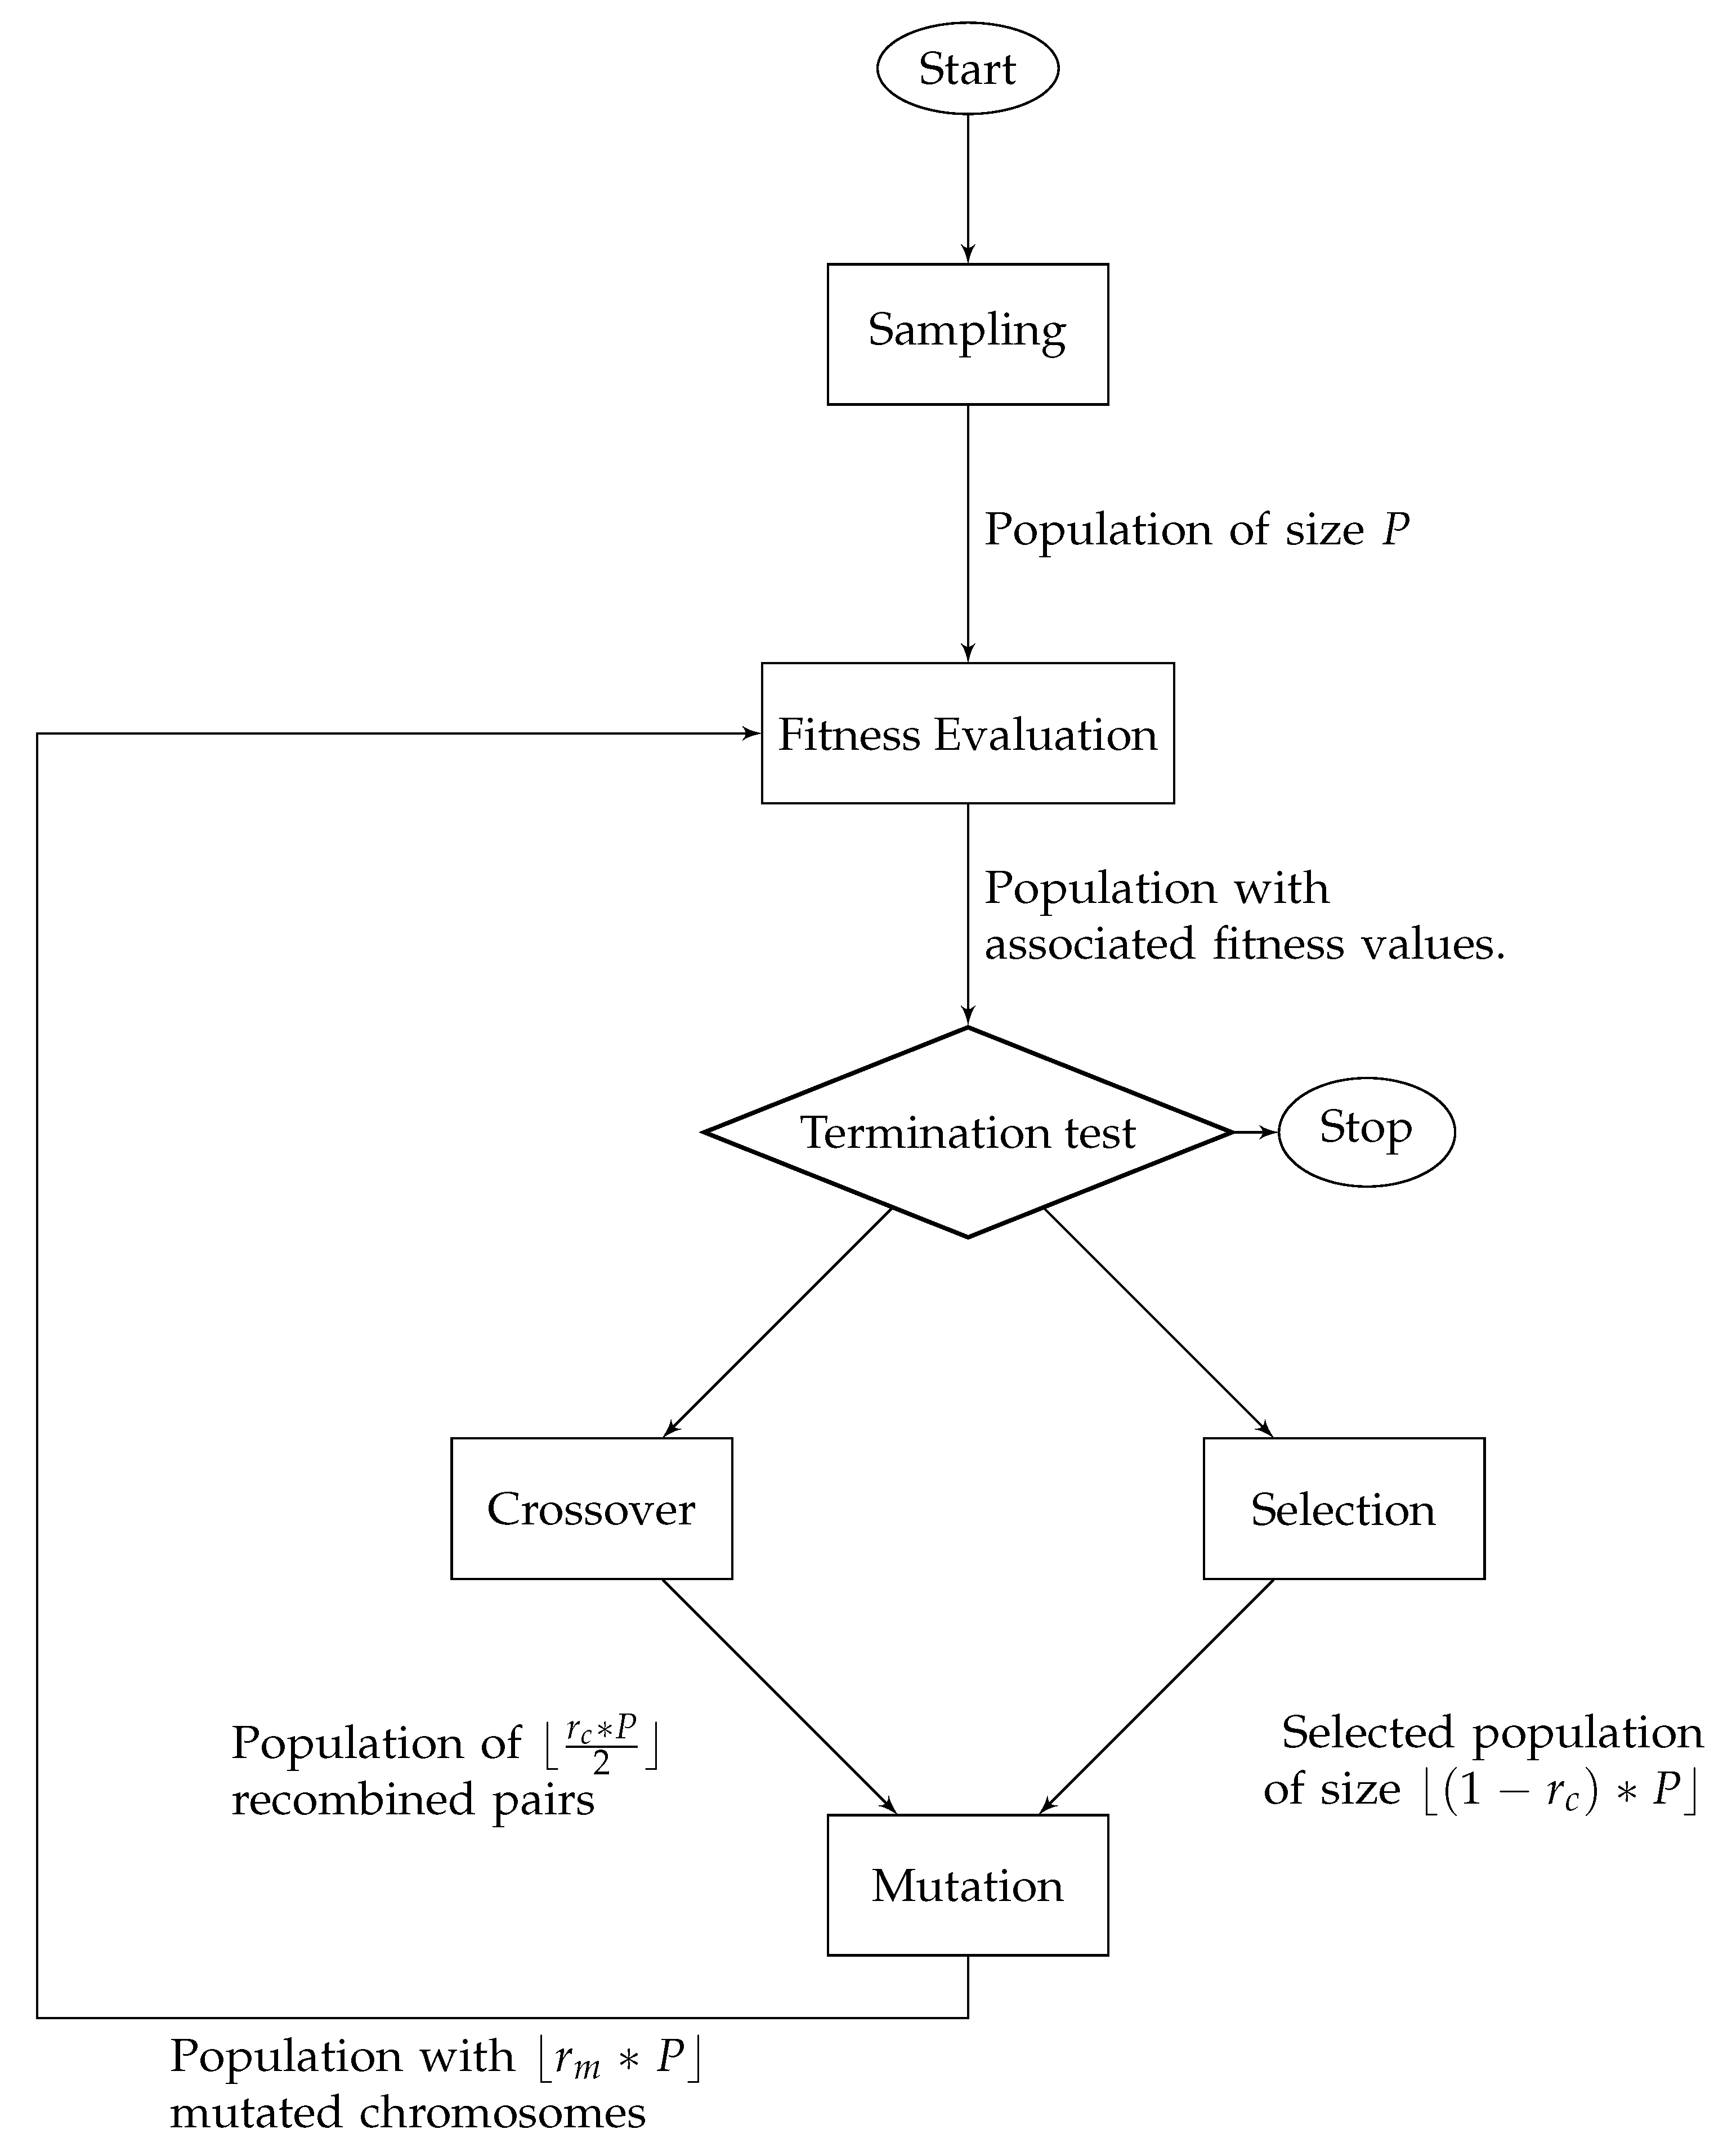
See Algorithm 1 and Figure 1 for the algorithm in pseudo-code and skeleton forms, denoting by r m the mutation rate, i.e., the percentage of individuals in a population affected by a mutation, and by r c the crossover rate, i.e., the percentage of individuals affected by crossover recombination.
The behavior of a genetic optimization algorithm is essentially determined by the choice of the selection operator, the number of solutions affected by a mutation, and the number of chromosomes affected by a crossover. See the work of Tabassum and Kuruvilla (2014) for a user guide to the main genetic algorithm ingredients and Carvalho et al. (2011) for applications of genetic optimization algorithms to benchmark functions.
Algorithm 1: Pseudo-code of an optimization genetic algorithm
Risks 07 00100 i001

3. Acceleration Techniques

Without suitable acceleration techniques, the above CVA compression approach is not workable in real time on realistic banking portfolios: in the examples of Section 4, a naive (desktop) implementation requires about 20 h of computations. This becomes even more problematic for hyperparameters tuning (such as α , crossover rate r c , etc.). Hyperparameters are generally chosen with grid search, random search (see (Bergstra et al. 2011)), Bayesian optimization (see (Snoek et al. 2012)) or even evolutionary algorithms again (see (Young et al. 2015)). In any case, their calibration is greedy in terms of overall genetic algorithm execution.
In this section, we deal with the two following acceleration techniques, which may be used simultaneously:
  • a MtM store-and-reuse approach for trade incremental XVA computations, speeding up the unitary evaluation of the fitness function; and
  • a parallelization of the genetic algorithm accelerating the fitness evaluation at the level of the population.

3.1. MtM Store-and-Reuse Approach for Trade Incremental XVA Computations

Most of the time in portfolio-wide XVA calculations is spent in clean valuation (i.e., mark-to-market MtM) computations: by comparison, simulation of the risk factors or of the collateral is typically negligible.
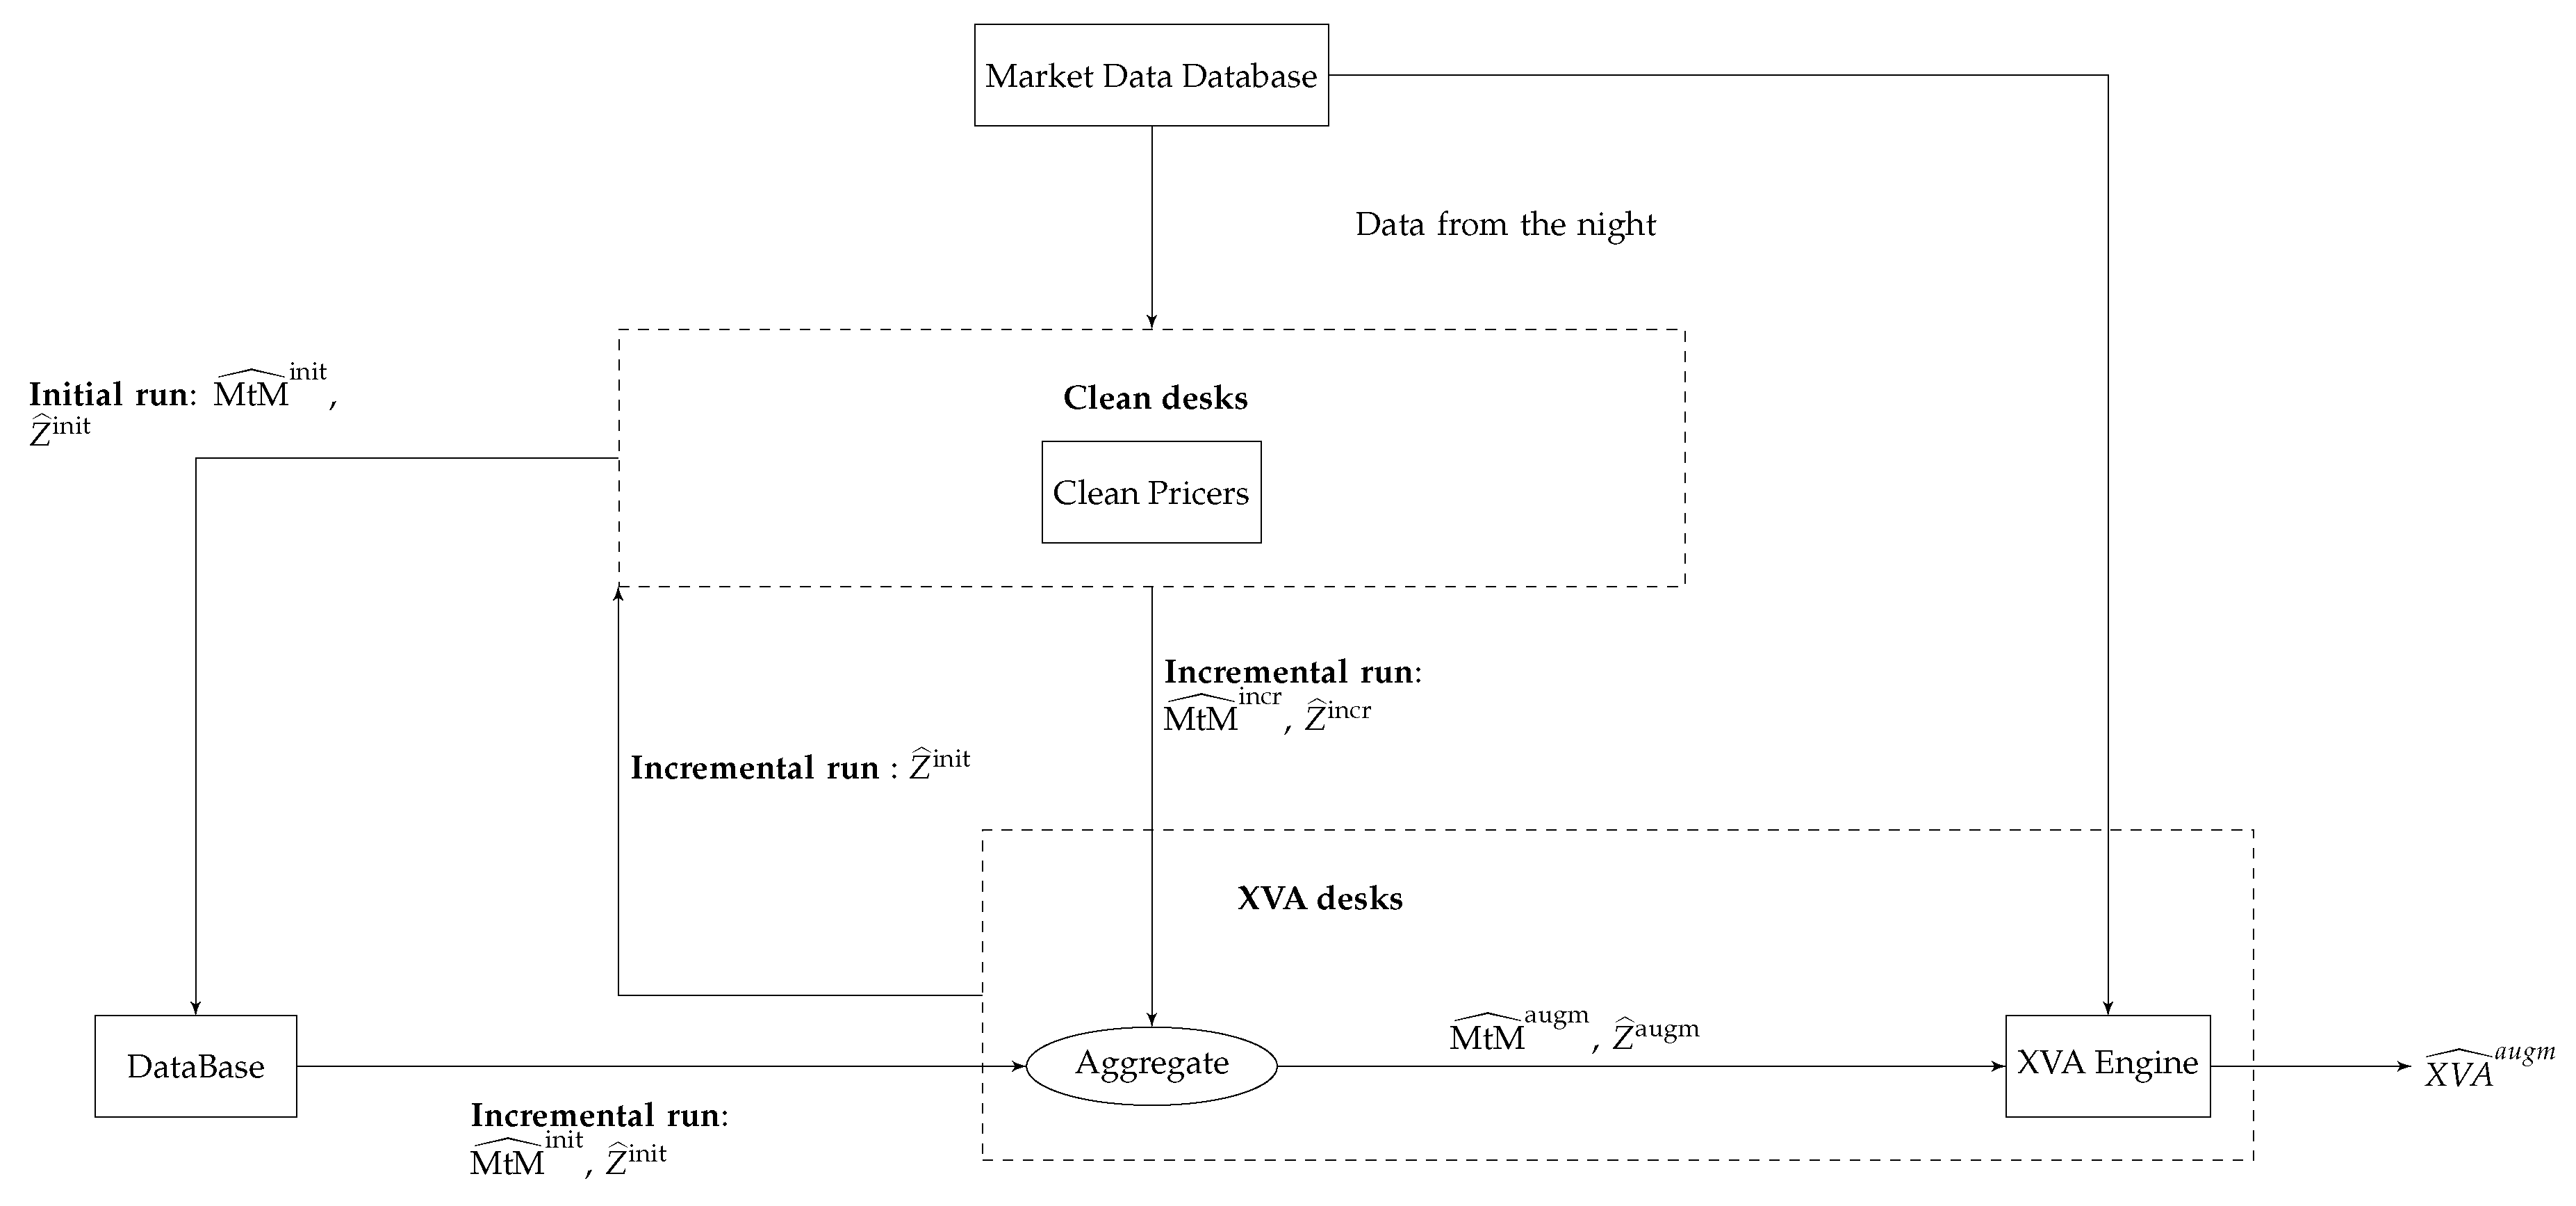
Our case study is based on the CVA metric. As observed after Equation (6), by lack of trade-additivity of the (portfolio-wide) CVA, trade incremental XVA computations require two portfolio-wide calculations: one without the new trade and another one including it. However, it is possible to store the (including MtM) paths simulated for the initial portfolio and reuse them each time we want to compute a new trade incremental XVA. Then, each trade incremental XVA computation only requires the forward simulation of the mark-to-market process of the new deal.
The corresponding MtM store-and-reuse approach to trade incremental XVA computations circumvents repeated valuations at the cost of disk memory. It exploits the trade additivity of clean valuation by recording the MtM paths of the initial portfolio on a disk. For every new deal, the augmented portfolio exposure is obtained by adding, along the paths of the risk factors, the mark-to-market of the initial portfolio and of the new deal. This augmented portfolio exposure is then plugged into the XVA engine.
An optimally implemented MtM store-and-reuse approach brings down trade incremental XVA computations to the time of generating the clean price process of the trade itself, instead of the one of the augmented portfolio as a whole. Another advantage of this approach is its compliance with desk segregation: As far as clean valuation is concerned, the XVA desks just use the pricers of the clean desks. Hence, the MtM process plugged into the XVA computations is consistent with the one used for producing the market risk hedging sensitivities.
However, such an approach comes at the costs of memory disk (obviously), but also data slippage as, for consistency, it requires anchoring all the trade incremental XVA computations at the market data and parameters corresponding to the generation of the initial portfolio exposure. In practice, an MtM process at the overall portfolio level can only be generated during night runs, between two market sessions.
Moreover, we have to distinguish between first-order (or first-generation) XVAs, which are options on the MtM process, and higher-order (or second-generation) XVAs (see (Crépey et al. 2019)), which can be viewed as compound options of order two or more on the MtM process. Second-generation XVAs may also involve conditional risk measures, e.g., conditional value-at-risk for the dynamic initial margin calculations that are required for MVA2 computations, as opposed to conditional expectations only in the case of first generation XVAs.
A Monte Carlo simulation diffuses risk factors X (such as interest rates, credit spreads, etc.) along drivers Z (such as Brownian motions, Poisson processes, etc.), according to a model formulated as a Markovian system of stochastic differential equations, starting from some given initial condition X 0 for all risk factors, suitably discretized in time and space. Modulo calibration, X 0 can be identified with the time 0 market data. We denote by Y ^ a suitable estimate of a process Y at all (outer) nodes of a Monte Carlo XVA engine. In particular, MtM ^ is the fully discrete counterpart of the MtM process of the initial portfolio, namely the clean value of the portfolio at future exposure dates in a time grid and for different scenario paths.
At first sight, an MtM store-and-reuse approach is unsuitable for second-order XVAs, such as the MVA and the KVA (but also the CVA in the case of a CSA where the bank receives so-called initial margin), Indeed, in their case, the principle of swapping computations against storage would require to store not one portfolio exposure MtM ^ , but a whole family of resimulated, future conditional portfolio exposures, (at least, over a certain time horizon), which seems hardly feasible in practice. However, even in the case of second-order XVA metrics, an MtM store and reuse approach can be implemented with the help of appropriate regression techniques (at the cost of an additional regression error; see (Crépey et al. 2019)).
Formalizing the above discussion, the conditions for a straightforward and satisfactory application of the MtM store-and-reuse approach to a given XVA metric are as follows, referring by indices init, incr, and augm to the initial portfolio, the new deal, and the augmented portfolio:
  • (No nested resimulation of the portfolio exposure required) The formula for the corresponding (portfolio-wide, time-0) XVA metric should be estimatable without nested resimulation, only based on the portfolio exposure rooted at ( 0 , X 0 ) . A priori, additional simulation level makes impractical the MtM store-and-reuse idea of swapping execution time against storage.
  • (Common random numbers) MtM ^ i n c r should be based on the same paths of the drivers as MtM ^ i n i t . Otherwise, numerical noise (or variance) would arise during MtM ^ aggregation.
  • (Lagged market data) MtM ^ i n c r should be based on the same time, say 0, and initial condition X 0 (including, modulo calibration, market data), as MtM ^ i n i t . This condition ensures a consistent aggregation of MtM ^ i n i t and MtM ^ i n c r into MtM ^ a u g m .
These conditions have the following implications:
  • The first seems to ban second-order generation XVAs, such as CVA in presence of initial margin, but these can in fact be included with the help of appropriate regression techniques.
  • The second implies storing the driver paths that were simulated for the purpose of obtaining MtM ^ i n i t ; it also puts a bound on the accuracy of the estimation of MtM i n c r , since the number of Monte Carlo paths is imposed by the initial run. Furthermore, the XVA desks may want to account for some wrong way risk dependency between the portfolio exposure and counterparty credit risk (see Section 2.1); approaches based on correlating the default intensity and the market exposure in Equation (5) are readily doable in the present framework, provided the trajectories of the drivers and/or risk factors are shared between the clean and XVA desks.
  • The third induces a lag between the market data (of the preceding night) that are used in the computation of MtM ^ i n c r and the exact MtM i n c r process; when the lag on market data becomes unacceptably high (because of time flow and/or volatility on the market), a full reevaluation of the portfolio exposure is required.
Figure 2 depicts the embedding of an MtM store-and-reuse approach into the trade incremental XVA engine of a bank.

3.2. Parallelization of the Genetic Algorithm

Most of the XVA compression computational time is spent in the evaluation of the incremental XVA metric involved in the fitness criterion visible in Equation (7). The MtM store-and-reuse approach allows reducing the complexity of such trade incremental XVA computations to trade (as opposed to portfolio) size. However, to achieve XVA compression in real time, this is not enough; another key step is the parallelization of the genetic algorithm that is used for solving Equation (7).
The genetic algorithm is a population based method, which implies to maintain a population of individuals (tentative new deals) through each iteration of the algorithm. The calculation of the objective function, for a given individual, does not depend on the fitness value of the other individuals. Therefore we can vectorize the computation of the fitness values within the population. Provided a suitable parallel architecture is available, a perfectly distributed genetic algorithm makes the execution time independent of the population size P (see Algorithm 1 and Figure 1).
This makes an important difference with other metaheuristic optimization algorithm, such as simulated annealing or stochastic hill climbing, which only evaluate one or very few solutions per iteration, but need much more iterations to converge toward a good minimum (see (Adler 1993; Janaki Ram et al. 1996)). As discussed in (Pardalos et al. 1995), the above parallelization of the fitness function evaluation, for a given population, should not be confused with a parallel genetic algorithm in the sense of an independent evolution of several smaller populations.
In our context, where individuals only represent incremental trades, a parallelization of population fitness evaluation is compatible with an MtM store-and-reuse approach for the trade incremental XVA computations. Combining the two techniques results in an XVA compression time independent of the sizes of the initial portfolio of the bank and of the population of the genetic algorithm used for the optimization, which represents an XVA compression computation time gain factor of the order of
Number of trades in the initial portfolio × population size .

4. Case Study

In the remainder of the paper, we present CVA compression results on real swap portfolios3, using an additional swap for the CVA compression. We aim at addressing questions such as:
  • Which type of swap is suitable for achieving the compression of the CVA, in the context of a given initial portfolio?
  • How does the compression distort the portfolio exposure, with or without penalization?
To ease the implementation of the MtM store-and-reuse approach, we assume no CSA (cf. Section 3.1).

4.1. New Deal Parameterization

A swap is parameterized by its notional, its maturity, its direction, and its currency. The quantitative parameters are encoded through grids of values:
  • Notional: From 10 5 to 10 7 by step of 10 5 dollars.
  • Maturity: From 1 to 20 years by step of 1 year, 30 years and 50 years.
The qualitative parameters are encoded as enumerations of values:
  • Currency: Euro, US dollar, GBP or Yen.
  • Direction: A binary variable for payer or receiver.
Moreover, we impose the additional swap to be at par so that it can be entered at no cost, which is equally desirable from the bank and the client perspectives.
The above parameterization defines a discrete search space A with 100 × 22 × 4 × 2 = 1.76 × 10 4 elements.

4.2. Design of the Genetic Algorithm

We address the optimization problem in Equation (7) by a genetic algorithm as per Section 2.3. The new deal space A in Equation (7) is viewed as a space of chromosomes x, the genes (deal parameters) of which evolve randomly along the iterations of the algorithm as detailed in Section 2.3.
In the theoretical literature on genetic algorithms, an individual is represented as a bit string. In practice, however, bit string representation of parameters does not give enough control on the mutation distribution. Namely, in bit string representation, mutations affect all bits uniformly, whereas we might want to mutate some parameters more frequently (the quantitative parameters, in particular, as the algorithm tends to quickly identify the relevant values of the qualitative parameters). Hence, we rather model our individuals x by a variable string, a choice also made in (Kondratyev and Giorgidze 2017).
We choose rank proportionate selection to avoid fitness scaling issues. More precisely, if we have a population P = { 1 , , P } of P individuals and the associated fitnesses ( f i ) i P , then the probability to select chromosome i is
p i = 2 r a n k ( f i ) P ( P + 1 ) ,
where r a n k is a function that ranks chromosomes according to their fitness value (returning one for the highest value, in the context of a minimization problem).
Regarding the crossover operator, we use a uniform crossover mask, i.e., the choice of gene inherited from one parent or another is drawn with a uniform probability.
Regarding mutations, the probability to mutate a gene is proportional to the number of alleles (values) that it can take. The mutation operator then selects uniformly a new gene allele (value).
In our experiments, the notional of the new swap can take 100 different values, its currency 4 values, its position 2 values, and its maturity 22 values. Hence, when a chromosome is selected for mutation, the probability to mutate each of its genes is equal to 100 128 for the notional, 22 128 for the maturity, 4 128 for the currency, and 2 128 for the position. Indeed, a more frequent mutation of notional and maturity parameters are desirable. Diversity for currency and position is ensured at the initialization of the algorithm (with a large population) and maintained across the iterations thanks to the crossover operator. A prerequisite for a successful implementation is a reasonable specification of the search space A .
Hyperparameters strongly impact the behavior of the algorithm. In the case of XVA compression, which is time-consuming, searching good values for the hyperparameters by a grid search method would be too demanding computationally. In our numerics, the mutation rate r m is set to 20% and the crossover rate r c to 50%. In the genetic algorithms literature, the crossover rate is often close to one, but for problems with few genes (i.e., components of x, or parameters, only four in our case), it is recommended to select a smaller value.
With parallelization in mind (see Section 3.2), we prefer to decrease the number of iterations even if it implies exploring more solutions. We set the genetic algorithm population size to P = 100 individuals and we limit the number of iterations to 5. Hence, we value the fitness function on 600 tentative new swaps x.

4.3. Results in the Case of Payer Portfolio Without Penalization

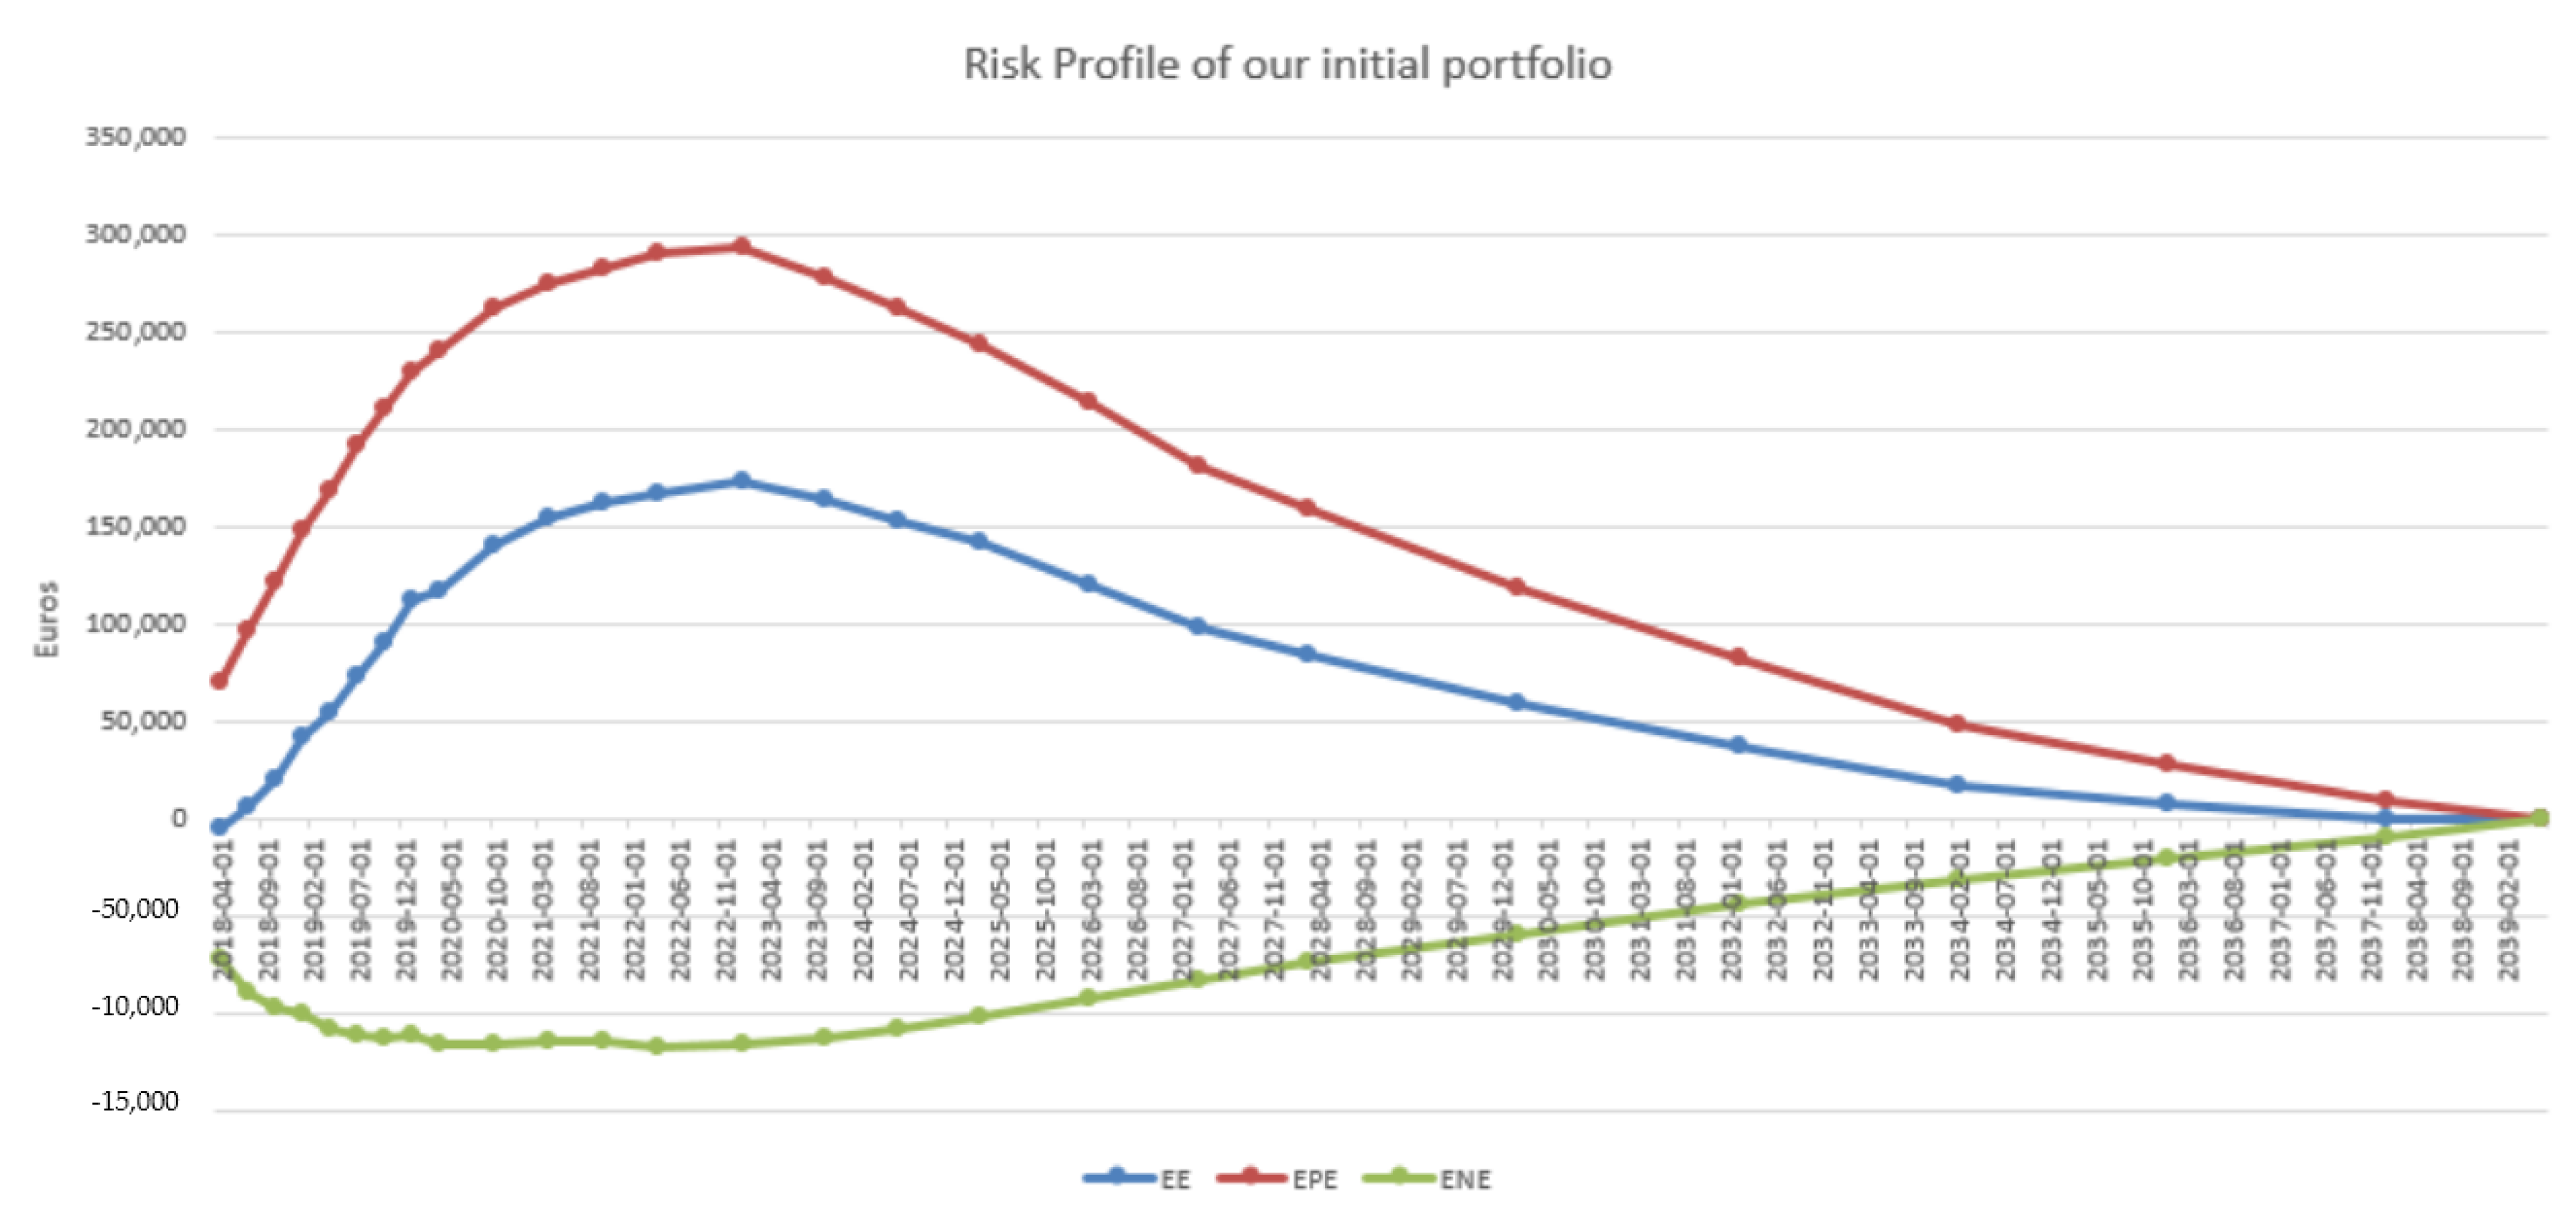
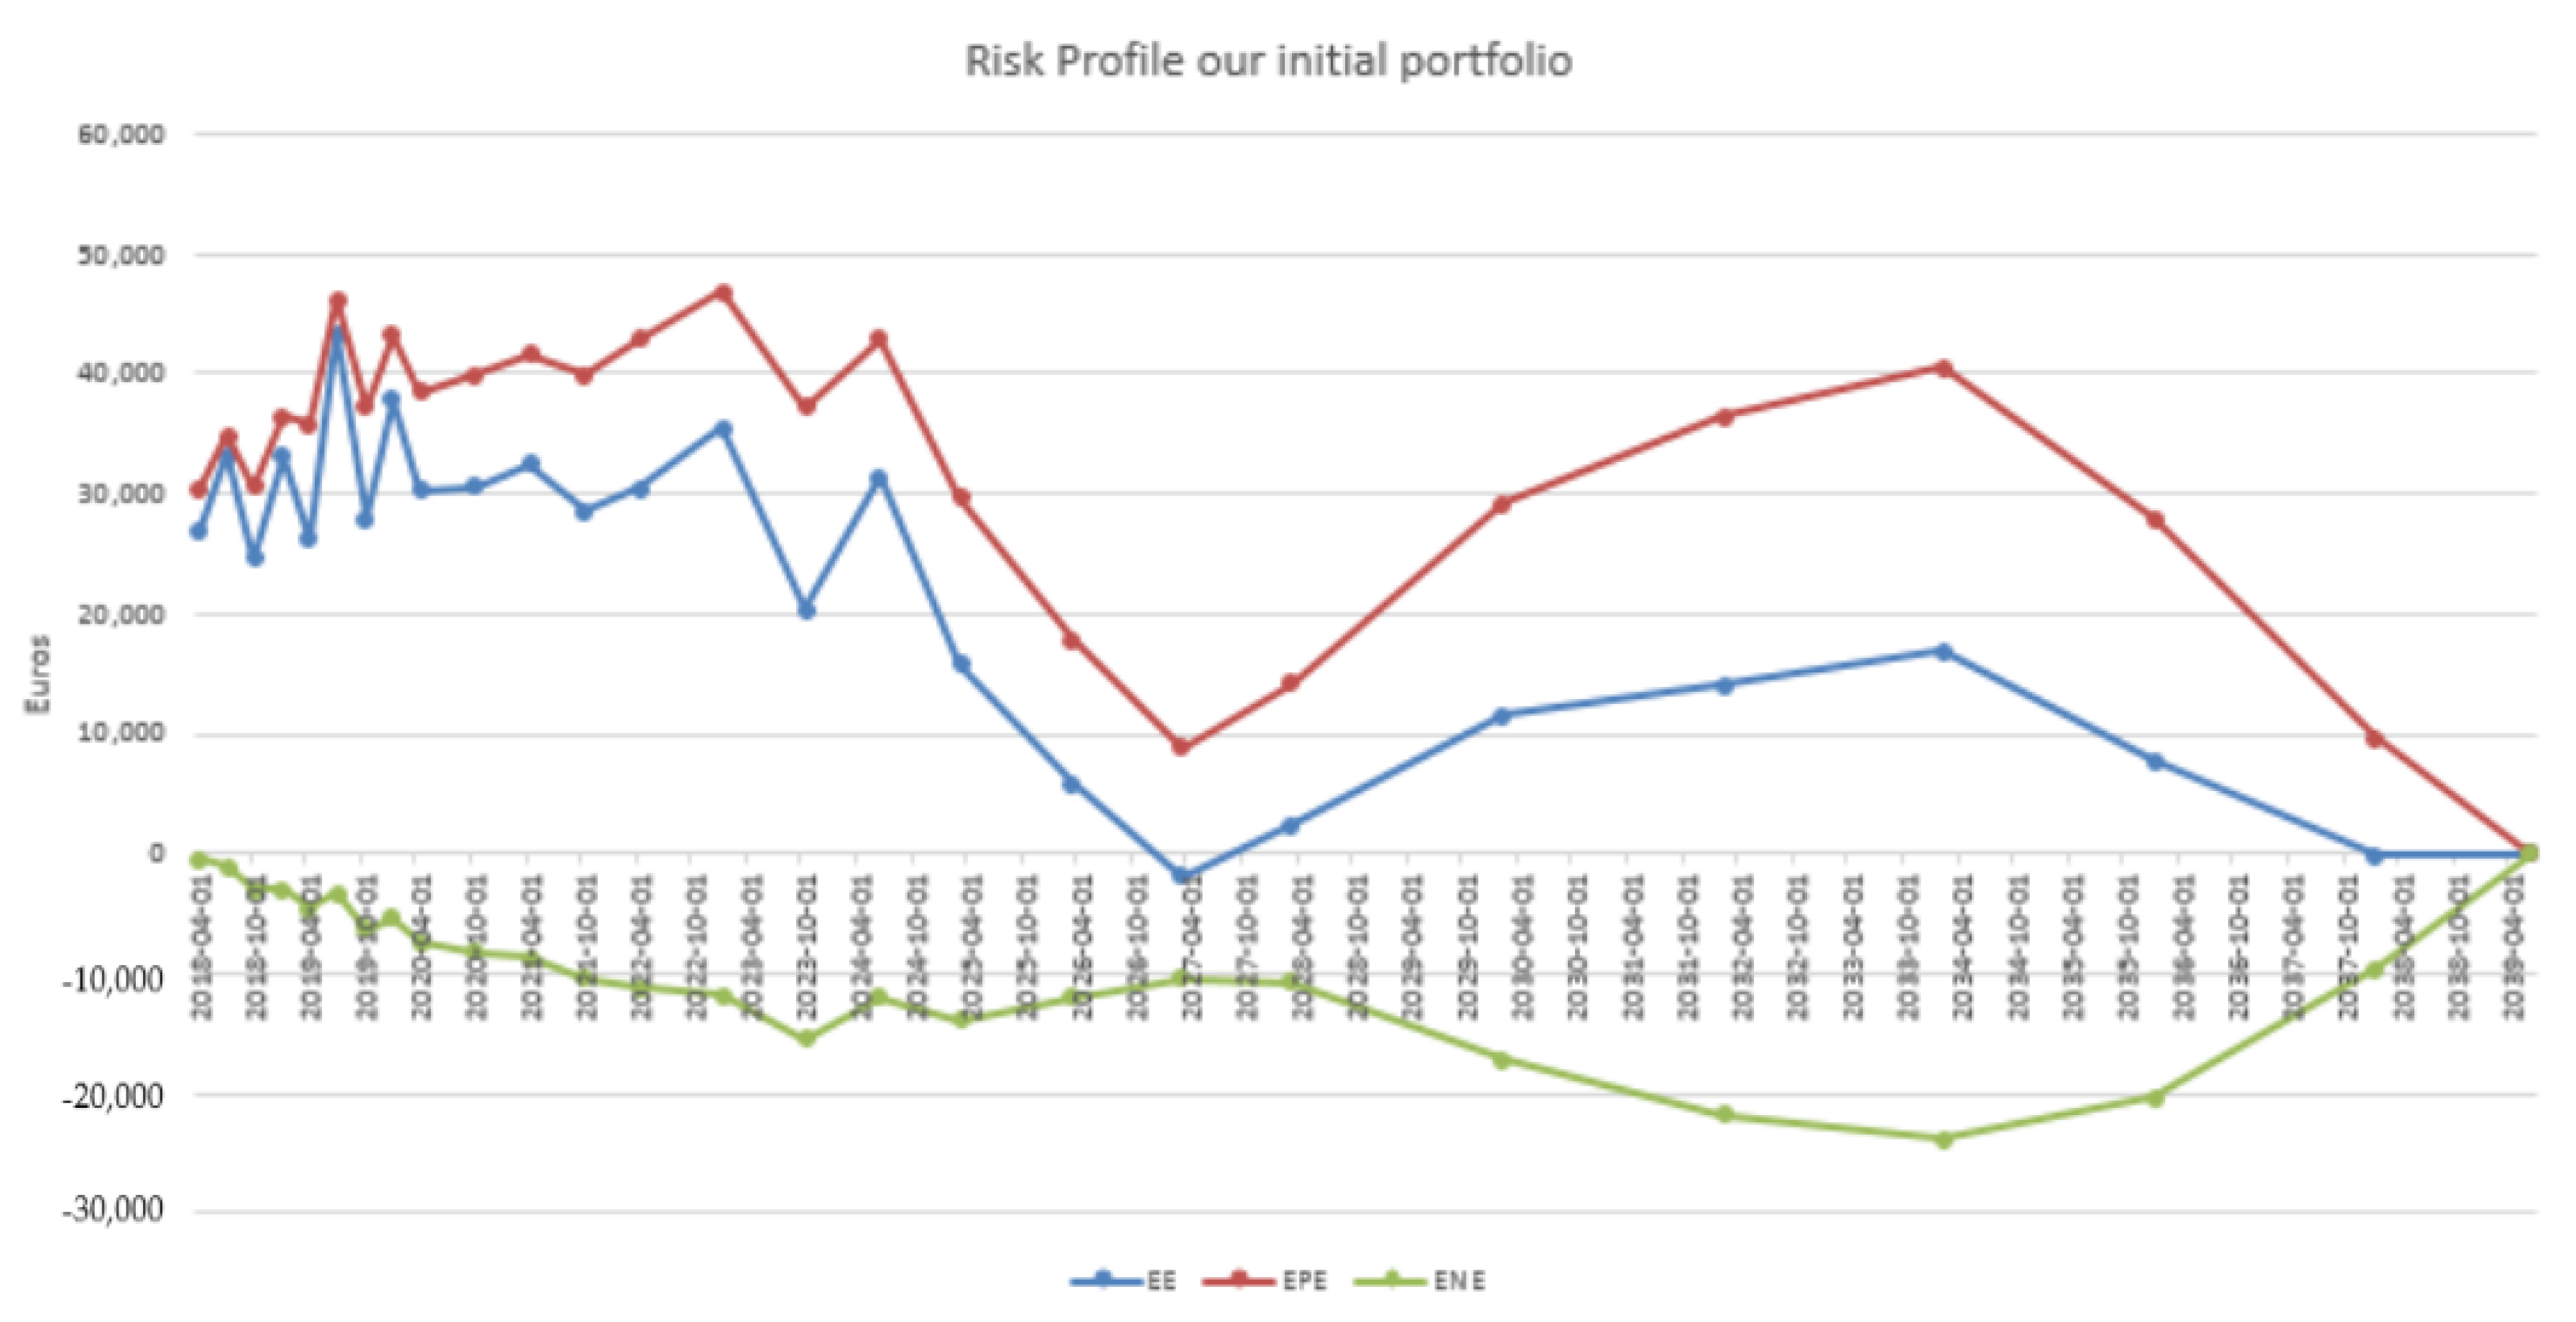
First, we consider a portfolio only composed of payer swaps. The expected exposure (EE) and the expected positive and negative exposures (EPE and ENE), i.e., E MtM t and E MtM t ± , are shown as a function of time t in Figure 3, which illustrates the asymmetric market risk profile of the portfolio.
Our first point is to verify that the algorithm without penalization, i.e., for α = 0 in Equation (7), will select a receiver swap with a maturity comparable to those of the swap of the initial portfolio.
Table 1 reports after each iteration the three best solutions (from top to bottom) ever found since the beginning of the algorithm (in terms of the fitness criterion in Equation (7) with α = 0 , i.e., Δ CVA ). A negative incremental CVA means that the new swap decreases the counterparty risk of the bank. The initial portfolio CVA amounts to 34,929€. We also report the |DV01|s of the augmented portfolios in order to be able to assess the impact of the penalization in our next experiment.
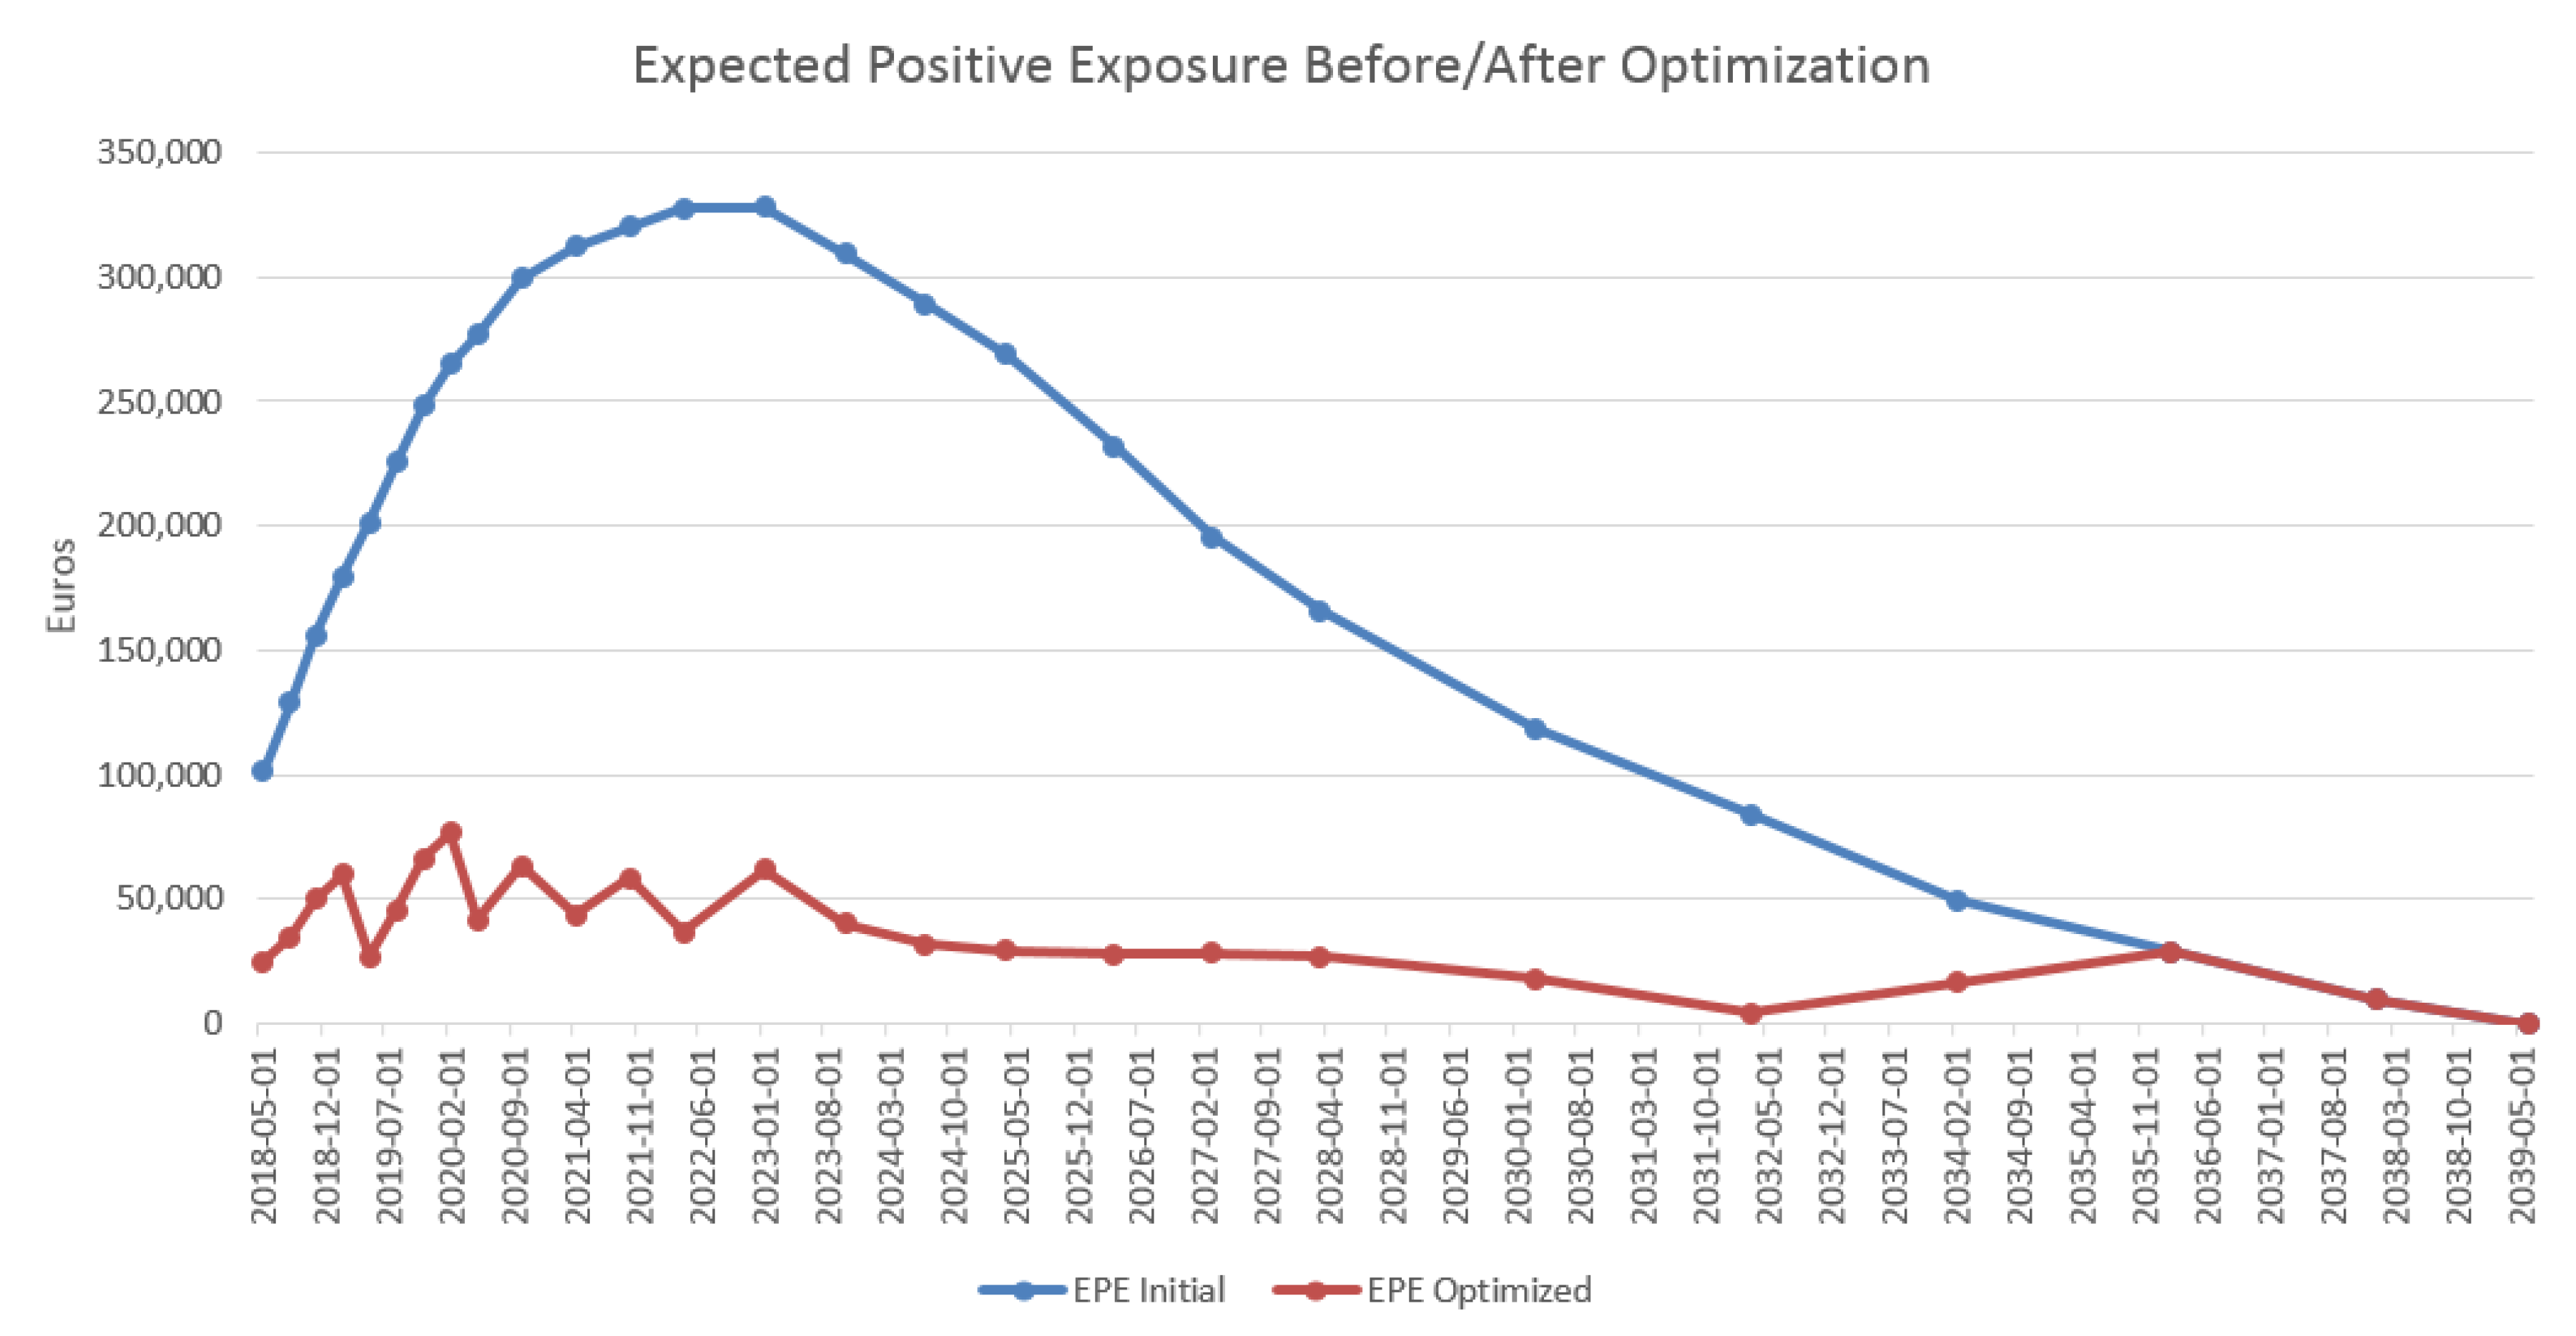
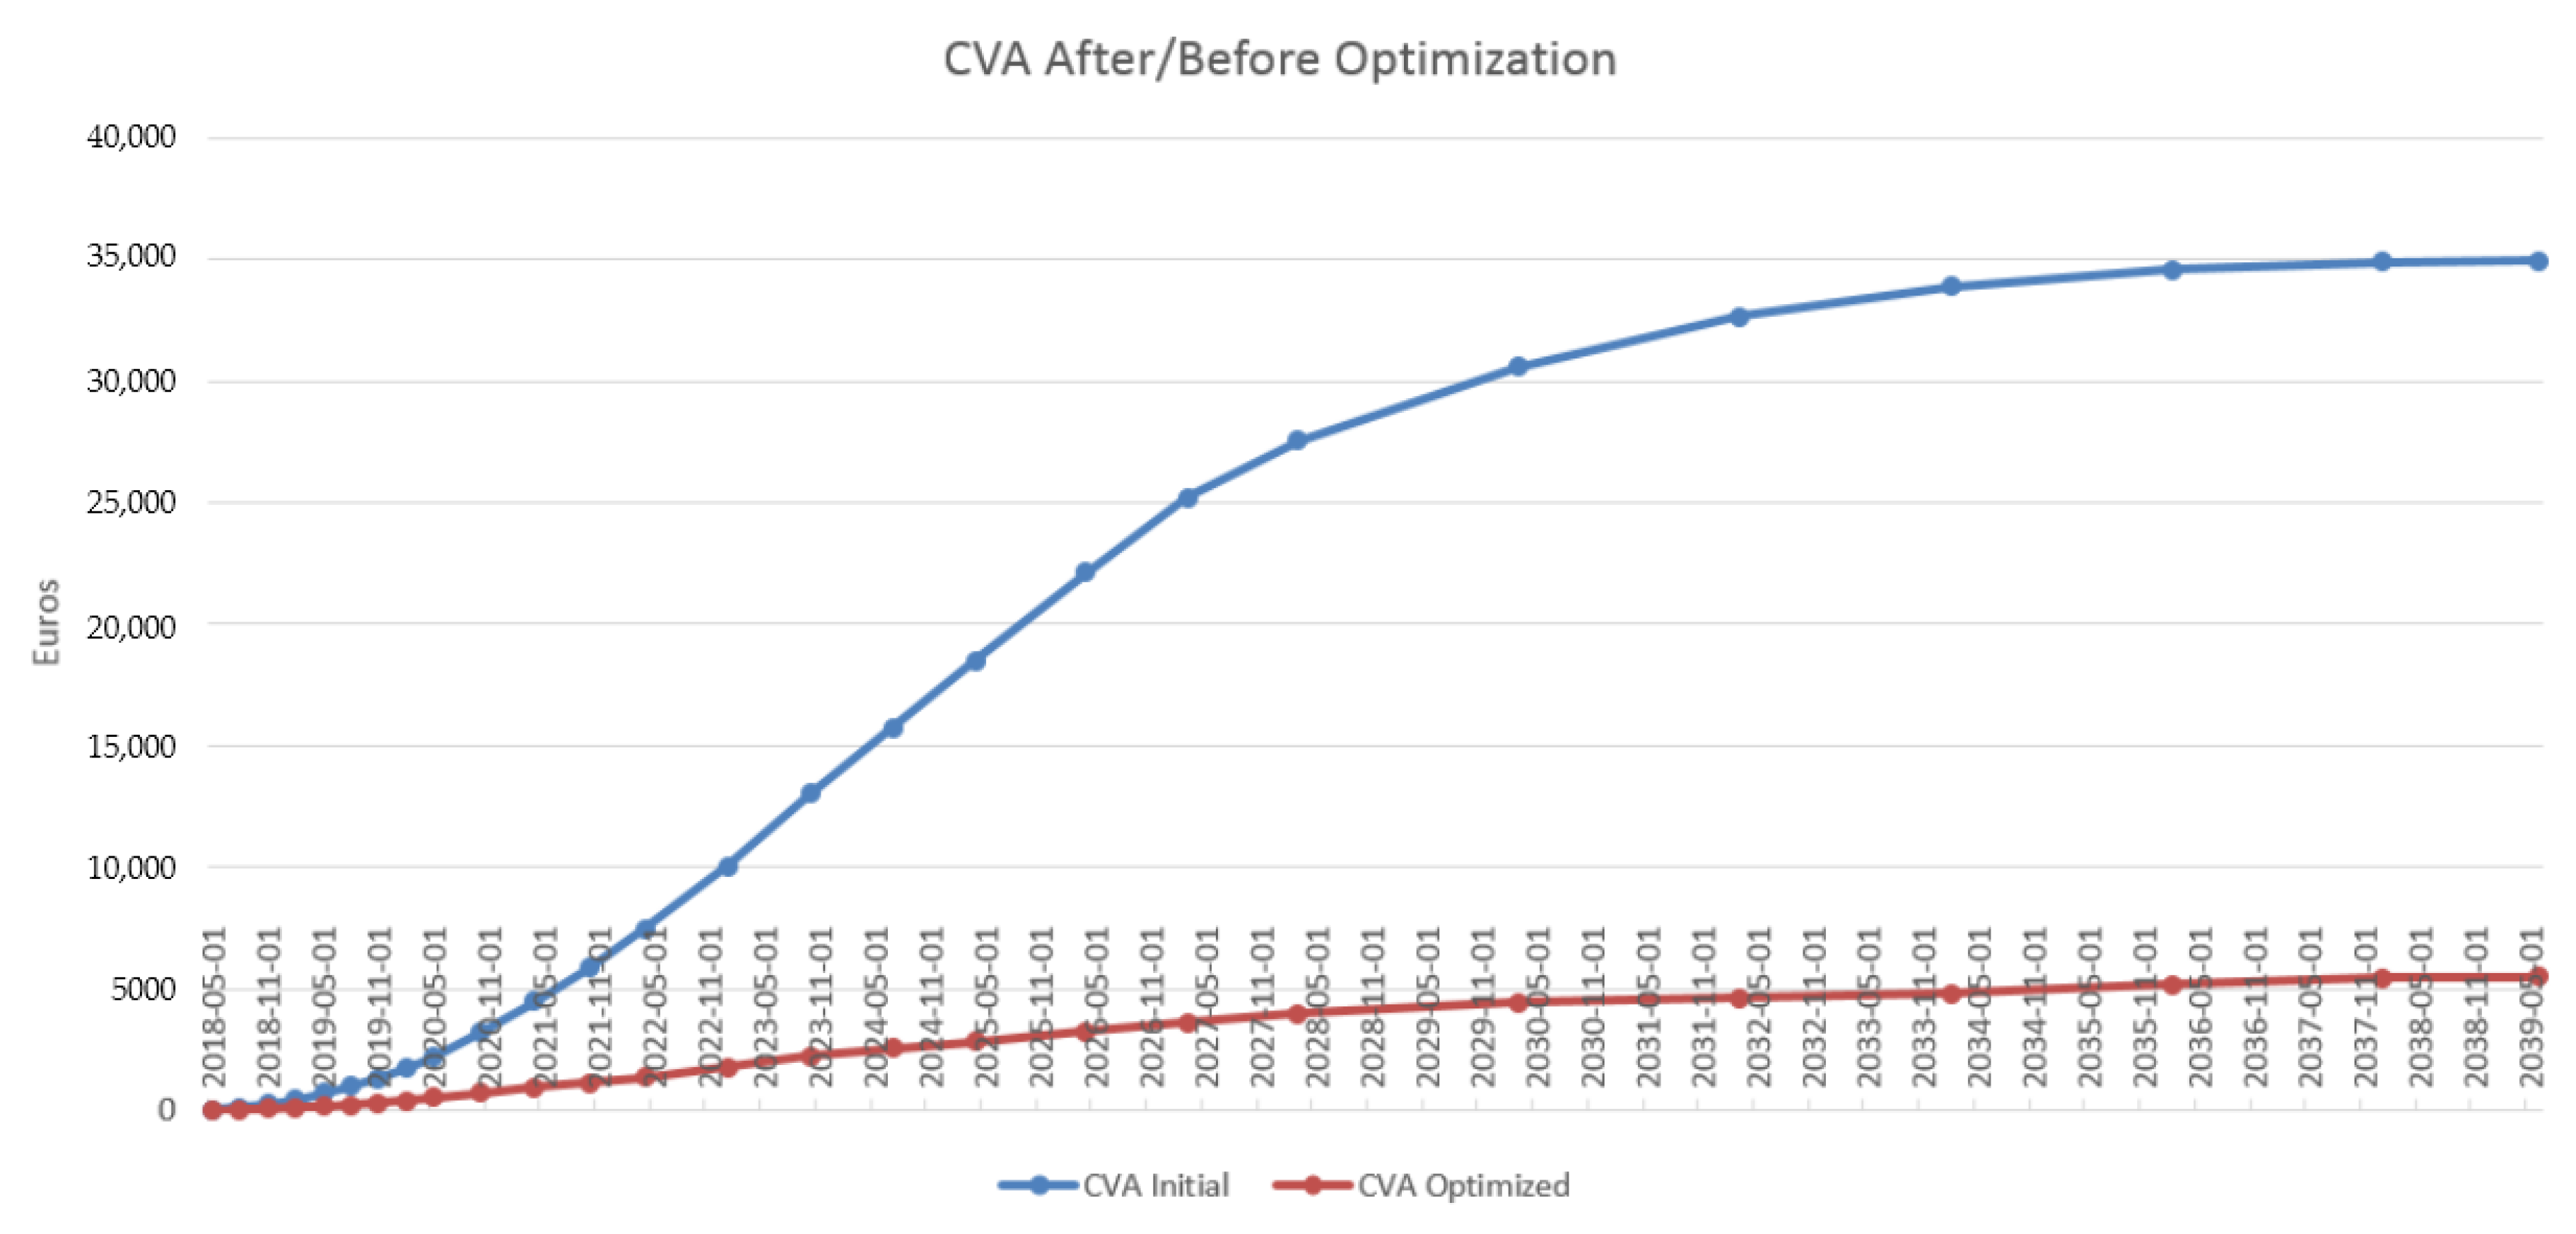
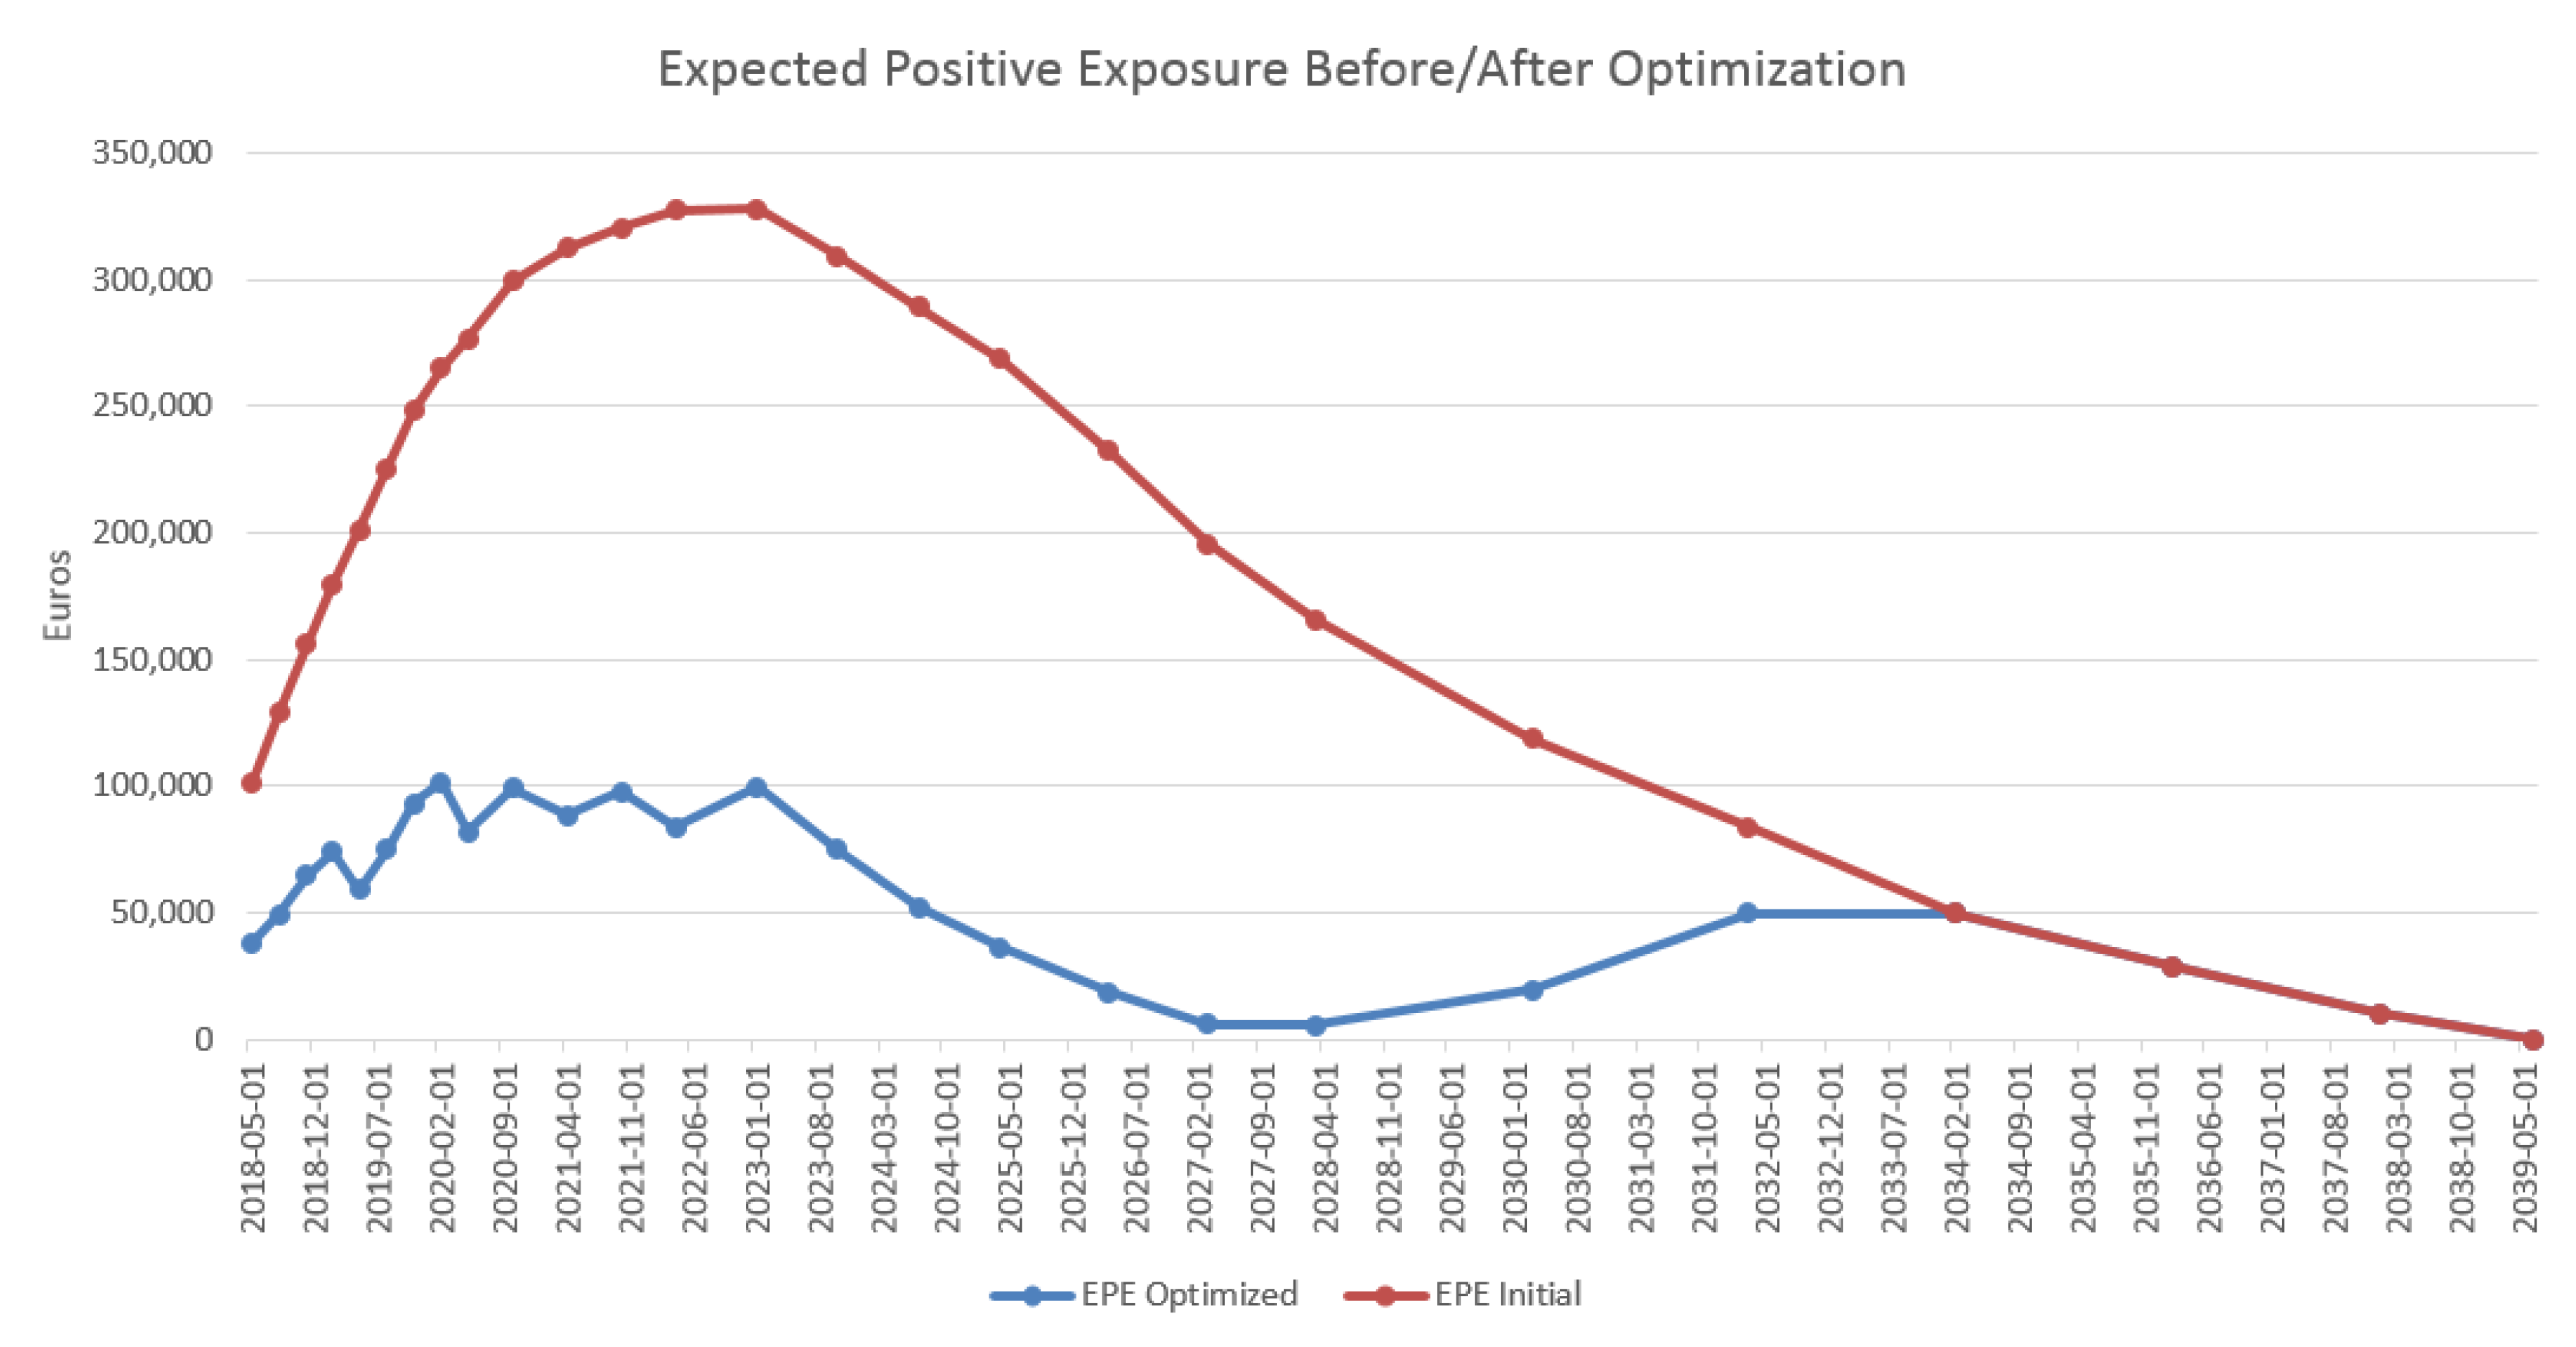
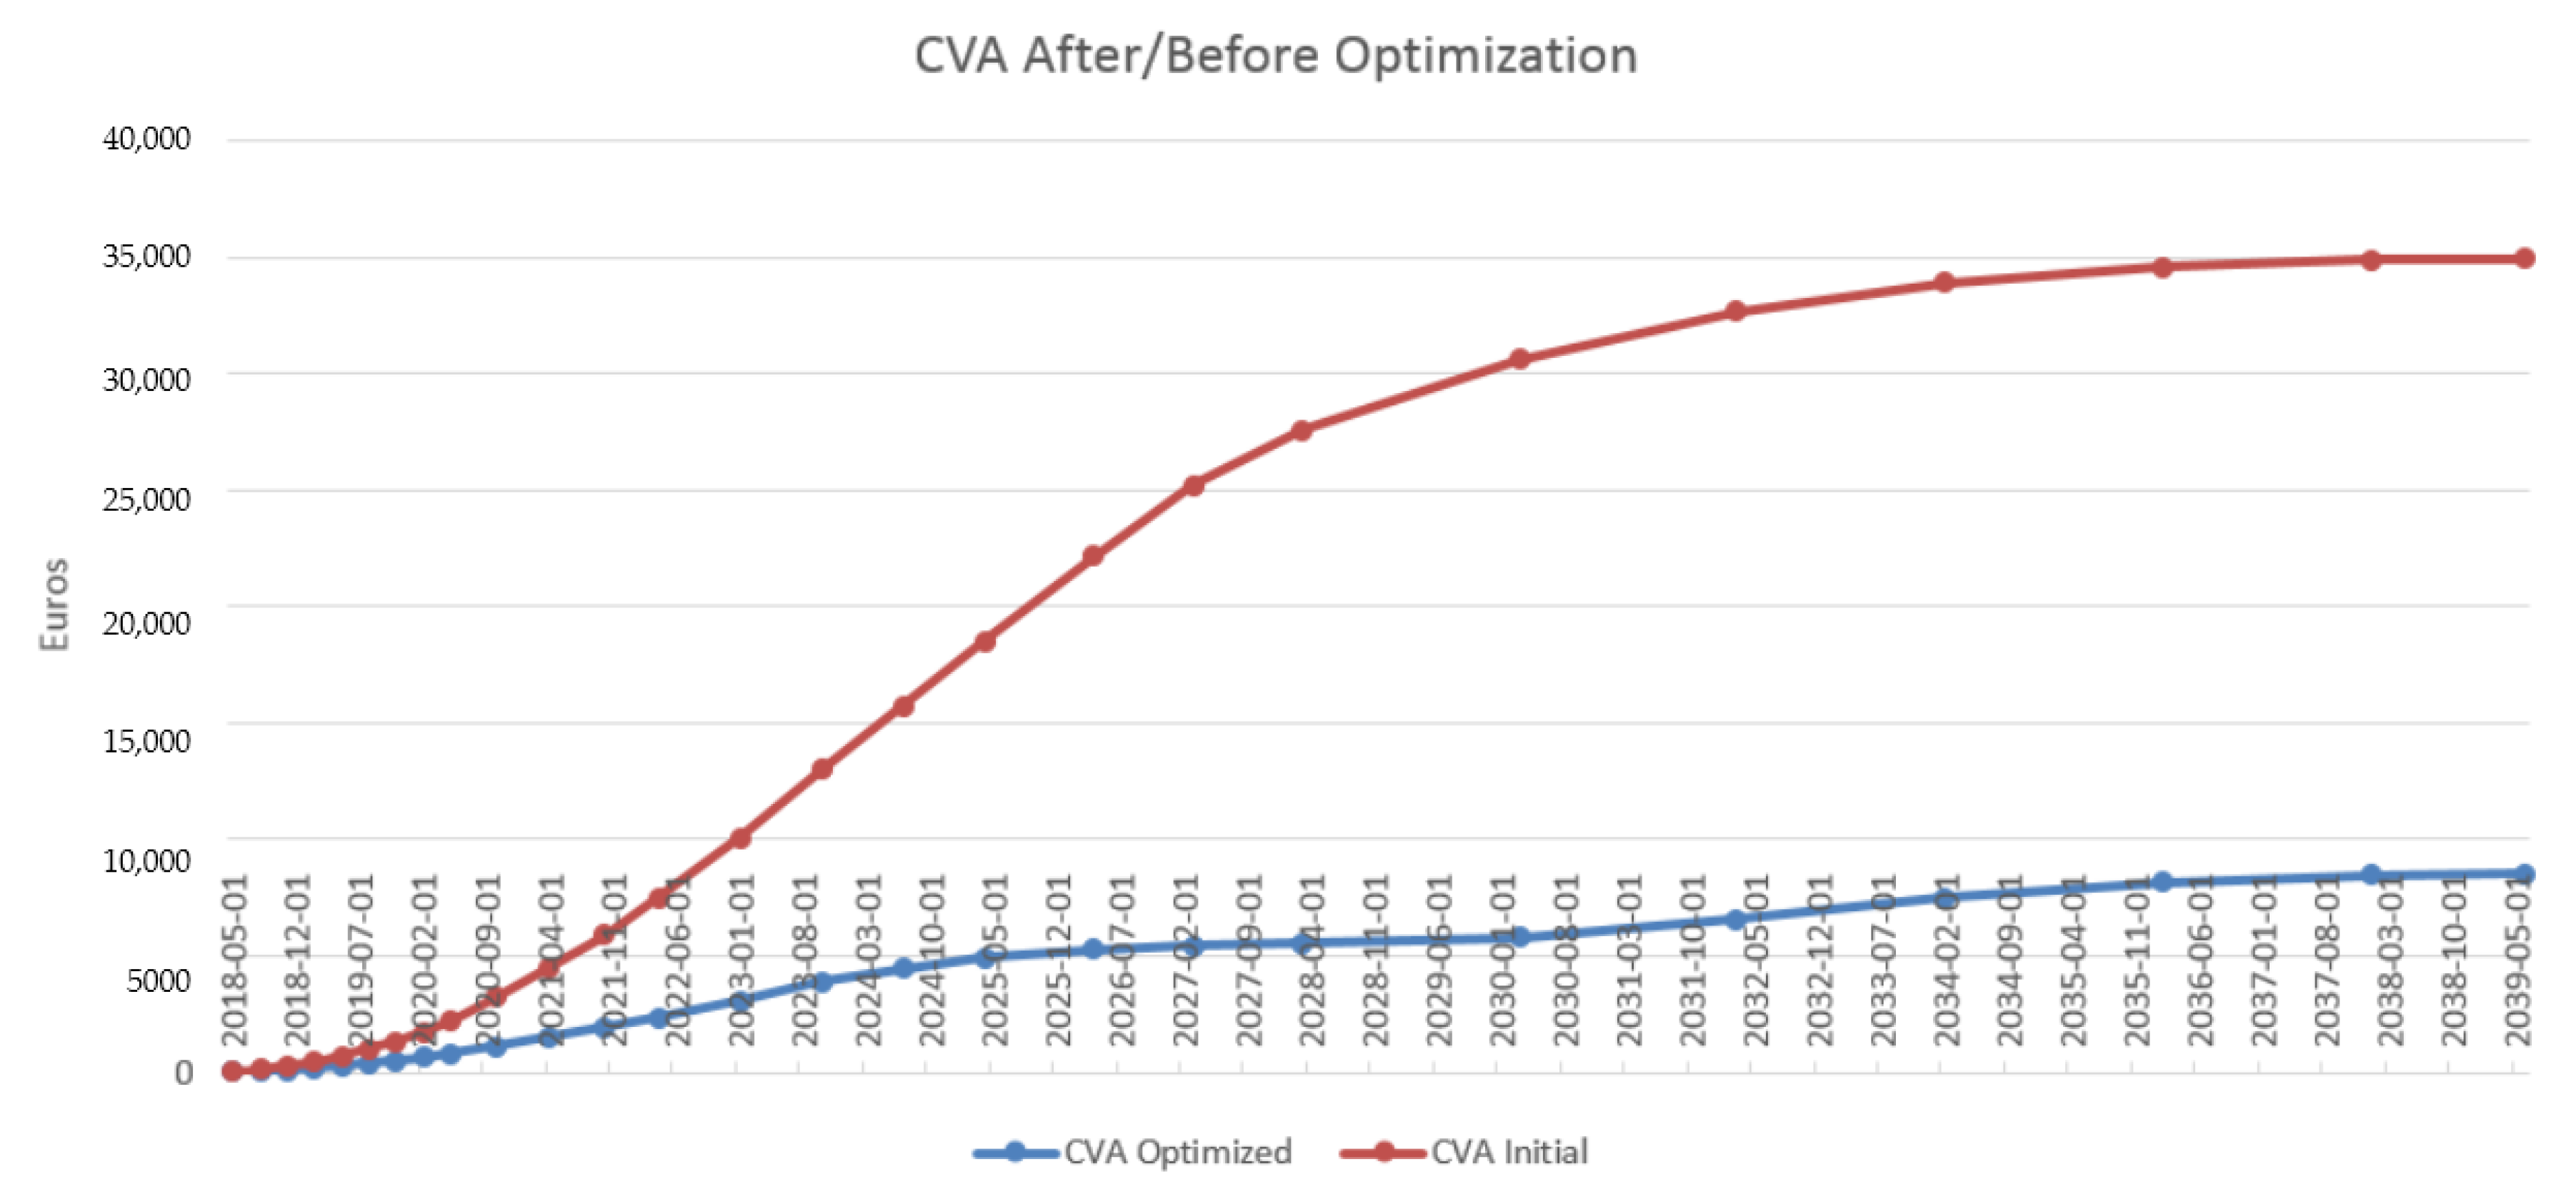
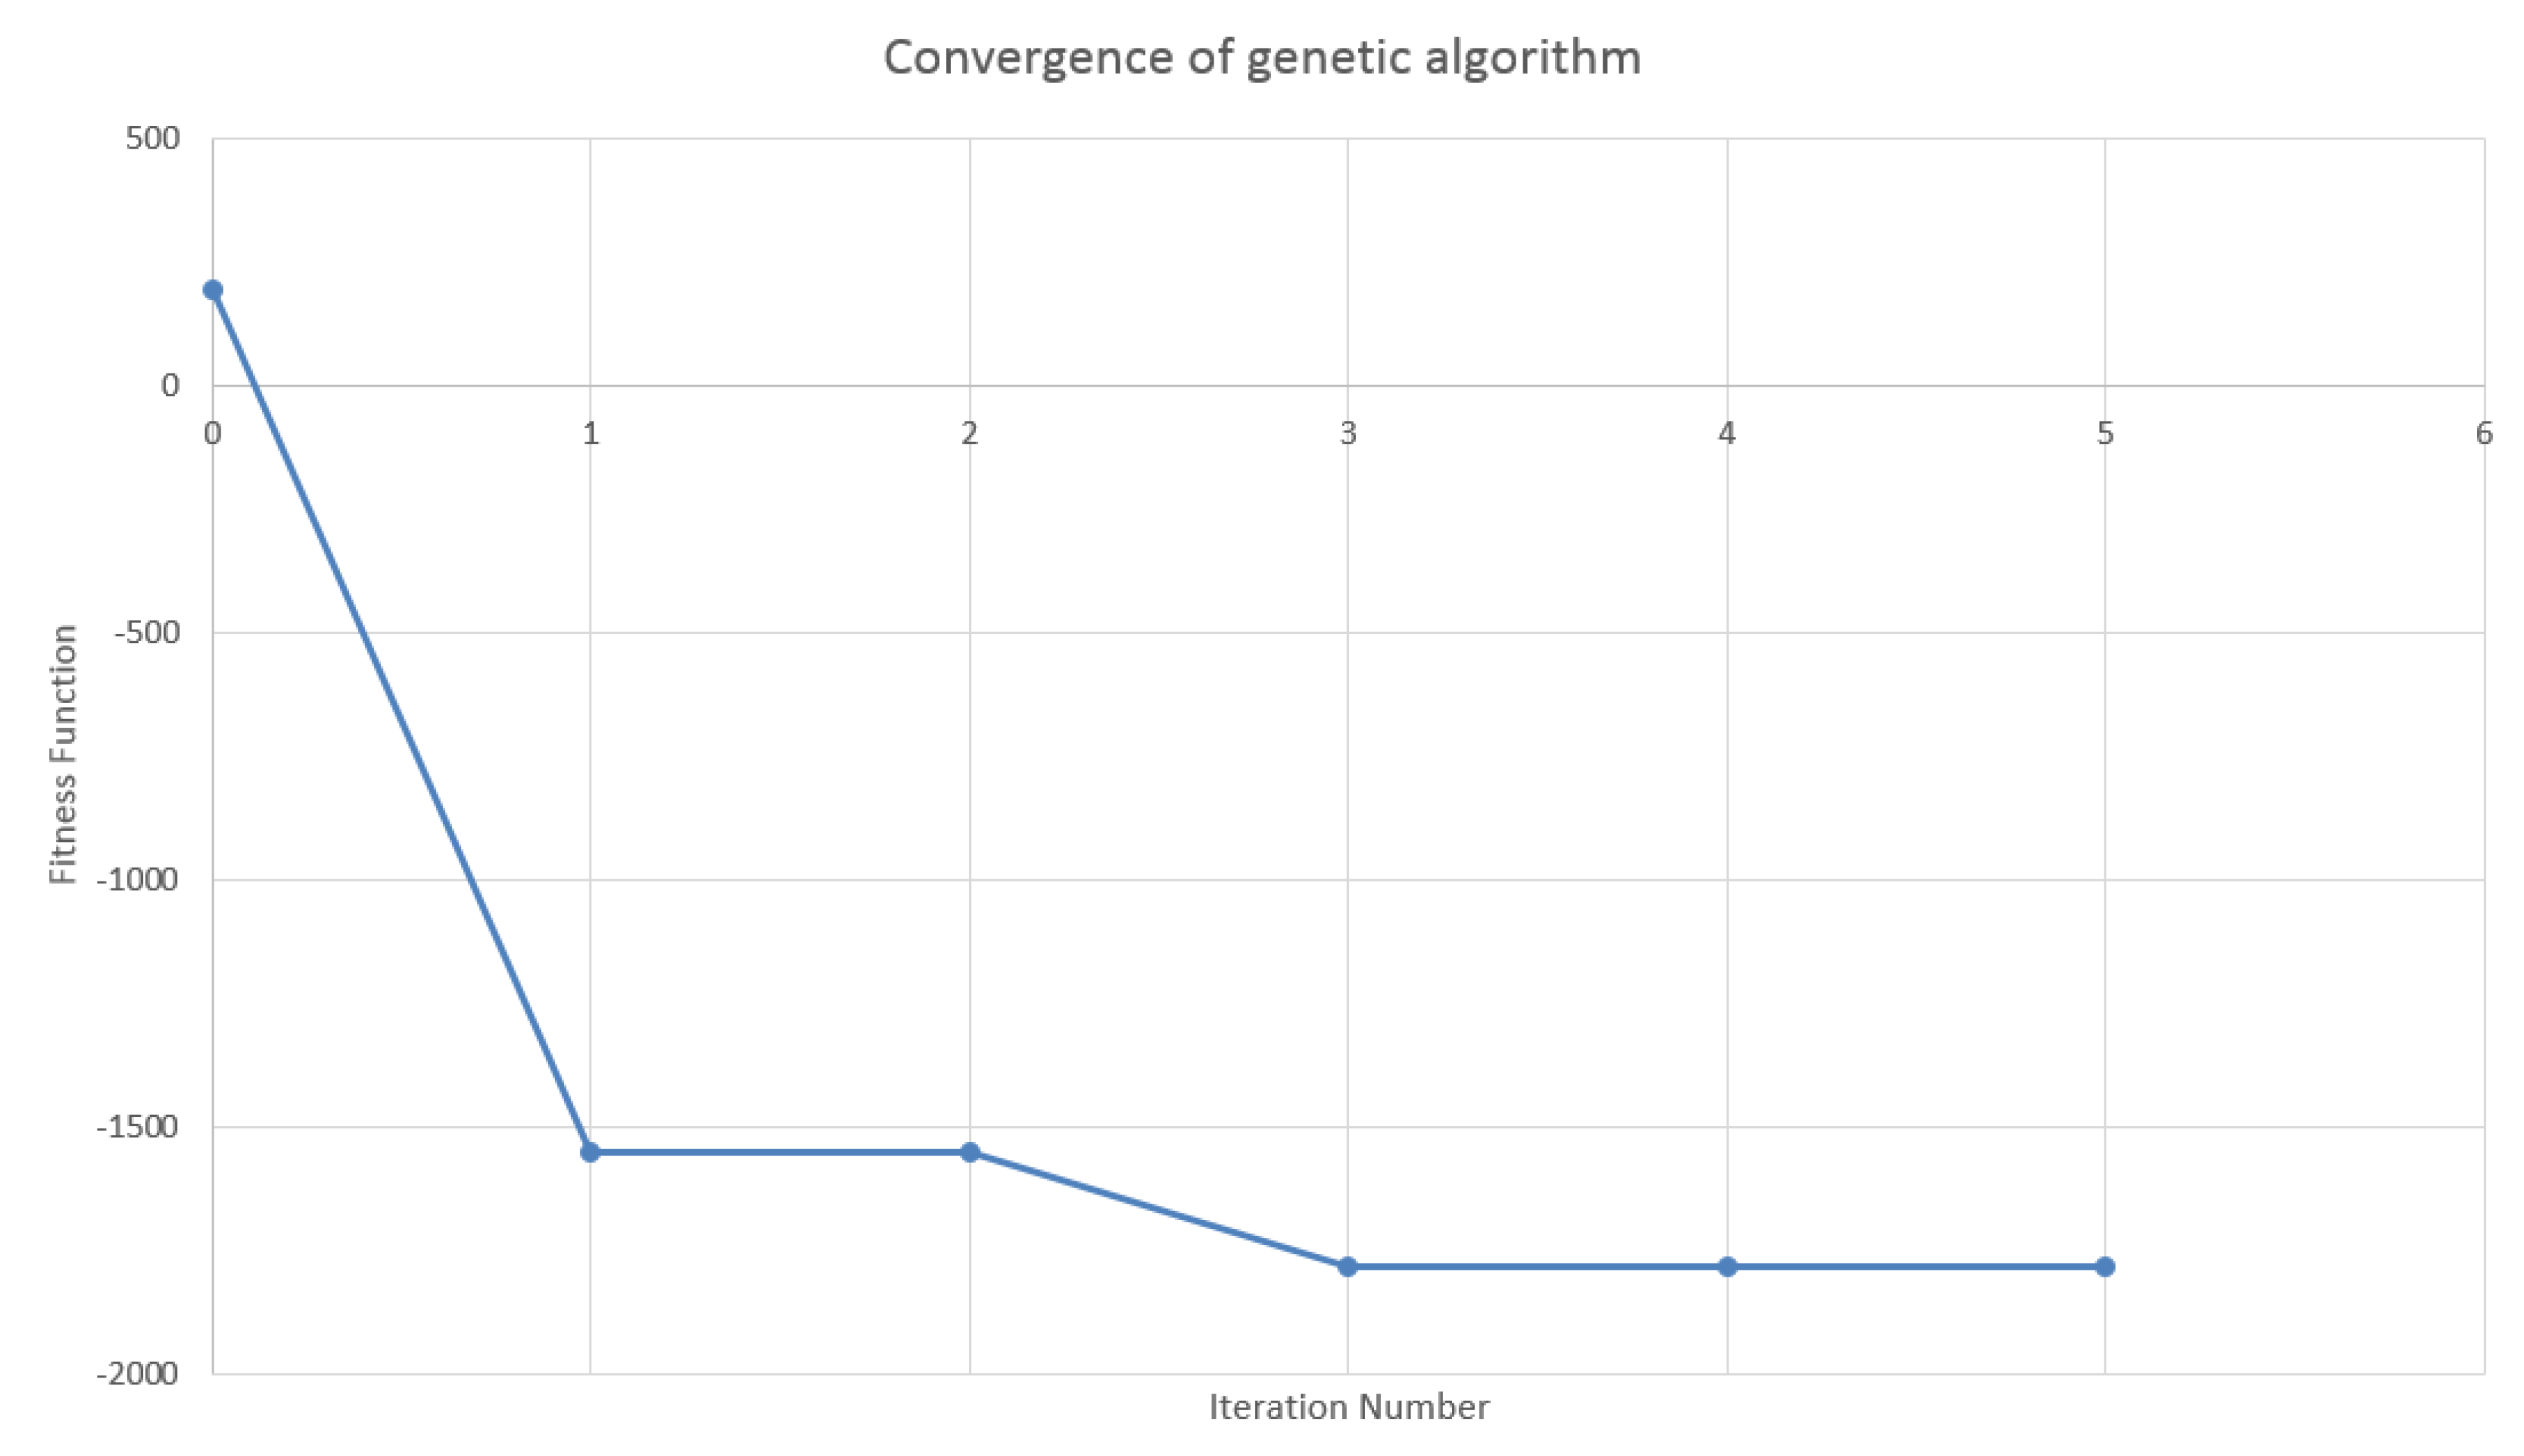
As shown in Figure 4, a stabilization of the algorithm is observed after four iterations, on a new swap leading to a CVA gain of about 27,300€, i.e., about 78% of the initial portfolio CVA. The maturity and the notional are found the two most sensitive genes in the optimization. The maturity of the swap is chosen by the algorithm so as to reduce the exposure peak: The decrease of the exposure in the first eight years of the portfolio is visible in terms of EPE profile in Figure 5 and of CVA profile4 in Figure 6.

4.4. Results in the Case of Payer Portfolio With Penalization

We keep the same initial portfolio but we now penalize our objective function by the | DV 01 | of the new swap, setting the regularization parameter α to one in Equation (7). As shown below, this choice achieves a good balance between the two terms Δ CVA and α DV 01 in Equation (7).
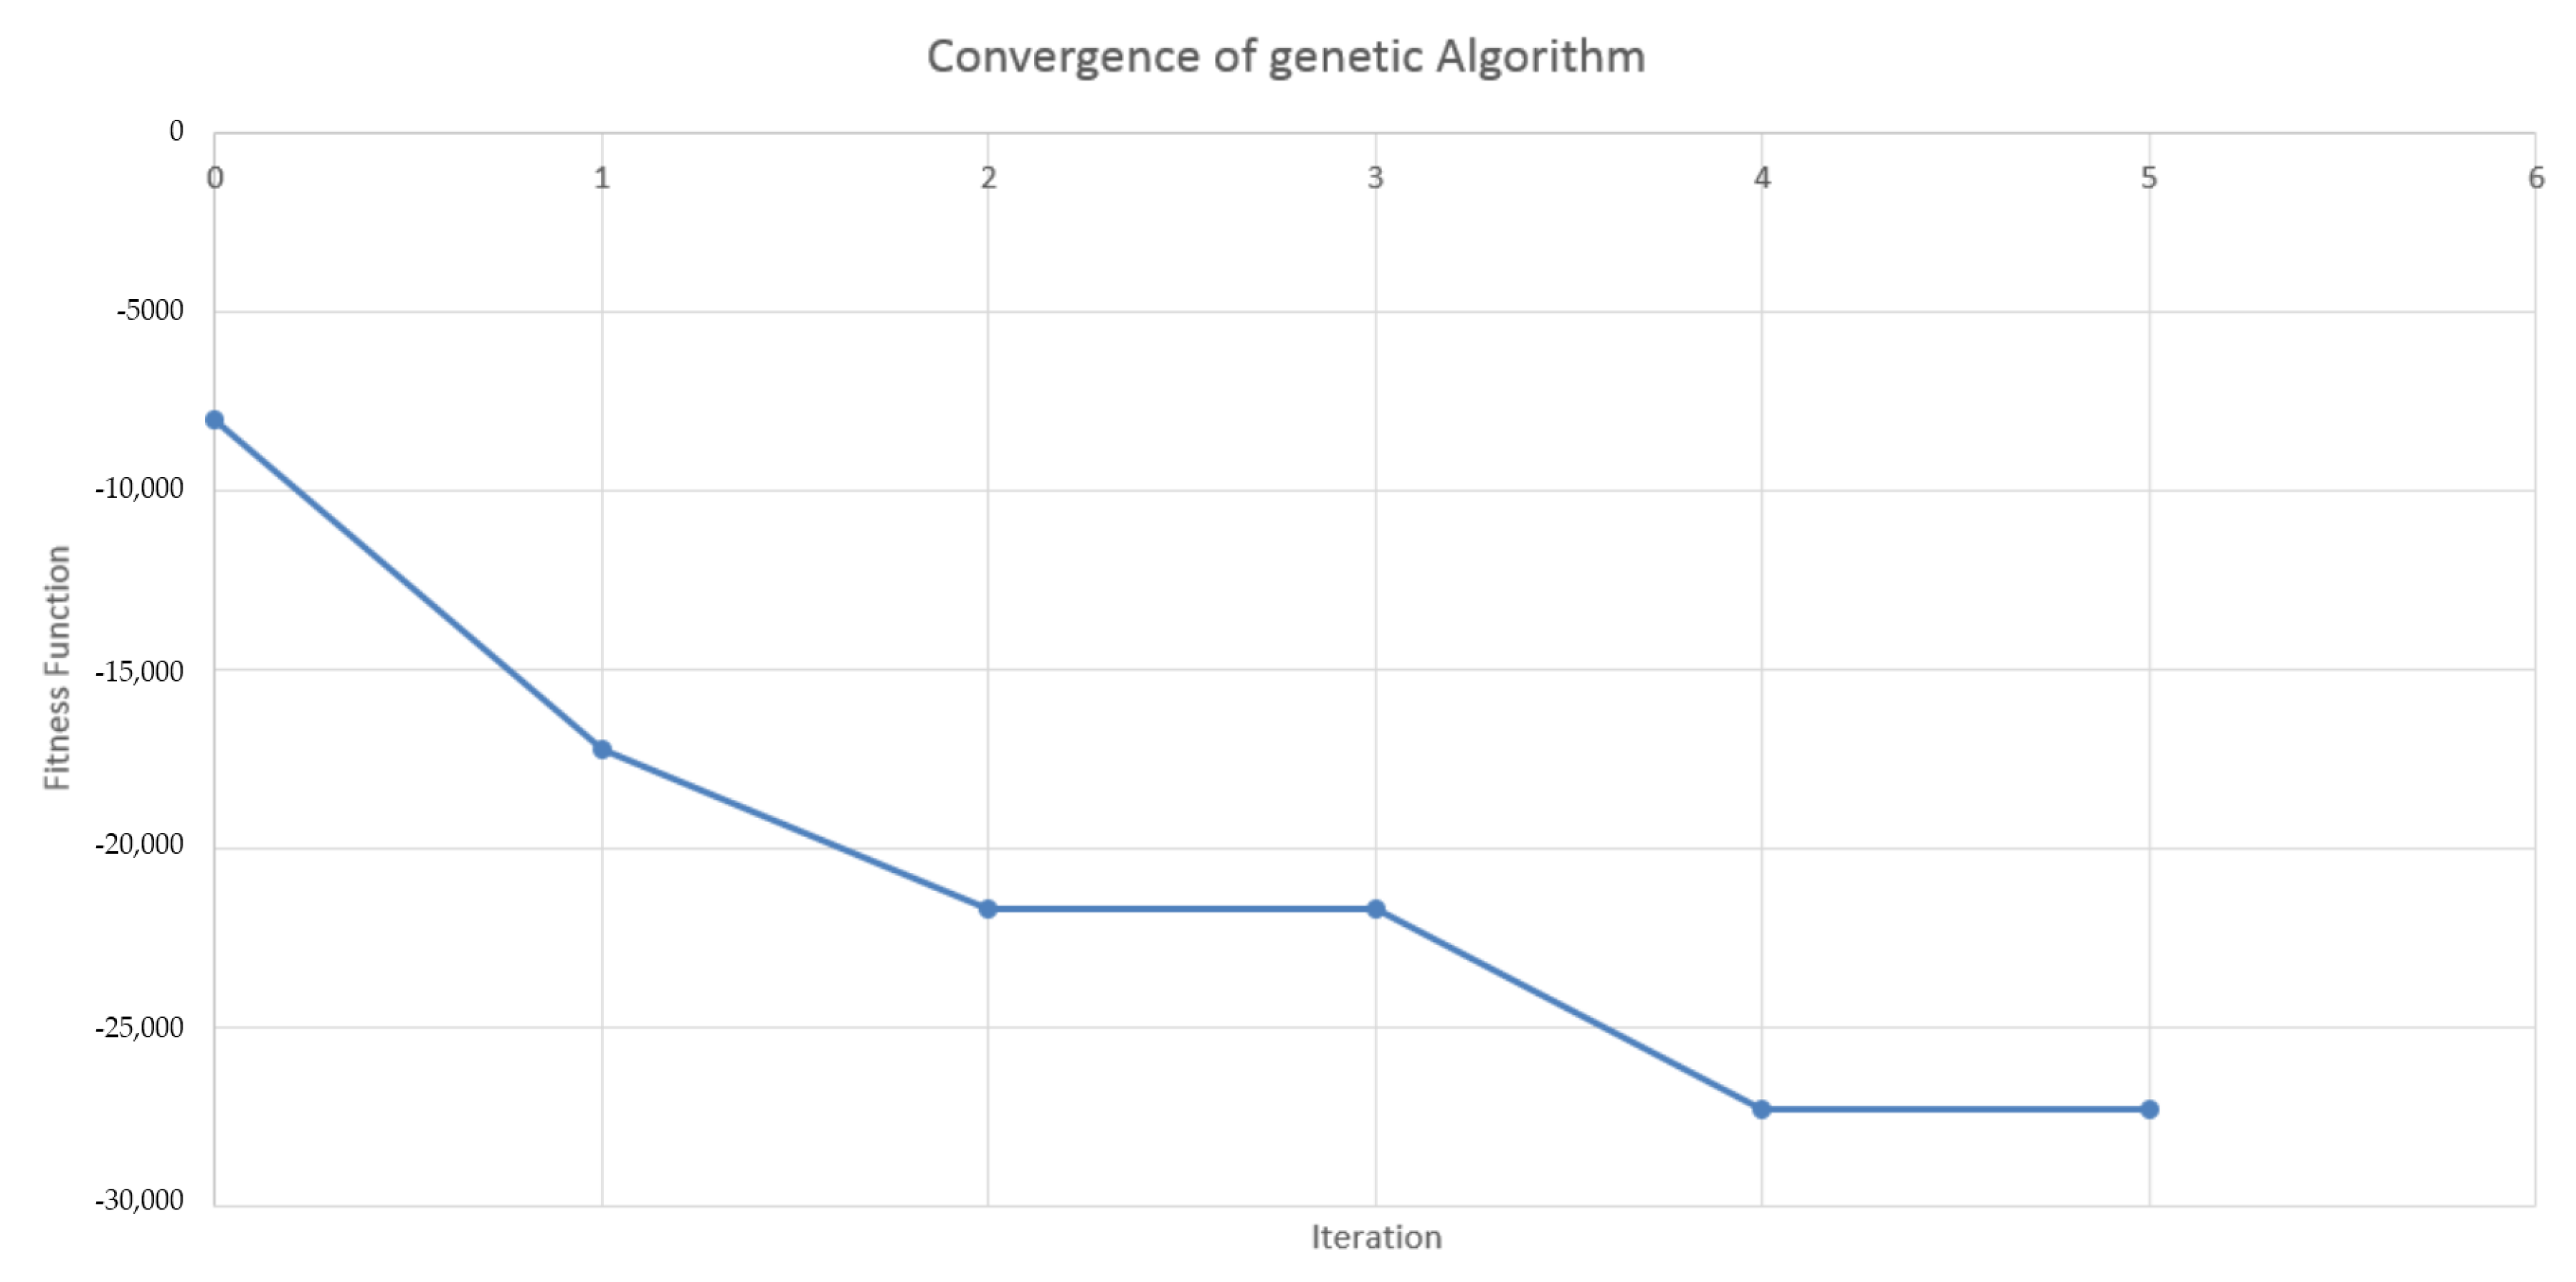
In the present context of a payer portfolio, | DV 01 | control and CVA gain are two antagonistic targets. This may explain why the algorithm seems to struggle in finding a stable solution: indeed, the last iteration still decreases the fitness significantly (see Figure 7).
During the execution (see Table 2), the algorithm first optimizes the CVA and then (in iteration 5) reduces the | DV 01 | . This is due to the difference of order of magnitude between Δ CVA and | DV 01 | (recalling α = 1 ) : Δ CVA is more important, hence the algorithm only takes care of the penalization once Δ CVA has been compressed.
In the end, the gains in CVA are of the same order of magnitude as in the case without penalization (92% of the CVA gain without penalization), but for about 20% of | DV 01 | less than before. The second and third best solutions also achieve a great CVA gain, while diminishing the | DV 01 | by a factor three with respect to the nonpenalized case. By comparison with the unpenalized case (cf. Table 1 and Table 2), the trades identified by the algorithm have a lower maturity or a smaller notional, hence a smaller | DV 01 | .
Figure 8 and Figure 9 show the corresponding market risk and CVA profiles before and after the optimization.

4.5. Results in the Case of a Hybrid Portfolio With Penalization

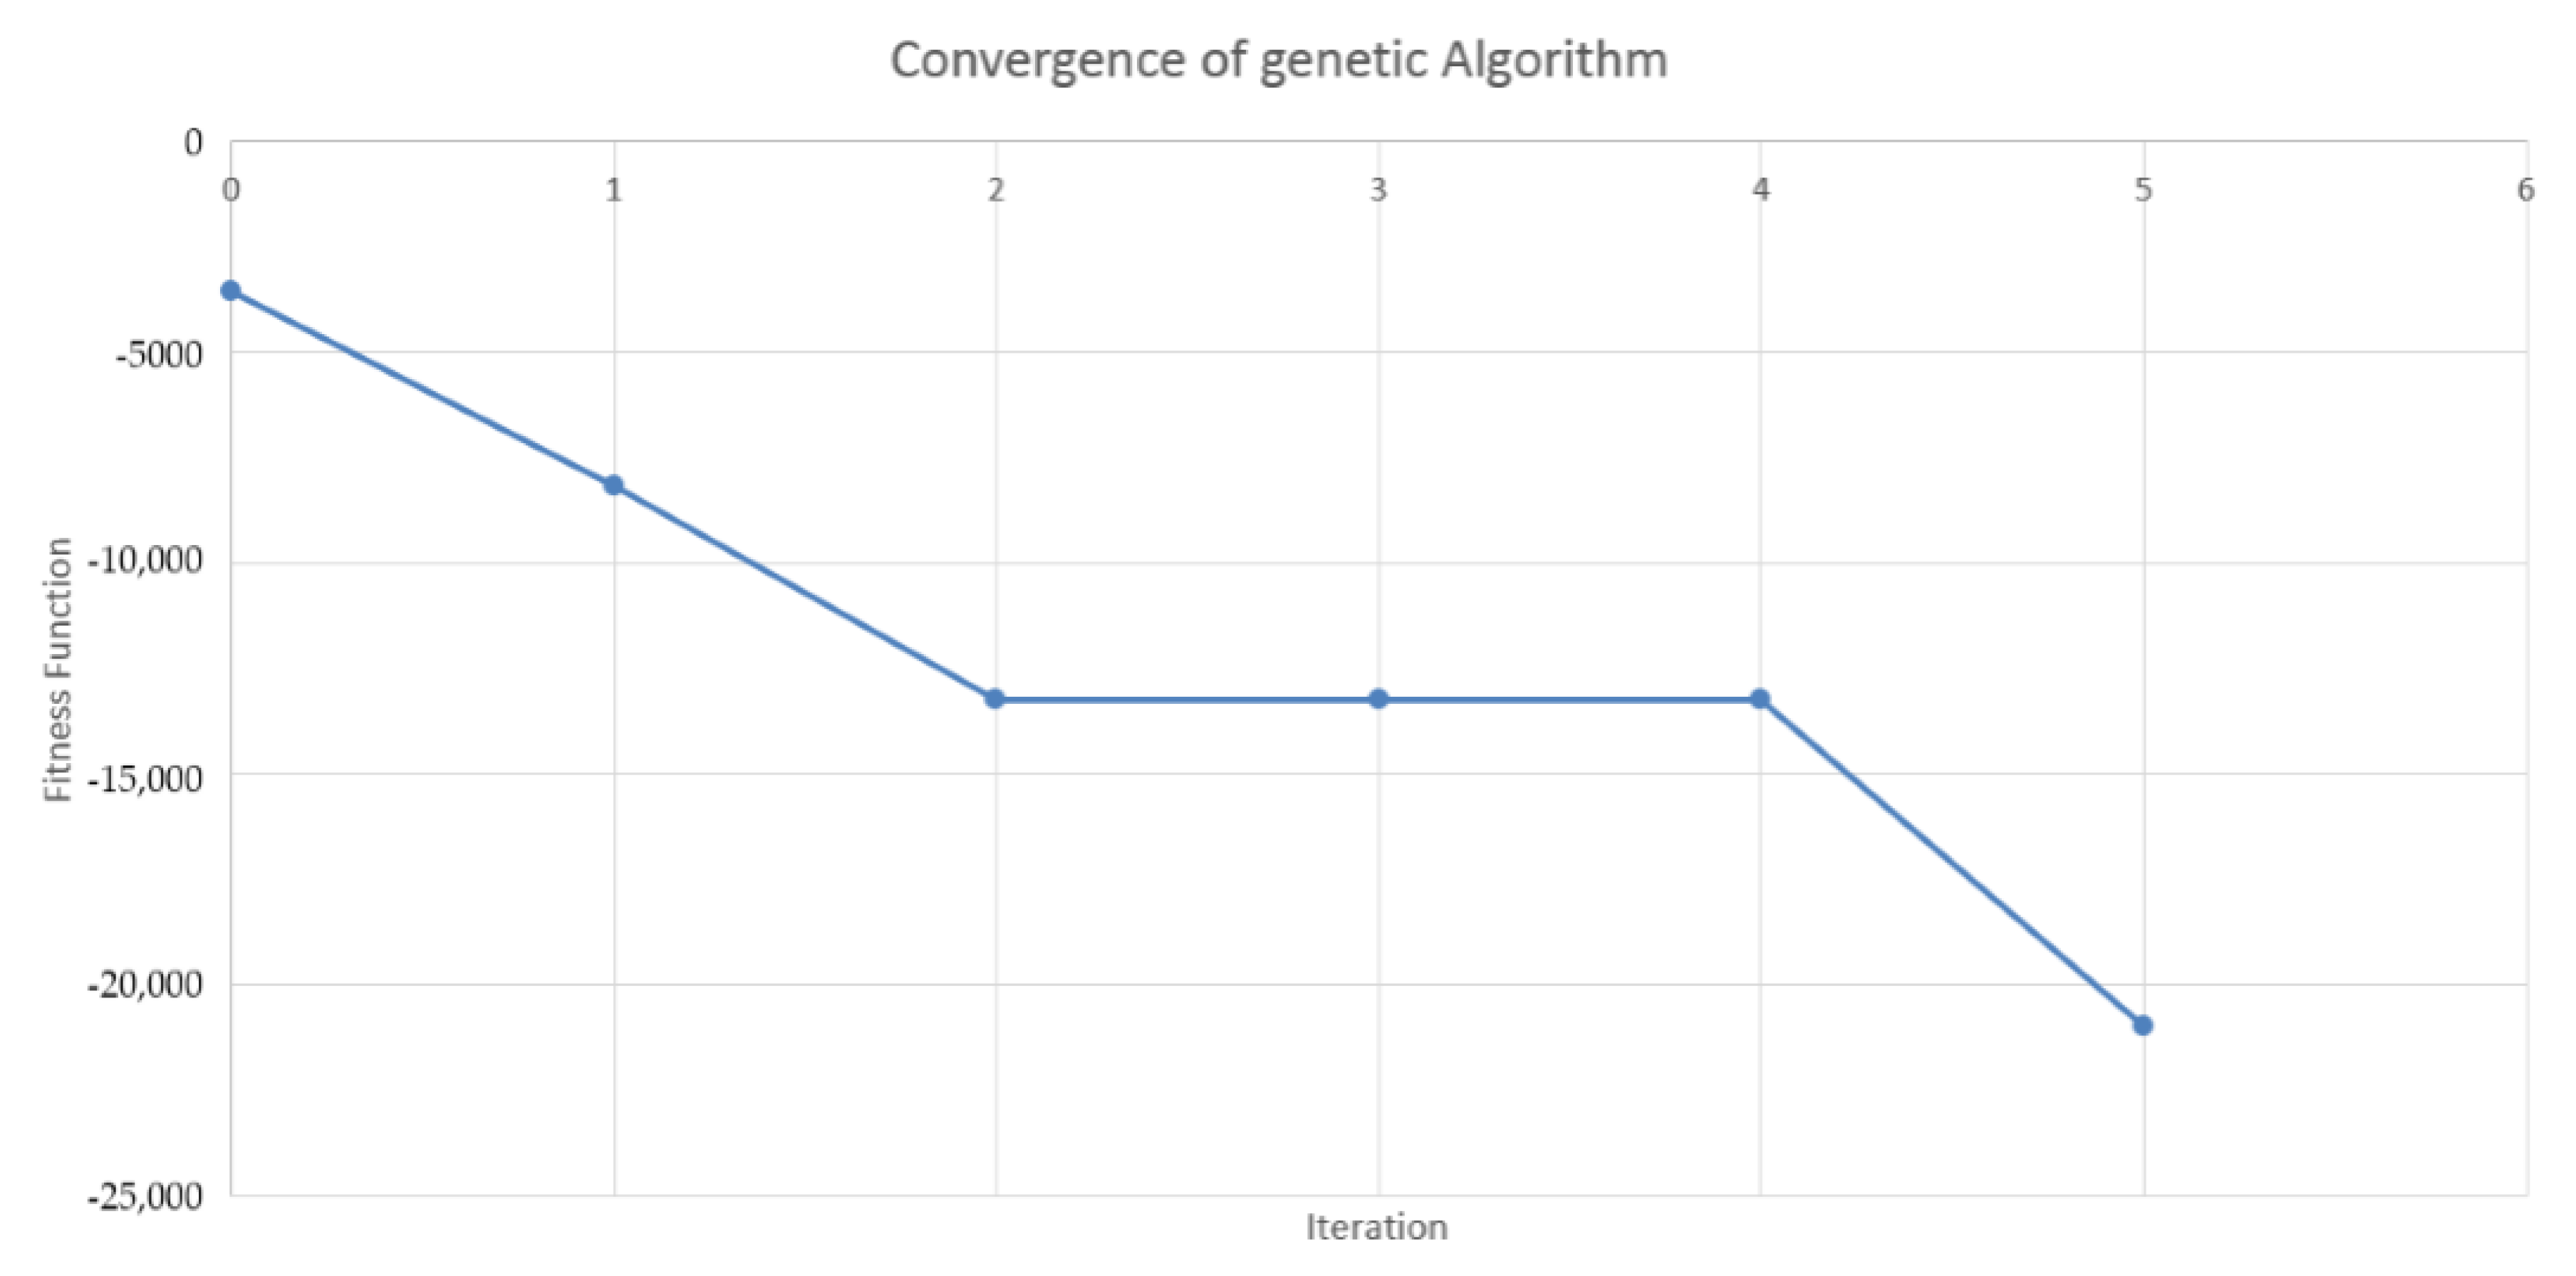
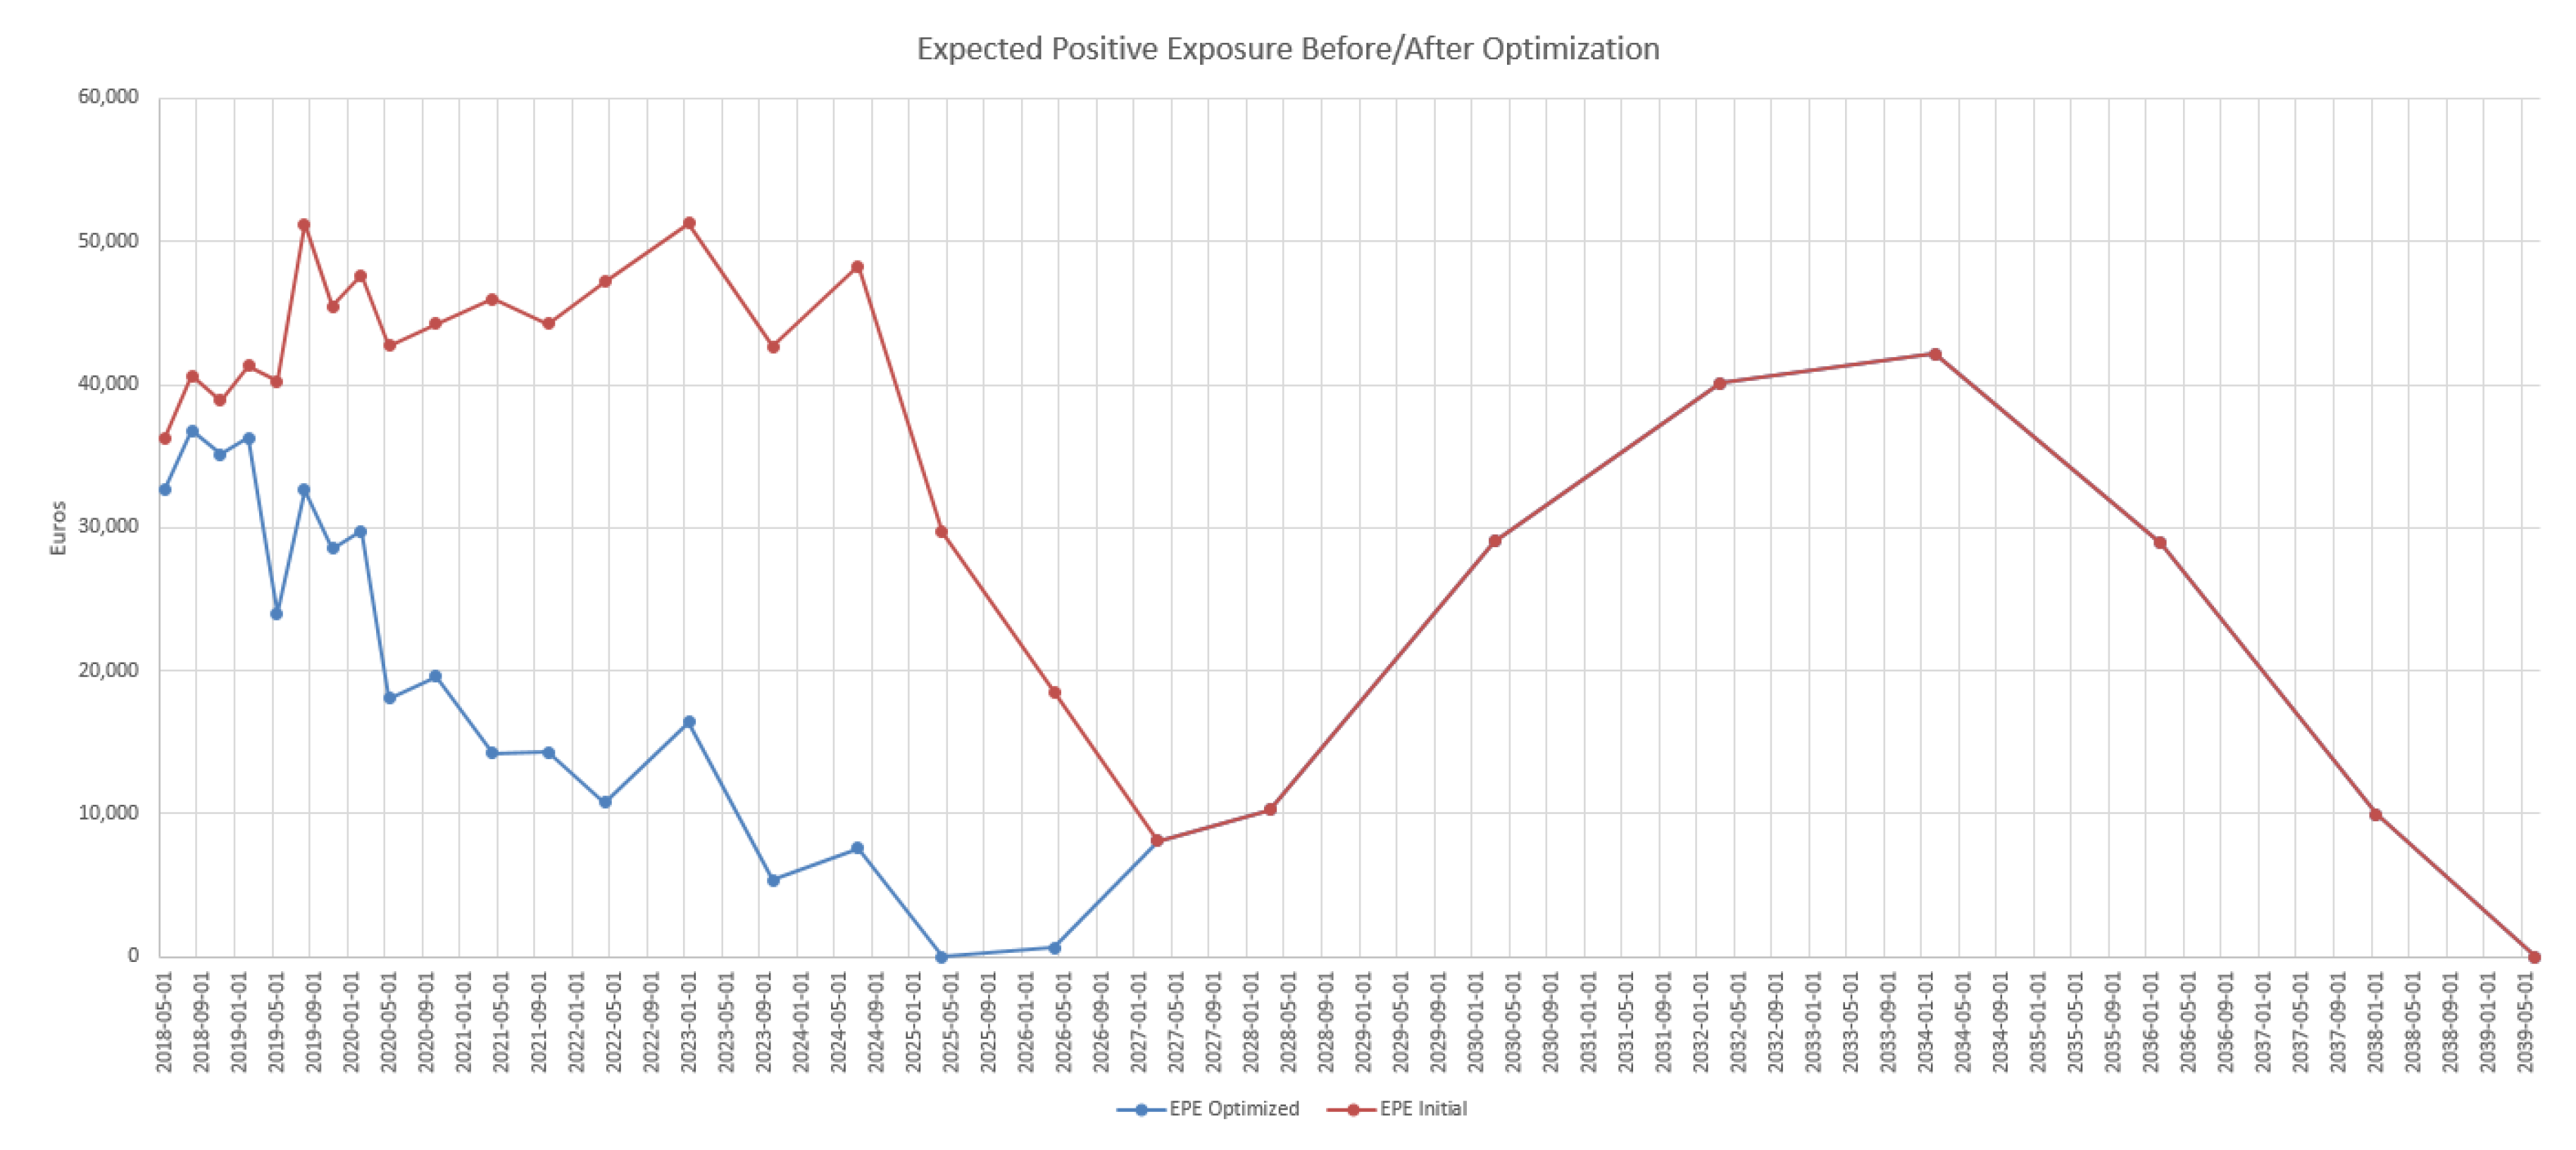
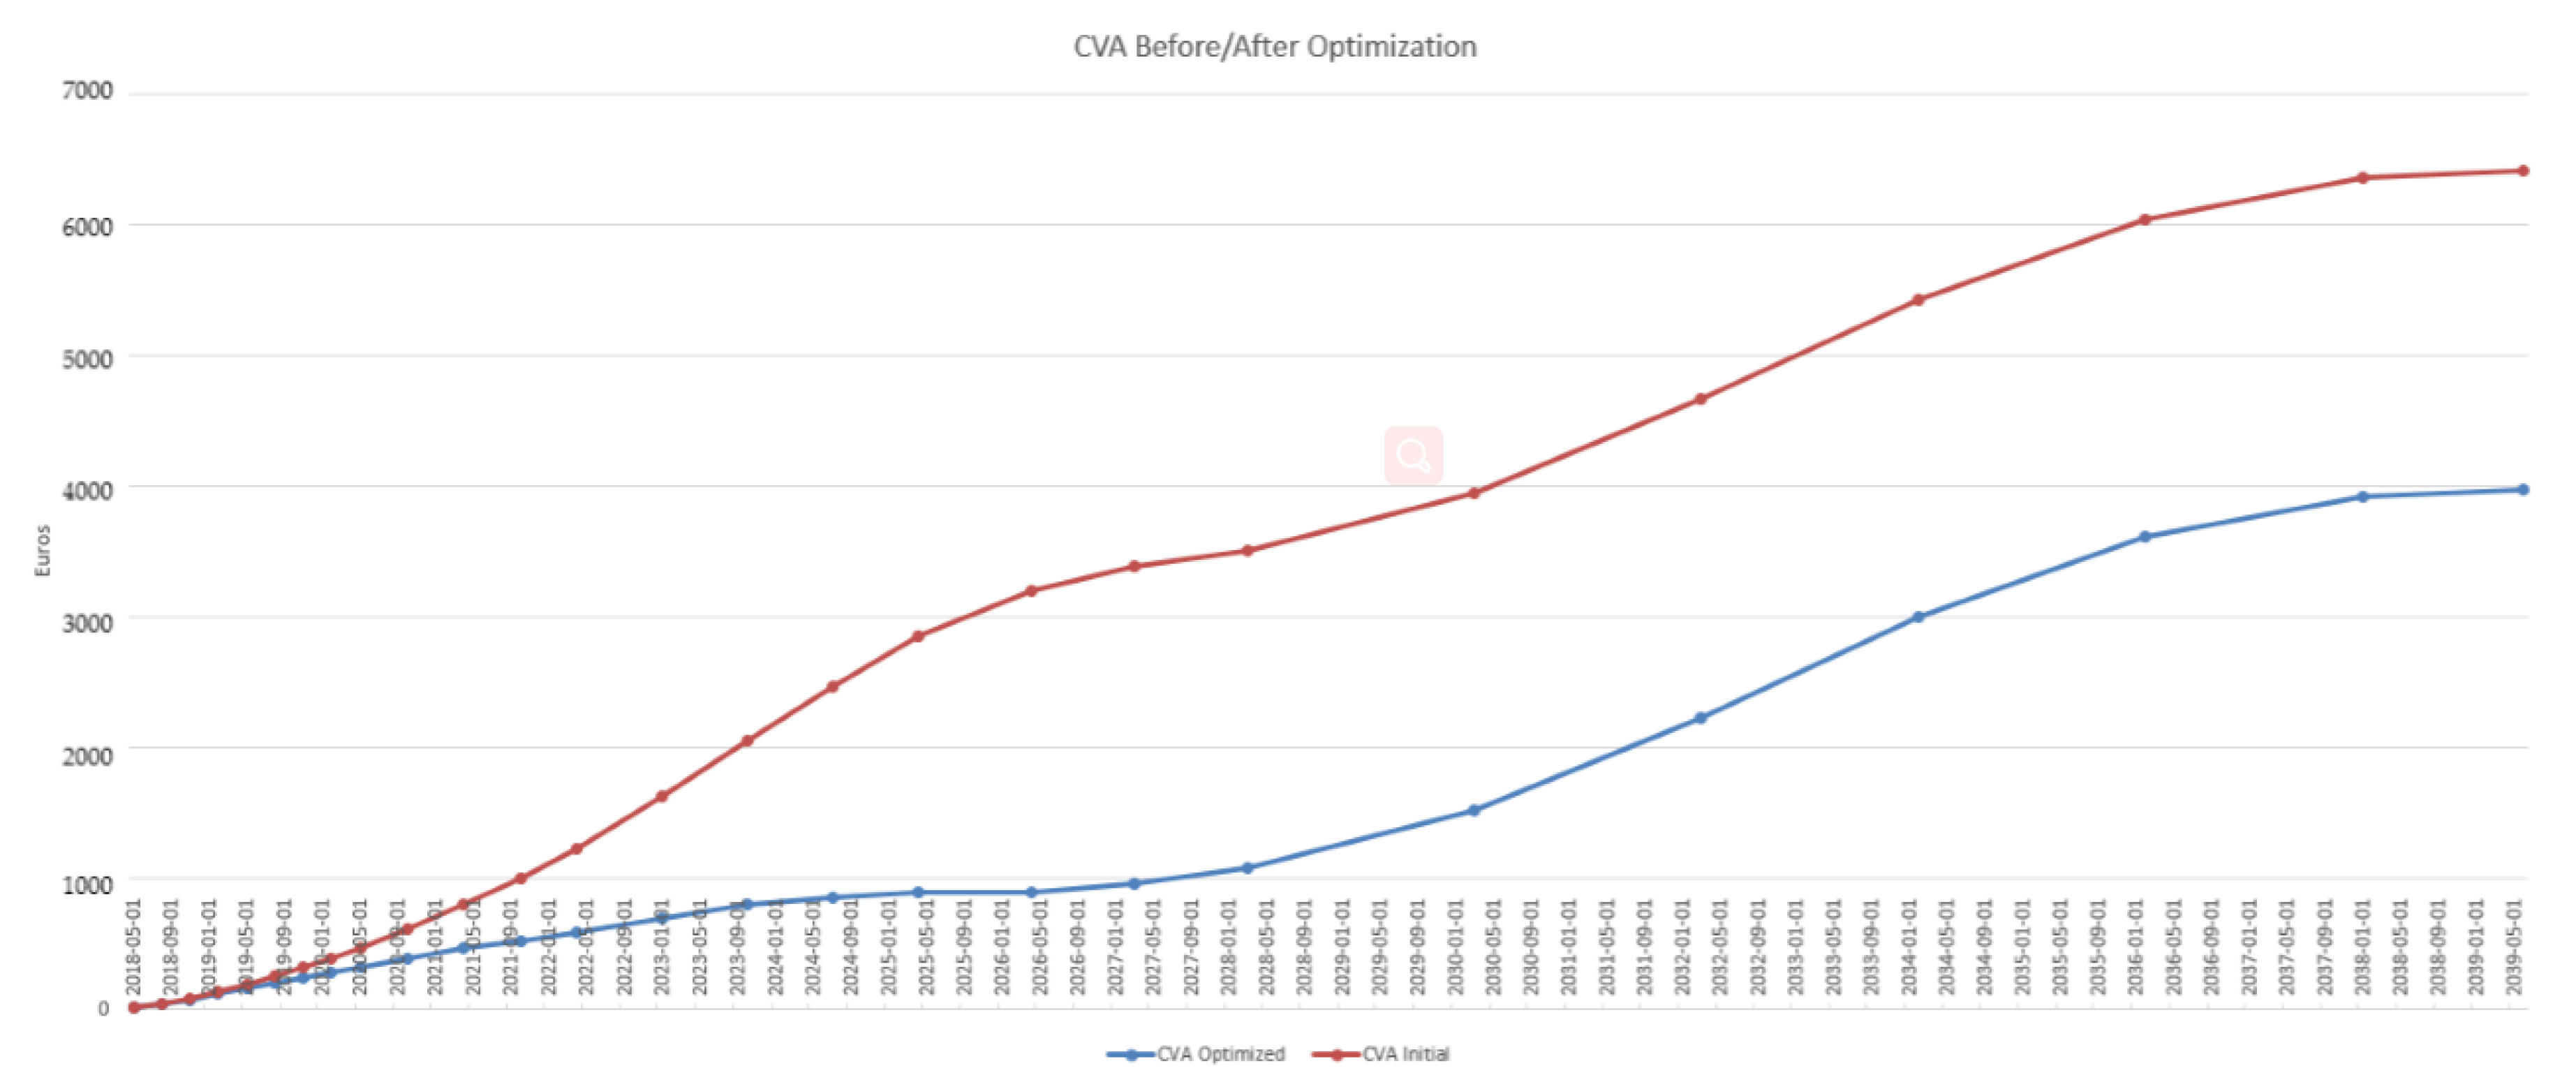
Next, we challenge our algorithm with a more balanced initial portfolio, as shown in Figure 10 (to be compared with Figure 3). The initial CVA is now 6410€. We set the regularization parameter α in Equation (7) to 0.3, as opposed to 1 in the previous case, in view of the lower CVA of the initial portfolio.
As visible in Table 3 and Figure 11, the stabilization of the algorithm occurs after three iterations, showing that, for the hybrid portfolio, | DV 01 | penalization and Δ CVA play less antagonistic roles. This is obtained by a relatively small notional and a maturity limited to 9 years, versus 11 years in the previous case of a payer portfolio with penalization. The corresponding market risk and CVA profiles, before and after the optimization, are displayed in Figure 12 and Figure 13. Figure 12 explains the choices operated by the algorithm: as we restrict our incremental strategy to one swap, the algorithm limits the EPE until the first positive peak before 2026. A better strategy, but one outside our search space A , would be to add a second swap with entry date in 2028 and end date in 2037.

5. Conclusions

There exists a trade-off between CVA compression and DV 01 penalization, which have antagonistic influences on the incremental exposure. Provided the search space for incremental trades is adequately chosen and parameterized, genetic optimization can result in significant CVA gains and, under DV 01 penalization, this can be achieved without too much impact on the market risk of the bank position.
On the portfolios considered in our case studies, with 10–20 trades, a basic XVA compression run on a standard PC without the acceleration techniques of Section 3 takes about 20 h. The time gain resulting from an MtM store-and-reuse implementation of the trade incremental XVA computations as per Section 3.1 primarily depends on the size of the initial portfolio, but also on the maturity, and complexity more generally (vanilla vs. callable or path-dependent, etc.), of the constituting trades. Likewise, the time gain resulting from a parallel implementation of the genetic algorithm as per Section 3.2 primarily depends on the population size P, but it can be deteriorated by grid latency, hardware limitation, or data flow management features. In our simulations, an MtM store-and-reuse implementation of the trade incremental XVA computations reduces the XVA compression time to about 7 h. A further parallel implementation of the genetic optimization algorithm lowers the execution time to about 1 h.
The case study of this paper is only a first step toward more complex optimizations. One could thus enlarge the search space with, e.g., crosscurrency swaps. In this case, the market risk penalization should be revisited to penalize other risk factors, beyond interest rate risk that is already accounted for by | DV 01 | . The penalization could also be refined with a focus on forward mark-to-market, i.e., market risk in the future (our current | DV 01 | penalization only controls spot market risk).
CVA compression strategies involving several additional trades could be implemented. A first step toward such a multi-variate, multi-trade, compression would be an iterated application of single-trade XVA compressions, whereby, after each compression, the optimally augmented portfolio becomes the initial portfolio for the next compression. The benefit of such an iterative approach would be the ability to work with a search space A (or a sequence of them) of constant size, as opposed to a global search space A that would need to grow exponentially with the number of new trades in the case of a single multi-trade compression cycle.
Additional XVA metrics, and ultimately the all-inclusive XVA add-on in Equation (1), should be included in the compression (which, in particular, would allow one to identify possible XVA cuts across different netting sets).

Author Contributions

Conceptualization, M.C. and S.C.; methodology, M.C.; software, M.C.; validation, M.C.; formal analysis, M.C. investigation, M.C. and S.C.; writing—original draft preparation, S.C.; writing—review and editing, S.C.; supervision, S.C.; project administration, S.C.; and funding acquisition, S.C.

Funding

This research was conducted with the support of the Research Initiative “Modélisation des marchés actions, obligations et dérivés” financed by HSBC France under the aegis of the Europlace Institute of Finance. The views and opinions expressed in this presentation are those of the author alone and do not necessarily reflect the views or policies of HSBC Investment Bank, its subsidiaries or affiliates. The PhD thesis of Marc Chataigner is co-funded by a public grant as part of investissement d’avenir project, reference ANR-11-LABX-0056-LLH LabEx LMH.

Acknowledgments

The authors would like to thank Hugo Lebrun, Rémi Ligoureau, and Guillaume Macey (HSBC France) for their assistance in the conduct of this study.

Conflicts of Interest

The authors declare no conflict of interest. The funders had no role in the design of the study; in the collection, analyses, or interpretation of data; in the writing of the manuscript, or in the decision to publish the results.

Abbreviations

The following abbreviations are used in this manuscript:
CDSCredit default swap
CVACredit valuation adjustment
DV01Dollar value of an 01
EEExpected exposure
EPEExpected positive exposure
ENEExpected negative exposure
FVAFunding valuation adjustment
KVACapital valuation adjustment
MtMMark-to-market
MVAMargin valuation adjustment
OISOvernight indexed swap
OTCOver-the-counter
XVAGeneric “X” valuation adjustment

Appendix A. Single Point Crossover

Let ( p 1 , p 2 ) be a pair of chromosomes chosen as parents and let ( c 1 , c 2 ) denote the children. We assume that each chromosome has four genes A , B , C , D , that p 1 has gene versions { A 1 , B 1 , C 1 , D 1 } and p 2 has gene versions { A 2 , B 2 , C 2 , D 2 } . For a single point crossover, we draw uniformly an integer i such the first i genes for c 1 are inherited from p 1 and the remaining genes are transferred from p 2 to c 1 , and symmetrically so for c 2 . For instance, if we draw i = 2 , then c 1 has gene versions { A 1 , B 1 , C 2 , D 2 } , and c 2 has gene values { A 2 , B 2 , C 1 , D 1 } .

References

  1. Adler, Dan. 1993. Genetic algorithms and simulated annealing: A marriage proposal. Paper presented at the IEEE International Conference on Neural Networks, San Francisco, CA, USA, March 28–April 1; pp. 1104–9. [Google Scholar]
  2. Albanese, Claudio, and Stéphane Crépey. 2019. XVA Analysis from the Balance Sheet. Available online: https://math.maths.univ-evry.fr/crepey (accessed on 3 August 2019).
  3. Albanese, Claudio, Marc Chataigner, and Stéphane Crépey. 2018. Wealth transfers, indifference pricing, and XVA compression schemes. In From Probability to Finance—Lecture Note of BICMR Summer School on Financial Mathematics. Mathematical Lectures from Peking University Series; Edited by Y. Jiao. Berlin: Springer. [Google Scholar]
  4. Back, Thomas. 1996. Evolutionary Algorithms in Theory and Practice: Evolution Strategies, Evolutionary Programming, Genetic Algorithms. Oxford: Oxford University Press. [Google Scholar]
  5. Basel Committee on Banking Supervision. 2015. Review of the Credit Valuation Adjustment Risk Framework. Consultative Document. Basel: Basel Committee on Banking Supervision. [Google Scholar]
  6. Bergstra, James, Rémi Bardenet, Yoshua Bengio, and Balázs Kégl. 2011. Algorithms for hyper-parameter optimization. In Advances in Neural Information Processing Systems. Cambridge: The MIT Press, pp. 2546–54. [Google Scholar]
  7. Blickle, Tobias, and Lothar Thiele. 1995. A Comparison of Selection Schemes Used in Genetic Algorithms. TIK-Report. Zurich: Computer Engineering and Networks Laboratory (TIK). [Google Scholar]
  8. Brigo, Damiano, and Frédéric Vrins. 2018. Disentangling wrong-way risk: Pricing credit valuation adjustment via change of measures. European Journal of Operational Research 269: 1154–64. [Google Scholar] [CrossRef]
  9. Carvalho, Delmar, João Bittencourt, and Thiago Maia. 2011. The simple genetic algorithm performance: A comparative study on the operators combination. Paper presented at the First International Conference on Advanced Communications and Computation, Barcelona, Spain, October 23–29. [Google Scholar]
  10. Chen, Shu-Heng. 2012. Genetic Algorithms and Genetic Programming in Computational Finance. Berlin: Springer Science & Business Media. [Google Scholar]
  11. Cont, Rama, and Sana Ben Hamida. 2005. Recovering volatility from option prices by evolutionary optimization. Journal of Computational Finance 8: 43–76. [Google Scholar] [CrossRef]
  12. Crépey, Stéphane, and Shiqi Song. 2016. Counterparty risk and funding: Immersion and beyond. Finance and Stochastics 20: 901–30. [Google Scholar] [CrossRef]
  13. Crépey, Stéphane, and Shiqi Song. 2017. Invariance Properties in the Dynamic Gaussian Copula Model. ESAIM: Proceedings and Surveys 56: 22–41. [Google Scholar] [CrossRef] [Green Version]
  14. Crépey, Stéphane, Rodney Hoskinson, and Bouazza Saadeddine. 2019. Balance Sheet XVA by Deep Learning and GPU. Available online: https://math.maths.univ-evry.fr/crepey (accessed on 3 August 2019).
  15. Del Moral, Pierre. 2004. Feynman-Kac Formulae: Genealogical and Interacting Particle Systems With Applications. Berlin: Springer. [Google Scholar]
  16. Drake, Adrian E., and Robert E. Marks. 2002. Genetic algorithms in economics and finance: Forecasting stock market prices and foreign exchange—A review. In Genetic Algorithms and Genetic Programming in Computational Finance. Berlin: Springer, pp. 29–54. [Google Scholar]
  17. Glasserman, Paul, and Linan Yang. 2018. Bounding wrong-way risk in CVA calculation. Mathematical Finance 28: 268–305. [Google Scholar] [CrossRef]
  18. Goldberg, David. 1989. Genetic Algorithms in Search Optimization and Machine Learning. Boston: Addison-Wesley. [Google Scholar]
  19. Gregory, Jon. 2015. The xVA Challenge: Counterparty Credit Risk, Funding, Collateral and Capital. Hoboken: Wiley. [Google Scholar]
  20. Holland, John H. 1975. Adaptation in Natural and Artificial Systems: An Introductory Analysis with Applications to Biology, Control and Artificial Intelligence. Ann Arbor: University of Michigan Press. [Google Scholar]
  21. Hull, John, and Alan White. 2012. CVA and wrong way risk. Financial Analyst Journal 68: 58–69. [Google Scholar] [CrossRef]
  22. Iben Taarit, M. 2018. Pricing of XVA Adjustments: From Expected Exposures to Wrong-Way risks. Ph.D. thesis, Université Paris-Est, Marne-la-Vallée, France. Available online: https://pastel.archives-ouvertes.fr/tel-01939269/document (accessed on 3 August 2019).
  23. Janaki Ram, D., T. Sreenivas, and K. Ganapathy Subramaniam. 1996. Parallel simulated annealing algorithms. Journal of Parallel and Distributed Computing 37: 207–12. [Google Scholar]
  24. Jin, Zhuo, Zhixin Yang, and Quan Yuan. 2019. A genetic algorithm for investment-consumption optimization with value-at-risk constraint and information-processing cost. Risks 7: 32. [Google Scholar] [CrossRef]
  25. Kondratyev, Alexei, and George Giorgidze. 2017. Evolutionary Algos for Optimising MVA. Risk Magazine. December. Available online: https://www.risk.net/cutting-edge/banking/5374321/evolutionary-algos-for-optimising-mva (accessed on 3 August 2019).
  26. Kroha, Petr, and Matthias Friedrich. 2014. Comparison of genetic algorithms for trading strategies. Paper presented at International Conference on Current Trends in Theory and Practice of Informatics, High Tatras, Slovakia, January 25–30; Berlin: Springer, pp. 383–94. [Google Scholar]
  27. Larranaga, P., C. Kuijpers, R. Murga, I. Inza, and S. Dizdarevic. 1999. Genetic algorithms for the travelling salesman problem: A review of representations and operators. Artificial Intelligence Review 13: 129–70. [Google Scholar] [CrossRef]
  28. Li, Minqiang, and Fabio Mercurio. 2015. Jumping with Default: Wrong-Way Risk Modelling for CVA. Risk Magazine. November. Available online: https://www.risk.net/risk-management/credit-risk/2433221/jumping-default-wrong-way-risk-modelling-cva (accessed on 3 August 2019).
  29. Pardalos, Panos, Leonidas Pitsoulis, T. Mavridou, and M. Resende. 1995. Parallel search for combinatorial optimization: Genetic algorithms, simulated annealing, tabu search and GRASP. Paper presented at International Workshop on Parallel Algorithms for Irregularly Structured Problems, Lyon, France, September 4–6; Berlin: Springer, pp. 317–31. [Google Scholar]
  30. Pykhtin, Michael. 2012. General wrong-way risk and stress calibration of exposure. Journal of Risk Management in Financial Institutions 5: 234–51. [Google Scholar]
  31. Rios, Luis, and Nikolaos Sahinidis. 2013. Derivative-free optimization: A review of algorithms and comparison of software implementations. Journal of Global Optimization 56: 1247–93. [Google Scholar] [CrossRef]
  32. Snoek, Jasper, Hugo Larochelle, and Ryan Adams. 2012. Practical Bayesian optimization of machine learning algorithms. In Advances in Neural Information Processing Systems. Cambridge: The MIT Press, pp. 2951–59. [Google Scholar]
  33. Tabassum, Mujahid, and Mathew Kuruvilla. 2014. A genetic algorithm analysis towards optimization solutions. International Journal of Digital Information and Wireless Communications (IJDIWC) 4: 124–42. [Google Scholar] [CrossRef]
  34. Turing, Alan M. 1950. Computing machinery and intelligence. Mind 59: 433–60. [Google Scholar] [CrossRef]
  35. Verma, Rajeev, and P. Lakshminiarayanan. 2006. A case study on the application of a genetic algorithm for optimization of engine parameters. Proceedings of the Institution of Mechanical Engineers, Part D: Journal of Automobile Engineering 220: 471–79. [Google Scholar] [CrossRef]
  36. Young, Steven, Derek Rose, Thomas Karnowski, Seung-Hwan Lim, and Robert Patton. 2015. Optimizing deep learning hyper-parameters through an evolutionary algorithm. Paper presented at Workshop on Machine Learning in High-Performance Computing Environments, Austin, TX, USA, November 15; p. 4. [Google Scholar]
1
See also, e.g., David Bachelier’s panel discussion Capital and Margin Optimisation, Quantminds International 2018 conference, Lisbon, 16 May 2018.
2
For details regarding the initial margin and the MVA, see (Crépey et al. 2019, sets. 5.2 and 6.4).
3
The underlying interest rate and FX models are proprietary and cannot be disclosed in the paper. We use a deterministic credit spread model for the counterparty, calibrated to the CDS term structure of the latter.
4
Term structure obtained by integrating the EPE profile against the CDS curve of the counterparty from time 0 to an increasing upper bound t T (cf. Equation (3)).
Figure 1. Skeleton of an optimization genetic algorithm.
Risks 07 00100 g001
Figure 2. MtM store-and-reuse implementation of a trade incremental XVA engine with drivers Z.
Risks 07 00100 g002
Figure 3. Market risk profile of the portfolio (payer portfolio without penalization).
Risks 07 00100 g003
Figure 4. Fitness value as a function of iteration number (payer portfolio without penalization).
Risks 07 00100 g004
Figure 5. Market risk profile of the portfolio before and after optimization (payer portfolio without penalization).
Risks 07 00100 g005
Figure 6. CVA profile before and after optimization (payer portfolio without penalization).
Risks 07 00100 g006
Figure 7. Fitness as a function of iteration number (payer portfolio with penalization).
Risks 07 00100 g007
Figure 8. Market risk profile of portfolio before and after optimization (payer portfolio with penalization).
Risks 07 00100 g008
Figure 9. CVA profile before and after optimization (payer portfolio with penalization).
Risks 07 00100 g009
Figure 10. Market risk profile of the portfolio (hybrid portfolio with penalization).
Risks 07 00100 g010
Figure 11. Fitness value as a function of iteration number (hybrid portfolio with penalization).
Risks 07 00100 g011
Figure 12. Market risk profile of portfolio before and after optimization (hybrid portfolio with penalization).
Risks 07 00100 g012
Figure 13. CVA profile before and after optimization (hybrid portfolio with penalization).
Risks 07 00100 g013
Table 1. Evolution of optimal solutions after each iteration (payer portfolio without penalization).
Iter.Mat. (yrs)Not. (K€)Rate (%)Curr.Pos. Δ CVA (€) Δ CVA CVA (in %)|DV01|(€)
0104,800,0001.6471GBPReceive−801923.04484
104,700,0001.6471GBPReceive−794822.84390
104,600,0001.6471GBPReceive−787222.54297
1175,600,0001.4623EURReceive−17,24949.48648
125,400,0001.7036GBPReceive−916326.25957
163,900,0000.6377JPYReceive−876025.16137
2146,600,0001.3416EURReceive−21,68062.18626
175,100,0001.4623EURReceive−19,72956.57875
175,600,0001.4623EURReceive−17,24949.48648
3146,600,0001.3416EURReceive−21,68062.18626
175,100,0001.4623EURReceive−19,72956.57875
175,600,0001.4623EURReceive−17,24949.48648
4173,300,0001.4623EURReceive−27,30078.25096
126,100,0001.2203EURReceive−25,38272.76959
115,600,0001.147EURReceive−23,00965.95908
5173,300,0001.4623EURReceive−27,30078.25096
126,100,0001.2203EURReceive−25,38272.76959
125,100,0001.2203EURReceive−25,26472.35818
Table 2. Evolution of optimal solutions after each iteration (payer portfolio with penalization).
Iter.Mat. (yrs)Not. (K€)Rate (%)Curr.Pos. Δ CVA (€) Δ CVA CVA (in %)|DV01|(€)
0104,500,0001.6471GBPReceive−779022.34218
104,600,0001.6471GBPReceive−787122.54311
104,700,0001.6471GBPReceive−794722.84405
1175,600,0001.4731EURReceive−16,89248.48706
104,500,0001.6471GBPReceive−779022.34217
104,600,0001.6471GBPReceive−787122.54311
2146,600,0001.3336EURReceive−21,88862.78654
175,600,0001.4731EURReceive−16,89248.48706
176,100,0001.4531EURReceive−15,03843.19466
3146,600,0001.3336EURReceive−21,88862.78654
175,600,0001.4731EURReceive−16,89248.48706
94,500,0000.9584EURReceive−10,45429.93945
4106,600,0001.3336EURReceive−21,88862.78654
116,600,0001.3999EURReceive−18,82553.99207
175,600,0001.4731EURReceive−16,89248.48706
5112,900,0001.3811EURReceive−25,05971.74039
181,500,0001.48EURReceive−18,25852.32442
171,500,0001.4531EURReceive−16,55347.42327
Table 3. Evolution of optimal solutions after each iteration (hybrid portfolio with penalization).
Iter.Mat. (yrs)Not. (K€)Rate (%)Curr.Pos. Δ CVA (€) Δ CVA CVA (in %)|DV01|(€)
016,000,0000.025JPYReceive14-0.2609
16,100,0000.025JPYReceive14−0.2619
16,300,0000.025JPYReceive14−0.2640
181,500,0000.8565EURReceive−190529.71177
62,300,0000.586EURReceive−116618.21370
9700,0001.608GBPReceive−82012.8595
281,500,0000.8565EURReceive−190529.71177
62,300,0000.586EURReceive−116618.21370
9700,0001.608GBPReceive−8212.8595
391,900,0000.9584EURReceive−228435.61665
81,500,0000.8565EURReceive−190529.71177
72,700,0000.7225EURReceive−162825.41865
491,900,0000.9584EURReceive−228435.61665
81,500,0000.8565EURReceive−190529.71177
72,700,0000.7225EURReceive−162825.41865
591,900,0000.9584EURReceive−228435.61665
81,500,0000.8565EURReceive−190529.71177
92,500,0000.9584EURReceive−194230.32192