1. Introduction
Inflation expectations are a crucial component of modern monetary policy, shaping how households and firms respond to economic conditions and policy signals (
Adrian 2023). The central bank’s ability to support price stability, strengthen the credibility of inflation-targeting frameworks, and ensure effective policy transmission depends on well-formed inflation expectations (
International Monetary Fund 2023;
Baddeley 2019). When individuals hold informed and stable expectations, central banks can guide consumption, saving, and investment behavior in ways that help stabilize output and maintain macroeconomic balance (
International Monetary Fund 2023;
Adrian 2023;
Weber et al. 2022). In contrast, poorly informed or highly dispersed expectations can weaken policy transmission, contribute to persistent deviations from target inflation, and heighten economic uncertainty (
Coibion and Gorodnichenko 2025;
Das et al. 2019;
Ghaderi et al. 2024). Hence, understanding the mechanisms through which individuals form inflation expectations is essential for designing effective and credible monetary policy.
Individuals form inflation expectations by drawing on available economic information, observing price movements, and incorporating signals from forecasts and public communication (
Albagli et al. 2025;
Ogura et al. 2026). Macroeconomic theory further suggests that the mechanisms underlying expectation formation vary across short-, medium-, and long-term horizons (
Sims 2003;
Mankiw and Reis 2002;
Bansal and Yaron 2004).
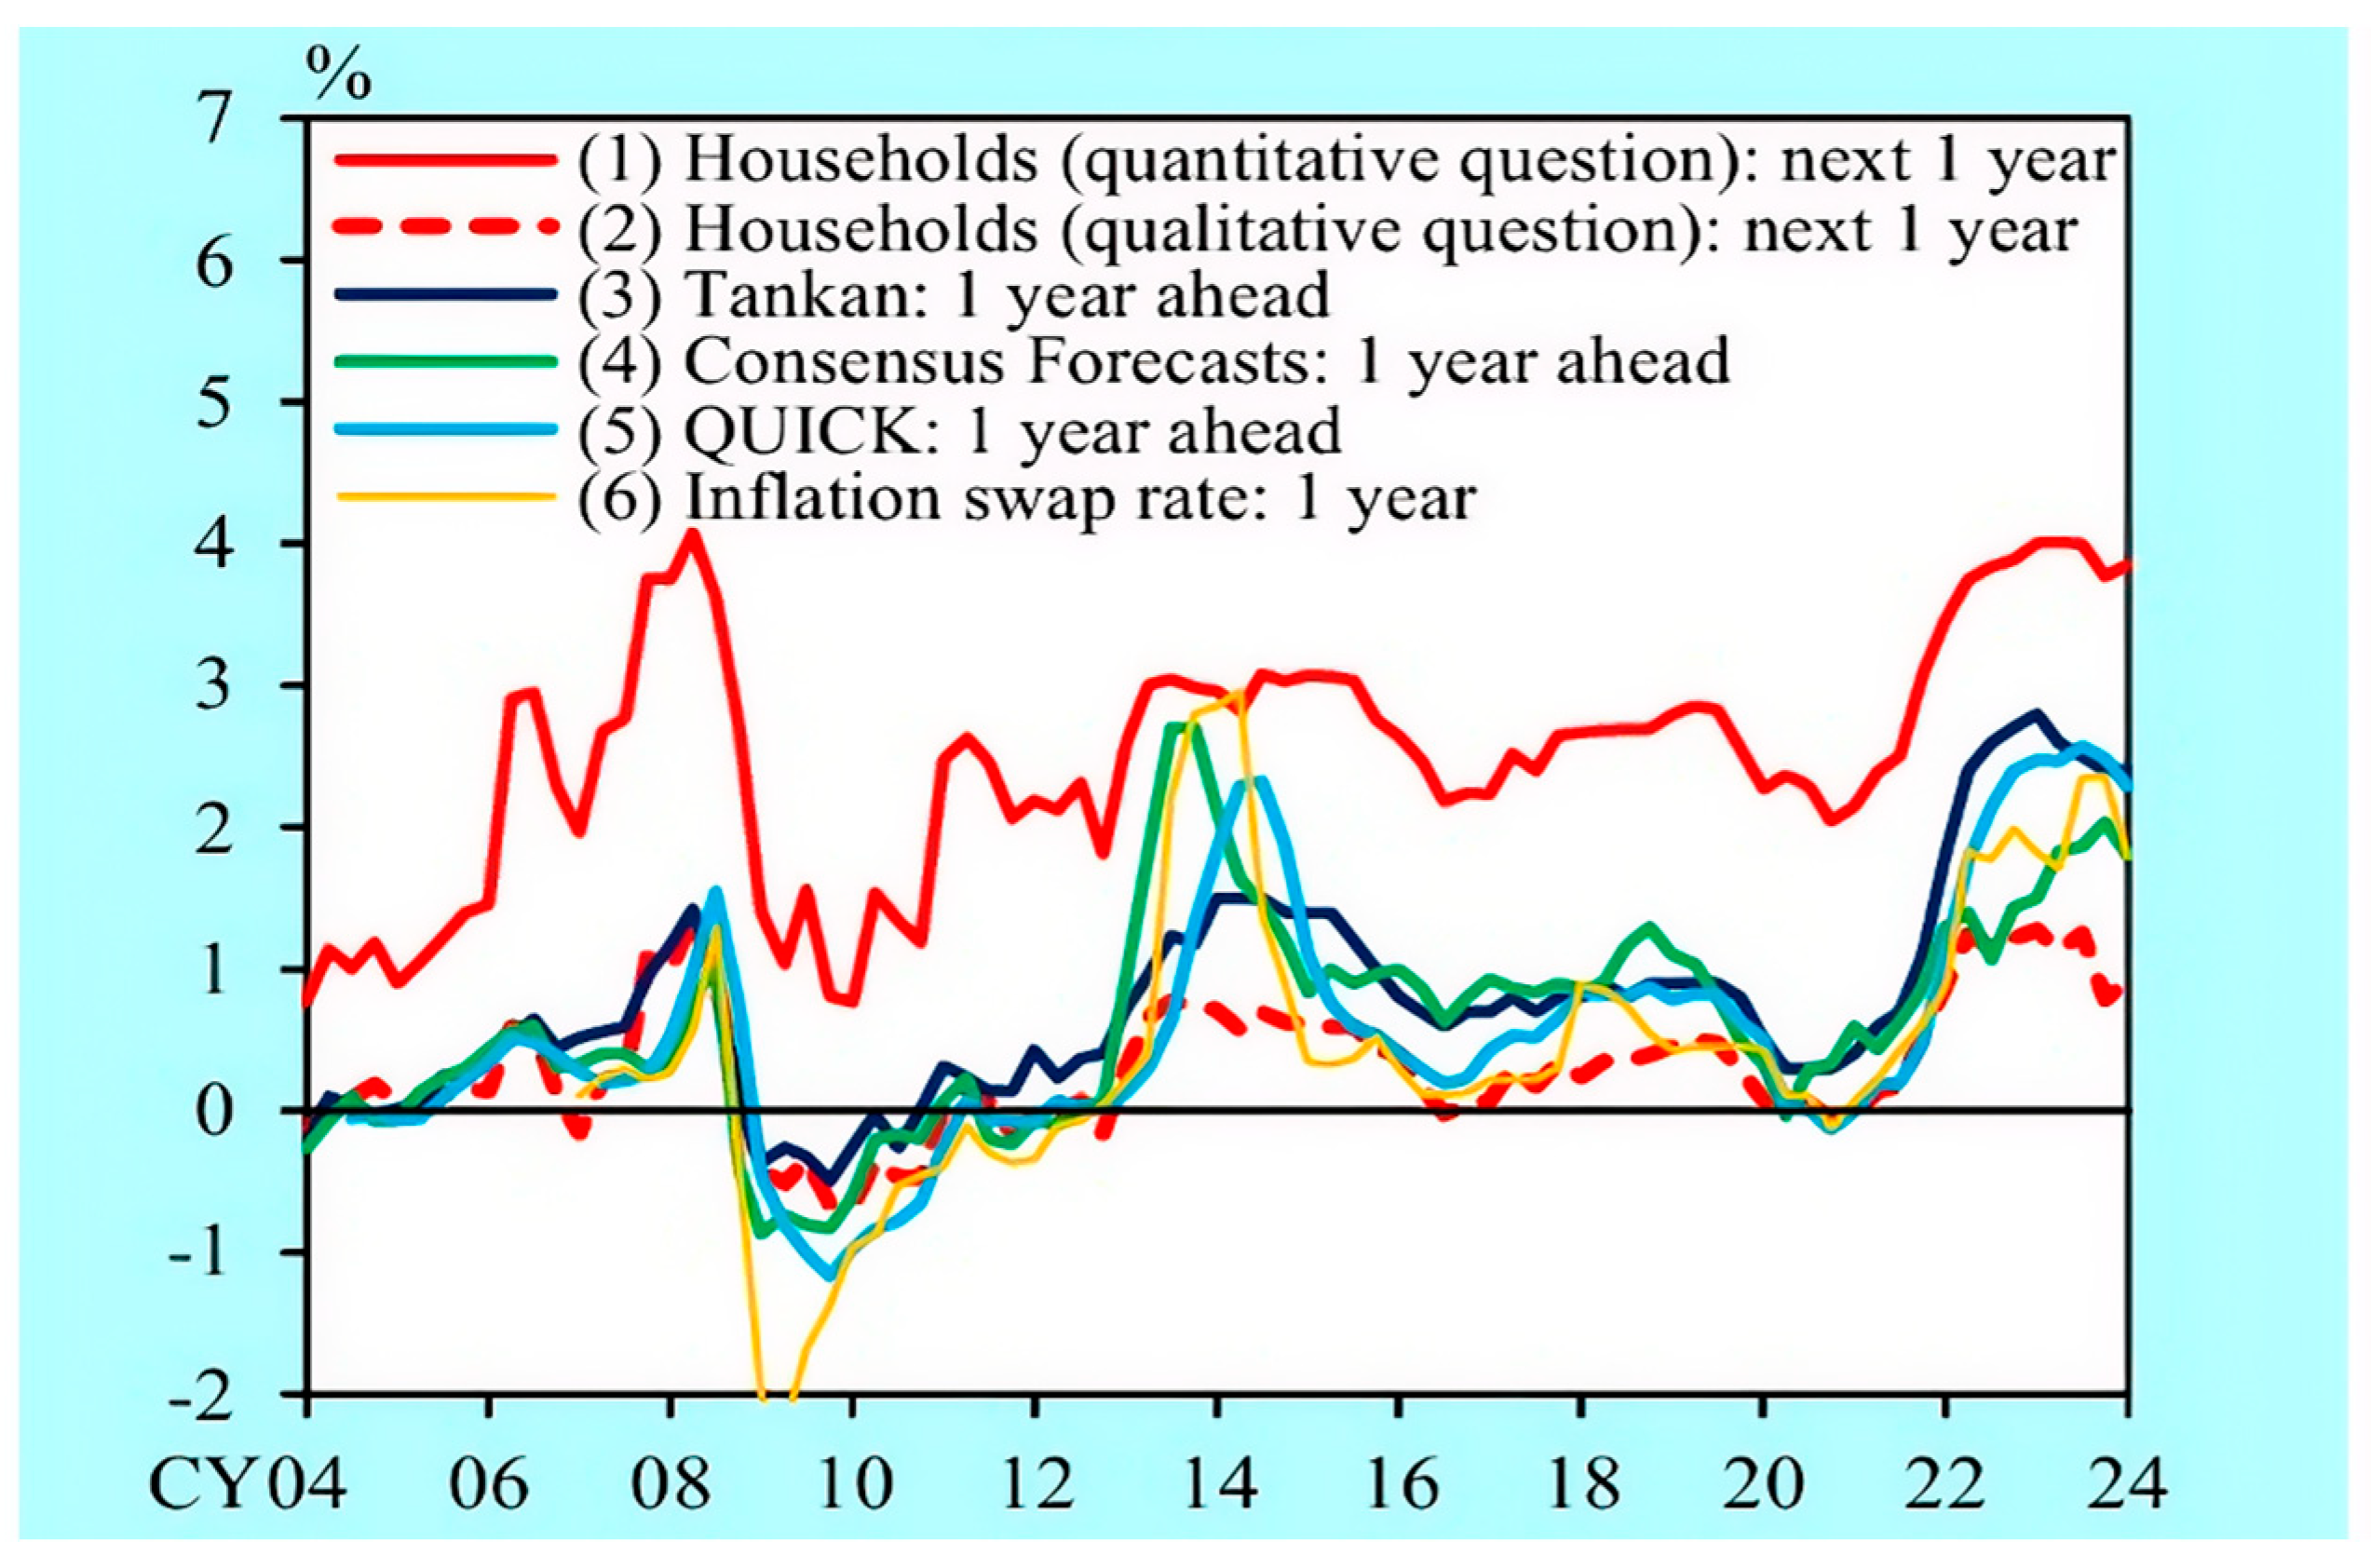
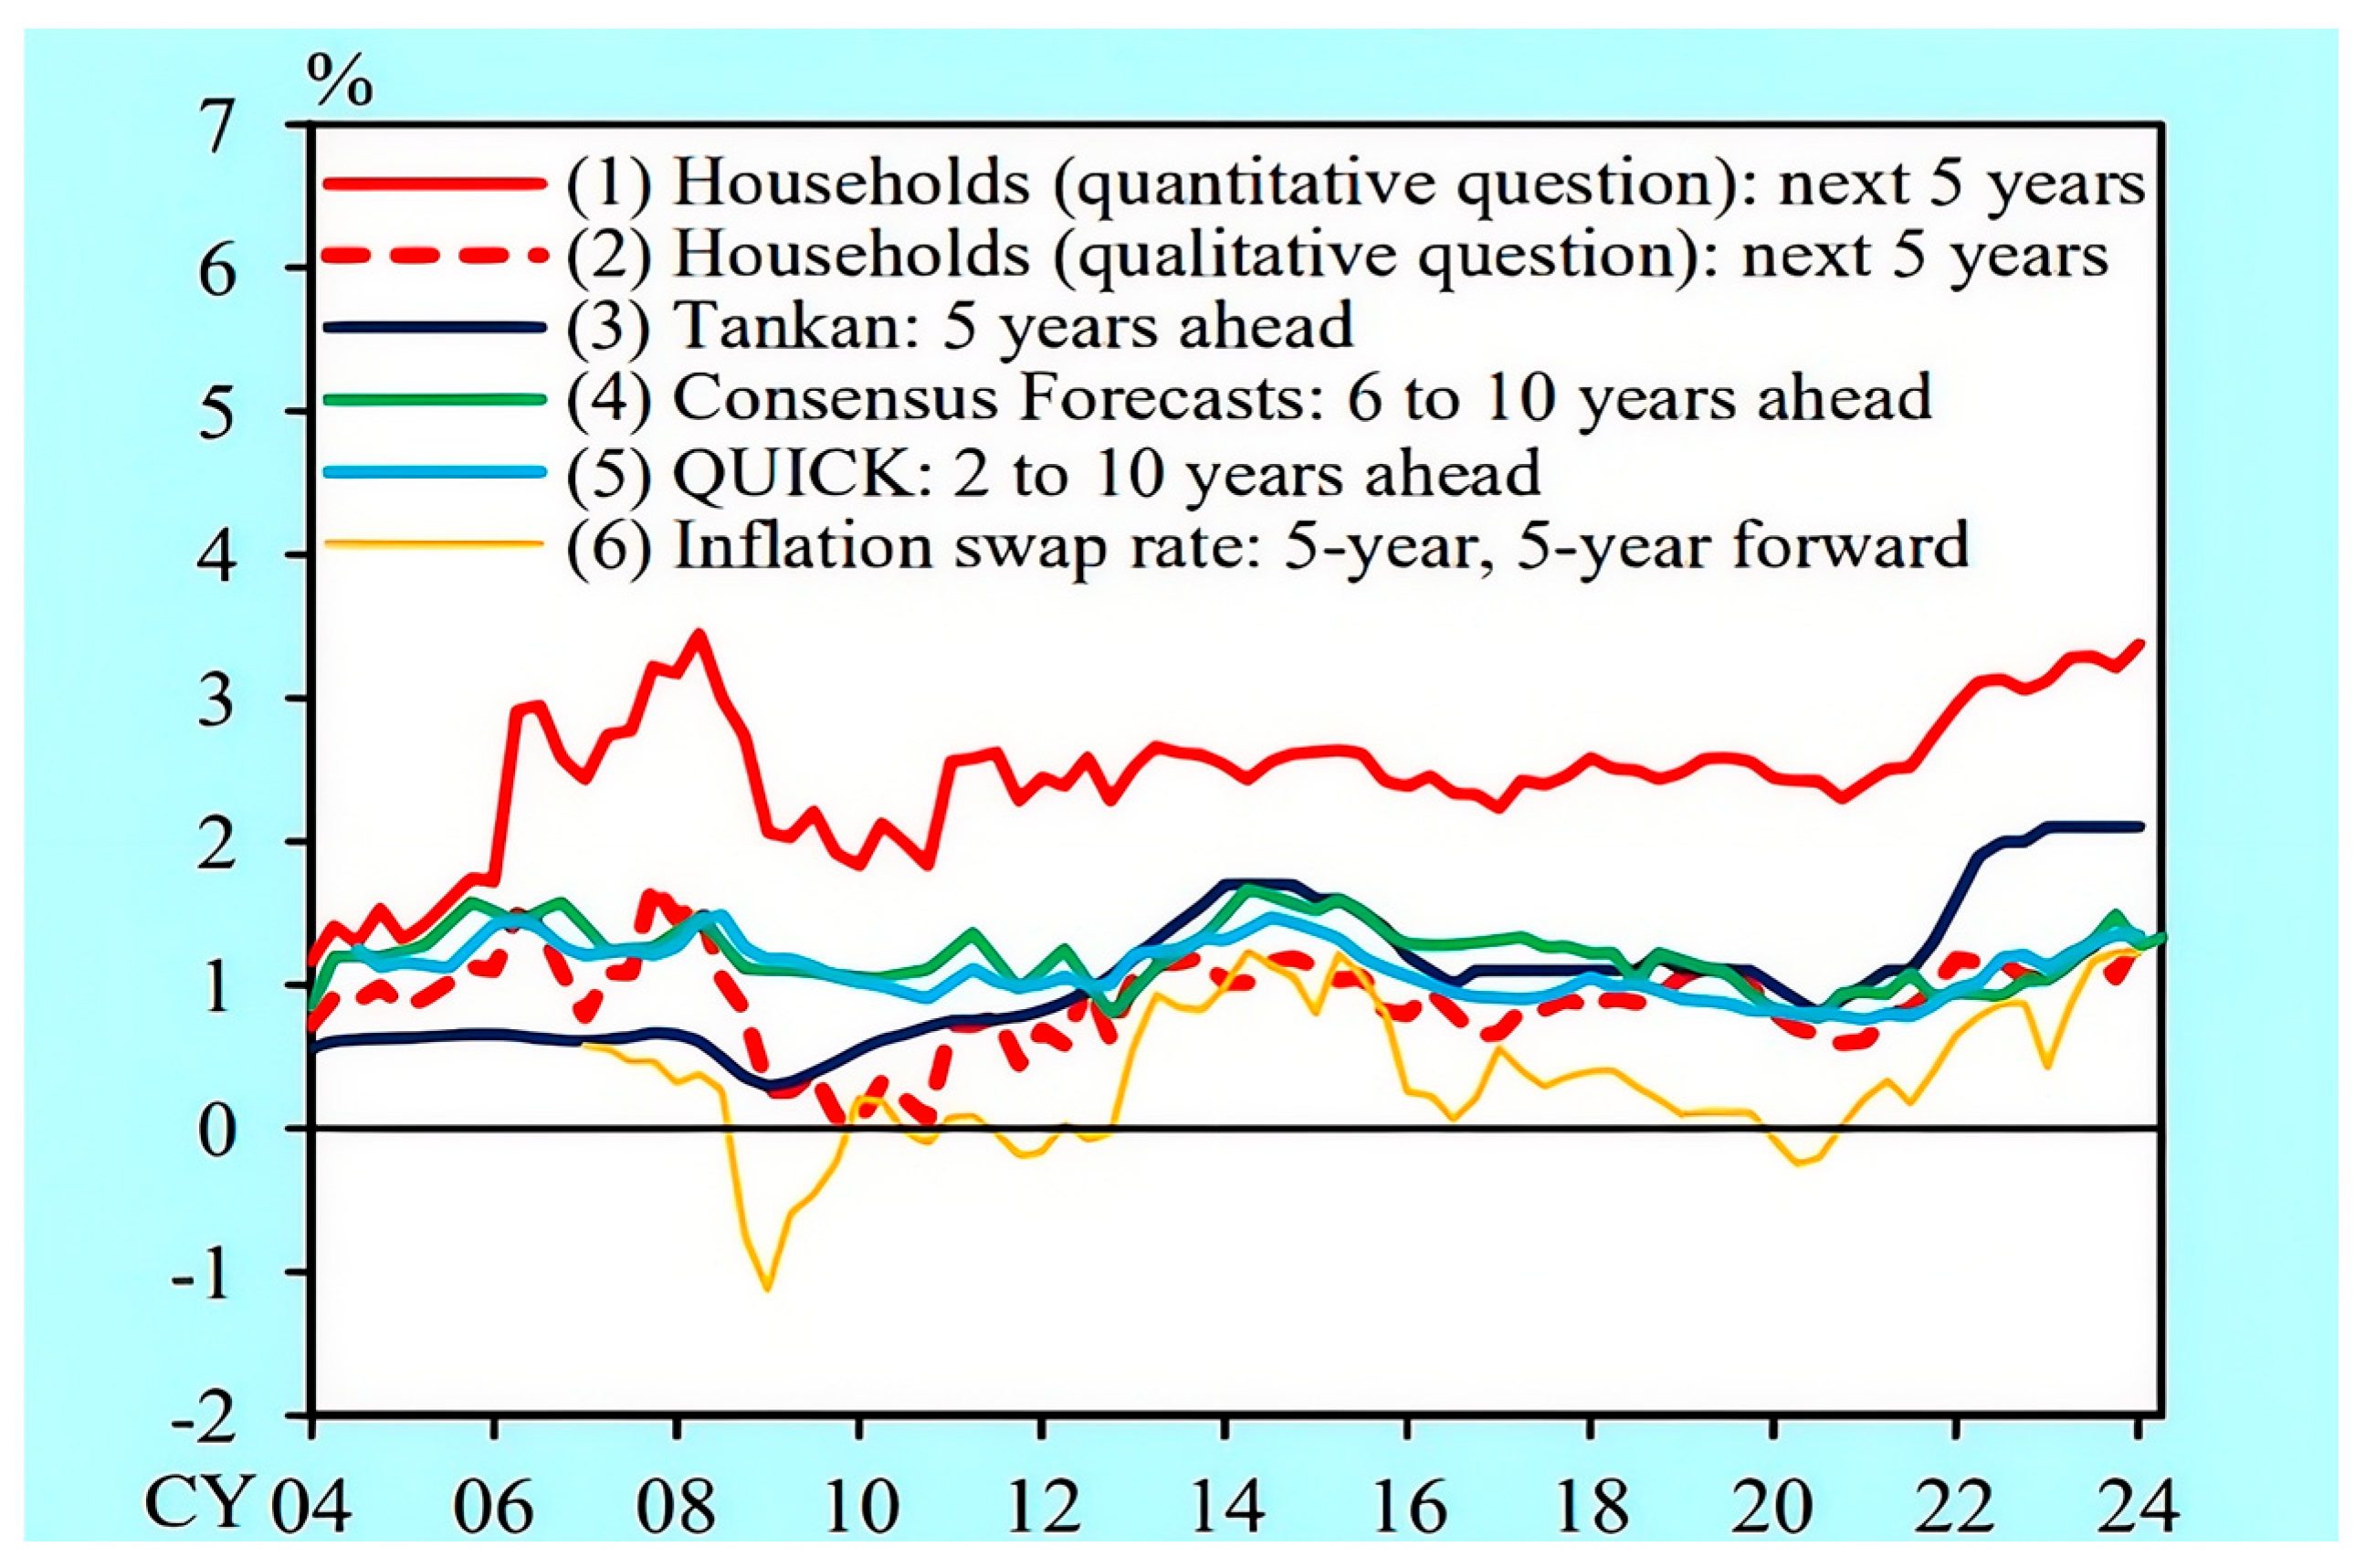
Figure 1 and
Figure 2 illustrate these horizon-dependent patterns in the Japanese context, showing how short-term expectations respond more strongly to recent price movements, while medium- to long-term expectations remain more stable and heterogeneous across individuals.
Building on these horizon-dependent patterns, the rapid digitization of financial activity has created a need for a broader and more specialized competency (
Röttger and Vedres 2020), one that extends beyond traditional information-processing skills on which individuals have historically relied when forming expectations. Such competency would enable individuals to navigate complex digital financial ecosystems and form more informed and macro-consistent inflation expectations (
Tsapin and Faryna 2025;
D’Acunto et al. 2024). Among these, digital financial literacy (DFL, hereafter) has emerged as a multidimensional construct encompassing digital device use, navigation of digital financial services, sound financial attitudes, and protection against online risks (
Shiiku et al. 2026;
Amarsanaa et al. 2025;
Lal et al. 2025). Individuals with higher DFL may be better equipped to filter and evaluate online financial information and interpret price developments (
Bawalle et al. 2026), which may be associated with more systematic processing of economic signals when forming inflation expectations.
Several mechanisms link DFL to the way individuals form inflation expectations across different horizons. First, in the short term, DFL may be associated with a greater ability to filter out transitory price movements and noise. This is consistent with rational inattention theory, which predicts that agents facing information processing constraints allocate attention optimally, focusing on relevant signals and avoiding overreaction to temporary shocks (
Sims 2003). Therefore, individuals with higher DFL may place less weight on recent inflation spikes and more weight on stable policy signals, leading to lower short-term expectations. Second, over medium-term horizons, sticky-information and adaptive-learning models suggest that individuals update their beliefs gradually as they acquire and process new information (
Mankiw and Reis 2002;
Evans and Honkapohja 2001). In this context, higher DFL may be associated with more frequent or more systematic updating of economic beliefs, potentially allowing individuals to incorporate trend inflation, policy trajectories, and macroeconomic forecasts into their medium-term expectations. Third, in the long term, long-run risk models emphasize the role of structural factors, such as fiscal sustainability, demographic pressures, and global inflation dynamics in shaping expectations (
Bansal and Yaron 2004). Hence, individuals with higher DFL may be more likely to consider these slow-moving risks, which could be reflected in higher long-term inflation expectations. Together, these mechanisms suggest that DFL may be associated with how individuals process information and form beliefs in a horizon-dependent manner, consistent with established macroeconomic theories of expectation formation.
Despite the growing theoretical relevance of DFL for inflation expectation formation, empirical evidence directly linking DFL to inflation expectations across multiple horizons remains scarce. While a growing body of research examines DFL (
Amarsanaa et al. 2025;
Bawalle et al. 2026;
Shiiku et al. 2026;
Lal et al. 2025;
Choung et al. 2023;
Lyons and Kass-Hanna 2021) and how individuals form inflation expectations (
Ogura et al. 2026;
D’Acunto et al. 2024;
Malmendier and Nagel 2016;
Coibion and Gorodnichenko 2015), these strands of work have largely evolved independently. To the best of our knowledge, no study has integrated this literature using large-scale survey data that capture both DFL measures and inflation expectations from the same respondents. The objective of this study is to address this gap by examining how DFL is associated with inflation expectations at short-, medium-, and long-term horizons using a large-scale online survey of more than 150,000 active Japanese investors and ordered probit regression models. Specifically, we examine whether the association between DFL and inflation expectations differs across short-, medium-, and long-term horizons, conditional on a broad set of demographic, socioeconomic, and behavioral characteristics.
The remainder of the paper is organized as follows.
Section 2 reviews the theoretical and empirical literature on DFL and inflation expectation formation.
Section 3 describes the data, variable construction, and econometric methodology.
Section 4 presents the empirical results.
Section 5 discusses the interpretation of the findings and their implications for horizon-dependent models of expectation formation.
Section 6 concludes with key insights, limitations, and directions for future research.
2. Review of the Literature and the Study Novelty
Recent research on inflation expectations increasingly emphasizes the heterogeneity in how individuals acquire, process, and interpret economic information. Empirical analyses demonstrate that households vary significantly in their attention to macroeconomic news, their capacity to extract signals from price changes, and their susceptibility to noisy information. These differences, shaped by variation in education, age, gender, race, economic knowledge, past inflation experiences, and attention costs (
D’Acunto et al. 2024,
2022;
Malmendier and Nagel 2016), result in persistent variation, bias, and gradual shifts in inflation expectations even under similar economic conditions (
Doh et al. 2024;
Pedemonte et al. 2025). Furthermore, recent studies highlight that information gaps, such as selective attention, limited economic knowledge, and asymmetric responsiveness to shocks, play a central role in generating expectation errors and deviations from rational benchmarks (
Coibion and Gorodnichenko 2015;
Gennaioli and Shleifer 2018). Nevertheless, much of the literature remains grounded in pre-digital information environments and fails to consider how online content, digital information overload, and algorithmically curated price signals influence individuals’ interpretation of inflation-related information, thereby limiting understanding of expectation formation in technology-mediated settings.
Given the heterogeneity in information processing, researchers have investigated how financial literacy, inflation literacy, and related cognitive skills influence the accuracy and coherence of inflation expectations. Individuals with higher levels of financial and inflation literacy tend to form expectations that align more closely with professional forecasts, exhibit less dispersion, and respond more effectively to macroeconomic fundamentals (
Bruine de Bruin et al. 2010;
Armantier et al. 2015;
Tsapin and Faryna 2025;
Ilan and Mugerman 2025;
Rumler and Valderrama 2020;
Dräger and Nghiem 2025). Additionally, individuals with stronger cognitive abilities and numeracy are better equipped to interpret economic signals, filter out irrelevant information, and update expectations in a more internally consistent manner (
D’Acunto et al. 2019;
Comerford 2025;
Burke and Manz 2014). Behavioral traits likewise influence expectation formation. For example, overconfidence leads individuals and firm managers to overweight their private information about price changes, resulting in excessive reactions in forecasts and persistent biases in inflation expectations (
Natoli and Sonti 2026). Recent evidence also shows that time discounting and hyperbolic discounting shape inflation expectations across short-, medium-, and long-term horizons, underscoring the broader role of behavioral mechanisms in belief formation (
Ogura et al. 2026). Despite these advances, much of the existing research continues to rely on traditional, pre-digital skill frameworks and therefore overlooks the distinct cognitive and evaluative competencies needed to process economic information in digital environments shaped by online platforms and algorithmic interfaces.
In response to the rapid digitization of financial activity, recent studies have begun examining DFL, which extends conventional financial literacy to include competencies such as conducting online transactions, managing digital security and identity, and effectively using financial technologies (
Lyons and Kass-Hanna 2021;
OECD 2024). This emerging strand of research has primarily investigated predictors of DFL acquisition. For example,
Jose and Ghosh (
2025),
OECD (
2024), and
Lal et al. (
2025) identify sociodemographic, economic, psychological, and infrastructural elements as key predictors of individuals’ capacity to attain digital financial competencies. Additional research emphasizes that DFL facilitates meaningful participation in technology-driven financial ecosystems (
Koskelainen et al. 2023;
Liu et al. 2021;
Soldatos and Kyriazis 2022;
Subburayan et al. 2024). More recently, researchers have begun linking DFL to broader psychological and economic outcomes, such as greater financial well-being, improved life satisfaction, and reduced anxiety (
Choung et al. 2023,
2025;
Amarsanaa et al. 2025). Emerging findings also suggest that DFL strengthens individuals’ behavioral stability in digital environments, including greater loss tolerance and reduced susceptibility to impulsive or short-term decision patterns (
Bawalle et al. 2026;
Shiiku et al. 2026). Although these studies advance the understanding of DFL in many ways, they do not explain how DFL shapes macro-behavioral processes, particularly the formation of inflation expectations. To date, no research has yet examined whether DFL, a multidimensional competency, shapes individuals’ ability to form coherent inflation expectations in technology-mediated environments.
Taken together, these gaps highlight the need for empirical evidence on whether digital financial competencies are associated with how individuals form inflation expectations in digital information environments. Addressing this need, the present study contributes to the literature in three key ways. First, it provides large-scale empirical evidence linking DFL to inflation expectations across multiple forecast horizons using a large-scale online survey of more than 150,000 active Japanese investors. Second, by examining expectations at the one-, three-, and five-year horizons, the analysis offers new insight into whether the association between DFL and inflation expectations varies with the forecast horizon, a central implication of horizon-dependent information-processing mechanisms. Third, by employing ordered probit models and controlling for an extensive set of demographic, socioeconomic, and behavioral characteristics, the study examines the relationship between DFL and inflation expectations while reducing concerns about observable confounding, thereby strengthening the credibility of the empirical findings.
Based on these arguments, we examine the following associational hypotheses:
H1. Higher DFL is associated with lower one-year-ahead inflation expectations.
H2. Higher DFL is associated with higher three-year-ahead inflation expectations.
H3. Higher DFL is associated with higher five-year-ahead inflation expectations.
These hypotheses concern conditional associations rather than causal effects, given the observational nature of the data.
3. Data and Methods
3.1. Data
This analysis uses the 2025 wave of the “Survey on Life”, an online survey jointly conducted by Rakuten Securities and Kadoya Lab at Hiroshima University. The survey was administered in January and February 2025 and targeted individuals aged 18 and older who had logged into their Rakuten Securities account at least once during the last year.
The survey collected information on respondents’ inflation expectations, DFL, and a range of demographic, socioeconomic, and psychological characteristics. Leveraging the panel structure of the data, time-invariant characteristics such as financial literacy, educational attainment, as well as the myopic view of the future were derived from earlier waves (2022 and 2023). After excluding observations with missing values, the final analytical sample comprises 157,690 respondents, representing approximately 69% of the initial sample. We assumed that the missing observations followed a missing-at-random (MAR) pattern and therefore did not bias our results. To assess this assumption, we computed descriptive statistics and re-estimated the main model before exclusion, and found that differences in coefficients, means, and standard deviations were small, suggesting that sample simplification did not materially alter the observable distributions. We did not apply standard imputation methods because several key variables, including inflation expectations and DFL items, are based on ordered or scale-based survey responses, and imputing these variables could introduce additional model-dependent assumptions. Instead, we used complete-case analysis and checked whether observable distributions and main estimates materially differed before and after exclusion. The results were similar, suggesting that the complete-case sample does not materially alter the main observable patterns.
3.2. Variables
The study uses three dependent variables measuring expected inflation at different horizons: one-year, three-year, and five-year ahead. For each horizon, respondents were asked whether they expect prices to go up or down, with eleven ordered response categories. The detailed questions and response options are as follows:
“Q1. How do you think the consumer price will change in one year, three years, and five years? (Choose one for each)
Increase by 9% or more.
Increase from 7% to less than 9%.
Increase from 5% to less than 7%.
Increase from 3% to less than 5%.
Increase from 1% to less than 3%.
Plus or minus less than 1%.
Decrease from 1% to less than 3%.
Decrease from 3% to less than 5%.
Decrease from 5% to less than 7%.
Decrease from 7% to less than 9%.
Decrease by 9% or more.”
Since the responses are categorical but ordered, the numerical distance between categories cannot be assumed to be equal. Accordingly, we constructed three discrete ordinal variables for expected inflation at the one-, three-, and five-year horizons. Responses indicating increases of 9% or more, 7–9%, 5–7%, 3–5%, and 1–3% were coded as 9, 8, 6, 4, and 2, respectively; responses indicating decreases of 1–3%, 3–5%, 5–7%, 7–9%, and 9% or more were coded as -2, -4, -6, -8, and -9, respectively; and responses indicating changes within ±1% were coded as 0.
The primary independent variable in this study is digital financial literacy (DFL). In measuring and defining DFL, we followed the methodology of
Lal et al. (
2025), which adapts the framework proposed by
Lyons and Kass-Hanna (
2021). DFL is conceptualized as eight multidimensional constructs capturing basic digital knowledge, financial knowledge, awareness of digital financial services (DFS), awareness of positive financial attitude and behaviors, practical know-how of financial services, positive financial attitude, positive financial behavior through DFS, and self-protection capabilities. Each subdimension, except the financial knowledge subdimension, was assessed using three Likert-scale items (1 = strongly disagree to 5 = strongly agree), with subdimension scores calculated as the average of their items.
For the financial knowledge subdimension, financial knowledge was measured using the widely recognized three multiple-choice questions developed by
Lusardi and Mitchell (
2008). The three questions were designed to measure respondents’ ability to correctly answer questions related to simple interest rate, inflation, and risk diversification. One point was assigned for each correct answer, while incorrect or “I do not know” responses received zero points. Individual scores ranged from 0 to 3 across the three items, and were then averaged to produce a financial knowledge dimension with a score between 0 and 1.
Following the procedure used in our earlier DFL study, we first computed a raw composite DFL score by summing the average scores of the eight subdimensions, yielding a range from 7 to 36. For the regression analysis, we then standardized this composite DFL score using z-score normalization. Thus, the descriptive statistics report the raw composite DFL score, whereas the regression models use its standardized version. For consistency with prior work, the full DFL questionnaire is not reproduced here. The complete set of items is provided in our earlier MDPI publication (
Lal et al. 2025):
https://doi.org/10.3390/risks13080149 (accessed 12 February 2026).
We used an equal-weighted composite index rather than a principal component analysis (PCA)-based index for three reasons. First, our objective is to maintain consistency with the conceptual and measurement framework used in prior DFL research, including
Lal et al. (
2025). Second, the eight domains represent theoretically defined dimensions of DFL rather than purely data-driven latent factors. Third, an equal-weighted index is easier to interpret and compare across studies. Because the present study focuses on the association between overall DFL and inflation expectations, the composite index is used as the primary measure, while subdimension-level analyses are reported as supplementary evidence. Moreover, to assess the internal consistency of the DFL Index, we conducted a Cronbach’s alpha test for each of the sub-dimensions except financial knowledge, which was treated as a continuous measure. Each subdimension recorded an alpha of approximately 0.8, exceeding the conventional 0.7 threshold and indicating good reliability. Full results are available upon request.
In the analysis, we control for gender, age, age squared, marital status, having children, university degree, employment status, annual household income and assets, risk aversion and myopic view of the future. To reduce skewness and improve the distributional properties of the data, we transformed household income and household assets using their natural logarithms.
Table 1 presents the detailed definitions of all variables.
3.3. Descriptive Statistics
Table 2 presents the descriptive statistics for the variables included in the analysis. On average, respondents expected inflation rates of 3.4%, 4.9%, and 6.0% for one-, three-, and five-year horizons, respectively, reflecting an upward-sloping expectations profile. The raw composite DFL score averaged 30.2, reflecting moderate variation in digital financial literacy across the sample. In the regression analysis, however, we use the standardized z-score version of this composite index. Regarding the control variables, the respondents were, on average, 46 years old, and 67% of the sample was male. Approximately 67% are married, and 59% have at least one child. Two-thirds of the sample hold at least a university degree, and around 7% are currently not employed. Average household income is 7,695,761 JPY, and average household assets are 21,600,000 JPY, indicating skewness toward relatively affluent and financially engaged individuals, which is expected given the Rakuten Securities sampling frame. Finally, regarding the psychological factors, the average risk-aversion score was 0.534, and 15.2% reported a myopic view of the future.
3.4. Methods
To empirically assess the association between DFL and investors’ inflation expectations across short-, medium-, and long-term horizons, we estimate ordered probit models. This approach is appropriate because the inflation-expectation variables are ordinal in nature, and ordered probit models preserve the inherent ranking of categories without imposing equal distances between response options (
Greene 2018). All analyses were performed using Stata BE version 18, and the following functional equations were used to operationalize the study’s objectives:
where
,
, and
denote the expected inflation rates of the
th respondent at one, three, and five years ahead, respectively.
denotes the standardised DFL index, and
represents a vector of covariates capturing demographic, socioeconomic, and psychological characteristics. The error term
is assumed to be uncorrelated across observations, with mean zero and variance
. The full model specifications corresponding to Equations (1)–(3) are provided in Equations (4)–(6) below:
We also assessed potential multicollinearity within the model by calculating pairwise correlation coefficients and variance inflation factors (VIFs), excluding age squared from the auxiliary multicollinearity check. All correlation coefficients were below 0.4, and all VIFs were below 1.5, indicating that multicollinearity is not a concern in our estimation. To conserve space, the full set of correlation matrices and VIF results are available upon request.
4. Results
Table 3 reports the ordered probit regression results examining the association between the standardized DFL index and inflation expectations, alongside the full set of control variables. Model 1 presents the estimates for one-year-ahead expectations, Model 2 for three-year-ahead expectations, and Model 3 for five-year-ahead expectations. These results constitute our primary specification and form the basis for the main findings.
Model 1 shows a statistically significant negative association between DFL and one-year-ahead inflation expectations at the 1% significance level, suggesting that individuals with higher DFL tend to report lower short-term inflation expectations. In contrast, Models 2 and 3 reveal statistically significant positive associations between DFL and inflation expectations at the three- and five-year horizons (
p < 0.01), indicating that individuals with higher DFL tend to report higher medium- and long-term inflation expectations. This horizon-dependent pattern is broadly consistent with our theoretical framework: higher DFL may be associated with stronger short-term noise filtering (rational inattention), more frequent belief updating in the medium term, and greater incorporation of structural risks over longer horizons. Several control variables also display horizon-specific associations. Male respondents tend to report higher inflation expectations across all horizons. University education is negatively associated with one-year-ahead expectations but positively associated with three- and five-year-ahead expectations. Risk aversion is positively associated with one-year-ahead expectations but negatively associated with expectations at longer horizons. Other controls are reported in full in
Table 3.
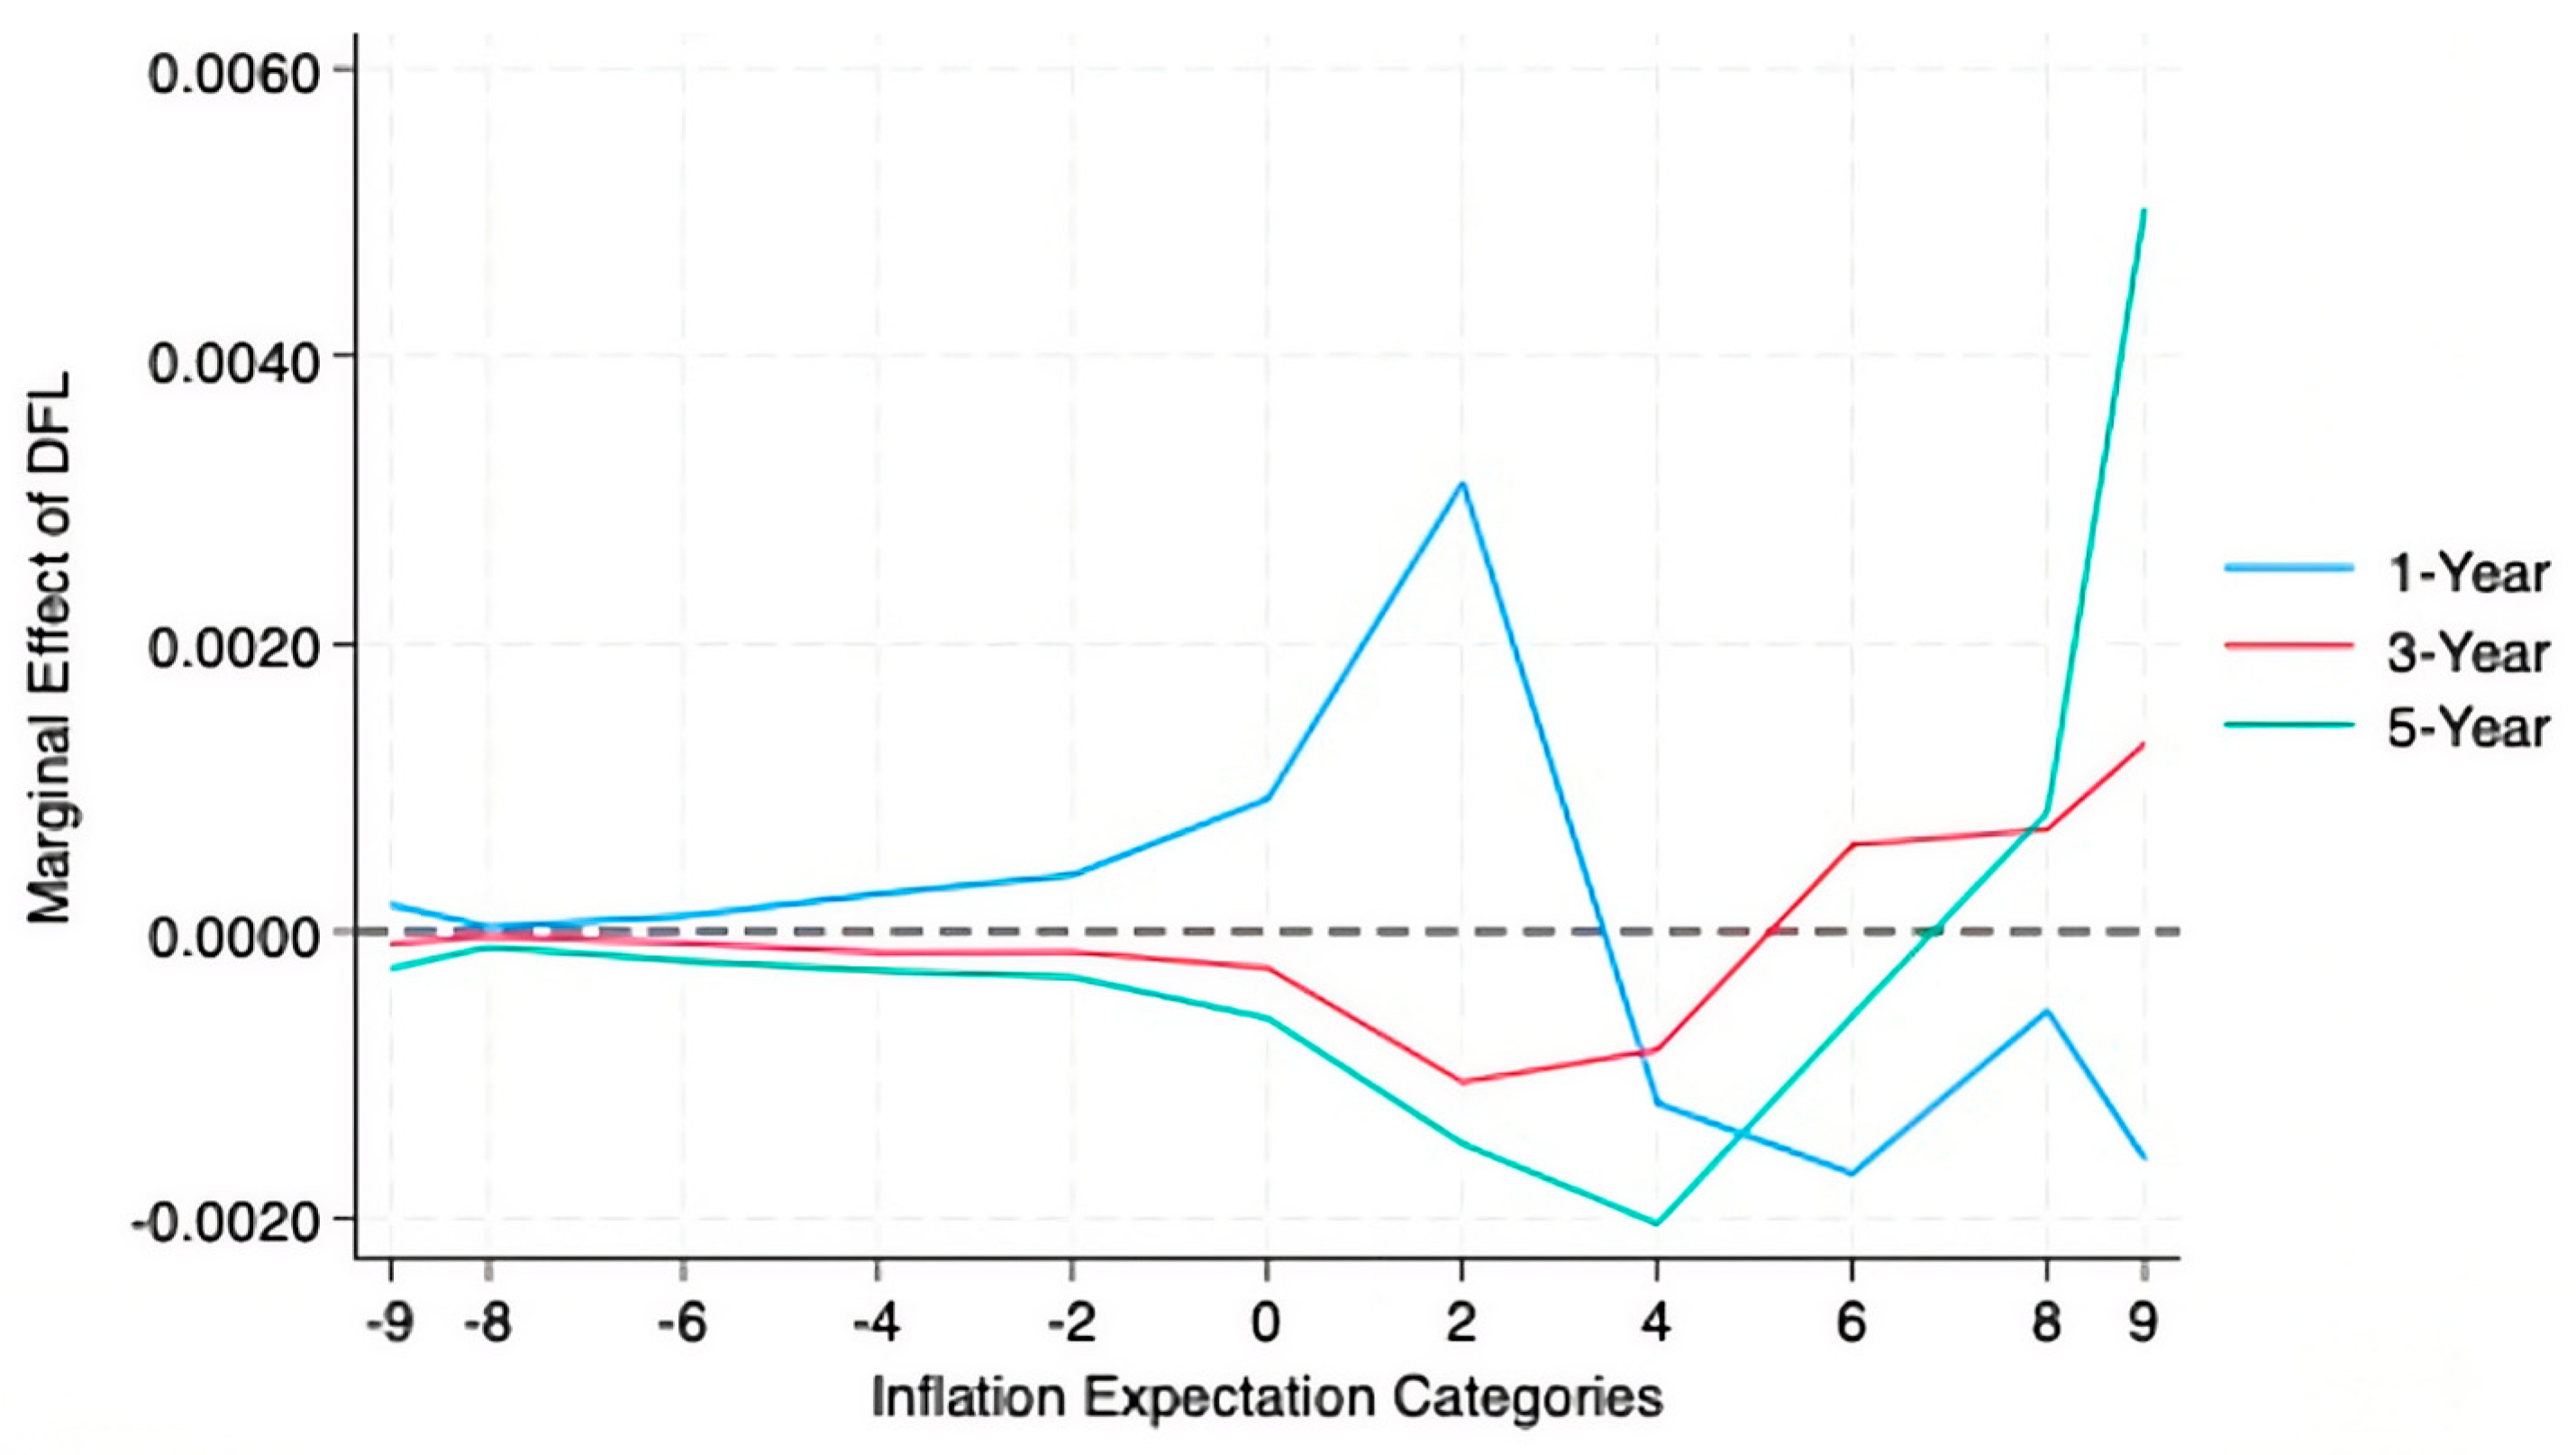
To assess the economic magnitude of our findings, we estimate marginal effects based on the ordered probit models reported in
Table 3, with the results presented in
Figure 3. These marginal effects indicate how a one-standard-deviation increase in DFL is associated with changes in the full probability distribution across all 11 inflation-expectation categories at the 1-, 3-, and 5-year horizons. For the one-year horizon, the marginal effects are positive for the lower inflation categories and negative for the higher categories. For example, the probability of selecting the 2% category increases by 0.0031, while the probability of selecting the 9% category decreases by 0.0016. This indicates that higher DFL is associated with a greater probability of selecting lower short-term inflation categories and a lower probability of selecting higher short-term inflation categories. In contrast, for the three- and five-year horizons, the marginal effects become increasingly positive at the upper end of the distribution. At the highest inflation category (9%), the marginal effect is 0.0013 for the three-year horizon and rises to 0.0050 for the five-year horizon, suggesting that higher DFL is associated with a higher probability of expecting elevated inflation in the medium and long run.
To further examine whether the main association is concentrated in a particular measured component of DFL, we decomposed the overall DFL index into its eight subdimensions and estimated separate ordered-probit models for each, allowing us to assess how the individual components of DFL relate to inflation expectations across the three horizons. This analysis is intended only as an additional exploration and does not replace our main specification reported in
Table 3. Before conducting these estimations, we examined multicollinearity among the subdimensions to ensure they could be meaningfully included in the regression framework, as shown in
Table 4 below.
The correlations between the three inflation-expectations measures (one-, three-, and five-year horizons) are moderate to high (0.49–0.81), which is expected since inflation expectations are persistent across horizons. Most importantly, the correlations between each DFL subdimension and the inflation-expectation variables are small in magnitude (r < 0.10), which indicates that none of the DFL subdimensions are mechanically related to the dependent variables. However, the DFL subdimensions exhibit strong positive correlations with one another (0.70–0.83), suggesting that they might capture related aspects of the same underlying construct. These high intercorrelations imply that including multiple subdimensions simultaneously in a single regression would introduce multicollinearity. Therefore, to avoid such an issue, each subdimension was separately regressed with the corresponding horizon specific dependent variables in the model. This approach allows us to examine the separate association of each DFL component with inflation expectations while avoiding unstable coefficient estimates caused by high intercorrelations among the subdimensions.
Table 5,
Table 6 and
Table 7 present the supplementary results for all eight DFL subdimensions across the three inflation-expectation horizons, where each subdimension is separately regressed on the corresponding horizon-specific dependent variable to avoid multicollinearity. Across the three horizons, a broadly consistent pattern emerges. In the separately estimated models, the DFL subdimensions—including digital knowledge, financial knowledge, awareness of available DFS, awareness of positive financial attitudes and behaviors, practical know-how, positive financial attitude, positive financial behavior, and self-protection capabilities—are generally negatively associated with one-year inflation expectations. This suggests that respondents with higher scores on these DFL-related dimensions tend to report lower short-term inflation expectations. In contrast, the same subdimensions exhibit positive and statistically significant associations with inflation expectations at the three- and five-year horizons. This horizon-dependent reversal mirrors the results obtained using the composite DFL index and suggests that digital financial literacy is associated with lower short-term inflation perceptions and higher medium- and long-term forward-looking assessments. This consistency across the separately estimated subdimension models suggests that the association is not confined to a single measured component of DFL. However, because the subdimensions are strongly correlated, these estimates should not be interpreted as identifying the independent contribution of each component. Rather, they provide supplementary evidence that the horizon-dependent pattern is broadly observed across multiple DFL-related measures.
As a supplementary robustness check, we also estimated OLS regressions by treating the coded inflation-expectation measures as continuous variables. As shown in
Table 8, the results are broadly consistent with those from the ordered probit models, although the ordered probit estimates remain our preferred specification because the underlying survey responses are ordinal.
Our baseline coding (
Table 3) uses ordered category scores that approximate the midpoints of the response intervals while preserving the ordinal structure of the original survey responses. As an additional test, we collapsed the original 11 inflation expectation categories into three ordered groups: deflationary (−1), which includes all responses indicating price decreases of 1% or more (baseline codes -9, -8, -6, -4, -2); neutral (0), corresponding to changes within ±1%; and inflationary (+1), which includes all responses indicating price increases of 1% or more (baseline codes 2, 4, 6, 8, 9). This recoding preserves the ordinal structure of the data while providing a more aggregated and conceptually distinct measure of expected inflation. The corresponding results are presented in
Table 9. Although the one-year coefficient differs from the baseline model, this difference likely reflects the information compression in the collapsed coding, so we treat this specification as complementary rather than a direct replication.
Under the alternative three-category directional coding, the ordered probit estimates show that the DFL coefficient is positive and statistically significant at the one-, three-, and five-year horizons. This indicates that higher DFL is associated with a greater likelihood of reporting inflationary rather than neutral or deflationary expectations across all horizons.
This pattern differs from the baseline ordered-probit specification, where the coefficient for the one-year horizon is negative. The difference is expected because the three-category coding collapses the magnitude of positive inflation expectations and primarily distinguishes inflationary outcomes from all non-inflationary outcomes. As a result, the alternative specification should be interpreted as complementary evidence, rather than as a direct replication of the horizon-dependent pattern in the baseline model.
To examine heterogeneity in the relationship between DFL and inflation expectations, we estimated the ordered probit models separately for four age groups: under 30, 30–45, 45–60, and over 60, as shown in
Table 10. Across all subsamples, the coefficient on DFL remains statistically significant and exhibits the same horizon-dependent pattern as in the full sample, reflecting the structure of our main specification in
Table 3 rather than replacing it. Specifically, DFL is associated with lower one-year inflation expectations (negative and significant across all age groups) and higher three- and five-year expectations (positive and significant across all groups). While the strength of the association varies slightly across age categories, the direction and significance are highly consistent. These results suggest that the horizon-dependent association between DFL and inflation expectations is not confined to a particular age group.
5. Discussion
This study examined whether digital financial literacy (DFL) is associated with inflation expectations across short-, medium-, and long-term horizons. The results show a statistically significant horizon-dependent association between DFL and inflation expectations. Higher DFL is negatively associated with one-year-ahead inflation expectations but positively associated with inflation expectations at the three- and five-year horizons. This pattern is broadly consistent with the theoretical framework developed in the Introduction, which suggests that the role of information processing may differ across forecasting horizons.
One possible interpretation of the negative association at the one-year horizon is that individuals with higher DFL may be better able to filter out transitory price movements, sensationalized online content, and short-term noise (
Sims 2003). In digital environments, inflation-related information is often abundant but uneven in quality. Individuals with stronger digital and financial capabilities may therefore be better positioned to distinguish temporary fluctuations from more persistent signals (
Tsapin and Faryna 2025). In this sense, higher DFL may be associated with lower short-term inflation expectations, not because such individuals are less informed, but because they may place less weight on recent and potentially noisy price signals. This interpretation is broadly in line with rational inattention arguments and with the idea that information-processing capacity shapes short-run expectation formation.
By contrast, the positive associations observed at the three- and five-year horizons suggest that individuals with higher DFL may incorporate a broader set of medium- and long-run macroeconomic considerations into their expectations (
Bansal and Yaron 2004). Compared with short-run inflation forecasts, medium- and long-term expectations are more likely to reflect beliefs about policy persistence, trend inflation, demographic pressures, structural fiscal conditions, and broader macro-financial risks (
Mankiw and Reis 2002;
Evans and Honkapohja 2001). Individuals with higher DFL may be more likely to process such information in a systematic way, especially in digital environments where relevant information is dispersed across multiple platforms and sources (
Rooj and Mehta 2025). The positive coefficients at the longer horizons are therefore consistent with the possibility that DFL is associated with a stronger integration of slow-moving and structural inflation risks into expectation formation.
These findings also contribute to the growing literature on the role of digital capabilities in economic decision-making. Existing DFL research has mainly focused on determinants of DFL and on outcomes such as financial well-being, anxiety, and investor behavior. Our results suggest that DFL may also be relevant to a macro-behavioral domain: the formation of inflation expectations. In this sense, the study extends the scope of DFL research beyond household financial management and digital financial participation to the interpretation of macroeconomic conditions and risks.
At the same time, the findings should be interpreted with caution. First, the data are drawn from a large-scale online survey of active Japanese investors rather than from a nationally representative sample of the general population. This sampling frame is substantively useful because financially engaged individuals are particularly relevant for studying inflation beliefs in digital financial environments, but it also limits broader generalizability. The estimated associations may differ for less financially active, less digitally connected, or more economically vulnerable groups. Second, the analysis is cross-sectional and observational. Although the models control for a broad set of demographic, socioeconomic, and behavioral characteristics, the results should be interpreted as associations rather than causal effects. Reverse causality, omitted variables, and unobserved heterogeneity may still affect the estimates. Third, the ordered probit coefficients identify directional associations across ordered categories, but they do not by themselves reveal all underlying mechanisms. Additional research using longitudinal data, survey experiments, or information interventions would be useful for clarifying how DFL shapes expectation updating over time.
Despite these limitations, the study has several implications. From a research perspective, it suggests that digital capability may matter not only for financial access and investor behavior, but also for how individuals interpret inflation risk across different time horizons. From a policy perspective, the findings suggest that digital financial capability may be relevant to the broader informational environment in which inflation expectations are formed. However, because the analysis is observational, the results should not be interpreted as evidence that improving DFL would causally change inflation expectations. If individuals with stronger DFL process short-term and long-term inflation signals differently, then digital financial literacy may matter for the quality, dispersion, and stability of individual inflation expectations in increasingly digital economies. This possibility may be particularly relevant in Japan, where inflation dynamics, monetary policy communication, and digital financial participation are all undergoing important changes.
6. Conclusions
This study investigated the association between digital financial literacy (DFL) and inflation expectations across one-, three-, and five-year horizons using a large-scale survey of active Japanese investors. The results indicate a horizon-dependent pattern: higher DFL is associated with lower short-term inflation expectations but higher medium- and long-term inflation expectations. These findings are broadly consistent with the possibility that, among active Japanese investors, respondents with higher DFL process short-term and longer-term inflation-related information differently. However, the study does not identify the causal mechanisms behind these associations.
The study contributes to the literature by connecting two research strands that have largely developed separately: digital financial literacy and inflation expectation formation. In doing so, it suggests that, at least among financially engaged investors, DFL may have relevance beyond household finance and digital participation, extending to the way inflation-related information is interpreted in digital environments.
However, the results should be interpreted as associative rather than causal. The use of cross-sectional observational data and an investor-based online sample limits causal identification and generalizability. Future research could build on this study by using longitudinal data, experimental designs, or more representative sampling strategies to examine whether and how DFL affects not only the level but also the dispersion, updating speed, and stability of inflation expectations across different populations.
Author Contributions
Conceptualization, S.L., A.A.B., J.A. and Y.K.; methodology, S.L., A.A.B., J.A. and Y.K.; software, S.L., A.A.B. and J.A.; validation, S.L., A.A.B. and J.A.; formal analysis, S.L., A.A.B., J.A. and Y.K.; investigation, S.L. and Y.K.; resources, Y.K.; data curation, S.L., A.A.B. and J.A.; writing—original draft preparation, S.L., A.A.B., J.A. and Y.K.; writing—review and editing, S.L., A.A.B. and Y.K.; visualization, Y.K.; supervision, Y.K.; project administration, Y.K.; funding acquisition, Y.K. and S.L. All authors have read and agreed to the published version of the manuscript.
Funding
This work was supported by Rakuten Securities (awarded to Y.K.) and JSPS KAKENHI through grant numbers JP23K25534, JP24K21417 (awarded to Y.K.), and JP25K16683 (awarded to S.L.). Rakuten Securities (
https://www.rakuten-sec.co.jp, accessed on 28 March 2026) and JSPS KAKENHI (
https://www.jsps.go.jp/english/e-grants/, accessed on 28 March 2026) played no role in the study design, analysis, manuscript preparation, or publishing decision.
Institutional Review Board Statement
All procedures used in this research were approved by the Ethical Committee of Hiroshima University (Approval Number: HR-LPES-001872; Approval Date: 3 July 2024).
Informed Consent Statement
Informed consent was electronically obtained from all participants in the questionnaire survey under the guidance of the institutional compliance team.
Data Availability Statement
The data presented in this study are available upon request from the corresponding author. The data are not publicly available due to privacy restrictions.
Conflicts of Interest
The authors declare no conflicts of interest.
Abbreviations
The following abbreviations are used in this manuscript:
| DFL | Digital Financial Literacy |
| DFS | Digital Financial Services |
| VIF | Variance Inflation Factor |
References
- Adrian, Tobias. 2023. The Role of Inflation Expectations in Monetary Policy. Bretton Woods: International Monetary Fund. Available online: https://www.imf.org/en/news/articles/2023/05/15/sp-role-inflation-expectations-monetary-policy-tobias-adrian (accessed on 30 January 2026).
- Albagli, Elias, Francesco Grigoli, and Emiliano Luttini. 2025. Inflation Expectations and the Supply Chain. IMF Economic Review 73: 819–50. [Google Scholar] [CrossRef]
- Amarsanaa, Jargalmaa, Trinh Xuan Thi Nguyen, Yu Kuramoto, Mostafa Saidur Rahim Khan, and Yoshihiko Kadoya. 2025. Digital Financial Literacy and Anxiety About Life After 65: Evidence from a Large-Scale Survey Analysis of Japanese Investors. Risks 13: 170. [Google Scholar] [CrossRef]
- Armantier, Olivier, Wandi Bruine de Bruin, Giorgio Topa, Wilbert van der Klaauw, and Basit Zafar. 2015. Inflation expectations and behavior: Do survey respondents act on their beliefs? International Economic Review 56: 505–36. [Google Scholar] [CrossRef]
- Baddeley, Michelle. 2019. Behavioural Macroeconomic Policy: New Perspectives on Time Inconsistency. Ithaca: Cornell University. Available online: https://www.researchgate.net/publication/334558262_Behavioural_Macroeconomic_Policy_New_perspectives_on_time_inconsistency (accessed on 30 January 2026).
- Bank of Japan. 2024. Assessing Measures of Inflation Expectations: A Term Structure and Forecasting Power Perspective. Tokyo: Bank of Japan. Available online: https://www.boj.or.jp/en/research/wps_rev/rev_2024/rev24e04.htm (accessed on 30 January 2026).
- Bansal, Ravi, and Amir Yaron. 2004. Risks for the long run: A potential resolution of asset pricing puzzles. Journal of Finance 59: 1481–509. [Google Scholar] [CrossRef]
- Bawalle, Aliyu Ali, Sumeet Lal, Mostafa Saidur Rahim Khan, and Yoshihiko Kadoya. 2026. Digital Financial Literacy and Investment Grip: A Study of Japanese Active Investors. International Journal of Financial Studies 14: 25. [Google Scholar] [CrossRef]
- Bruine de Bruin, Wandi, Wilbert van der Klaauw, Julie S. Downs, Baruch Fischhoff, Giorgio Topa, and Olivier Armantier. 2010. Expectations of inflation: The role of demographic variables, expectation formation, and financial literacy. Journal of Consumer Affairs 44: 381–402. [Google Scholar] [CrossRef]
- Burke, Mary A., and Michael Manz. 2014. Economic literacy and inflation expectations: Evidence from a laboratory experiment. Journal of Money, Credit and Banking 46: 1421–56. [Google Scholar] [CrossRef]
- Choung, Youngjoo, Swarn Chatterjee, and Tae-Young Pak. 2023. Digital financial literacy and financial well-being. Finance Research Letters 58: 104438. [Google Scholar] [CrossRef]
- Choung, Youngjoo, Tae-Young Pak, and Swarn Chatterjee. 2025. Digital Financial Literacy and Life Satisfaction: Evidence from South Korea. Behavioral Sciences 15: 94. [Google Scholar] [CrossRef]
- Coibion, Olivier, and Yuriy Gorodnichenko. 2015. Information rigidity and the expectations formation process: A simple framework and new facts. American Economic Review 105: 2644–78. [Google Scholar] [CrossRef]
- Coibion, Olivier, and Yuriy Gorodnichenko. 2025. Inflation, Expectations and Monetary Policy: What Have We Learned and to What End? NBER Working Paper No. 33858. Cambridge: National Bureau of Economic Research. Available online: https://www.nber.org/papers/w33858 (accessed on 30 March 2026).
- Comerford, David A. 2025. Cognitive reflection, arithmetic ability and financial literacy independently predict both inflation expectations and forecast accuracy. International Journal of Forecasting 41: 517–31. [Google Scholar] [CrossRef]
- D’Acunto, Francesco, Daniel Hoang, Maritta Paloviita, and Michael Weber. 2019. Cognitive Abilities and Inflation Expectations. AEA Papers and Proceedings 109: 562–66. [Google Scholar] [CrossRef]
- D’Acunto, Francesco, Evangelos Charalambakis, Dimitris Georgarakos, Geoff Kenny, Justus Meyer, and Michael Weber. 2024. Household Inflation Expectations: An Overview of Recent Insights for Monetary Policy. NBER Working Paper Series; Cambridge: National Bureau of Economic Research. [Google Scholar] [CrossRef]
- D’Acunto, Francesco, Ulrike Malmendier, and Michael Weber. 2022. What do the data tell us about inflation expectations? In Handbook of Economic Expectations. Edited by Rüdiger Bachmann, Giorgio Topa and Wilbert van der Klaauw. Amsterdam: Elsevier, pp. 133–61. [Google Scholar]
- Das, Abhiman, Kajal Lahiri, and Yongchen Zhao. 2019. Inflation expectations in India: Learning from household tendency surveys. International Journal of Forecasting 35: 980–93. [Google Scholar] [CrossRef]
- Doh, Taeyoung, Ji Hyung Lee, and Woong Yong Park. 2024. Heterogeneity in Household Inflation Expectations and Monetary Policy. SSRN Electronic Journal. [Google Scholar] [CrossRef]
- Dräger, Lena, and Giang Nghiem. 2025. Inflation Literacy, Inflation Expectations, and Trust in the Central Bank: A Survey Experiment. Review of Economics and Statistics, 1–45. [Google Scholar] [CrossRef]
- Evans, George, and Seppo Honkapohja. 2001. Learning and Expectations in Macroeconomics. Princeton: Princeton University Press. [Google Scholar]
- Gennaioli, Nicola, and Andrei Shleifer. 2018. A Crisis of Beliefs: Investor Psychology and Financial Fragility. Princeton: Princeton University Press. [Google Scholar]
- Ghaderi, Mohammad, Sang Byung Seo, and Ivan Saliastovic. 2024. Learning, subjective beliefs about God, and bad inflation ranges. SSRN. [Google Scholar] [CrossRef]
- Greene, William H. 2018. Econometric Analysis. London: Pearson Education Limited. [Google Scholar]
- Ilan, Mordechai, and Yevgeny Mugerman. 2025. Misguided mortgage choices: Financial literacy, inflation expectations, and borrowing decisions. Journal of Behavioral and Experimental Finance 47: 101077. [Google Scholar] [CrossRef]
- International Monetary Fund. 2023. Managing Expectations: Inflation and Monetary Policy. World Economic Outlook. Available online: https://www.elibrary.imf.org/display/book/9798400235801/9798400235801.xml?cid=530522-com-dsp-crossref&BookTabs=Cited%20By (accessed on 30 March 2026).
- Jose, Jeswin, and Nabanita Ghosh. 2025. Digital financial literacy and financial inclusion in the global south for a sustainable future: A scoping review. Decision 52: 129–48. [Google Scholar] [CrossRef]
- Koskelainen, Tiina, Panu Kalmi, Eusebio Scornavacca, and Tero Vartiainen. 2023. Financial literacy in the digital age—A research agenda. Journal of Consumer Affairs 57: 507–28. [Google Scholar] [CrossRef]
- Lal, Sumeet, Aliyu Ali Bawalle, Mostafa Saidur Rahim Khan, and Yoshihiko Kadoya. 2025. What Determines Digital Financial Literacy? Evidence from a Large-Scale Investor Study in Japan. Risks 13: 149. [Google Scholar] [CrossRef]
- Liu, Siming, Leifu Gao, Khalid Latif, Ayesha Anees Dar, Muhammad Zia-UR-Rehman, and Sajjad Ahmad Baig. 2021. The Behavioral Role of Digital Economy Adaptation in Sustainable Financial Literacy and Financial Inclusion. Frontiers in Psychology 12: 742118. [Google Scholar] [CrossRef]
- Lusardi, Annamaria, and Olivia S. Mitchell. 2008. Planning and financial literacy: How do women fare? American Economic Review 98: 413–17. [Google Scholar] [CrossRef]
- Lyons, Angela C, and Josephine Kass-Hanna. 2021. A methodological overview to defining and measuring “digital” financial literacy. Financial Planning Review 4: E1113. [Google Scholar] [CrossRef]
- Malmendier, Ulrike, and Stefan Nagel. 2016. Learning from inflation experiences. Quarterly Journal of Economics 131: 53–87. [Google Scholar] [CrossRef]
- Mankiw, Gregory, and Ricardo Reis. 2002. Sticky Information versus Sticky Prices: A Proposal to Replace the New Keynesian Phillips Curve. The Quarterly Journal of Economics 117: 1295–328. [Google Scholar] [CrossRef]
- Natoli, Filippo, and Sharath Sonti. 2026. Overconfident Forecasters and the Impact of Inflation Information: Evidence from a Randomized Survey Experiment. SSRN. [Google Scholar] [CrossRef]
- OECD. 2024. OECD/INFE Survey Instrument to Measure Digital Financial Literacy. Paris: OECD Publishing. Available online: https://www.oecd.org/en/publications/oecd-infe-survey-instrument-to-measure-digital-financial-literacy_548de821-en.html (accessed on 16 September 2025).
- Ogura, Kota, Manaka Yamaguchi, Sakiho Aizawa, Mostafa Saidur Rahim Khan, and Yoshihiko Kadoya. 2026. The Association Between Time Discounting, Hyperbolic Discounting, and Inflation Expectations: Evidence from Large-Scale Survey Data. Risks 14: 56. [Google Scholar] [CrossRef]
- Pedemonte, Mathieu, Hiroshi Toma, and Esteban Verdugo. 2025. Aggregate Implications of Heterogeneous Inflation Expectations: The Role of Individual Experience. Washington, DC: IDB. [Google Scholar] [CrossRef]
- Rooj, Debasis, and Adit Mehta. 2025. Digital payments and inflation expectations: Evidence from survey data. Macroeconomics and Finance in Emerging Market Economies, 1–22. [Google Scholar] [CrossRef]
- Röttger, Paul, and Balazs Vedres. 2020. The Information Environment and Its Effects on Individuals and Groups. An Interdisciplinary Literature Review. Oxford: Oxford Internet Institute, University of Oxford. [Google Scholar]
- Rumler, Fabio, and Maria Teresa Valderrama. 2020. Inflation literacy and inflation expectations: Evidence from Austrian household survey data. Economic Modelling 87: 8–23. [Google Scholar] [CrossRef]
- Shiiku, Asahi, Gideon Otchere-Appiah, Mostafa Saidur Rahim Khan, and Yoshihiko Kadoya. 2026. Digital Financial Literacy and Hyperbolic Discounting: Evidence from Japanese Investors. Risks 14: 68. [Google Scholar] [CrossRef]
- Sims, Christopher A. 2003. Implications of rational inattention. Journal of Monetary Economics 50: 665–90. [Google Scholar] [CrossRef]
- Soldatos, John, and Dimosthenis Kyriazis. 2022. Big Data and Artificial Intelligence in Digital Finance: Increasing Personalization and Trust in Digital Finance Using Big Data and AI. Berlin and Heidelberg: Springer International Publishing. [Google Scholar]
- Subburayan, Baranidharan, Amirdha Vasani Sankarkumar, Rohit Singh Mushi, and Hellena Mohamedy. 2024. Transforming of the financial landscape from 4.0 to 5.0: Exploring the integration of blockchain, and artificial intelligence. In Applications of Block Chain Technology and Artificial Intelligence. Edited by Irfan Mohammad, Khan Mohammad, Naifar Nader and Attique Khan Muhammad. Berlin and Heidelberg: Springer, pp. 137–61. [Google Scholar]
- Tsapin, Andriy, and Oleksandr Faryna. 2025. The role of financial literacy in shaping inflation beliefs: The case of Ukraine. Central Bank Review 25: 100225. [Google Scholar] [CrossRef]
- Weber, Michael, Francesco D’Acunto, Yuriy Gorodnichenko, and Olivier Coibion. 2022. The Subjective Inflation Expectations of Households and Firms: Measurement, Determinants, and Implications. Journal of Economic Perspectives 36: 157–84. [Google Scholar] [CrossRef]
| Disclaimer/Publisher’s Note: The statements, opinions and data contained in all publications are solely those of the individual author(s) and contributor(s) and not of MDPI and/or the editor(s). MDPI and/or the editor(s) disclaim responsibility for any injury to people or property resulting from any ideas, methods, instructions or products referred to in the content. |