4.1. Preliminary Tests
The preliminary test results of this analysis are shown in
Table 1 below. Accordingly, stationarity, essential for GARCH modelling (
Brooks 2019), is confirmed across all return series: ADF statistics are significantly negative and KPSS values are below thresholds, supporting mean reversion (
Campbell et al. 1998;
Kengere 2023). ARCH LM tests for RSE, NSE, DSE, and USE are highly significant (LM = 235–1090,
p < 0.01), evidencing volatility clustering and conditional heteroskedasticity typical of frontier markets, justifying GARCH use (
Brooks 2019;
Muguto and Muzindutsi 2022).
ARMA–GARCH diagnostics, selected via Akaike information criterion (AIC) with Student-t innovations, effectively capture autocorrelation and heavy tails. AIC is preferred over Bayesian information criterion (BIC) in small or noisy samples typical of frontier African markets, where thin trading, zero-return days, and missing data reduce effective sample size (
Brooks 2019;
Enders 2012). Residual checks show limited outliers in the NSE (2), DSE (14), and USE (4), but many in the RSE (52), consistent with illiquid trading structures (
Kuttu 2018;
Yunvirusaba et al. 2019). Model adequacy is evaluated using Ljung–Box and ARCH-LM tests on standardised and squared residuals. High
p-values confirm the absence of serial correlation and conditional heteroskedasticity, indicating that the ARMA–GARCH specifications effectively capture return dependence. To test robustness against extreme observations, returns are winsorised, and the models are re-estimated. The resulting winsorised persistence (
) reflects volatility dynamics after mitigating outlier effects, without altering the fundamental GARCH parameters.
Overall, the results confirm stationarity, strong ARCH effects, robustness to extreme returns, and that observed outliers are structural, validating the ARMA–GARCH framework for East African markets.
4.2. ADCC–GARCH Results
Table 2 presents long-run average conditional correlations estimated from the ADCC–GARCH model for the NSE, DSE, RSE, and USE. These correlations are conditional on market-specific ARMA–GARCH volatility dynamics and asymmetric shock responses, and, therefore, summarise baseline co-movement after filtering out heteroskedasticity and transitory volatility effects. As such, they represent structural dependence over the full sample period (2014–2024), rather than short-lived crisis spikes. Contrary to the weak or near-zero correlations often documented for frontier African markets, the estimates reveal consistently positive and economically meaningful co-movements among all four exchanges. This pattern suggests the presence of stronger regional linkages than traditionally reported in the literature, indicating that regional macroeconomic forces, informational flows, and cross-border investment channels may play an increasingly important role in shaping return behaviour (
Zhang 2021).
A particularly notable result is the RSE–USE conditional correlation, which attains a value of unity. While this indicates extremely strong co-movement in filtered returns, it should not be interpreted as evidence of full financial integration. In thin and illiquid frontier markets, near-perfect conditional correlations may arise from synchronous trading patterns, overlapping investor participation, limited price discovery, or prolonged periods of low return variability. Similar phenomena have been documented in small and emerging markets, where high correlation estimates reflect shared vulnerability and behavioural synchronisation rather than deep structural integration (
Atenga and Mougoué 2021). Accordingly, the RSE–USE result is best interpreted as signalling heightened susceptibility to common shocks, rather than permanent convergence.
Kenya’s NSE, the region’s most sophisticated bourse, also exhibits strong conditional correlations with all three markets. The positive and sizeable associations with the DSE, RSE, and USE indicate that movements in the NSE align closely with broader regional patterns. While this does not imply dominance, it suggests a shared exposure to common shocks, cross-listed firms, and integrated investor sentiment channels, challenging earlier conclusions that Kenya’s advanced market operates independently of its neighbours (
Nyakurukwa and Seetharam 2023).
The DSE–USE and DSE–RSE correlations, although relatively lower than NSE-linked pairs, remain positive and non-trivial. These moderate co-movements may reflect shared macroeconomic fundamentals, similar policy regimes, or the influence of regionally integrated corporate structures. Consistent with observations by
Logogye et al. (
2024), such correlations may represent the early stages of deeper regional synchronisation rather than a fully developed integrated market.
Overall, the conditional correlation matrix indicates that East African equity markets exhibit significantly higher degrees of co-movement than typically assumed. The consistently positive correlations point to the existence of meaningful interdependencies, with implications for both contagion potential and diversification strategies. For investors, these results suggest that cross-market diversification benefits within the region may be more limited than previously believed. For policymakers, the findings highlight the importance of strengthening regulatory harmonisation, enhancing cross-border trading frameworks, and supporting capital-market integration initiatives aimed at consolidating the region into a more unified financial ecosystem (
Benos et al. 2024;
Claessens 2019).
Table 3 reports the estimated ADCC–GARCH correlation parameters, where
corresponds to the ARCH term
in Equation (6) and measures the impact of lagged standardised shocks on conditional correlations;
corresponds to the GARCH persistence term
; and
corresponds to the asymmetry parameter
, capturing the differential effect of negative shocks on correlation dynamics. The summary statistics
,
,
, and
are computed from the time-varying conditional correlation matrix in Equation (8).
The remaining statistics summarise the resulting time-varying conditional correlations for each market pair, including the mean correlation
, maximum
, minimum
, and volatility
, with statistical significance assessed using maximum-likelihood-based test statistics. ADCC–GARCH by
Cappiello et al. (
2006) is particularly well suited for modelling the dynamic behaviour of financial markets that exhibit evolving co-movement patterns, structural segmentation, and varying sensitivity to shocks, features widely documented across African and frontier markets (
Ahmed and Huo 2018;
Katzke 2013). Across all market pairs, the estimated ARCH and GARCH parameters are highly consistent, indicating substantial volatility persistence in the region. The dominance of the GARCH term shows that volatility shocks decay slowly, consistent with thin liquidity, intermittent trading, and delayed information absorption traits noted in empirical studies on African market microstructure (
Bonga-Bonga and Phume 2022;
Enders 2012). This slow dissipation of shocks echoes
Minsky’s (
1992) Financial Instability Hypothesis, which underscores how prolonged tranquil periods may conceal accumulating fragilities that become evident during episodes of stress.
The asymmetry coefficient is statistically insignificant across all pairs, indicating that negative shocks do not generate stronger correlation responses than positive shocks. This contrasts with the asymmetric contagion frequently observed in more integrated or crisis-sensitive markets (
Bekaert et al. 2014;
Bossman et al. 2022). In the East African context, the absence of asymmetry is consistent with the region’s still-limited cross-border transmission channels, the small number of cross-listed firms, and relatively low foreign investor synchronisation limiting differential responses to bad news (
Makau et al. 2015;
Yabara 2012).
The average dynamic correlations (
) range from slightly negative in NSE–RSE and DSE–USE to modestly positive values in NSE–DSE, DSE–RSE, and RSE–USE. These figures indicate weak but non-zero integration, aligning with evidence that African equity markets exhibit shallow but emerging financial linkages (
Atenga and Mougoué 2021;
Nyakurukwa and Seetharam 2023). Rather than full segmentation, the results reflect partial interdependence, likely driven by shared regional macroeconomic conditions, harmonised policy cycles, and cross-listed regional blue-chip firms.
Episodes of synchronisation are visible in the maximum conditional correlations, which range between 0.042 and 0.145. These short-lived surges, most notable for the DSE–RSE and NSE–USE pairs, suggest temporary alignment arising from shared exposure to broader shocks, including global uncertainty events (
Bloom 2009), geopolitical tensions (
Ferreira et al. 2023), or regional political disruptions (
Ochieng et al. 2023). Such episodic co-movement is consistent with the Adaptive Market Hypothesis, which argues that market efficiency and interdependence evolve in response to changing environments and investor learning behaviour (
Lo and Zhang 2024).
The variability of correlations is modest across all pairs, but sufficient to indicate that correlations are not static. Even modest volatility in correlation reflects the intermittency of integration, supporting empirical findings that African markets exhibit “on-and-off” connectivity that intensifies under stress but weakens under normal conditions (
Logogye et al. 2024;
Diebold and Yılmaz 2012,
2014). This reinforces the relevance of time-varying correlation models, which capture the subtleties overlooked by static correlation estimators.
Minimum conditional correlations are negative for all pairs, indicating periods of decoupling or divergence. These episodes may reflect country-specific shocks, idiosyncratic policy responses, or divergent economic fundamentals consistent with evidence that African markets remain fundamentally heterogeneous (
Koepke 2019;
Analytica 2019). The coexistence of negative minima and positive maxima supports the view of latent but unstable regional connectivity, which activates under certain conditions but dissipates quickly, mirroring patterns documented in East African volatility spillover studies (
Yunvirusaba et al. 2019).
Taken together, the ADCC–GARCH results portray East African equity markets as conditionally segmented. They operate largely independently during tranquil periods yet exhibit abrupt increases in co-movement when exposed to shared shocks. This duality captures both the context dependence highlighted in the Adaptive Market Hypothesis (
Lo 2004;
Fama 2021) and the systemic fragility underscored by the Financial Instability Hypothesis (
Minsky 1992;
Rosser 2020). Moving from episodic synchronisation to sustained integration will require coordinated reforms in market infrastructure, regulatory harmonisation, and deeper institutional participation objectives, echoing calls from regional policy analyses (
Claessens 2019;
Biau 2018;
Benos et al. 2024).
4.3. Volatility Spillover Analysis
Table 4 presents the average volatility spillovers among East African stock markets based on the
Diebold and Yılmaz (
2012,
2014) connectedness framework. The “TO” measure captures the total volatility transmitted from a given market to others, while the “FROM” measure reflects the volatility received from external markets. The “NET” spillover, defined as the difference between the TO and FROM measures, indicates whether a market acts as a net transmitter or net receiver of volatility. The diagonal entries, reported as Inc. Own (inclusive own variance share), represent the proportion of forecast-error variance explained by each market’s own shocks, while NPT denotes the net pairwise transmission of volatility between specific market pairs.
The NSE emerges as the dominant net transmitter of volatility, with a TO value of 14.97% exceeding its FROM value of 6.66%, resulting in a positive NET spillover of 8.31%. This reflects the exchange’s deeper liquidity, broader investor participation, and more advanced trading infrastructure, which enhance its capacity to transmit volatility across the region (
Makau et al. 2015). Cross-listings and arbitrage opportunities further strengthen this transmission mechanism, consolidating the NSE’s role as the central hub of East African financial markets (
Ahmed et al. 2023;
Omayo 2016).
Despite its relatively small size, the RSE also appears as a net transmitter of volatility, recording a NET spillover of 7.41%. This outcome can be attributed to increasing cross-listing activity, speculative capital flows, and herd-driven investor behaviour, which amplify volatility transmission even in less liquid markets (
El-Gayar et al. 2021). Recent evidence suggests that the RSE’s growing regional exposure allows modest trading volumes to exert disproportionate influence on interconnected markets (
Githaiga and Kosgei 2023), highlighting the role of behavioural and structural factors beyond conventional liquidity metrics.
In contrast, the DSE shows marginal net transmission, with a NET value of +0.82%. This subdued role reflects Tanzania’s cautious approach to financial liberalisation and segmented capital flows (
Analytica 2019). Although cross-border linkages exist, their effect remains limited, with the market retaining features of semi-integration. Regulatory conservatism and rising economic nationalism further constrain the DSE’s capacity to serve as a regional transmitter (
Kamazima and Omurwa 2018). Meanwhile, the Uganda Securities Exchange (USE) acts as the most passive market, with a NET of –16.54%, driven by high incoming volatility (FROM = 23.14%) and minimal outgoing spillovers (TO = 6.60%). This highlights its absorptive role, shaped by illiquidity, weak foreign participation, and shallow market depth (
Kamuhanda 2020).
Table 5 reports a snapshot of volatility spillovers across East African stock markets at a specific point in time, derived from the
Diebold and Yılmaz (
2012,
2014) framework. Unlike
Table 4, which presents time-averaged dynamic connectedness measures,
Table 5 captures contemporaneous “To”, “From”, and “Net” spillovers, reflecting short-run transmission and absorption of volatility. Consequently, the magnitudes differ from the long-run averages and provide complementary insights into the distribution of regional shocks during relatively stable market conditions.
The NSE demonstrates resilience, receiving modest spillovers from regional peers at 4.13%. Its greater role lies in transmitting volatility, with a “To” value of 7.20% that reinforces its position as a regional hub. The positive net spillover of +3.07% supports its role as a consistent transmitter, in line with its long-term average of +8.31%. This performance is explained by its strong liquidity, broad investor base, and active cross-listings. The smaller magnitude compared to average values suggests that the observation date corresponded to a relatively stable period with limited regional stress.
The RSE is positioned as a net receiver, with “From” spillovers of 5.13%, exceeding its “To” value of 2.94%. This results in a negative net of –2.19%, a notable departure from its average role as a net transmitter of +7.41%. The change points to greater susceptibility to regional shocks and a temporary reduction in its influence. It may also reflect reduced speculative flows or weaker cross-listing activity at the time. Given its smaller size and lower liquidity, the RSE has a constrained ability to spread volatility, reinforcing its peripheral role in the system.
The DSE records the highest “From” spillovers at 6.09%, marking it as the most vulnerable to external shocks in the sample. Although this is below its long-term average of 9.57%, the value still indicates significant regional exposure, consistent with Tanzania’s cautious approach to financial openness. The DSE transmits less volatility outward, with a “To” value of 3.70% compared to its long-term average of 10.39%. The negative net spillover of –2.38% confirms its role as a net receiver, shifting it from a marginal transmitter to a clearer absorber of shocks. This adjustment reflects structural fragilities and reliance on external rather than domestic drivers of volatility.
The USE exhibits limited regional integration, receiving minimal spillovers at 0.48%, well below its long-term average of 23.14%. Its outward transmission of 1.98% is also modest, pointing to shallow market depth and low trading activity. The resulting positive net effect of +1.50% contrasts with its historical role as a strong net receiver of –16.54%. This suggests an unusual reversal, likely linked to episodic or data-specific factors on the observation date. Despite this anomaly, the USE’s influence remains negligible relative to the NSE, and its overall contribution to regional volatility is limited.
Table 6 presents the pairwise spillover estimates for the East African stock markets, with diagonal elements set to 100% to reflect own-market variance contributions. The NSE shows the most pronounced transmission, sending volatility of 5.5856% to the DSE and 3.8834% to the RSE. These values confirm the NSE’s role as a net transmitter (+8.31% NET), consistent with its higher liquidity, diverse investor base, and cross-listing activity (
Makau et al. 2015). The strong linkage between the NSE and DSE illustrates deeper economic integration and shared investor participation, as highlighted by
Yunvirusaba et al. (
2019). This underscores the NSE’s function as a regional hub in volatility propagation.
By contrast, the USE demonstrates minimal outward spillovers, transmitting only 0.1627% to the RSE and 0.2135% to the DSE. Its net effect (–16.54%) positions it as a consistent receiver, a role attributed to limited market depth, low liquidity, and restricted trading volumes (
Kamuhanda 2020). Rather than amplifying shocks, the USE largely absorbs them, which reduces its influence in regional connectedness. This characteristic indicates that the USE could serve as a diversification outlet for investors seeking insulation from broader regional volatility, in sharp contrast to the dominant role played by the NSE.
The RSE and DSE exhibit moderate cross-market spillovers, with 4.2807% between them and additional bidirectional flows from the NSE. These outcomes explain the RSE’s atypical position as a net transmitter (+7.41%) and the DSE’s marginal transmission role (+0.82%), which can be linked to cross-listings and speculative flows (
El-Gayar et al. 2021). The relatively low Total Connectedness Index (TCI) of 5.2720% and modest Pairwise Connectedness Index (PCI) values, such as the RSE–USE link (0.1627%), provide evidence for the segmented market hypothesis (SMH) (
Mueller and Culbertson 1982). Together, these results suggest that regional integration remains weak, with connectedness largely episodic rather than structural.
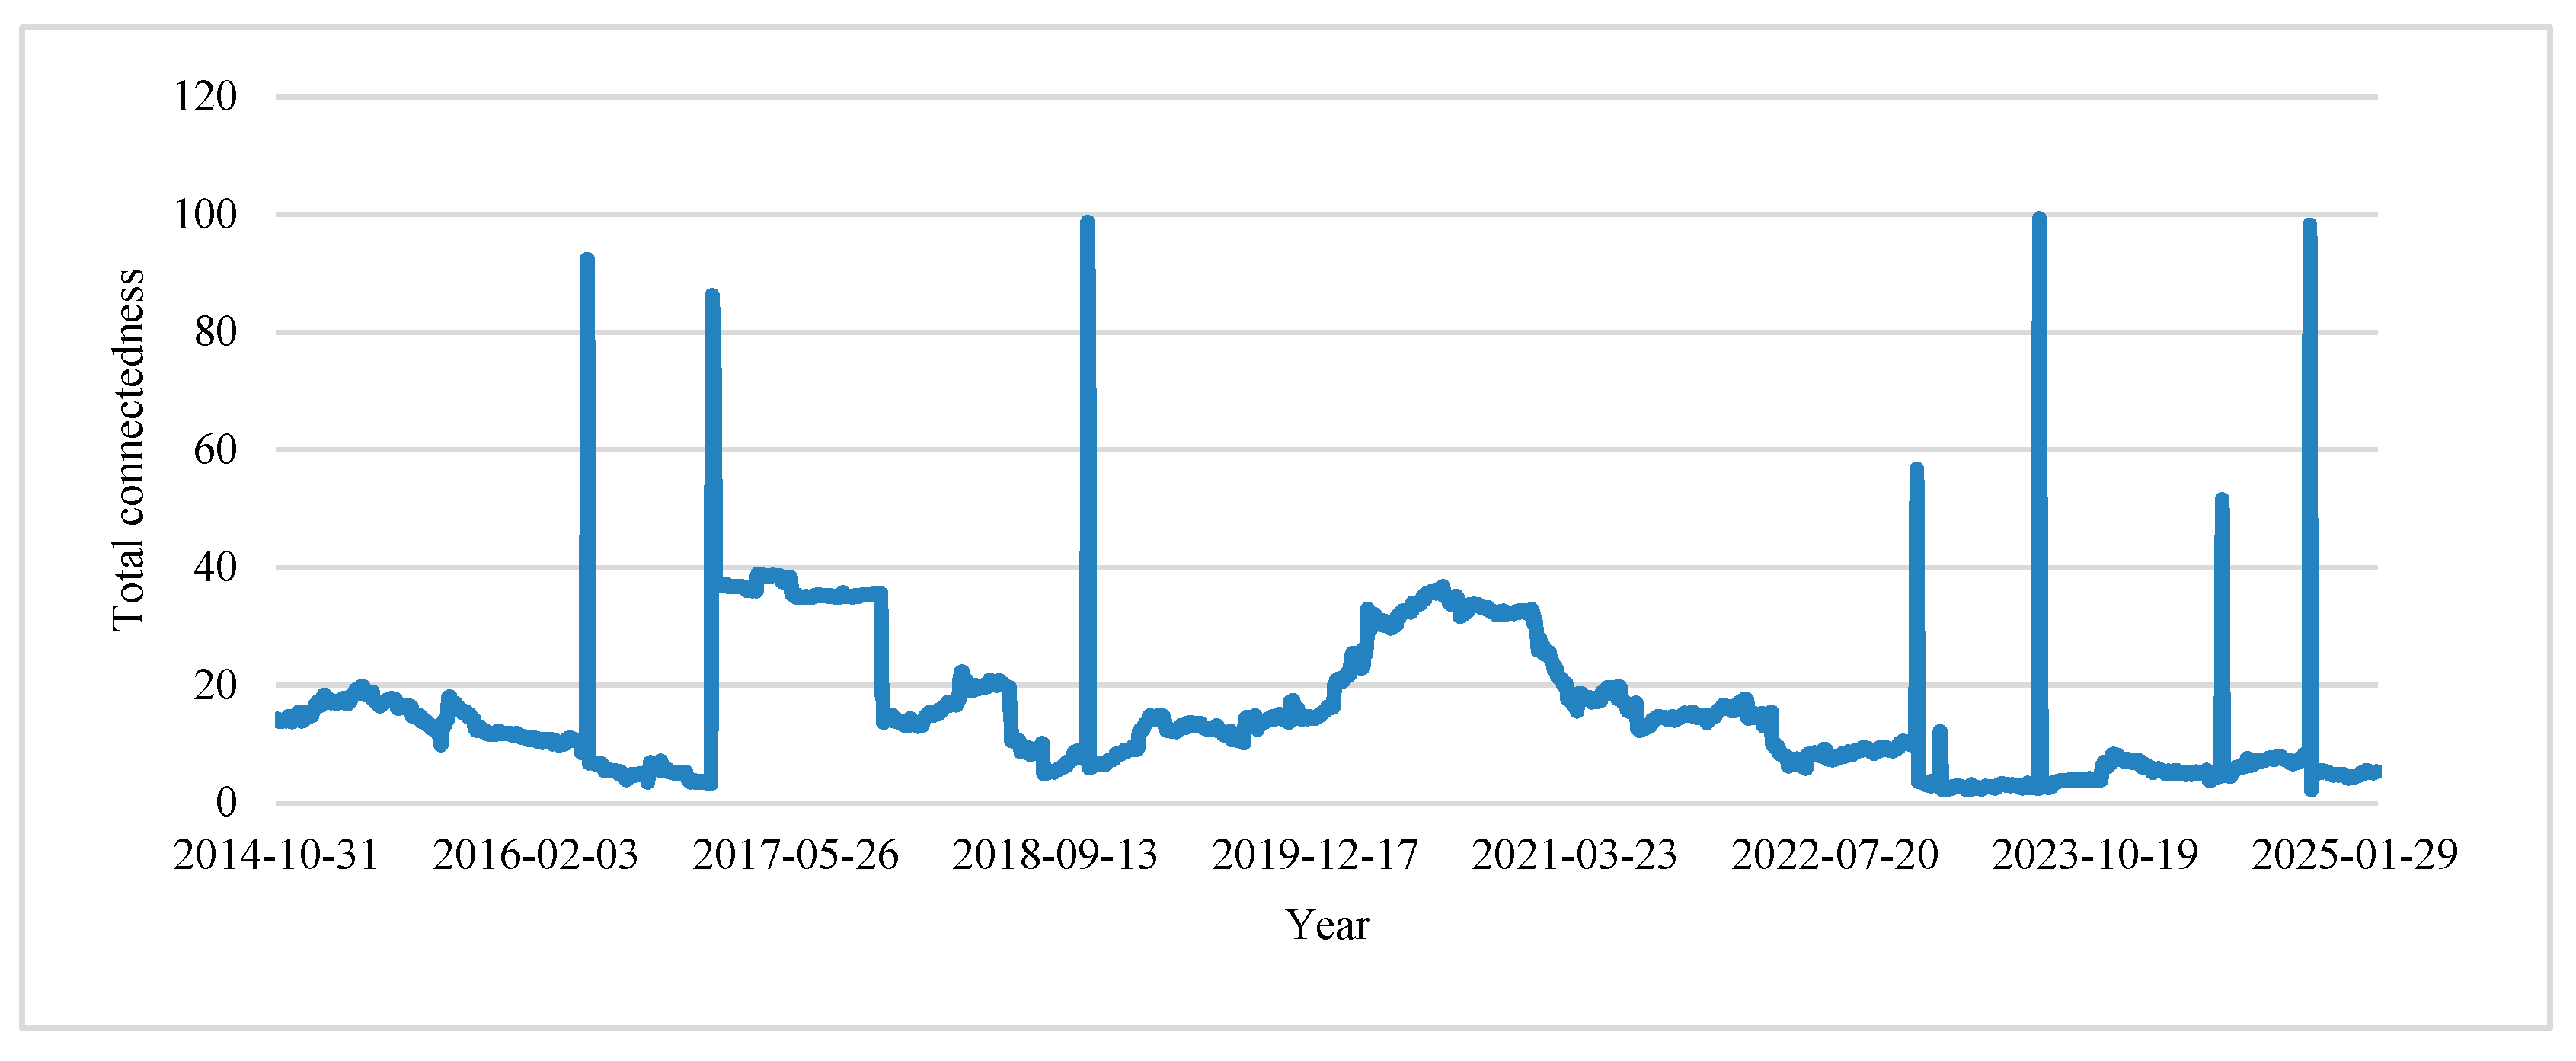
The time-varying total connectedness plot in
Figure 1 illustrates the evolution of volatility spillovers among East African stock markets (NSE, RSE, DSE, USE) between 2015 and 2025. Based on the
Diebold and Yılmaz (
2014) framework, it tracks systemic interdependence and provides insight into structural risks. For much of the period, particularly in 2015–2016, 2022, and early 2024, connectedness remained below 20%, consistent with fragmented or segmented markets. These subdued levels of integration support the segmented market hypothesis (
Peng et al. 2024), as poor liquidity, limited cross-listings, and thin trading volumes restricted volatility transmission in regional bourses (
Musembi 2020;
Yunvirusaba et al. 2019).
By contrast, distinct episodes of heightened spillovers were recorded in 2017, 2019–2021, and after 2024, when connectedness often exceeded 40% and peaked near 90%. These surges signal systemic stress linked to regional political instability, electoral uncertainty, and global disruptions such as the COVID-19 pandemic (
Miku and Katunzi 2024;
Nyangasi and Olukuru 2017). Such dynamics align with the AMH advanced by
Lo and Zhang (
2024), which highlights the evolving nature of efficiency under shifting macroeconomic and behavioural conditions. Comparable findings by
Atenga and Mougoué (
2021) attribute these asymmetric spillovers to institutional fragility, reinforcing the vulnerability of regional markets during shocks.
A period of persistent mid-level connectedness emerged between 2018 and 2021, with plateaus around 30–40%. This pattern reflects semi-integration, where volatility contagion becomes structurally embedded. The behaviour contradicts the Efficient Market Hypothesis (
Fama 1960,
2021), as volatility spread was driven not only by fundamentals but also by behavioural and sentiment channels (
Fei and Liu 2021;
Kahneman and Tversky 2013). These clusters of volatility are consistent with Minsky’s Financial Instability Hypothesis (
Minsky 1992), which argues that prolonged stability, such as in 2016 and 2022, often fosters risk accumulation. The resulting instability was evident in the crisis-laden spikes of 2017 and 2020.
Following 2022, connectedness reemerged at lower levels despite continuing global uncertainties, suggesting segmentation or lagged transmission. This behaviour supports
Rigobon’s (
2019) cautionary view that increases in correlations should not be hastily interpreted as contagion. The USE consistently maintained minimal outbound spillovers, reinforcing its peripheral role and limited integration, as noted by (
Kamuhanda 2020;
Yunvirusaba et al. 2019). In contrast, the NSE repeatedly acted as the dominant transmitter of volatility, particularly during spikes, consistent with (
Ahmed and Huo 2018;
El-Gayar et al. 2021). These studies attribute the NSE’s transmission role to its deeper liquidity, foreign investor concentration, and speculative capital flows.
Table 7 synthesises the roles of each market in the regional volatility network. The NSE clearly functions as the regional hub and dominant transmitter, consistently exporting more volatility than it receives, reflecting its deeper liquidity, broader investor base, and extensive cross-listings. The RSE exhibits a mixed role, acting as a net transmitter in long-run averages but reverting to a net receiver in short-run snapshots, suggesting that its influence is episodic and regime-dependent. The DSE is structurally a net receiver, absorbing more volatility than it transmits, consistent with Tanzania’s cautious financial openness and segmented capital flows. The USE emerges as a passive absorber, receiving substantial spillovers while exerting minimal influence on neighbouring markets, a pattern consistent with its thin trading and limited foreign participation.
4.4. Discussion
This study set out to disentangle volatility spillovers, system-wide connectedness, and contagion in East African equity markets by integrating ARMA–GARCH diagnostics, ADCC–GARCH conditional correlations, and the Diebold–Yilmaz connectedness framework. The results reveal a layered and regime-dependent structure of interdependence, characterised by segmentation under normal conditions and temporary synchronisation during periods of systemic stress. As shown in
Table 1, volatility persistence is uniformly high across markets, reflecting frontier-market microstructure features. Meanwhile, ADCC–GARCH estimates in
Table 2 and
Table 3 indicate weak but unstable short-run correlations, whereas the Diebold–Yilmaz spillover measures in
Table 4,
Table 5 and
Table 6 and
Figure 1 demonstrate that system-wide connectedness rises sharply only during crisis episodes.
At the baseline level, ARMA–GARCH diagnostics confirm that volatility dynamics in East African markets may be primarily shaped by structural features such as illiquidity, thin trading, and delayed information absorption. High volatility persistence across markets reflects frontier-market microstructure rather than excessive cross-market dependence. During these tranquil periods, both ADCC–GARCH conditional correlations and Diebold–Yilmaz connectedness indices remain low, indicating weak spillovers and limited system-wide integration. This pattern supports the segmented market hypothesis, suggesting that East African equity markets operate largely independently in the absence of major shocks.
The ADCC–GARCH results further demonstrate that conditional correlations are generally weak, unstable, and occasionally negative, reinforcing the absence of persistent integration. Importantly, these correlations exhibit episodic surges rather than sustained increases, particularly during periods of regional or global stress. Such behaviour reflects co-movement, not contagion per se. Consistent with the AMH, correlations strengthen temporarily as investors adapt to changing risk environments and weaken once shocks dissipate.
The Diebold–Yilmaz framework adds a system-wide perspective by aggregating bilateral spillovers into measures of connectedness. Average connectedness remains low over most of the sample period, confirming that spillovers do not translate into enduring regional integration. However, sharp spikes in connectedness are observed during crisis episodes, including election-related uncertainty, the COVID-19 pandemic, and periods of heightened geopolitical risk. These abnormal increases, relative to tranquil baselines, are interpreted as contagion, defined not by the presence of spillovers alone, but by their temporary amplification beyond normal interdependence.
Within this structure, markets play distinct and time-varying roles. The NSE consistently emerges as the dominant transmitter of volatility spillovers, reflecting its superior market quality and extensive cross-listing activity. By contrast, the USE functions largely as a shock absorber, receiving volatility from regional peers while transmitting little outward, consistent with its shallow depth and limited foreign participation. The RSE and DSE occupy intermediate positions, occasionally acting as net transmitters in long-run averages but reverting to net receivers during short-run stress episodes. These shifting roles highlight that spillover leadership in frontier markets is not solely determined by size but is also shaped by behavioural forces, speculative flows, and institutional fragility.
Taken together, the findings indicate that spillovers identify directional transmission, connectedness captures the degree of system-wide interdependence, and contagion arises only when these linkages intensify abnormally during crises. East African equity markets, therefore, exhibit conditional segmentation: they remain loosely connected in normal times but become temporarily synchronised when exposed to shared shocks. This dual structure aligns with both the AMH and the Financial Instability Hypothesis, which emphasise that stability can conceal fragility and that integration is neither linear nor permanent in frontier financial systems.



 ,
,