Article

Dynamic Connectiveness and Time-Varying Contagion Risks Amongst East African Stock Markets

by
Arnold Gideon Irangi
1,
Paul-Francois Muzindutsi
1,*,
Hilary Tinotenda Muguto
1 and
Malibongwe Cyprian Nyati
2,*
1
School of Commerce, Department of Finance, Westville Campus, University of KwaZulu Nata, Durban 4001, South Africa
2
Department of Economics, Faculty of Economics and Finance, Ga-Rankuwa Campus, Tshwane University of Technology, 2827 Botsi St, Ga-Rankuwa Unit 2, Ga-Rankuwa 0208, South Africa
*
Authors to whom correspondence should be addressed.
Risks 2026, 14(3), 52; https://doi.org/10.3390/risks14030052
Submission received: 9 January 2026 / Revised: 6 February 2026 / Accepted: 11 February 2026 / Published: 2 March 2026

Abstract

Regional financial integration in East Africa remains shallow, yet contagion risks persist due to market fragility and illiquidity. Using daily data from 2014 to 2025 from the Nairobi Securities Exchange (NSE), Dar es Salaam Stock Exchange (DSE), Rwanda Stock Exchange (RSE), and Uganda Securities Exchange (USE), this study examines volatility spillovers, dynamic connectedness, and contagion through autoregressive moving average – generalised autoregressive conditional heteroscedasticity (ARMA–GARCH) diagnostics, asymmetric dynamic conditional correlation (ADCC–GARCH) correlations, and the Diebold–Yilmaz framework. The results show weak spillovers and limited connectedness in tranquil periods, reflecting persistent segmentation. However, systemic stress triggers abnormal surges in correlations and connectedness, consistent with contagion as a temporary amplification of cross-market linkages. The NSE emerges as the dominant transmitter, driven by liquidity and cross-listings, while the USE acts as a passive absorber. The RSE and DSE alternate between marginal transmitters and receivers depending on conditions. These findings support the Adaptive Market and Financial Instability Hypotheses, underscoring the need for harmonised regulation, liquidity reforms, and adaptive risk management to bolster resilience.

1. Introduction

The deepening of global financial integration has intensified the transmission of shocks between markets, making it essential to understand how financial systems interact during crises. Distinguishing between contagion and spillover effects is central to assessing the vulnerability of emerging markets to external shocks. This distinction is particularly relevant for East African stock markets, which remain characterised by low liquidity, a narrow investor base, and growing exposure to international capital flows (Biau 2018). Recognising these dynamics is vital for policymakers and investors seeking to navigate fragile but increasingly interconnected markets.
In its strictest definition, contagion refers to a marked rise in market linkages during financial crises that cannot be explained by underlying fundamentals or pre-existing relationships (Rigobon 2019). It represents a structural shift in the transmission of shocks, often intensified by investor behaviour such as herd mentality, panic-driven selloffs, or abrupt portfolio reallocations in response to shifts in global risk perceptions (El-Gayar et al. 2021). This behaviour, often labelled irrational exuberance (Klinger et al. 2022), reflects the sporadic and short-lived reactions of investors who ignore fundamentals and follow the herd, frequently driven by fear of missing out (Gupta and Shrivastava 2022).
Spillovers, by contrast, describe the routine transmission of shocks across markets through established channels of trade, investment, and policy. They occur in both tranquil and turbulent periods, reflecting underlying connections such as shared macroeconomic conditions, overlapping investor bases, or coordinated policy frameworks. Unlike contagion, spillovers do not involve abrupt structural changes but rather represent the normal degree of interdependence that arises from globalisation and deepening financial integration (Yunvirusaba et al. 2019). Thus, spillovers reflect structural linkages grounded in fundamentals, while contagion signals a behavioural amplification of shocks.
East African stock markets are particularly vulnerable to contagion and spillover risks because of their push toward integration and cross-listing. Institutions such as the East African Securities Regulatory Authority (EASRA) and the East African Securities Exchanges Association (EASEA) have promoted regulatory convergence and oversight, while cross-listings provide further evidence of interdependence. Currently, nine firms listed on the Nairobi Securities Exchange (NSE) are cross-listed on the Uganda Securities Exchange (USE), five on the Dar es Salaam Stock Exchange (DSE), and four on the Rwanda Stock Exchange (RSE), highlighting growing linkages (Yunvirusaba et al. 2019).
These initiatives promote efficiency and broaden access to capital, yet they also heighten the risk that instability in one market can quickly spread across others, exposing the region to systemic vulnerabilities. Despite institutional progress, East African exchanges—NSE, DSE, RSE, and USE—remain structurally fragile. While demutualisation has improved transparency and investor protection (Biau 2018; Kengere 2023; Makau et al. 2015), reliance on foreign capital increases vulnerability, and varied ownership policies further complicate dynamics: Uganda imposes no restrictions, Tanzania enforces a 60% cap, and Kenya applies sector-specific limits (Kengere 2023).
During times of stress, foreign investors frequently reallocate funds to safer markets in a ‘flight-to-quality’ response (Bloom 2009), increasing volatility and destabilising already fragile liquidity conditions. Added to this are regional geopolitical risks, such as instability in South Sudan and Somalia, which compound uncertainty and magnify the potential for both contagion and spillovers across East African bourses. This happens through abrupt capital outflows, shifts in investor sentiment, and heightened risk premiums that transmit shocks across interconnected exchanges. Thus, the interaction of financial fragility and geopolitical instability amplifies systemic risk and weakens market resilience.
The distinction between contagion and spillovers is not only academic but carries direct policy implications. Empirical evidence shows that failing to separate the two may lead to misaligned policy responses (Bekaert et al. 2014; Rigobon 2019). In African financial markets, which are increasingly shaped by foreign portfolio inflows (FPIs), the mode of transmission, whether fundamental spillovers or behavioural contagion, has material consequences for asset pricing, capital stability, and systemic resilience. Given their structural vulnerabilities, East African markets are likely to exhibit both effects, though their intensity may vary across time and regimes.
Yet, despite growing integration, empirical research on East African stock markets remains limited. Kengere (2023) analysed volatility persistence and asymmetry using symmetric and asymmetric GARCH models but did not account for time-varying spillovers. Other studies examined MENA markets (Ferreira et al. 2023; Huang et al. 2024) or exchange-traded funds (Kunjal 2023), which are less relevant in the region. Research on frontier markets is also scarce (Nyakurukwa and Seetharam 2023), while East Africa-focused work (Yunvirusaba et al. 2019) excluded Rwanda and overlooked dynamic interdependencies across the markets.
This study addresses these gaps by applying ADCC–GARCH models, which allow for the detection of asymmetric volatility spillovers, alongside the Diebold–Yilmaz spillover index, which captures the evolution of time-varying systemic risk. By integrating these two complementary approaches, the analysis provides a more nuanced understanding of how shocks transmit across markets. The study further examines contagion and spillover dynamics under both normal and crisis conditions, offering valuable insights into the nature of systemic risk, the scope for portfolio diversification, and the overall resilience and stability of East African financial markets.
The remainder of the paper is structured as follows: Section 2 reviews the literature, Section 3 describes the data and methodology, Section 4 presents results and discussion, and Section 5 concludes and sets out policy implications.

2. Literature Review

2.1. Theoretical Conceptualisation

This study applies the Efficient Market Hypothesis (EMH), Behavioural Finance, the Adaptive Market Hypothesis (AMH), and Minsky’s Financial Instability Hypothesis (FIH) to explain contagion and volatility spillovers in East African markets. The EMH offers a baseline of efficiency but misses time-varying anomalies. Behavioural Finance highlights sentiment and biases, the AMH allows efficiency to shift across regimes, and the FIH shows how stability breeds fragility. Together, they provide a multidimensional lens on the behavioural and structural dynamics of frontier markets.

2.1.1. Efficient Market Hypothesis (EMH)

The EMH, first formalised by Fama (1960, 2021), posits that stock prices fully reflect all available information, whether past (weak form), public (semi-strong), or private (strong). From this perspective, contagion across East African Community (EAC) markets should arise only from shared fundamentals, such as trade linkages or macroeconomic shocks, not from sentiment or political risks. For example, election violence in Kenya should not, under EMH logic, spill over to the Dar es Salaam Stock Exchange unless it directly affects regional commerce. Yet, empirical studies of frontier markets reveal persistent deviations from efficiency. Biau (2018) finds that illiquidity and thin trading weaken price discovery in the Nairobi Securities Exchange, while Ochieng et al. (2023) highlight semi-strong efficiency at best in the DSE and USE. Thus, while the EMH provides a starting point, its assumptions do not align with the behavioural and structural realities of East African bourses, necessitating alternative approaches.

2.1.2. Behavioural Finance and Prospect Theory

Behavioural Finance (BF), grounded in Kahneman and Tversky’s (2013) prospect theory, challenges the EMH by showing that investor behaviour is shaped by heuristics, biases, and emotions rather than pure rationality. Key mechanisms include loss aversion, overreaction, and herding, which often trigger contagion unrelated to fundamentals. In the EAC, terrorism threats in Nairobi (Caldara and Iacoviello 2022) and Kenya’s grey listing by FATF have spurred panic selling and capital flight, spreading volatility to neighbouring bourses. Empirical evidence further supports this: Ochieng et al. (2023) show that Kenya’s electoral violence has induced correlated selloffs in Uganda and Tanzania, despite having no direct economic impact. Moreover, the dominance of foreign portfolio investors in thinly traded markets exacerbates sentiment-driven contagion (Musembi 2020). These examples demonstrate how behavioural forces, rather than fundamentals, explain contagion and volatility clustering in East African markets.

2.1.3. Adaptive Market Hypothesis (AMH)

The AMH, developed by Lo (2004) and extended by Lo and Zhang (2024), integrates elements of the EMH and BF by proposing that market efficiency evolves as investors adapt to changing environments. In contrast to the EMH’s static framework, the AMH allows efficiency to fluctuate with macroeconomic shocks, regulatory shifts, and behavioural changes. In East Africa, markets may appear weakly correlated during tranquil times, yet shocks such as COVID-19, cross-border disputes, or post-election unrest induce herding, sentiment contagion, and higher co-movements (Makau et al. 2015; Shen et al. 2023). For instance, Rwanda’s relatively insulated RSE has historically decoupled from Kenya’s NSE, but correlations increase sharply during regional crises. This time-varying nature of efficiency makes the AMH particularly relevant to EAC markets, where thin liquidity, sporadic trading, and foreign capital dominance mean that shocks propagate differently across regimes of stability and stress.

2.1.4. Financial Instability Hypothesis (FIH)

Minsky’s (1992) FIH complements the AMH by detailing how prolonged stability paradoxically breeds fragility. According to Minsky, economic calm encourages excessive risk-taking, with firms moving from hedge financing, covering principal and interest, to speculative (covering only interest) and eventually Ponzi financing, reliant on new borrowing or asset inflation (Palley 2009). This progression creates systemic fragility, where even small shocks can trigger crises. In East Africa, periods of relative macroeconomic stability have encouraged speculative surges in banking and equity markets, leaving them vulnerable to reversal under stress. For example, Kenyan banks’ aggressive credit expansion in stable periods has historically heightened systemic risk during downturns. The FIH, therefore, sharpens the AMH’s adaptive perspective by explaining the mechanisms through which stability-driven excess translates into contagion and spillovers, making it crucial for understanding East Africa’s cyclical vulnerability to external shocks.

2.2. Empirical Literature

Empirical studies on volatility spillovers and contagion initially relied on static GARCH models, which often underestimated dynamic and bidirectional effects. Hamao et al. (1990), analysing the 1987 crash, identified unidirectional spillovers across US, UK, and Japanese markets, but their static framework was unable to capture feedback loops or time variation. Later studies incorporated more sophisticated approaches. For instance, Umar et al. (2022) used TVP-VAR to reveal how interdependencies evolve during crises, while Wang (2024) applied DCC-GARCH to show that correlations intensify asymmetrically during shocks such as COVID-19 and the Russia–Ukraine conflict. These approaches highlight that spillovers are not constant but crisis-dependent. However, their focus on advanced economies and global data limits direct applicability to frontier markets, where liquidity constraints and structural inefficiencies shape distinct contagion dynamics and where shallow market depth, low trading volumes, and weak institutional frameworks often amplify the impact of external shocks.
Subsequent research incorporated broader risk factors to explain volatility transmission. Hu and Borjigin (2024), employing TVP-VAR-SV and DCC-MVGARCH, demonstrated that geopolitical risk and economic policy uncertainty amplify volatility spillovers between global stock and energy markets. Their findings contrast sharply with Hamao et al.’s (1990) earlier results, as the inclusion of exogenous risks revealed new transmission mechanisms. Similar dynamics have been observed in African contexts, with Ahmed and Huo (2018) applying Bayesian VAR and BEKK-GARCH to show bidirectional volatility flows from China to 15 African exchanges. This reflects China’s deepening trade and investment links with the continent and implies that East African Community (EAC) markets could face comparable contagion risks through regional channels, such as Kenya’s cross-listed equities. Yet, as Hearn (2009) and Yunvirusaba et al. (2019) caution, BEKK-GARCH models may mask asymmetric or time-varying features, particularly in illiquid markets, raising doubts about the robustness of such findings in frontier economies.
African-focused studies have also employed the Diebold and Yılmaz (2012) spillover index to map systemic risk. Atenga and Mougoué (2021) showed that African bourses were net receivers of shocks, with volatility spillovers dominating return spillovers during the 2008 Crisis and the 2012 Eurozone debt crisis. Their results diverge from Ahmed and Huo’s (2018) evidence of bidirectional flows, partly due to methodological differences—since the spillover index emphasises net effects and partly because transmission channels vary by crisis, with commodity shocks playing a greater role in Africa. Recent work strengthens this commodity link. Logogye et al. (2024) used asymmetric BEKK-GARCH to reveal a 30% surge in volatility spillovers among Nigerian, Ghanaian, and Ivorian markets during COVID-19, driven by oil and cocoa shocks. Similarly, Uhunmwangho and Omorokunwa (2022) applied DCC-MGARCH to detect speculative bubbles in Kenya and Nigeria, linking them to global and political shocks. These studies underline African markets’ fragility, often reflected in their reliance on commodity exports and political turbulence exposure.
Evidence on East African frontier markets is growing but remains fragmented. Yunvirusaba et al. (2019) documented volatility clustering and slow mean reversion in the NSE and DSE using standard GARCH models. More recent studies by Kengere (2023) and Wasonga and Osiemo (2023) reported persistent volatility and stronger co-movements across East Africa during the COVID-19 pandemic, though their findings varied depending on whether wavelet or GARCH approaches were employed. Despite these contributions, empirical coverage of Rwanda’s RSE and Uganda’s USE remains sparse, and few studies have employed tools capable of capturing asymmetries or time variation. This methodological gap, coupled with the neglect of region-specific disruptions such as election-related violence and cross-border tensions, motivates the present study. By applying ADCC–GARCH models alongside the Diebold–Yilmaz spillover index, this research provides a richer account of contagion and systemic risk in East African markets under both normal and crisis conditions.

3. Methodology

3.1. Data

Price data on all market share indices used in this study were obtained from the Bloomberg Terminal, covering the period from 2014 to 2025, based on availability, particularly for newer exchanges such as Rwanda. Daily data were employed to capture short-term volatility and enhance robustness (Huang et al. 2024), as the higher frequency allowed for the identification of abnormal returns around specific events and the isolation of their impact on stock performance. Market indices were employed instead of individual stock prices because they provide broader representation and reduce firm-specific idiosyncratic risk (Kamazima and Omurwa 2018; Zaimovic et al. 2021). All indices were log-transformed to facilitate econometric analysis and ensure continuous compounding of returns (Brooks 2019). For the Nairobi Stock Exchange, the Nairobi All-Share Index (NSEASI) was adopted, as it is a market capitalisation-weighted index that tracks the performance of all listed shares, thereby allowing for more meaningful cross-market comparisons.
Continuously, compounded log returns are then computed as below.
r t = ln ( P t / P t 1 )

3.2. Methods of Analysis

The ADCC–GARCH model, developed by Cappiello et al. (2006), was applied to capture asymmetrical effects and to measure spillover intensity across markets. This framework allows for time-varying conditional correlations, highlighting how negative shocks in one market can heighten correlations with others, thereby signalling stronger contagion. Finally, the mean return series for each exchange was modelled as an ARMA (p,q) (Brooks 2019; Tsay 2005). This is done to tackle the serial correlation that is present in thinly traded markets (Brooks 2019; Tsay 2005).
r t = μ + i = 1 p ϕ i r t i + j = 1 q ϕ i ε t i + ε t
where r t is an n × p matrix of log-returns of stock market indices for each bourse at time t , while μ is the expected value of the conditional return. α is the n × q coefficient for the autoregressive return coefficients, while ε t are the residuals modelled as the squared value of the previous error term. The residuals from the above return series are used to generate conditional variances. Thereafter, the conditional variances for each market are extracted via a GARCH (1,1) model, as below.
h i , t 2 = ω i + α i ε i , t 1 2 + β i h i , t 1 2 (GARCH,1,1)
Each market’s conditional variance follows a GARCH process. The next step is to extract a standardised residual for market i , at time t , from the univariate GARCH models for each market, ensuring that each shock has a unit variance. The standardised residual for market i at time t is obtained as follows:
z i , t = ε i , t / h i , t
z i , t = z 1 , t z 2 , t z 3 , t z n , t R n × 1
where z t z t is an n × n matrix. Each element i j captures co-movement between markets i and j .
Following Cappiello et al. (2006), we specify a modified Asymmetric Dynamic Conditional Correlation (ADCC) model. Let Q t denote the unstandardised conditional correlation matrix. Its dynamics are given by
Q t = 1 a b Q ˇ + a . z t 1 z t 1 + b Q t 1 + g η t 1 η t 1 + b Q t 1
where Q t   —is the time-varying correlation matrix at time t . Q   ˇ is the long-run average correlation matrix and η t = z t 1 ( z t < 0 ) is the elementwise product; the indicator equals 1 for negative components, where 1 ( z t < 0 ) is an n × 1 indicator vector and denotes element-wise multiplication
So:
η t = z 1 , t 1 ( z 1 , t < 0 ) z n , t 1 ( z n , t < 0 )
Again η t R n × 1 and η t η t R n × n .
While a is the coefficient of past shocks’ impact on correlations, b —is the coefficient of past correlation persistence. g is the extra effect from negative shocks (asymmetry), whereas z t 1 z t 1 —is the outer product of standardised residuals from the previous period. Additionally, η t —is the asymmetric residual capturing negative shocks. Lastly, g —is the asymmetric parameter reflecting how negative shocks increase correlations. The parameters achieve the non-negativity conditions: a 0 , b 0 , g 0 , a + b + g < 1 . The diagonal elements of the correlation matrix Q t are standardised to obtain the conditional correlational R t . This ensures that R t is a proper correlation matrix with values between −1 and 1. The conditional correlation matrix is obtained from the following specification:
R t = d i a g Q t 1 2     Q t d i a g ( Q t ) 1 2
Utilising the correlational matrices R t , it is possible to observe how correlations, in this case co-movements and contagion risks, evolve. The correlation matrices spike during heightened contagion risks. On the other hand, when the asymmetric parameter ( g ) is significant and positive, this suggests that negative shocks, such as market downturns, lead to higher correlations, signalling contagion. Notwithstanding its strengths, the ADCC–GARCH framework faces limitations in illiquid frontier markets such as the USE and, to a lesser extent, the RSE and DSE. Thin trading, sparse price observations, and microstructure noise can bias conditional variance and correlation estimates, producing spurious persistence or exaggerated asymmetry in low-liquidity contexts (Chordia et al. 2008; Easley and O’Hara 1987; Kyle 1985). Zero returns, stale prices, and asynchronous trading further undermine the reliability of dynamic correlations and weaken spillover inference (Engle and Bollerslev 1986; Engle 1982; Tsay 2005). These concerns are mitigated here through daily data, diagnostic checks for ARCH effects, and complementary use of the Diebold–Yilmaz connectedness framework, which offers a variance-decomposition perspective less sensitive to high-frequency liquidity frictions (Diebold and Yılmaz 2012, 2014; Hamao et al. 1990).
While Equations (2)–(8) capture time-varying pairwise correlations (contagion in co-movements), Equation (9) introduces a separate but complementary framework, the Diebold–Yilmaz connectedness model, to quantify system-wide volatility transmission using forecast-error variance decompositions. The two approaches are not nested models; they answer different questions: ADCC measures how correlations change over time, whereas Diebold–Yilmaz measures how shocks flow across markets. To determine the nature of spillovers amongst the East African markets, the Diebold–Yilmaz index is used to analyse which market acts as a net receiver or transmitter. A time-varying vector autoregressive parameter is employed following Liu and Gong (2020).
Y t = A 1 y t 1 + A 2 y t 2 + + A p y t p + ε t
where Y t —is the vector of the market returns from multiple East African markets. Y t i   —is a vector of past returns.   A i —are coefficient matrices, while   ε t —is a vector of innovations or shocks with zero mean and a covariance matrix   Σ t . To explain the evolution of parameters over time, a state equation is employed below.
ε t ~ N ( 0 , Σ t ) ,   Σ t = d i a g ( σ t   1 2 ,   σ t   2 , , 2 σ t   n 2 )
where σ t   i 2 is the time-varying variance of market (i), modelled as a latent stochastic process via a state-space approach.
To quantify how shocks propagate across markets, we rely on the generalised forecast-error variance decomposition (GFEVD) approach of Diebold and Yılmaz (2012, 2014). This framework allows us to determine the proportion of a market’s future forecast-error variance that can be attributed to innovations originating in other markets, rather than its own shocks. The resulting variance shares provide a structured measure of bilateral spillovers while remaining invariant to variable ordering. The H-step-ahead generalised forecast-error variance decomposition is defined as:
θ i , j ( H ) = ψ i , j ( H ) j = 1 N ψ i , j ( H )
where θ i , j ( H ) measures the proportion of the H-step forecast-error variance of the market i that is total connectedness (system-wide spillovers) attributable to the market j , where ψ i , j ( H ) denotes the cumulative impact of shocks from market j   on market i over horizon H . The denominator normalises the variance shares so that each row sums to 100.
Having obtained the pairwise variance shares, we aggregate them to construct a system-wide measure of interconnectedness. The Total Connectedness Index (TCI) captures the percentage of total forecast-error variance that originates from cross-market shocks rather than own-market innovations. A higher value of this index implies stronger interdependence and greater potential for systemic risk transmission across East African equity markets. The total connectedness index is given by:
S ( H ) = i = 1 N j = 1 ,   j i N θ i , j ( H ) i = 1 N j = 1 N θ i , j ( H ) × 100
where S ( H ) is the total connectedness index at horizon H and N is the number of markets (NSE, DSE, RSE, USE). The numerator sums only cross-market spillovers ( i j ). The denominator includes both own-market and cross-market effects.
A higher S ( H ) implies stronger system-wide interdependence. While the TCI summarises overall market integration, it does not reveal which markets are driving spillovers. To address this, we compute directional connectedness measures that distinguish between volatility transmitted to a market and volatility received from others. This allows us to identify whether each market acts primarily as a shock transmitter, receiver, or intermediary within the regional network. The spillovers received by market i from all other markets are:
S i ( H ) = j = 1 ,   j i N θ i , j ( H )
The preceding equation measures how much volatility market i absorbs from others. To evaluate the relative role of each market in the regional volatility network, we compute net spillovers as the difference between volatility transmitted to other markets and volatility received from them. This measure enables us to classify markets as net transmitters or net receivers of shocks over the forecast horizon.
S i ( H ) = j = 1 ,   j i N θ j , i ( H )
N e t i H = j i d i j ( H ) j i d j i ( H )
where d i j ( H ) is the share of the H-step forecast-error variance of market i explained by shocks to market j . The matrix D = [ d i j ] is, therefore, the normalised variance-decomposition matrix, whose rows sum to 100. A positive N e t i means market i is a net transmitter of volatility; a negative value means it is a net receiver following (Diebold and Yılmaz 2014):
T C I ( H ) = i = 1 N j = 1 ,   j i N d i j ( H ) i = 1 N j = 1 N d i j ( H ) × 100
This expresses the proportion of total forecast-error variance that comes from cross-market spillovers.

4. Statistical Results and Discussion

4.1. Preliminary Tests

The preliminary test results of this analysis are shown in Table 1 below. Accordingly, stationarity, essential for GARCH modelling (Brooks 2019), is confirmed across all return series: ADF statistics are significantly negative and KPSS values are below thresholds, supporting mean reversion (Campbell et al. 1998; Kengere 2023). ARCH LM tests for RSE, NSE, DSE, and USE are highly significant (LM = 235–1090, p < 0.01), evidencing volatility clustering and conditional heteroskedasticity typical of frontier markets, justifying GARCH use (Brooks 2019; Muguto and Muzindutsi 2022).
ARMA–GARCH diagnostics, selected via Akaike information criterion (AIC) with Student-t innovations, effectively capture autocorrelation and heavy tails. AIC is preferred over Bayesian information criterion (BIC) in small or noisy samples typical of frontier African markets, where thin trading, zero-return days, and missing data reduce effective sample size (Brooks 2019; Enders 2012). Residual checks show limited outliers in the NSE (2), DSE (14), and USE (4), but many in the RSE (52), consistent with illiquid trading structures (Kuttu 2018; Yunvirusaba et al. 2019). Model adequacy is evaluated using Ljung–Box and ARCH-LM tests on standardised and squared residuals. High p-values confirm the absence of serial correlation and conditional heteroskedasticity, indicating that the ARMA–GARCH specifications effectively capture return dependence. To test robustness against extreme observations, returns are winsorised, and the models are re-estimated. The resulting winsorised persistence ( α   +   β ) reflects volatility dynamics after mitigating outlier effects, without altering the fundamental GARCH parameters.
Overall, the results confirm stationarity, strong ARCH effects, robustness to extreme returns, and that observed outliers are structural, validating the ARMA–GARCH framework for East African markets.

4.2. ADCC–GARCH Results

Table 2 presents long-run average conditional correlations estimated from the ADCC–GARCH model for the NSE, DSE, RSE, and USE. These correlations are conditional on market-specific ARMA–GARCH volatility dynamics and asymmetric shock responses, and, therefore, summarise baseline co-movement after filtering out heteroskedasticity and transitory volatility effects. As such, they represent structural dependence over the full sample period (2014–2024), rather than short-lived crisis spikes. Contrary to the weak or near-zero correlations often documented for frontier African markets, the estimates reveal consistently positive and economically meaningful co-movements among all four exchanges. This pattern suggests the presence of stronger regional linkages than traditionally reported in the literature, indicating that regional macroeconomic forces, informational flows, and cross-border investment channels may play an increasingly important role in shaping return behaviour (Zhang 2021).
A particularly notable result is the RSE–USE conditional correlation, which attains a value of unity. While this indicates extremely strong co-movement in filtered returns, it should not be interpreted as evidence of full financial integration. In thin and illiquid frontier markets, near-perfect conditional correlations may arise from synchronous trading patterns, overlapping investor participation, limited price discovery, or prolonged periods of low return variability. Similar phenomena have been documented in small and emerging markets, where high correlation estimates reflect shared vulnerability and behavioural synchronisation rather than deep structural integration (Atenga and Mougoué 2021). Accordingly, the RSE–USE result is best interpreted as signalling heightened susceptibility to common shocks, rather than permanent convergence.
Kenya’s NSE, the region’s most sophisticated bourse, also exhibits strong conditional correlations with all three markets. The positive and sizeable associations with the DSE, RSE, and USE indicate that movements in the NSE align closely with broader regional patterns. While this does not imply dominance, it suggests a shared exposure to common shocks, cross-listed firms, and integrated investor sentiment channels, challenging earlier conclusions that Kenya’s advanced market operates independently of its neighbours (Nyakurukwa and Seetharam 2023).
The DSE–USE and DSE–RSE correlations, although relatively lower than NSE-linked pairs, remain positive and non-trivial. These moderate co-movements may reflect shared macroeconomic fundamentals, similar policy regimes, or the influence of regionally integrated corporate structures. Consistent with observations by Logogye et al. (2024), such correlations may represent the early stages of deeper regional synchronisation rather than a fully developed integrated market.
Overall, the conditional correlation matrix indicates that East African equity markets exhibit significantly higher degrees of co-movement than typically assumed. The consistently positive correlations point to the existence of meaningful interdependencies, with implications for both contagion potential and diversification strategies. For investors, these results suggest that cross-market diversification benefits within the region may be more limited than previously believed. For policymakers, the findings highlight the importance of strengthening regulatory harmonisation, enhancing cross-border trading frameworks, and supporting capital-market integration initiatives aimed at consolidating the region into a more unified financial ecosystem (Benos et al. 2024; Claessens 2019).
Table 3 reports the estimated ADCC–GARCH correlation parameters, where θ 1 corresponds to the ARCH term α in Equation (6) and measures the impact of lagged standardised shocks on conditional correlations; θ 2 corresponds to the GARCH persistence term β ; and γ corresponds to the asymmetry parameter g , capturing the differential effect of negative shocks on correlation dynamics. The summary statistics ρ - , ρ m a x , ρ m i n , and σ ρ are computed from the time-varying conditional correlation matrix in Equation (8).
The remaining statistics summarise the resulting time-varying conditional correlations for each market pair, including the mean correlation ρ - ( μ ) , maximum ρ m a x , minimum ρ m i n , and volatility ρ σ , with statistical significance assessed using maximum-likelihood-based test statistics. ADCC–GARCH by Cappiello et al. (2006) is particularly well suited for modelling the dynamic behaviour of financial markets that exhibit evolving co-movement patterns, structural segmentation, and varying sensitivity to shocks, features widely documented across African and frontier markets (Ahmed and Huo 2018; Katzke 2013). Across all market pairs, the estimated ARCH and GARCH parameters are highly consistent, indicating substantial volatility persistence in the region. The dominance of the GARCH term shows that volatility shocks decay slowly, consistent with thin liquidity, intermittent trading, and delayed information absorption traits noted in empirical studies on African market microstructure (Bonga-Bonga and Phume 2022; Enders 2012). This slow dissipation of shocks echoes Minsky’s (1992) Financial Instability Hypothesis, which underscores how prolonged tranquil periods may conceal accumulating fragilities that become evident during episodes of stress.
The asymmetry coefficient is statistically insignificant across all pairs, indicating that negative shocks do not generate stronger correlation responses than positive shocks. This contrasts with the asymmetric contagion frequently observed in more integrated or crisis-sensitive markets (Bekaert et al. 2014; Bossman et al. 2022). In the East African context, the absence of asymmetry is consistent with the region’s still-limited cross-border transmission channels, the small number of cross-listed firms, and relatively low foreign investor synchronisation limiting differential responses to bad news (Makau et al. 2015; Yabara 2012).
The average dynamic correlations ( ρ - ) range from slightly negative in NSE–RSE and DSE–USE to modestly positive values in NSE–DSE, DSE–RSE, and RSE–USE. These figures indicate weak but non-zero integration, aligning with evidence that African equity markets exhibit shallow but emerging financial linkages (Atenga and Mougoué 2021; Nyakurukwa and Seetharam 2023). Rather than full segmentation, the results reflect partial interdependence, likely driven by shared regional macroeconomic conditions, harmonised policy cycles, and cross-listed regional blue-chip firms.
Episodes of synchronisation are visible in the maximum conditional correlations, which range between 0.042 and 0.145. These short-lived surges, most notable for the DSE–RSE and NSE–USE pairs, suggest temporary alignment arising from shared exposure to broader shocks, including global uncertainty events (Bloom 2009), geopolitical tensions (Ferreira et al. 2023), or regional political disruptions (Ochieng et al. 2023). Such episodic co-movement is consistent with the Adaptive Market Hypothesis, which argues that market efficiency and interdependence evolve in response to changing environments and investor learning behaviour (Lo and Zhang 2024).
The variability of correlations is modest across all pairs, but sufficient to indicate that correlations are not static. Even modest volatility in correlation reflects the intermittency of integration, supporting empirical findings that African markets exhibit “on-and-off” connectivity that intensifies under stress but weakens under normal conditions (Logogye et al. 2024; Diebold and Yılmaz 2012, 2014). This reinforces the relevance of time-varying correlation models, which capture the subtleties overlooked by static correlation estimators.
Minimum conditional correlations are negative for all pairs, indicating periods of decoupling or divergence. These episodes may reflect country-specific shocks, idiosyncratic policy responses, or divergent economic fundamentals consistent with evidence that African markets remain fundamentally heterogeneous (Koepke 2019; Analytica 2019). The coexistence of negative minima and positive maxima supports the view of latent but unstable regional connectivity, which activates under certain conditions but dissipates quickly, mirroring patterns documented in East African volatility spillover studies (Yunvirusaba et al. 2019).
Taken together, the ADCC–GARCH results portray East African equity markets as conditionally segmented. They operate largely independently during tranquil periods yet exhibit abrupt increases in co-movement when exposed to shared shocks. This duality captures both the context dependence highlighted in the Adaptive Market Hypothesis (Lo 2004; Fama 2021) and the systemic fragility underscored by the Financial Instability Hypothesis (Minsky 1992; Rosser 2020). Moving from episodic synchronisation to sustained integration will require coordinated reforms in market infrastructure, regulatory harmonisation, and deeper institutional participation objectives, echoing calls from regional policy analyses (Claessens 2019; Biau 2018; Benos et al. 2024).

4.3. Volatility Spillover Analysis

Table 4 presents the average volatility spillovers among East African stock markets based on the Diebold and Yılmaz (2012, 2014) connectedness framework. The “TO” measure captures the total volatility transmitted from a given market to others, while the “FROM” measure reflects the volatility received from external markets. The “NET” spillover, defined as the difference between the TO and FROM measures, indicates whether a market acts as a net transmitter or net receiver of volatility. The diagonal entries, reported as Inc. Own (inclusive own variance share), represent the proportion of forecast-error variance explained by each market’s own shocks, while NPT denotes the net pairwise transmission of volatility between specific market pairs.
The NSE emerges as the dominant net transmitter of volatility, with a TO value of 14.97% exceeding its FROM value of 6.66%, resulting in a positive NET spillover of 8.31%. This reflects the exchange’s deeper liquidity, broader investor participation, and more advanced trading infrastructure, which enhance its capacity to transmit volatility across the region (Makau et al. 2015). Cross-listings and arbitrage opportunities further strengthen this transmission mechanism, consolidating the NSE’s role as the central hub of East African financial markets (Ahmed et al. 2023; Omayo 2016).
Despite its relatively small size, the RSE also appears as a net transmitter of volatility, recording a NET spillover of 7.41%. This outcome can be attributed to increasing cross-listing activity, speculative capital flows, and herd-driven investor behaviour, which amplify volatility transmission even in less liquid markets (El-Gayar et al. 2021). Recent evidence suggests that the RSE’s growing regional exposure allows modest trading volumes to exert disproportionate influence on interconnected markets (Githaiga and Kosgei 2023), highlighting the role of behavioural and structural factors beyond conventional liquidity metrics.
In contrast, the DSE shows marginal net transmission, with a NET value of +0.82%. This subdued role reflects Tanzania’s cautious approach to financial liberalisation and segmented capital flows (Analytica 2019). Although cross-border linkages exist, their effect remains limited, with the market retaining features of semi-integration. Regulatory conservatism and rising economic nationalism further constrain the DSE’s capacity to serve as a regional transmitter (Kamazima and Omurwa 2018). Meanwhile, the Uganda Securities Exchange (USE) acts as the most passive market, with a NET of –16.54%, driven by high incoming volatility (FROM = 23.14%) and minimal outgoing spillovers (TO = 6.60%). This highlights its absorptive role, shaped by illiquidity, weak foreign participation, and shallow market depth (Kamuhanda 2020).
Table 5 reports a snapshot of volatility spillovers across East African stock markets at a specific point in time, derived from the Diebold and Yılmaz (2012, 2014) framework. Unlike Table 4, which presents time-averaged dynamic connectedness measures, Table 5 captures contemporaneous “To”, “From”, and “Net” spillovers, reflecting short-run transmission and absorption of volatility. Consequently, the magnitudes differ from the long-run averages and provide complementary insights into the distribution of regional shocks during relatively stable market conditions.
The NSE demonstrates resilience, receiving modest spillovers from regional peers at 4.13%. Its greater role lies in transmitting volatility, with a “To” value of 7.20% that reinforces its position as a regional hub. The positive net spillover of +3.07% supports its role as a consistent transmitter, in line with its long-term average of +8.31%. This performance is explained by its strong liquidity, broad investor base, and active cross-listings. The smaller magnitude compared to average values suggests that the observation date corresponded to a relatively stable period with limited regional stress.
The RSE is positioned as a net receiver, with “From” spillovers of 5.13%, exceeding its “To” value of 2.94%. This results in a negative net of –2.19%, a notable departure from its average role as a net transmitter of +7.41%. The change points to greater susceptibility to regional shocks and a temporary reduction in its influence. It may also reflect reduced speculative flows or weaker cross-listing activity at the time. Given its smaller size and lower liquidity, the RSE has a constrained ability to spread volatility, reinforcing its peripheral role in the system.
The DSE records the highest “From” spillovers at 6.09%, marking it as the most vulnerable to external shocks in the sample. Although this is below its long-term average of 9.57%, the value still indicates significant regional exposure, consistent with Tanzania’s cautious approach to financial openness. The DSE transmits less volatility outward, with a “To” value of 3.70% compared to its long-term average of 10.39%. The negative net spillover of –2.38% confirms its role as a net receiver, shifting it from a marginal transmitter to a clearer absorber of shocks. This adjustment reflects structural fragilities and reliance on external rather than domestic drivers of volatility.
The USE exhibits limited regional integration, receiving minimal spillovers at 0.48%, well below its long-term average of 23.14%. Its outward transmission of 1.98% is also modest, pointing to shallow market depth and low trading activity. The resulting positive net effect of +1.50% contrasts with its historical role as a strong net receiver of –16.54%. This suggests an unusual reversal, likely linked to episodic or data-specific factors on the observation date. Despite this anomaly, the USE’s influence remains negligible relative to the NSE, and its overall contribution to regional volatility is limited.
Table 6 presents the pairwise spillover estimates for the East African stock markets, with diagonal elements set to 100% to reflect own-market variance contributions. The NSE shows the most pronounced transmission, sending volatility of 5.5856% to the DSE and 3.8834% to the RSE. These values confirm the NSE’s role as a net transmitter (+8.31% NET), consistent with its higher liquidity, diverse investor base, and cross-listing activity (Makau et al. 2015). The strong linkage between the NSE and DSE illustrates deeper economic integration and shared investor participation, as highlighted by Yunvirusaba et al. (2019). This underscores the NSE’s function as a regional hub in volatility propagation.
By contrast, the USE demonstrates minimal outward spillovers, transmitting only 0.1627% to the RSE and 0.2135% to the DSE. Its net effect (–16.54%) positions it as a consistent receiver, a role attributed to limited market depth, low liquidity, and restricted trading volumes (Kamuhanda 2020). Rather than amplifying shocks, the USE largely absorbs them, which reduces its influence in regional connectedness. This characteristic indicates that the USE could serve as a diversification outlet for investors seeking insulation from broader regional volatility, in sharp contrast to the dominant role played by the NSE.
The RSE and DSE exhibit moderate cross-market spillovers, with 4.2807% between them and additional bidirectional flows from the NSE. These outcomes explain the RSE’s atypical position as a net transmitter (+7.41%) and the DSE’s marginal transmission role (+0.82%), which can be linked to cross-listings and speculative flows (El-Gayar et al. 2021). The relatively low Total Connectedness Index (TCI) of 5.2720% and modest Pairwise Connectedness Index (PCI) values, such as the RSE–USE link (0.1627%), provide evidence for the segmented market hypothesis (SMH) (Mueller and Culbertson 1982). Together, these results suggest that regional integration remains weak, with connectedness largely episodic rather than structural.
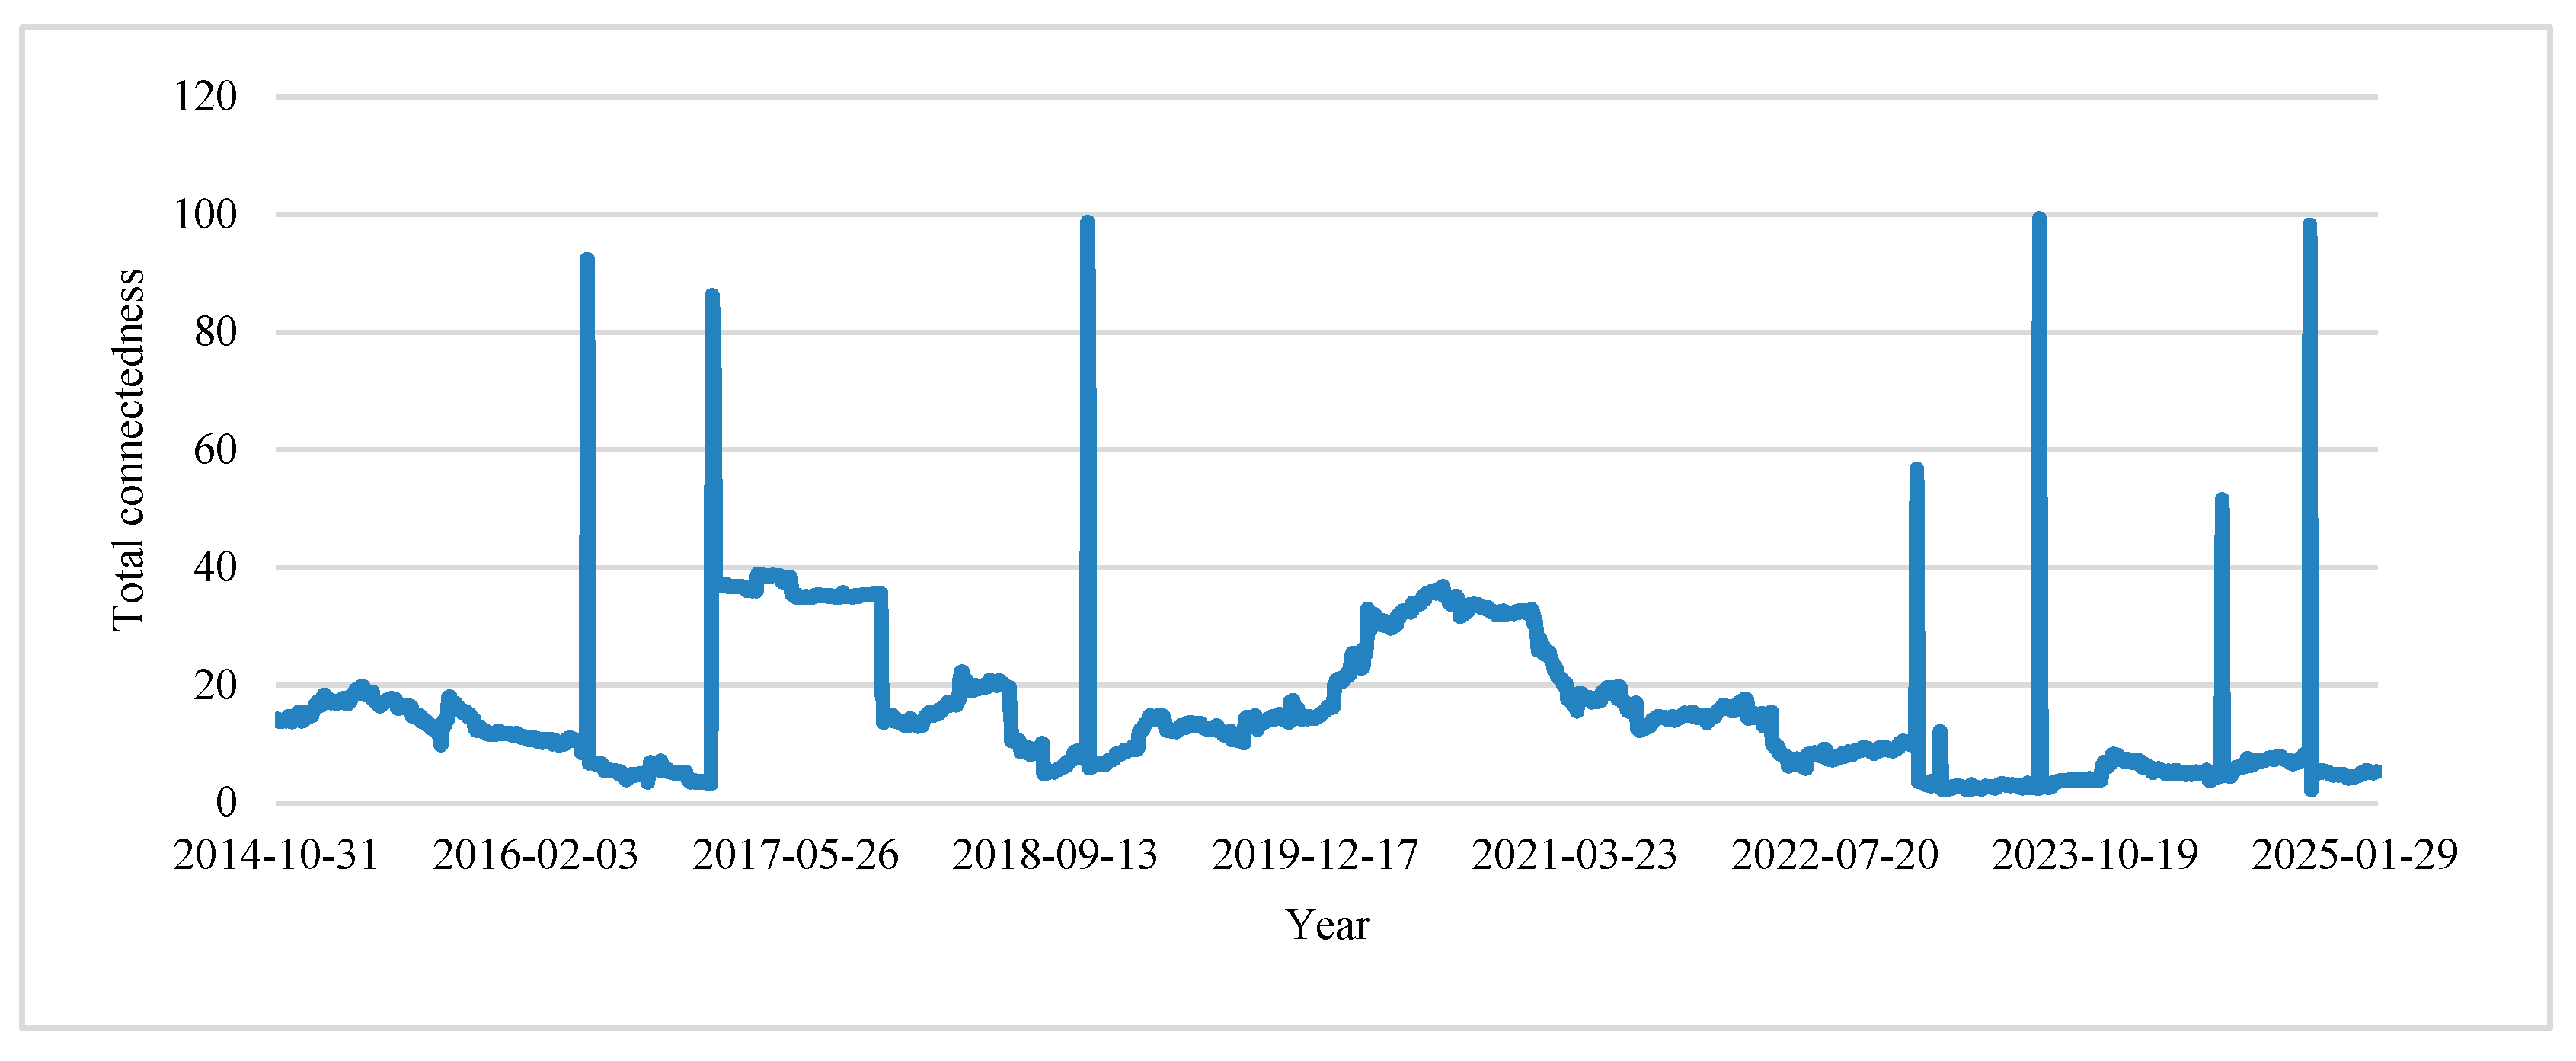
The time-varying total connectedness plot in Figure 1 illustrates the evolution of volatility spillovers among East African stock markets (NSE, RSE, DSE, USE) between 2015 and 2025. Based on the Diebold and Yılmaz (2014) framework, it tracks systemic interdependence and provides insight into structural risks. For much of the period, particularly in 2015–2016, 2022, and early 2024, connectedness remained below 20%, consistent with fragmented or segmented markets. These subdued levels of integration support the segmented market hypothesis (Peng et al. 2024), as poor liquidity, limited cross-listings, and thin trading volumes restricted volatility transmission in regional bourses (Musembi 2020; Yunvirusaba et al. 2019).
By contrast, distinct episodes of heightened spillovers were recorded in 2017, 2019–2021, and after 2024, when connectedness often exceeded 40% and peaked near 90%. These surges signal systemic stress linked to regional political instability, electoral uncertainty, and global disruptions such as the COVID-19 pandemic (Miku and Katunzi 2024; Nyangasi and Olukuru 2017). Such dynamics align with the AMH advanced by Lo and Zhang (2024), which highlights the evolving nature of efficiency under shifting macroeconomic and behavioural conditions. Comparable findings by Atenga and Mougoué (2021) attribute these asymmetric spillovers to institutional fragility, reinforcing the vulnerability of regional markets during shocks.
A period of persistent mid-level connectedness emerged between 2018 and 2021, with plateaus around 30–40%. This pattern reflects semi-integration, where volatility contagion becomes structurally embedded. The behaviour contradicts the Efficient Market Hypothesis (Fama 1960, 2021), as volatility spread was driven not only by fundamentals but also by behavioural and sentiment channels (Fei and Liu 2021; Kahneman and Tversky 2013). These clusters of volatility are consistent with Minsky’s Financial Instability Hypothesis (Minsky 1992), which argues that prolonged stability, such as in 2016 and 2022, often fosters risk accumulation. The resulting instability was evident in the crisis-laden spikes of 2017 and 2020.
Following 2022, connectedness reemerged at lower levels despite continuing global uncertainties, suggesting segmentation or lagged transmission. This behaviour supports Rigobon’s (2019) cautionary view that increases in correlations should not be hastily interpreted as contagion. The USE consistently maintained minimal outbound spillovers, reinforcing its peripheral role and limited integration, as noted by (Kamuhanda 2020; Yunvirusaba et al. 2019). In contrast, the NSE repeatedly acted as the dominant transmitter of volatility, particularly during spikes, consistent with (Ahmed and Huo 2018; El-Gayar et al. 2021). These studies attribute the NSE’s transmission role to its deeper liquidity, foreign investor concentration, and speculative capital flows.
Table 7 synthesises the roles of each market in the regional volatility network. The NSE clearly functions as the regional hub and dominant transmitter, consistently exporting more volatility than it receives, reflecting its deeper liquidity, broader investor base, and extensive cross-listings. The RSE exhibits a mixed role, acting as a net transmitter in long-run averages but reverting to a net receiver in short-run snapshots, suggesting that its influence is episodic and regime-dependent. The DSE is structurally a net receiver, absorbing more volatility than it transmits, consistent with Tanzania’s cautious financial openness and segmented capital flows. The USE emerges as a passive absorber, receiving substantial spillovers while exerting minimal influence on neighbouring markets, a pattern consistent with its thin trading and limited foreign participation.

4.4. Discussion

This study set out to disentangle volatility spillovers, system-wide connectedness, and contagion in East African equity markets by integrating ARMA–GARCH diagnostics, ADCC–GARCH conditional correlations, and the Diebold–Yilmaz connectedness framework. The results reveal a layered and regime-dependent structure of interdependence, characterised by segmentation under normal conditions and temporary synchronisation during periods of systemic stress. As shown in Table 1, volatility persistence is uniformly high across markets, reflecting frontier-market microstructure features. Meanwhile, ADCC–GARCH estimates in Table 2 and Table 3 indicate weak but unstable short-run correlations, whereas the Diebold–Yilmaz spillover measures in Table 4, Table 5 and Table 6 and Figure 1 demonstrate that system-wide connectedness rises sharply only during crisis episodes.
At the baseline level, ARMA–GARCH diagnostics confirm that volatility dynamics in East African markets may be primarily shaped by structural features such as illiquidity, thin trading, and delayed information absorption. High volatility persistence across markets reflects frontier-market microstructure rather than excessive cross-market dependence. During these tranquil periods, both ADCC–GARCH conditional correlations and Diebold–Yilmaz connectedness indices remain low, indicating weak spillovers and limited system-wide integration. This pattern supports the segmented market hypothesis, suggesting that East African equity markets operate largely independently in the absence of major shocks.
The ADCC–GARCH results further demonstrate that conditional correlations are generally weak, unstable, and occasionally negative, reinforcing the absence of persistent integration. Importantly, these correlations exhibit episodic surges rather than sustained increases, particularly during periods of regional or global stress. Such behaviour reflects co-movement, not contagion per se. Consistent with the AMH, correlations strengthen temporarily as investors adapt to changing risk environments and weaken once shocks dissipate.
The Diebold–Yilmaz framework adds a system-wide perspective by aggregating bilateral spillovers into measures of connectedness. Average connectedness remains low over most of the sample period, confirming that spillovers do not translate into enduring regional integration. However, sharp spikes in connectedness are observed during crisis episodes, including election-related uncertainty, the COVID-19 pandemic, and periods of heightened geopolitical risk. These abnormal increases, relative to tranquil baselines, are interpreted as contagion, defined not by the presence of spillovers alone, but by their temporary amplification beyond normal interdependence.
Within this structure, markets play distinct and time-varying roles. The NSE consistently emerges as the dominant transmitter of volatility spillovers, reflecting its superior market quality and extensive cross-listing activity. By contrast, the USE functions largely as a shock absorber, receiving volatility from regional peers while transmitting little outward, consistent with its shallow depth and limited foreign participation. The RSE and DSE occupy intermediate positions, occasionally acting as net transmitters in long-run averages but reverting to net receivers during short-run stress episodes. These shifting roles highlight that spillover leadership in frontier markets is not solely determined by size but is also shaped by behavioural forces, speculative flows, and institutional fragility.
Taken together, the findings indicate that spillovers identify directional transmission, connectedness captures the degree of system-wide interdependence, and contagion arises only when these linkages intensify abnormally during crises. East African equity markets, therefore, exhibit conditional segmentation: they remain loosely connected in normal times but become temporarily synchronised when exposed to shared shocks. This dual structure aligns with both the AMH and the Financial Instability Hypothesis, which emphasise that stability can conceal fragility and that integration is neither linear nor permanent in frontier financial systems.


5. Conclusions

This study integrates ARMA–GARCH diagnostics, ADCC–GARCH correlations, and Diebold–Yilmaz connectedness to assess volatility, co-movement, and spillovers in East African equity markets. The results reveal a dual structure: segmented under normal conditions but temporarily synchronised during stress. Unconditional correlations suggest growing long-run linkages, yet ADCC–GARCH shows weak, unstable short-run integration, with contagion emerging episodically in line with AMH.
Volatility persistence is uniformly high, reflecting frontier-market traits, thin liquidity, delayed information absorption, and microstructure jump consistent with Minsky’s Financial Instability Hypothesis. Spillover analysis highlights the NSE as the dominant transmitter, the USE as passive, and the RSE/DSE as shifting intermediaries, with connectedness spiking only during crises, underscoring episodic rather than structural integration.
The implications are clear: investors must adopt dynamic, regime-sensitive risk management as diversification benefits vanish in crises, while policymakers must pursue harmonised regulation, interoperable systems, and liquidity-enhancing reforms. Overall, East African markets remain stable yet segmented in calm periods, but fragile under shocks, requiring strategies that address both structural constraints and behavioural dynamics.

Author Contributions

Conceptualization, A.G.I., P.-F.M.; methodology, A.G.I., P.-F.M., H.T.M. and M.C.N.; software, A.G.I., P.-F.M., H.T.M. and M.C.N.; validation, P.-F.M., H.T.M. and M.C.N.; formal analysis, A.G.I.; investigation, A.G.I.; resources, P.-F.M., H.T.M. and M.C.N.; data curation, A.G.I.; writing—original draft preparation, A.G.I.; writing—review and editing, P.-F.M., H.T.M. and M.C.N.; visualisation, A.G.I., P.-F.M., H.T.M. and M.C.N.; supervision, P.-F.M., H.T.M. and M.C.N.; project administration, A.G.I., P.-F.M., H.T.M. and M.C.N.; funding acquisition, P.-F.M. All authors have read and agreed to the published version of the manuscript.

Funding

This research received no external funding.

Data Availability Statement

The raw data supporting the conclusions of this article will be made available by the authors on request.

Conflicts of Interest

The authors declare no conflicts of interest.

References

  1. Ahmed, Ali D., and Rui Huo. 2018. China-Africa financial markets linkages: Volatility and interdependence. Journal of Policy Modeling 40: 1140–64. [Google Scholar] [CrossRef] [Scilit]
  2. Ahmed, Sayed Farrukh, A. K. M. Mohsin, and Syed Far Abid Hossain. 2023. Relationship between FDI inflows and export performance: An empirical investigation by considering structural breaks. Economies 11: 73. [Google Scholar] [CrossRef] [Scilit]
  3. Analytica, Oxford. 2019. Rising nationalism will drive Tanzanian foreign policy. Emerald Expert Briefings, ahead-of-print. [CrossRef] [Scilit]
  4. Atenga, Eric Martial E., and Mbodja Mougoué. 2021. Return and volatility spillovers to African equity markets and their determinants. Empirical Economics 61: 883–918. [Google Scholar] [CrossRef] [Scilit]
  5. Bekaert, Geert, Michael Ehrmann, Marcel Fratzscher, and Arnaud Mehl. 2014. The global crisis and equity market contagion. The Journal of Finance 69: 2597–649. [Google Scholar] [CrossRef] [Scilit]
  6. Benos, Evangelos, Weilin Huang, Albert Menkveld, and Michalis Vasios. 2024. The cost of clearing fragmentation. Management Science 70: 3581–96. [Google Scholar] [CrossRef] [Scilit]
  7. Biau, Carol. 2018. Common Capital Market Infrastructure for East Africa: Options for the Way Forward. Washington, DC: Milken Institute. Available online: https://milkeninstitute.org/sites/default/files/reports-pdf/FINAL-Capital-Market-Infrastructure-in-East-Africa.pdf (accessed on 3 February 2026).
  8. Bloom, Nicholas. 2009. The impact of uncertainty shocks. Econometrica 77: 623–85. [Google Scholar] [CrossRef] [Scilit]
  9. Bonga-Bonga, Lumengo, and Mahlako P. Phume. 2022. Return and volatility spillovers between South African and Nigerian equity markets. African Journal of Economic and Management Studies 13: 205–18. [Google Scholar] [CrossRef] [Scilit]
  10. Bossman, Ahmed, Zaghum Umar, and Tamara Teplova. 2022. Modelling the asymmetric effect of COVID-19 on REIT returns: A quantile-on-quantile regression analysis. Scientific African 16: e01153. [Google Scholar] [CrossRef] [Scilit]
  11. Brooks, Chris. 2019. Introductory Econometrics for Finance, 4th ed. Cambridge, MA: Cambridge University Press. [Google Scholar] [CrossRef] [Scilit]
  12. Caldara, Dario, and Matteo Iacoviello. 2022. Measuring geopolitical risk. American Economic Review 112: 1194–225. [Google Scholar] [CrossRef] [Scilit]
  13. Campbell, John Y., Andrew W. Lo, Archie Craig MacKinlay, and Robert F. Whitelaw. 1998. The Econometrics of Financial Markets. Princeton: Princeton University Press. [Google Scholar] [CrossRef] [Scilit]
  14. Cappiello, Lorenzo, Robert F. Engle, and Kevin Sheppard. 2006. Asymmetric dynamics in the correlations of global equity and bond returns. Journal of Financial Econometrics 4: 537–72. [Google Scholar] [CrossRef] [Scilit]
  15. Chordia, Tarun, Richard Roll, and Avanidhar Subrahmanyam. 2008. Liquidity and market efficiency. Journal of Financial Economics 87: 249–68. [Google Scholar] [CrossRef] [Scilit]
  16. Claessens, Stijn. 2019. Fragmentation in Global Financial Markets: Good or Bad for Financial Stability? Unpublished manuscript.
  17. Diebold, Francis X., and Kamil Yılmaz. 2012. Better to give than to receive: Predictive directional measurement of volatility spillovers. International Journal of Forecasting 28: 57–66. [Google Scholar] [CrossRef] [Scilit]
  18. Diebold, Francis X., and Kamil Yılmaz. 2014. On the network topology of variance decompositions: Measuring the connectedness of financial firms. Journal of Econometrics 182: 119–34. [Google Scholar] [CrossRef] [Scilit]
  19. Easley, David, and Maureen O’Hara. 1987. Price, trade size, and information in securities markets. Journal of Financial Economics 19: 69–90. [Google Scholar] [CrossRef] [Scilit]
  20. El-Gayar, Ahmed, Ibrahim El-Hayes, and Sami Metawa. 2021. The impact of investor sentiment on stock market liquidity: The mediating role of investor herding behavior—An empirical study on the Egyptian Stock Exchange. American Journal of Business and Operations Research 5: 33–46. [Google Scholar] [CrossRef] [Scilit]
  21. Enders, Walter. 2012. Applied Econometric Time Series, 3rd ed. Hoboken: Wiley. [Google Scholar]
  22. Engle, Robert F. 1982. Autoregressive conditional heteroskedasticity with estimates of the variance of United Kingdom inflation. Econometrica 50: 987–1007. [Google Scholar] [CrossRef] [Scilit]
  23. Engle, Robert F., and Tim Bollerslev. 1986. Modelling the persistence of conditional variances. Econometric Reviews 5: 1–50. [Google Scholar] [CrossRef] [Scilit]
  24. Fama, Eugene F. 1960. Efficient Market Hypothesis. Ph.D. thesis, University of Chicago, Chicago, IL, USA. [Google Scholar]
  25. Fama, Eugene F. 2021. Market efficiency, long-term returns, and behavioral finance. Journal of Financial Economics 141: 543–59. [Google Scholar] [CrossRef] [Scilit]
  26. Fei, Teng, and Xiaoquan Liu. 2021. Herding and market volatility. International Review of Financial Analysis 78: 101880. [Google Scholar] [CrossRef] [Scilit]
  27. Ferreira, João J., Sérgio Gomes, João M. Lopes, and Justin Zuopeng Zhang. 2023. Ticking time bombs: The MENA and SSA regions’ geopolitical risks. Resources Policy 85: 103938. [Google Scholar] [CrossRef] [Scilit]
  28. Githaiga, Peter N., and Justus K. Kosgei. 2023. Board characteristics and sustainability reporting: A case of listed firms in East Africa. Corporate Governance: The International Journal of Business in Society 23: 3–17. [Google Scholar] [CrossRef] [Scilit]
  29. Gupta, Shalini, and Meenal Shrivastava. 2022. Herding and loss aversion in stock markets: Mediating role of fear of missing out (FOMO) in retail investors. International Journal of Emerging Markets 17: 1720–37. [Google Scholar] [CrossRef] [Scilit]
  30. Hamao, Yasushi, Ronald W. Masulis, and Victor Ng. 1990. Correlations in price changes and volatility across international stock markets. The Review of Financial Studies 3: 281–307. [Google Scholar] [CrossRef] [Scilit]
  31. Hearn, Bruce. 2009. Liquidity and valuation in East African securities markets. South African Journal of Economics 77: 553–76. [Google Scholar] [CrossRef] [Scilit]
  32. Hu, Zinan, and Sumuya Borjigin. 2024. The amplifying role of geopolitical risks, economic policy uncertainty, and climate risks on energy-stock market volatility spillover across economic cycles. North American Journal of Economics and Finance 71: 102114. [Google Scholar] [CrossRef] [Scilit]
  33. Huang, Shihao, Mariia Gubareva, Tamara Teplova, and Ahmed Bossman. 2024. African forex markets: Modeling their predictability and the asymmetric effects of oil and geopolitical risk. Energy Economics 131: 107679. [Google Scholar] [CrossRef] [Scilit]
  34. Kahneman, Daniel, and Amos Tversky. 2013. Prospect theory: An analysis of decision under risk. In Handbook of the Fundamentals of Financial Decision Making: Part I. Singapore: World Scientific, pp. 99–127. [Google Scholar] [CrossRef] [Scilit]
  35. Kamazima, Baraka K., and John K. Omurwa. 2018. The determinants of emerging financial markets development: A case study of the Dar es Salaam Stock Exchange, Tanzania. European Journal of Business and Management 10: 92–108. [Google Scholar]
  36. Kamuhanda, Robert. 2020. Determinants of Capital Market Performance in Uganda: A Case of Uganda Securities Exchange (USE). Master’s thesis, Makerere University, Kampala, Uganda. [Google Scholar]
  37. Katzke, Nico. 2013. South African Sector Return Correlations: Using DCC and ADCC Multivariate GARCH Techniques to Uncover the Underlying Dynamics. Working Paper. Pretoria: University of Pretoria. [Google Scholar]
  38. Kengere, Herman A. 2023. Modelling the leverage effect and volatility persistence in the East African securities exchanges during global shocks. European Journal of Economic and Financial Research 7: 99–126. [Google Scholar] [CrossRef] [Scilit]
  39. Klinger, Gretchen D., John Adams, and Kevin Howley. 2022. Telling stories: Interrogating ‘irrational exuberance’. In Money Talks: Alan Greenspan’s Free Market Rhetoric and the Tragic Legacy of Reaganomics. Berlin/Heidelberg: Springer, pp. 77–192. [Google Scholar] [CrossRef] [Scilit]
  40. Koepke, Robin. 2019. What drives capital flows to emerging markets? A survey of the empirical literature. Journal of Economic Surveys 33: 516–40. [Google Scholar] [CrossRef] [Scilit]
  41. Kunjal, Damien. 2023. Does geopolitical risk matter for ETF flows in emerging markets? Finance, Accounting and Business Analysis 5: 102–12. Available online: https://faba.bg/index.php/faba/article/view/169 (accessed on 3 February 2026).
  42. Kuttu, Saint. 2018. Asymmetric mean reversion and volatility in African real exchange rates. Journal of Economics and Finance 42: 575–90. [Google Scholar] [CrossRef] [Scilit]
  43. Kyle, Albert S. 1985. Continuous auctions and insider trading. Econometrica 53: 1315–35. [Google Scholar] [CrossRef] [Scilit]
  44. Liu, Teng, and Xu Gong. 2020. Analyzing time-varying volatility spillovers between the crude oil markets using a new method. Energy Economics 87: 104711. [Google Scholar] [CrossRef] [Scilit]
  45. Lo, Andrew W. 2004. The adaptive markets hypothesis: Market efficiency from an evolutionary perspective. Journal of Portfolio Management, Forthcoming 30: 15–29. [Google Scholar] [CrossRef] [Scilit]
  46. Lo, Andrew W., and Ruixun Zhang. 2024. The Adaptive Markets Hypothesis: An Evolutionary Approach to Understanding Financial System Dynamics. Oxford: Oxford University Press. [Google Scholar] [CrossRef] [Scilit]
  47. Logogye, Livingstone, Godfred Aawaar, and Kofi Poku. 2024. Regional and global shock spillovers to Africa’s equity markets: Evidence from the global financial crisis and COVID-19 pandemic. SN Business and Economics 4: 166. [Google Scholar] [CrossRef] [Scilit]
  48. Makau, Stephen M., Samuel O. Onyuma, Alex N. Okumu, Olweny Samuel, and Ndege Agatha. 2015. Impact of cross-border listing on stock liquidity: Evidence from East African Community. Journal of Finance and Accounting 3: 10–18. [Google Scholar] [CrossRef] [Scilit]
  49. Miku, Bilal G., and Tabither M. Katunzi. 2024. Does leveraging international financial flows a key driver for growth in East Africa region? Advanced Research In Economics and Business Strategy Journal 5: 74–86. [Google Scholar] [CrossRef] [Scilit]
  50. Minsky, Hyman P. 1992. The Financial Instability Hypothesis. Working Paper No. 74. Annandale-on-Hudson: Levy Economics Institute of Bard College: Available online: https://hdl.handle.net/10419/186760 (accessed on 3 January 2026).
  51. Mueller, Willard F., and John Culbertson. 1982. Economic hypotheses relating firm and market structure to firm R&D. In The Corporation in Modern Society. Edited by Willard F. Mueller. New York: Harcourt Brace Jovanovich, pp. 145–80. [Google Scholar]
  52. Muguto, Livingstone, and Paul-Francois Muzindutsi. 2022. A comparative analysis of the nature of stock return volatility in BRICS and G7 markets. Journal of Risk and Financial Management 15: 85. [Google Scholar] [CrossRef] [Scilit]
  53. Musembi, Michael M. 2020. Symmetric and asymmetric effect of investor sentiment on performance of equity market in Nairobi Securities Exchange, Kenya. International Journal of Management and Commerce Innovations 8: 438–47. [Google Scholar]
  54. Nyakurukwa, Kudzai, and Yudhvir Seetharam. 2023. Stock market integration in Africa: Further evidence from an information-theoretic framework. International Finance 26: 2–18. [Google Scholar] [CrossRef] [Scilit]
  55. Nyangasi, Christine M., and John Olukuru. 2017. Volatility spillover of the agriculture sector on the Nairobi Securities Exchange. Journal of Finance and Economics 5: 76–84. [Google Scholar]
  56. Ochieng, Christopher O. P., Felix K. Matanga, and Crispinous Iteyo. 2023. Causes and consequences of post-election violence in Kenya. African Journal of Empirical Research 4: 480–92. [Google Scholar] [CrossRef] [Scilit]
  57. Omayo, Victor. 2016. The effects of cross-border listing on volatility of returns on shares of companies cross-listed within East Africa. International Journal of Innovative Development 5: 154–66. [Google Scholar]
  58. Palley, Thomas I. 2009. The limits of Minsky’s financial instability hypothesis as an explanation of the crisis. Monthly Review 61: 11. [Google Scholar] [CrossRef] [Scilit]
  59. Peng, Ziyuan, Kai Xiong, and Yong Yang. 2024. Segmentation of the Chinese stock market: A review. Journal of Economic Surveys 38: 1156–98. [Google Scholar] [CrossRef] [Scilit]
  60. Rigobon, Roberto. 2019. Contagion, spillover, and interdependence. Economía 19: 69–100. [Google Scholar] [CrossRef] [Scilit]
  61. Rosser, and J. Barkley, Jr. 2020. The Minsky moment as the revenge of entropy. Macroeconomic Dynamics 24: 7–23. [Google Scholar] [CrossRef] [Scilit]
  62. Shen, Yiran, Chang Liu, Xiaolei Sun, and Kun Guo. 2023. Investor sentiment and the Chinese new energy stock market: A risk-return perspective. International Review of Economics & Finance 84: 395–408. [Google Scholar] [CrossRef] [Scilit]
  63. Tsay, Ruey S. 2005. Analysis of Financial Time Series. Hoboken: John Wiley and Sons. [Google Scholar] [CrossRef] [Scilit]
  64. Uhunmwangho, Monday, and Osazee Godwin Omorokunwa. 2022. Volatility, liquidity and stock market returns. Journal of Academic Research in Economics 14: 365–76. [Google Scholar]
  65. Umar, Zaghum, Ahmed Bossman, Sun-Yong Choi, and Tamara Teplova. 2022. Does geopolitical risk matter for global asset returns? Evidence from quantile-on-quantile regression. Finance Research Letters 48: 102991. [Google Scholar] [CrossRef] [Scilit]
  66. Wang, Wenzhao. 2024. Investor sentiment and stock market returns: A story of night and day. The European Journal of Finance, 1–33. [Google Scholar] [CrossRef] [Scilit]
  67. Wasonga, Omollo O., and Amos K. Osiemo. 2023. Impact of electronic tax system implementation on efficient revenue collection in Rwanda: A study of Rwanda Revenue Authority Gasabo District. Journal of Finance and Accounting 7: 1–15. [Google Scholar] [CrossRef] [Scilit]
  68. Yabara, Masafumi M. 2012. Capital Market Integration: Progress Ahead of the East African Community Monetary Union. Washington: International Monetary Fund. [Google Scholar] [CrossRef] [Scilit]
  69. Yunvirusaba, Niyonzima, Josiah Aduda, and Anthony Kube. 2019. Volatility spillover effects among securities exchanges in East Africa. International Journal of Economics and Finance 11: 32–41. [Google Scholar] [CrossRef] [Scilit]
  70. Zaimovic, Azra, Almir Omanovic, and Almira Arnaut-Berilo. 2021. How many stocks are sufficient for equity portfolio diversification? Journal of Risk and Financial Management 14: 551. [Google Scholar] [CrossRef] [Scilit]
  71. Zhang, Min Z. 2021. Stock Returns and Inflation Redux: An Explanation from Monetary Policy in Advanced and Emerging Markets. Washington: International Monetary Fund. [Google Scholar] [CrossRef] [Scilit]
Figure 1. Total connectedness index. Source: Author’s estimation (2025).
Risks 14 00052 g001
Table 1. Diagnostic tests and outlier robustness tests.
MarketOutliers (|z| > 3)ARMA(p,q)Persistence (α + β)Winsorized PersistenceLjung–Box p-Value (Residuals)Ljung–Box p-Value (Sq Residuals)Jarque–Bera p-ValuesARCH-LM p-Value
NSE2(0,1)0.8080.88931101
DSE14(0,1)0.9990.9990.99550.995501
RSE52(2,3)0.68310.59211101
USE4(0,1)0.68080.99690.99990.999901
Source author’s estimate (2025 Note:) JB p-values reported as 0.000 reflect values smaller than 1 × 10⁻¹⁶ and are rounded to zero by statistical software; they do not imply literal zero probability.
Table 2. Conditional correlation matrix.
NSEDSERSEUSE
NSE10.6970.7910.79
DSE0.69710.3740.373
RSE0.7910.37411
USE0.790.37311
Source author’s estimate (2025).
Table 3. Co-movement amongst East African stock markets.
Market Pairθ1θ2ɣ ρ - (μ)ρ (max)ρ (min)ρ (σ)
NSE—DSE0.0097750.8531450.002950.03537 **0.11394–0.029550.02000
NSE—RSE0.0097750.8531450.00295–0.01835 **0.06875–0.139570.02045
NSE—USE0.0097750.8531450.002950.03032 **0.13193–0.038450.02096
DSE—RSE0.0097750.8531450.002950.03795 **0.14491–0.023130.02239
DSE—USE0.0097750.8531450.00295–0.01663 **0.04262–0.089380.01969
RSE—USE0.0097750.8531450.002950.02223 **0.10756–0.047360.02088
Source authors estimate (2025). Notes: Significance levels are denoted as follows: * p < 0.10, ** p < 0.05, *** p < 0.01.
Table 4. Average dynamic connectedness output.
NSERSEDSEUSEFROM
NSE93.341.912.722.036.66
RSE1.8494.332.601.245.67
DSE3.702.5490.433.339.57
USE9.448.635.0776.8623.14
TO14.9713.0910.396.6045.04
Inc. Own108.31107.41100.8283.46cTCI/TCI
Net8.317.410.82−16.5415.01/11.26
NPT2.002.002.000.00
Source: Author’s estimation (2025).
Table 5. To, From, and Net volatility spillovers for East African Stock Markets.
MarketVolatility Spillovers
FromToNet
NSE4.12587.19623.0704
RSE5.12552.9389−2.1866
DSE6.08603.7025−2.3835
USE0.47881.97851.4997
Source: Author’s estimate (2025).
Table 6. Volatility connectedness among East African stock markets.
NSERSEDSEUSE
NSE100.03.8835.5862.117
RSE3.883100.04.2810.163
DSE5.5864.281100.00.214
USE2.1190.1630.214100.0
Source: Author’s estimation (2025).
Table 7. Roles of East African markets in regional volatility transmission.
MarketRoleJustification
NSENet transmitter (Hub)Consistently positive net spillovers in Table 5 and Table 6; dominant “TO” flows; strongest pairwise spillovers to DSE and RSE; deeper liquidity and cross-listings.
RSEMixed/episodic transmitterLong-run net transmitter in Table 5 but short-run net receiver in Table 6; role varies by regime and is linked to cross-listings and speculative flows.
DSENet receiver (structural)Higher “FROM” than “TO” in both tables; cautious financial openness limits outward spillovers.
USEPassive absorber (peripheral market)Very high “FROM” in the long run (Table 5) and minimal influence on others; thin trading and low liquidity.
Source: Author’s estimation (2025), based on Diebold–Yilmaz connectedness results.
Disclaimer/Publisher’s Note: The statements, opinions and data contained in all publications are solely those of the individual author(s) and contributor(s) and not of MDPI and/or the editor(s). MDPI and/or the editor(s) disclaim responsibility for any injury to people or property resulting from any ideas, methods, instructions or products referred to in the content.